March 16, 2015 15:31 Geophysical Journal International ggv099 5 10 15 20 25 30 35 40 45 50 55 60 67 72 77 82 87 92 97 102 107 112 117 122 Geophys. J. Int. (2015) doi: 10.1093/gji/ggv099 GJI Seismology Heterogeneous seismic anisotropy in the transition zone and uppermost lower mantle: evidence from South America, Izu-Bonin and Japan Q1 Colton Lynner and Maureen D. Long Department of Geology and Geophysics, Yale University, New Haven, CT 06511, USA. E-mail: [email protected]Accepted 2015 February 24. Received 2015 February 23; in original form 2014 December 20 SUMMARY Measurements of seismic anisotropy are commonly used to constrain deformation in the upper mantle. Observations of anisotropy at mid-mantle depths are, however, relatively sparse. In this study we probe the anisotropic structure of the mid-mantle (transition zone and uppermost lower mantle) beneath the Japan, Izu-Bonin and South America subduction systems. We present source-side shear wave splitting measurements for direct teleseismic S phases from earthquakes deeper than 300 km that have been corrected for the effects of upper mantle anisotropy beneath the receiver. In each region, we observe consistent splitting with delay times as large as 1 s, indicating the presence of anisotropy at mid-mantle depths. Clear splitting of phases originating from depths as great as ∼600 km argues for a contribution from anisotropy in the uppermost lower mantle as well as the transition zone. Beneath Japan, fast splitting directions are perpendicular or oblique to the slab strike and do not appear to depend on the propagation direction of the waves. Beneath South America and Izu-Bonin, splitting directions vary from trench-parallel to trench-perpendicular and have an azimuthal dependence, indicating lateral heterogeneity. Our results provide evidence for the presence of laterally variable anisotropy and are indicative of variable deformation and dynamics at mid-mantle depths in the vicinity of subducting slabs. Key words: Mantle processes; Seismic anisotropy; Dynamics of lithosphere and mantle; Pacific Ocean; South America. INTRODUCTION The transition zone is characterized by global seismic discontinu- ities in the mantle at 410 and 660 km depth (e.g. Dziewonski & Anderson 1981; Helffrich 2000). The dominant mineral phases are wadsleyite in the upper transition zone (between 410 and 520 km) and ringwoodite in the lower transition zone (between 520 and 660 km). Below the 660 km discontinuity lies the lower mantle, whose dominant mineral phase is (Mg, Fe)SiO 3 perovskite, or bridg- manite (e.g. Bina & Wood 1987; Katsura & Ito 1989; Shearer 1990; Ita & Stixrude 1992; Tschauner et al. 2014). Globally, there is mixed evidence for the presence of seismic anisotropy at mid-mantle depths (transition zone and uppermost lower mantle), with some studies arguing for little to no anisotropy (e.g. Fischer & Wiens 1996; Kaneshima 2014), globally present anisotropy (Trampert & van Heijst 2002) or anisotropy only in the upper transition zone (e.g. Fouch & Fischer 1996; Fischer et al. 1998). In the vicinity of subducting slabs, evidence for anisotropy at mid-mantle depths from studies of shear wave splitting is accumulating (e.g. Wookey et al. 2002; Wookey & Kendall 2004; Foley & Long 2011; Di Leo et al. 2012; Lynner & Long 2014). Measurements of seismic anisotropy offer relatively direct con- straints on patterns of deformation in the mantle (e.g. Savage 1999; Long & Silver 2009). Seismic anisotropy arises from the alignment of anisotropic minerals when deformed via dislocation creep, devel- oping a lattice preferred orientation, or LPO (e.g. Karato et al. 2008). Most shear wave splitting studies focus on the upper mantle, where olivine is the dominant anisotropic mineral and the relationships be- tween strain and anisotropy are relatively well known (Karato et al. 2008). In deeper regions of the mantle, the relationship between strain and the resulting anisotropy is poorly understood. Despite this limitation, measurements of anisotropy at mid-mantle depths have the potential to offer significant insights into deep mantle dy- namics. Recently, progress has been made on several fronts in examining and interpreting mid-mantle anisotropy. Mineral physics experi- ments have shown that wadsleyite and ringwoodite are anisotropic (e.g. Mainprice 2007; Tommasi et al. 2004) and that wadsleyite can develop LPO and contribute to seismic anisotropy (Kawazoe et al. 2013). A recent geodynamical study by Faccenda (2014) suggested that the strains associated with subduction in the uppermost lower mantle are sufficiently large to align perovskite grains resulting C The Authors 2015. Published by Oxford University Press on behalf of The Royal Astronomical Society. 1
Transcript
March 16, 2015 15:31 Geophysical Journal International ggv099
5
10
15
20
25
30
35
40
45
50
55
60
67
72
77
82
87
92
97
102
107
112
117
122
Geophys. J. Int. (2015) doi: 10.1093/gji/ggv099
GJI Seismology
Heterogeneous seismic anisotropy in the transition zone anduppermost lower mantle: evidence from South America, Izu-Boninand JapanQ1
Colton Lynner and Maureen D. LongDepartment of Geology and Geophysics, Yale University, New Haven, CT 06511, USA. E-mail: [email protected]
Accepted 2015 February 24. Received 2015 February 23; in original form 2014 December 20
S U M M A R YMeasurements of seismic anisotropy are commonly used to constrain deformation in the uppermantle. Observations of anisotropy at mid-mantle depths are, however, relatively sparse. Inthis study we probe the anisotropic structure of the mid-mantle (transition zone and uppermostlower mantle) beneath the Japan, Izu-Bonin and South America subduction systems. Wepresent source-side shear wave splitting measurements for direct teleseismic S phases fromearthquakes deeper than 300 km that have been corrected for the effects of upper mantleanisotropy beneath the receiver. In each region, we observe consistent splitting with delaytimes as large as 1 s, indicating the presence of anisotropy at mid-mantle depths. Clearsplitting of phases originating from depths as great as ∼600 km argues for a contributionfrom anisotropy in the uppermost lower mantle as well as the transition zone. Beneath Japan,fast splitting directions are perpendicular or oblique to the slab strike and do not appear todepend on the propagation direction of the waves. Beneath South America and Izu-Bonin,splitting directions vary from trench-parallel to trench-perpendicular and have an azimuthaldependence, indicating lateral heterogeneity. Our results provide evidence for the presenceof laterally variable anisotropy and are indicative of variable deformation and dynamics atmid-mantle depths in the vicinity of subducting slabs.
Key words: Mantle processes; Seismic anisotropy; Dynamics of lithosphere and mantle;Pacific Ocean; South America.
I N T RO D U C T I O N
The transition zone is characterized by global seismic discontinu-ities in the mantle at 410 and 660 km depth (e.g. Dziewonski &Anderson 1981; Helffrich 2000). The dominant mineral phases arewadsleyite in the upper transition zone (between 410 and 520 km)and ringwoodite in the lower transition zone (between 520 and660 km). Below the 660 km discontinuity lies the lower mantle,whose dominant mineral phase is (Mg, Fe)SiO3 perovskite, or bridg-manite (e.g. Bina & Wood 1987; Katsura & Ito 1989; Shearer 1990;Ita & Stixrude 1992; Tschauner et al. 2014). Globally, there ismixed evidence for the presence of seismic anisotropy at mid-mantledepths (transition zone and uppermost lower mantle), with somestudies arguing for little to no anisotropy (e.g. Fischer & Wiens1996; Kaneshima 2014), globally present anisotropy (Trampert &van Heijst 2002) or anisotropy only in the upper transition zone(e.g. Fouch & Fischer 1996; Fischer et al. 1998). In the vicinityof subducting slabs, evidence for anisotropy at mid-mantle depthsfrom studies of shear wave splitting is accumulating (e.g. Wookeyet al. 2002; Wookey & Kendall 2004; Foley & Long 2011; Di Leoet al. 2012; Lynner & Long 2014).
Measurements of seismic anisotropy offer relatively direct con-straints on patterns of deformation in the mantle (e.g. Savage 1999;Long & Silver 2009). Seismic anisotropy arises from the alignmentof anisotropic minerals when deformed via dislocation creep, devel-oping a lattice preferred orientation, or LPO (e.g. Karato et al. 2008).Most shear wave splitting studies focus on the upper mantle, whereolivine is the dominant anisotropic mineral and the relationships be-tween strain and anisotropy are relatively well known (Karato et al.2008). In deeper regions of the mantle, the relationship betweenstrain and the resulting anisotropy is poorly understood. Despitethis limitation, measurements of anisotropy at mid-mantle depthshave the potential to offer significant insights into deep mantle dy-namics.
Recently, progress has been made on several fronts in examiningand interpreting mid-mantle anisotropy. Mineral physics experi-ments have shown that wadsleyite and ringwoodite are anisotropic(e.g. Mainprice 2007; Tommasi et al. 2004) and that wadsleyite candevelop LPO and contribute to seismic anisotropy (Kawazoe et al.2013). A recent geodynamical study by Faccenda (2014) suggestedthat the strains associated with subduction in the uppermost lowermantle are sufficiently large to align perovskite grains resulting
March 16, 2015 15:31 Geophysical Journal International ggv099
129
134
139
144
149
154
159
164
169
174
179
184
191
196
201
206
211
216
221
226
231
236
241
246
2 C. Lynner and M.D. Long
in anisotropy in the lower mantle. Numerical calculations of LPOdevelopment in polycrystalline MgSiO3 perovskite (bridgmanite)suggest that fast directions of shear wave splitting would gener-ally align with the direction of flow in the uppermost lower mantle(Mainprice et al. 2008). Observationally, several studies using thesource-side shear wave splitting technique have found evidence foranisotropy at mid-mantle depths (Chen & Brudzinski 2003; Wookey& Kendall 2004; Foley & Long 2011; Di Leo et al. 2012; Lynner &Long 2014).
A limitation of these previously published studies is that they relyon limited ray path coverage and therefore offer poor azimuthal sam-pling, leaving our understanding of mid-mantle anisotropy patternsincomplete. Here we examine source-side shear wave splitting forevents originating at transition zone depths beneath the Izu-Bonin,Japan and South American subduction systems. A primary goal is toexplore whether these regions exhibit systematic lateral and/or az-imuthal variations in splitting due to mid-mantle anisotropy, whichwould suggest laterally variable anisotropic structure. We there-fore target the northwest Pacific and South American subductionsystems, which both have abundant deep seismicity and excellentazimuthal coverage using seismic stations from global networks.
DATA A N D M E T H O D S
The source-side shear wave splitting technique uses direct S phasesto probe anisotropy near the seismic source by first removing anyeffect from upper mantle anisotropy beneath the seismic station(e.g. Vinnik & Kind 1993; Russo & Silver 1994). As in most shearwave splitting studies, we assume the bulk of the lower mantle awayfrom subducting slabs is isotropic as there should not be sufficientdeformation to yield LPO development (Meade et al. 1995) andtherefore attribute any splitting not accounted for by structure be-neath the receiver to anisotropy near the source (near the subductingslab). Following Lynner & Long (2013, 2014), we select stationslocated 40–80◦ from the source regions for analysis. We have ex-amined SK(K)S shear wave splitting patterns at each of the seismicstations used in this study to constrain receiver-side anisotropy.We restrict our analyses in this study to stations that exhibit sim-ple patterns of shear wave splitting with sufficient backazimuthalcoverage (at least two quadrants represented). Only stations char-acterized by null measurements (indicating an apparently isotropicupper mantle) or by consistent splitting (indicating a horizontal sin-gle layer of anisotropy) across a wide backazimuthal swath are usedin this study. Stations with insufficient backazimuthal coverage orcomplex splitting that varies with backazimuth are not used (fur-ther details of receiver-side anisotropy corrections can be found inLynner & Long 2014). This is a conservative approach that min-imizes potential errors due to inaccurate receiver-side correctionsthrough the selection of stations at which we are extremely confi-dent in our characterization of the receiver-side anisotropic signal.While this approach limits the number of stations we can use in thisstudy, our station distribution (Fig. 1 and Table S1) ensures goodazimuthal coverage beneath both the northwest Pacific and SouthAmerica (Fig. 1).
We selected earthquakes of magnitude Mw > 5.0 in both regions,restricting our analyses to events deeper than 300 km. Every seis-mogram was bandpass filtered between periods of 8 and 25 s; thisfilter is suitable for both the SK(K)S phases used to constrain thereceiver-side corrections and the direct S waves used in the source-side splitting technique. We measured splitting parameters usingSplitlab (Wustefeld et al. 2008). Each waveform was visually in-
0˚
0˚
60˚
60˚
120˚
120˚
180˚
180˚
−120˚
−120˚
−60˚
−60˚
0˚
0˚
−60˚ −60
0˚ 0˚
60˚ 60˚
Figure 1. Map of the stations, red triangles, used in this study. Blue andblack lines represent great circle paths connecting events and the stationsat which those events yielded results for the northwest Pacific and SouthAmerica, respectively.
spected to ensure good signal-to-noise ratios. At a few stations,we identified systematic polarization anomalies indicative of mis-alignments of the horizontal components (e.g. Tian et al. 2011) andcorrected for these misalignments (Table S1).
We employed both the eigenvalue-minimization and rotation-correlation methods to determine the splitting parameters (fast di-rection, φ, and delay time, δt). The use of multiple measurementtechniques ensures reliable results (e.g. Lynner & Long 2012). Weonly retained measurements for which results from the two meth-ods were consistent, taking into account the 2σ error spaces. Forsimplicity, in this paper we report measurements from the rotation-correlation method. We required 2σ errors for φ and δt to be lessthan ±25◦ and ±0.9 s, respectively. The non-weighted average er-rors in fast direction and delay time for the entire data set are 13.2◦
and 0.2 s, respectively. Null splitting measurements were classifiedas such based on linearity of S-wave particle motion after the effectsof receiver-side anisotropy had been removed. In addition to the newmeasurements presented here, we also include previously publishedresults from Japan (Lynner & Long 2014) made following the samecriteria listed above.
R E S U LT S
Non-null splitting measurements for the northwest Pacific and SouthAmerica are shown in Fig. 2; null splitting results are shown inFig. S1. All measurements are plotted in a geographical referenceframe relevant to the downgoing ray near the source. Beneath thenorthwest Pacific, the data set includes 113 null and 88 non-nullmeasurements from 83 events at 29 stations; of these, 21 splits werepreviously published by Lynner & Long (2014). Beneath SouthAmerica, we measured 68 split and 66 unsplit shear waves from 37events at 23 different stations. All measured splitting parameters,with their estimated errors, can be found in Table S2.
All regions examined in this study exhibit significant splittingfrom deep earthquakes, with average delay times of ∼1 s, as wellas many null measurements. We primarily focus our interpretationson the clearly split measurements. (The null measurements are gen-erally consistent with the observed fast splitting directions, in thattheir polarization directions often trend parallel or perpendicular tothe fast directions, but they generally exhibit more scatter.) BeneathJapan and the southern Kurile arc, fast splitting directions generally
March 16, 2015 15:31 Geophysical Journal International ggv099
253
258
263
268
273
278
283
288
293
298
303
308
315
320
325
330
335
340
345
350
355
360
365
370
Heterogeneous seismic anisotropy 3
130˚
130˚
140˚
140˚
150˚
150˚
30˚ 30˚
40˚ 40˚
50˚ 50˚
0 1 2 3 4
−80˚
−80˚
−70˚
−70˚
−60˚
−60˚
−30˚ −30˚
−20˚ −20˚
−10˚ −10˚
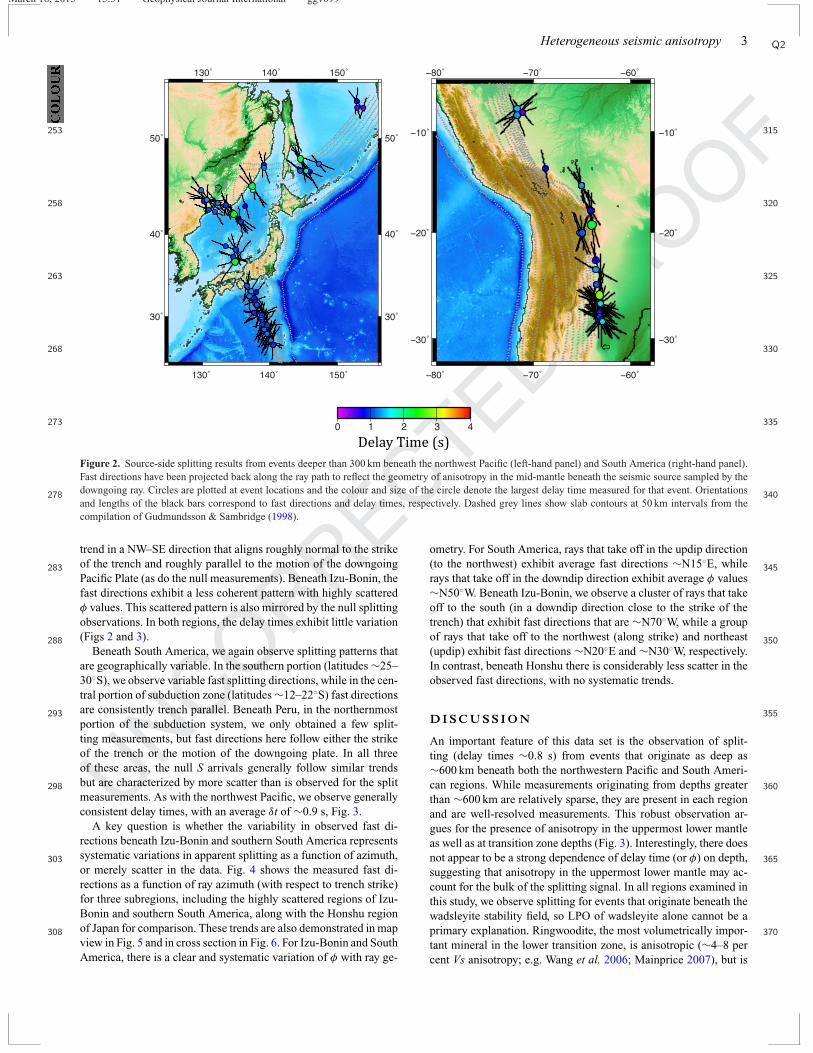
Figure 2. Source-side splitting results from events deeper than 300 km beneath the northwest Pacific (left-hand panel) and South America (right-hand panel).Fast directions have been projected back along the ray path to reflect the geometry of anisotropy in the mid-mantle beneath the seismic source sampled by thedowngoing ray. Circles are plotted at event locations and the colour and size of the circle denote the largest delay time measured for that event. Orientationsand lengths of the black bars correspond to fast directions and delay times, respectively. Dashed grey lines show slab contours at 50 km intervals from thecompilation of Gudmundsson & Sambridge (1998).
trend in a NW–SE direction that aligns roughly normal to the strikeof the trench and roughly parallel to the motion of the downgoingPacific Plate (as do the null measurements). Beneath Izu-Bonin, thefast directions exhibit a less coherent pattern with highly scatteredφ values. This scattered pattern is also mirrored by the null splittingobservations. In both regions, the delay times exhibit little variation(Figs 2 and 3).
Beneath South America, we again observe splitting patterns thatare geographically variable. In the southern portion (latitudes ∼25–30◦S), we observe variable fast splitting directions, while in the cen-tral portion of subduction zone (latitudes ∼12–22◦S) fast directionsare consistently trench parallel. Beneath Peru, in the northernmostportion of the subduction system, we only obtained a few split-ting measurements, but fast directions here follow either the strikeof the trench or the motion of the downgoing plate. In all threeof these areas, the null S arrivals generally follow similar trendsbut are characterized by more scatter than is observed for the splitmeasurements. As with the northwest Pacific, we observe generallyconsistent delay times, with an average δt of ∼0.9 s, Fig. 3.
A key question is whether the variability in observed fast di-rections beneath Izu-Bonin and southern South America representssystematic variations in apparent splitting as a function of azimuth,or merely scatter in the data. Fig. 4 shows the measured fast di-rections as a function of ray azimuth (with respect to trench strike)for three subregions, including the highly scattered regions of Izu-Bonin and southern South America, along with the Honshu regionof Japan for comparison. These trends are also demonstrated in mapview in Fig. 5 and in cross section in Fig. 6. For Izu-Bonin and SouthAmerica, there is a clear and systematic variation of φ with ray ge-
ometry. For South America, rays that take off in the updip direction
Q2
(to the northwest) exhibit average fast directions ∼N15◦E, whilerays that take off in the downdip direction exhibit average φ values∼N50◦W. Beneath Izu-Bonin, we observe a cluster of rays that takeoff to the south (in a downdip direction close to the strike of thetrench) that exhibit fast directions that are ∼N70◦W, while a groupof rays that take off to the northwest (along strike) and northeast(updip) exhibit fast directions ∼N20◦E and ∼N30◦W, respectively.In contrast, beneath Honshu there is considerably less scatter in theobserved fast directions, with no systematic trends.
D I S C U S S I O N
An important feature of this data set is the observation of split-ting (delay times ∼0.8 s) from events that originate as deep as∼600 km beneath both the northwestern Pacific and South Ameri-can regions. While measurements originating from depths greaterthan ∼600 km are relatively sparse, they are present in each regionand are well-resolved measurements. This robust observation ar-gues for the presence of anisotropy in the uppermost lower mantleas well as at transition zone depths (Fig. 3). Interestingly, there doesnot appear to be a strong dependence of delay time (or φ) on depth,suggesting that anisotropy in the uppermost lower mantle may ac-count for the bulk of the splitting signal. In all regions examined inthis study, we observe splitting for events that originate beneath thewadsleyite stability field, so LPO of wadsleyite alone cannot be aprimary explanation. Ringwoodite, the most volumetrically impor-tant mineral in the lower transition zone, is anisotropic (∼4–8 percent Vs anisotropy; e.g. Wang et al. 2006; Mainprice 2007), but is
March 16, 2015 15:31 Geophysical Journal International ggv099
Figure 3. Plots of delay time (top panels) and fast direction relative to the local strike of the trench (bottom panels) versus event depth for the northwesternPacific (left-hand panels, red) and South American (right-hand panels, blue) subduction systems. Error bars denote the 2σ errors associated with eachmeasurement.
120˚
120˚
135˚
135˚
150˚
150˚
30˚ 30˚
45˚ 45˚
−75˚
−75˚
−60˚
−60˚
−30˚ −30˚
−15˚ −15˚a)
b)c)
-180 -120 -60 0 60 120 180
Azimuth (°)
-180 -120 -60 0 60 120 180
Azimuth (°)
-180 -120 -60 0 60 120 180
-90
-45
04
59
0-9
0-4
50
45
90
-90
-45
04
59
0
Re
lati
ve
Fa
st
Dir
ec
tio
n
(° f
ro
m t
re
nc
h p
ara
lle
l)
Re
lati
ve
Fa
st
Dir
ec
tio
n
(° f
ro
m t
re
nc
h p
ara
lle
l)
Re
lati
ve
Fa
st
Dir
ec
tio
n
(° f
ro
m t
re
nc
h p
ara
lle
l)
Updip
UpdipUpdip
Downdip
Downdipa)
c)
b)Downdip
Figure 4. Plots of measured fast directions (diamonds) versus ray azimuth relative to local trench strike for source-side measurements made beneath Japan(a), southern South America (b) and southern Izu-Bonin (c), as shown in the inset map. The green diamond represents a fast direction plotted at its equivalentnegative value.
also an unlikely primary explanation for our observations, as eventsas deep as ∼600 km yield large delay times. Rays originating at∼600 km depth cannot sample enough transition zone material toaccrue the observed ∼0.8 s of splitting.
We therefore propose that the most likely mechanism for ourobservations is LPO of perovskite in the uppermost lower mantle(given that the volume fraction of MgO is only ∼10 per cent; e.g.,Mainprice 2007), perhaps with a small additional contribution from
March 16, 2015 15:31 Geophysical Journal International ggv099
501
506
511
516
521
526
531
536
541
546
551
556
563
568
573
578
583
588
593
598
603
608
613
618
Heterogeneous seismic anisotropy 5
135˚
135˚
150˚
150˚
15˚ 15˚
30˚ 30˚
120˚
120˚
130˚
130˚
140˚
140˚
150˚
150˚
30˚ 30˚
40˚ 40˚
50˚ 50˚
0 1 2 3 4
Fast Direction (°)
-90-60-30 0 30 60 90
−75˚ −60˚
−30˚
−15˚
−30˚
−15˚
−75˚ −60˚
Delay Time (s)
a) b)
c)
Figure 5. Plots of ray paths for measurements made beneath Japan (a), southern South America (b) and southern Izu-Bonin (c). Circles, black lines, and slabcontours are plotted following the same conventions as Fig. 2. Thick coloured lines represent ray paths of the different splitting measurements in each region asseen from above. The colours of the lines denote the measured fast direction associated with a given ray path, as shown in the legend at the bottom right-handside.
anisotropy in the transition zone. Perovskite is anisotropic at lowermantle pressures (∼10 per cent Vs anisotropy; Wentzcovitch et al.2004) and deviatoric stresses may be sufficient to deform the up-permost lower mantle around subducting slabs via dislocation creep(Cordier et al. 2004), thus generating LPO (Mainprice et al. 2008;Faccenda 2014).
While we suggest that LPO of MgSiO3 perovskite represents themost likely primary explanation for our observations, other min-eral phases, such as dense hydrous phases, may also play somerole in generating mid-mantle anisotropy (e.g. Rosa et al. 2013;Nowacki et al. 2014), but are unlikely as primary mechanisms forthe observed anisotropy. Phase D, a dense hydrous magnesium-silicate phase, is substantially more anisotropic (∼18 per cent Vsanisotropy) than perovskite and is stable throughout the upper lowermantle (Mainprice et al. 2007; Mainprice & Ildefonse 2009). PhaseD, however, should be confined to hydrated regions such as the rel-atively cool interiors of subducting slabs. If LPO of phase D (orany other source of anisotropy confined to the slab) was the primarysource of anisotropy in the mid-mantle, there should be a systematictrend in delay time with the amount of slab material being sampled,which is not observed (Fig. S2). If the anisotropy were confined
to subducting slabs, rays sampling large volumes of slab materialwould show larger delay times than those sampling little slab mate-rial (with some dependence on the orientation of anisotropy). Thiswould result in larger delay times for rays traveling in a downdipdirection than for those in an updip direction. Such a trend in delaytime is not observed in our data set, however. This lack of trendis particularly obvious beneath South America, where rays travel-ing to the east (in a downdip direction) sample long paths (100 sof km) of slab material, while those traveling to the northwest (inan updip direction) sample little slab material (<100 km). Despitethis difference in slab sampling, all rays exhibit similar delay times(Fig. 5 and Fig. S2) arguing against slab anisotropy as a primaryexplanation for our observations.
Another striking feature of this data set is the geographic vari-ability we observe in the geometry of mid-mantle anisotropy, bothbetween different subduction systems and within individual regions.Beneath Honshu and the central portion of South America, we ob-serve fast splitting directions that do not vary significantly withazimuth (Fig. 2), despite having similar azimuthal coverage as thevariable regions, Fig. 5. However, there is a pronounced differencein geometry between the two systems: beneath Honshu, φ values
March 16, 2015 15:31 Geophysical Journal International ggv099
625
630
635
640
645
650
655
660
665
670
675
680
687
692
697
702
707
712
717
722
727
732
737
742
6 C. Lynner and M.D. Long
b)a)
c)
Fast Direction (°)-90 -60 -30 0 30 60 90
-0.7 0.7dVp (%)
0
410
660
1500
0
410
660
1500
0
410
660
1500
Figure 6. Ray paths plotted on top of isotropic P velocity anomalies (as indicated by the colour bar) from the tomographic model of Li et al. (2008) for Japan(a), southern South America (b) and southern Izu-Bonin (c) Colours of the ray paths follow the same conventions at Fig. 5. Thick black lines represent the slabcontours from Gudmundsson & Sambridge (1998).
130˚
130˚
140˚
140˚
150˚
150˚
30˚ 30˚
40˚ 40˚
50˚ 50˚
−70˚
−70˚
−60˚
−60˚
−30˚ −30˚
−20˚ −20˚
−10˚ −10˚
0 1 2 3 4
Figure 7. Same as Fig. 2, except that source-side splitting results are plotted at 800 km (uppermost lower mantle) pierce points for each downgoing ray. Raypaths were calculated using TauP (Crotwell et al. 1999) with the isap91 earth model (Kennett & Engdahl 1991). Other plotting conventions are the same as inFig. 2.
tend to align with the motion of the downgoing plate, while beneathcentral South America, fast directions generally align with the strikeof the trench. Beneath Izu-Bonin and southern South America, thesystematic variability in observed fast directions as a function of rayazimuth (Figs 4–6) suggests laterally heterogeneous deformation inthe uppermost lower mantle within the subduction system. This
is illustrated further in Fig. 7, which shows the splitting observa-tions beneath both regions plotted at 800 km deep pierce points (inthe uppermost lower mantle) for each ray. When plotted using thisconvention, the variable splitting observations separate into distinctcoherent groups, supporting the notion that the primary source ofanisotropy is in the uppermost lower mantle and providing further
March 16, 2015 15:31 Geophysical Journal International ggv099
749
754
759
764
769
774
779
784
789
794
799
804
811
816
821
826
831
836
841
846
851
856
861
866
Heterogeneous seismic anisotropy 7
support to our interpretation of laterally heterogeneous mid-mantleanisotropy.
Beneath southern South America, rays that travel northwestwardshow roughly trench parallel fast directions (similar to the split-ting seen in the central portion of South America), but rays thatsample in an eastward (downdip) and southward direction (alongstrike) are marked by very different fast splitting directions (Figs5 and 6). When the observations are plotted at 800 km depth (Fig.7), the splitting measurements tend to group into regions of co-herent splitting. In the southernmost area, the splitting is trenchoblique (roughly paralleling the motion of the downgoing slab),while the rest of the southern and central South America showstrench parallel orientations. This heterogeneous splitting patternindicates laterally heterogeneous anisotropy beneath southernmostSouth America, likely indicating variable deformation geometry ofthe slab itself and/or the subslab mantle. Experimental constraintson the relationship between LPO development and mantle flow formid-mantle minerals are absent, but first-principles calculations ofthe glide systems of bridgmanite have been carried out (Mainpriceet al. 2008). This work suggests that the LPO of polycrystallinebridgmanite in the uppermost lower mantle would result in fastsplitting directions that roughly align with the direction of shear.This would suggest that in the southernmost region of South Amer-ica, mid-mantle deformation likely corresponds to 2-D entrainmentof the subslab lower mantle with the downgoing slab, while beneaththe rest of South America the observations are more consistent withtrench parallel flow.
Beneath Izu-Bonin, the splitting pattern is even more compli-cated, with rays traveling southward (downdip, nearly along strike)having a different φ than either those that head to the northeast(along strike) or northwest (updip), again indicating laterally vary-ing deformation beneath the slab. In this region, a possible scenariofor the geometry of mantle flow and deformation is different be-neath the portion of the slab that has stagnated atop the 660 kmdiscontinuity and the shallower portion where the slab is subduct-ing normally (Figs 6 and 7) arguing for variable subslab dynamics.The southernmost portion of Izu-Bonin is characterized by trench-parallel splitting and therefore (using the relationship between strainanisotropy for bridgmanite described above) trench parallel flow. Incontrast, the rest of the subduction zone is characterized by vari-able, largely trench-oblique fast orientations, consistent with vari-able deformation geometries beneath the slab. These inferences alsocontrast with observations beneath Japan, which suggest generallyentrained mantle flow beneath the subducting slab, despite the factthat both regions experience slab deflection atop the 660 km dis-continuity. As with southern South America, laterally varying de-formation of mid-mantle material beneath Izu-Bonin can accountfor the azimuthal variation in source-side splitting, while beneathJapan the dynamic regime appears to be simpler.
C O N C LU S I O N
Source-side shear wave splitting measurements for rays originat-ing below 350 km beneath the Japan/Kurile, Izu-Bonin, and SouthAmerica subduction systems reveal significant anisotropy (with ∼1s delay times) at mid-mantle depths. In combination with previouslypublished observations (Wookey et al. 2002; Chen & Brudzinski2003; Foley & Long 2011; Di Leo et al. 2012; Lynner & Long2014), our measurements suggest that mid-mantle anisotropy insubduction systems is likely a global feature. Furthermore, our ob-servation of consistent splitting with delay times ∼0.8 s for events
as deep as ∼600 km indicates the presence of anisotropy in the up-permost lower mantle as our observations cannot be explained onlyin terms of anisotropy at transition zone depths. A likely mecha-nism for anisotropy in the uppermost lower mantle is deformationin the dislocation creep regime at high deviatoric stresses inducedby slabs impinging on the high-viscosity lower mantle, resultingin LPO of MgSiO3 perovskite (Faccenda 2014). We observe gen-erally consistent delay times in all regions examined in this study,suggesting that the magnitude of mid-mantle anisotropy is uni-form. In contrast, we observe striking variations in measured fastsplitting directions, both between and within individual subductionsystems. Beneath southern South America and Izu-Bonin, we havedocumented systematic variations in φ with azimuth, while beneathcentral South America and Japan measured fast directions do notvary with azimuth. Our observations suggest that mid-mantle defor-mation is heterogeneous, indicating lateral variations in mid-mantledynamics beneath subducting slabs, especially beneath southernSouth America and Izu-Bonin. Our measurements suggest that sub-ducting slabs play an important role in deforming the surroundingmantle as they sink into the deeper portions of the mantle, and thatthe deformation patterns are heterogeneous both within and amongindividual subduction systems.
A C K N OW L E D G E M E N T S
This work was funded by NSF grant EAR-1150722. Figures wereprepared using Generic Mapping Tools (Wessel & Smith 1999). Q3
We used seismic data from Global Seismograph Network (II, IU),Global Telemetered Seismic Network (GT), United States NationalSeismic Network (US), Caltech Regional Seismic Network (CI),Alaska Regional Network (AK), Alaska Tsunami Warning SeismicSystem (AT), Czech Regional Seismic Network (CZ), CaribbeanNetwork (CU), NARS Array (NR), Polish Seismological Network(PL), German Regional Seismic Network (GR), Portuguese Na-tional Seismic Network (PM), Netherlands Seismic Network (NL),Canadian National Seismic Network (CN), Intermountain West(IW), Mednet (MN), Geoscope (G) and Geofon (GE) networks.All waveforms were downloaded from the Data Management Cen-ter (DMC) of the Incorporated Research Institutions for Seismology(IRIS).
R E F E R E N C E S
Bina, C.R. & Wood, B.J., 1987. Olivine–spinel transitions: experimental andthermodynamic constraints and implications for the nature of the 400-kmseismic discontinuity, J. geophys. Res., 92(B6), 4853–4866.
Chen, W.-P. & Brudzinski, M.R., 2003. Seismic anisotropy in the man-tle transition zone beneath Fiji-Tonga, Geophys. Res. Lett., 30, 1682,doi:10.1029/2002GL016330.
Cordier, P., Ungar, T., Zsoldos, L. & Tichy, G., 2004. Dislocation creep inMgSiO3 perovskite at conditions of the Earth’s uppermost lower mantle,Nature, 428(6985), 837–840.
Crotwell, H.P., Owens, T.J. & Ritsema, J., 1999. The TauP toolkit: flexibleseismic travel-time and ray-path utilities, Seismol. Res. Lett., 70, 154–160.
Di Leo, J.F., Wookey, J., Hammond, J.O.S., Kendall, J.-M., Kaneshima, S.,Inoue, H., Yamashina, T. & Harjadi, P., 2012. Mantle flow in regions ofcomplex tectonics: insights from Indonesia, Geochem. Geophys. Geosyst.,13, Q12008, doi:10.1029/2012GC004417.
Gudmundsson, O. & Sambridge, M., 1998. A regionalized upper mantle(RUM) seismic model, J. geophys. Res., 103, 7121–7136.
Helffrich, G., 2000. Topography of the transition zone seismic discontinu-ities, Rev. Geophys., 38(1), 141–158.
Ita, J. & Stixrude, L., 1992. Petrology, elasticity, and composition of themantle transition zone, J. geophys. Res., 97(B5), 6849–6866.
Kaneshima, S., 2014. Upper bounds of seismic anisotropy in the Tonga slabnear deep earthquake foci and in the lower mantle, Geophys. J. Int., 197,351–368.
Karato, S., Jung, H., Katayama, I. & Skemer, P., 2008. Geodynamic sig-nificance of seismic anisotropy of the upper mantle: new insights fromlaboratory studies, Annu. Rev. Earth planet Sci., 36, 59–95.
Katsura, T. & Ito, E., 1989. The system Mg2SiO4–Fe2SiO4 at high pressuresand temperatures: precise determination of stabilities of olivine, modifiedspinel, and spinel, J. geophys. Res., 94(B11), 15 663–15 670.
Kawazoe, T., Ohuchi, T., Nishihara, Y., Nishiyama, N., Fujino, K. &Irifune, T., 2013. Seismic anisotropy in the mantle transition zone in-duced by shear deformation of wadsleyite, Phys. Earth planet. Inter., 216,91–98.
Kennett, B.L.N. & Engdahl, E.R., 1991. Traveltimes for global earthquakelocation and phase identification, Geophys. J. Int., 105, 429–465.
Long, M.D. & Silver, P.G., 2009. Shear wave splitting and mantle anisotropy:measurements, interpretations, and new directions, Surv. Geophys., 30,407–461.
Lynner, C. & Long, M.D., 2012. Evaluating contributions to SKKS splittingfrom lower mantle anisotropy: a case study from station DBIC, CoteD’Ivoire, Bull. seism. Soc. Am., 102, 1030–1040.
Lynner, C. & Long, M.D., 2013. Sub-slab seismic anisotropy and mantleflow beneath the Caribbean and Scotia subduction zones: effects of slabmorphology and kinematics, Earth planet. Sci. Lett., 361, 367–378.
Lynner, C. & Long, M.D., 2014. Sub-slab anisotropy beneath the Sumatraand circum-Pacific subduction zones from source-side shear wave split-ting observations, Geochem. Geophys. Geosyst., 15, 2262–2281.
Mainprice, D., 2007. Seismic anisotropy of the deep Earth from a mineraland rock physics perspective, Treatise Geophys., 2, 437–491.
Mainprice, D. & Ildefonse, B., 2009. Seismic anisotropy of subduction zoneminerals–contribution of hydrous phases, in Subduction Zone Geodynam-ics, pp. 63–84, eds Lallemand, S. & Funiciello, F., Springer-Verlag.
Mainprice, D., LePage, Y., Rodgers, J. & Jouanna, P., 2007. Predicted elasticproperties of the hydrous D phase at mantle pressures: implications forthe anisotropy of subducted slabs near 670-km discontinuity and in thelower mantle, Earth planet. Sci. Lett., 259(3), 283–296.
Mainprice, D., Tommasi, A., Ferre, D., Carrez, P. & Cordier, P., 2008.Predicted glide systems and crystal preferred orientations of polycrys-talline silicate Mg-Perovskite at high pressure: implications for the seismicanisotropy in the lower mantle, Earth planet. Sci. Lett., 271(1), 135–144.
Meade, C., Silver, P.G. & Kaneshima, S., 1995. Laboratory and seismo-logical observations of lower mantle isotropy, Geophys. Res. Lett., 22,1293–1296.
Nowacki, A., Kendall, J.-M., Wookey, J. & Permberton, A., 2014. Transitionzone anisotropy beneath deep slabs and the transport of water into thelower mantle, in Proceeding of the AGU Fall Meeting, Abstract: DI41B-4333.
Rosa, A.D., Mezouar, M., Garbarino, G., Bouvier, P., Ghosh, S., Rohrbach,A. & Sanchez-Valle, C., 2013. Single-crystal equation of state of phaseD to lower mantle pressures and the effect of hydration on the buoyancyof deep subducted slabs, J. geophys. Res., 118, 6124–6133.
Russo, R.M. & Silver, P.G., 1994. Trench-parallel flow beneath the NazcaPlate from seismic anisotropy, Science, 263, 1105–1111.
Savage, M.K., 1999. Seismic anisotropy and mantle deformation: what havewe learned from shear wave splitting, Rev. Geophys., 37, 65–106.
Shearer, P.M., 1990. Seismic imaging of upper-mantle structure with newevidence for a 520-km discontinuity, Nature, 344(6262), 121–126.
Tian, X., Zhang, J., Si, S., Wang, J., Chen, Y. & Zhang, Z., 2011. SKS splittingmeasurements with horizontal component misalignment, Geophys. J. Int.,185, 329–340.
Tommasi, A., Mainprice, D., Cordier, P., Thoraval, C. & Couvy, H., 2004.Strain-induced seismic anisotropy of wadsleyite polycrystals and flowpatterns in the mantle transition zone, J. geophys. Res., 109, B12405,doi:10.1029/2004JB003158.
Trampert, J. & van Heijst, H.J., 2002. Global azimuthal anisotropy in thetransition zone, Science, 296(5571), 1297–1299.
Tschauner, O., Ma, C., Beckett, J.R., Prescher, C., Prakapenka, V.B. & Ross-man, G.R., 2014. Discovery of bridgmanite, the most abundant mineralin Earth, in a shocked meteorite, Science, 346(6213), 1100–1102.
Vinnik, L.P. & Kind, R., 1993. Ellipticity of teleseismic S-particle motion,Geophys. J. Int., 113(1), 165–174.
Wentzcovitch, R.M., Karki, B.B., Cococcioni, M. & de Gironcoli, S.,2004. Thermoelastic properties of MgSiO3 perovskite: insights on thenature of the Earth’s lower mantle, Phys. Rev. Lett., 92, 018501,doi:10.1103/PhysRevLett.92.018501.
Wessel, P. & Smith, W.H.F., 1999. Free software helps map and display data,EOS, Trans. Am. geophys. Un., 72, 441.
Wirth, E. & Long, M.D., 2010. Frequency-dependent shear wave splittingbeneath the Japan and Izu-Bonin subduction zones, Phys. Earth planet.Int., 181, 141–154. Q4
Wookey, J. & Kendall, J.-M., 2004. Evidence of mid-mantle anisotropyfrom shear wave splitting and the influence of shear- coupled P waves,J. geophys. Res., 109, B07309, doi:10.1029/2003JB002871.
Wustefeld, A., Bokelmann, G., Barruol, G. & Zaroli, C., 2008. Split-lab: a shear-wave splitting environment in Matlab, Comp. Geosci., 34,515–528.
S U P P O RT I N G I N F O R M AT I O N
Additional Supporting Information may be found in the online ver-sion of this paper:
Table S1. Q5
Table S2.Figure S1. Null splitting results from the northwest Pacific andSouth America. Circles are plotted at the event location. The barscorrespond to the two possible orientations, either the polarizationof the fast or the slow directions of anisotropy, of the null splitray calculated from the initial polarization of the incoming S wave.Nulls are plotted in relation to their orientation in the source-sidemantle.Figure S2. Delay time versus ray azimuth for measurements beneathJapan (a), South America (b) and Izu-Bonin (c). There is a lack ofazimuthal variation in delay time beneath South American and Izu-Bonin despite the azimuthal variation in fast direction (http://gji.oxfordjournals.org/lookup/suppl/doi:10.1093/gji/ggv099/-/DC1).
Please note: Oxford University Press is not responsible for the con-tent or functionality of any supporting materials supplied by theauthors. Any queries (other than missing material) should be di-rected to the corresponding author for the paper.