Page 1
This is a repository copy of Heteroprotein complex formation of bovine lactoferrin and pea protein isolate: A multiscale structural analysis.
White Rose Research Online URL for this paper:http://eprints.whiterose.ac.uk/110783/
Version: Accepted Version
Article:
Adal, E, Sadeghpour, A, Connell, S orcid.org/0000-0003-2500-5724 et al. (3 more authors)(2017) Heteroprotein complex formation of bovine lactoferrin and pea protein isolate: A multiscale structural analysis. Biomacromolecules, 18 (2). pp. 625-635. ISSN 1525-7797
https://doi.org/10.1021/acs.biomac.6b01857
© 2017, American Chemical Society. This document is the Accepted Manuscript version of a Published Work that appeared in final form in Biomacromolecules, copyright © American Chemical Society after peer review and technical editing by the publisher. To access the final edited and published work see https://doi.org/10.1021/acs.biomac.6b01857.
[email protected] ://eprints.whiterose.ac.uk/
Reuse
Unless indicated otherwise, fulltext items are protected by copyright with all rights reserved. The copyright exception in section 29 of the Copyright, Designs and Patents Act 1988 allows the making of a single copy solely for the purpose of non-commercial research or private study within the limits of fair dealing. The publisher or other rights-holder may allow further reproduction and re-use of this version - refer to the White Rose Research Online record for this item. Where records identify the publisher as the copyright holder, users can verify any specific terms of use on the publisher’s website.
Takedown
If you consider content in White Rose Research Online to be in breach of UK law, please notify us by emailing [email protected] including the URL of the record and the reason for the withdrawal request.
Page 2
1
Heteroprotein complex formation of bovine 1
lactoferrin and pea protein isolate: A multiscale 2
structural analysis 3
Eda Adal1,2, Amin Sadeghpour1, Simon Connell3, Michael Rappolt1, Esra Ibanoglu2, Anwesha 4
Sarkar1*. 5
1Food Colloids and Processing Group, School of Food Science and Nutrition, University of Leeds, 6
Leeds, LS2 9JT, United Kingdom, 7
2Gaziantep University, Food Engineering Department, 27310 Gaziantep, Turkey 8
3Molecular and Nanoscale Physics Group, School of Physics and Astronomy, University of 9
Leeds, Leeds, LS2 9JT, United Kingdom. 10
11
12
13
KEYWORDS. Lactoferrin, pea protein, complex coacervation, small angle X-ray scattering 14
(SAXS), atomic force microscopy (AFM). 15
16
Page 3
2
ABSTRACT 17
Associative electrostatic interactions between two oppositely charged globular proteins, lactoferrin 18
(LF) and pea protein isolate (PPI), the latter being a mixture of vicilin, legumin and convicilin, 19
was studied with a specific PPI/ LF molar ratio at room temperature. Structural aspects of the 20
electrostatic complexes probed at different length scales were investigated as a function of pH by 21
means of different complementary techniques, namely with dynamic light scattering, small angle 22
X-ray scattering (SAXS), turbidity measurements and atomic force microscopy (AFM). 23
Irrespective of the applied techniques, the results consistently displayed that complexation 24
between LF and PPI did occur. In an optimum narrow range of pH 5.0-5.8, a viscous liquid phase 25
of complex coacervate was obtained upon mild centrifugation of the turbid LF-PPI mixture with a 26
maximum Rh, turbidity and the こ-potential being close to zero observed at pH 5.4. In particular, 27
the SAXS data demonstrated that the coacervates were densely assembled with a roughly spherical 28
size distribution exhibiting a maximum extension of 80 nm at pH 5.4. Equally, AFM image 29
analysis showed size distributions containing most frequent cluster sizes around 40-80 nm with 30
spherical to elliptical shapes (axis aspect ratio ≤ 2) as well as less frequent elongated to chain-like 31
structures. The most frequently observed compact complexes, we identify as mainly leading to 32
LF-PPI coacervation, whereas for the less frequent chain-like aggregates, we hypothesize that 33
additionally PPI-PPI facilitated complex existed. 34
35
Page 4
3
1. INTRODUCTION 36
Interaction of oppositely charged biopolymers in aqueous media, mostly driven by electrostatic 37
forces can lead to a spontaneous liquid-liquid phase separation into biopolymer-rich phase 38
(coacervate phase) and solvent-rich phase 1. During initial stages, the biopolymer molecules tend 39
to form intrapolymeric soluble complexes. Further electrostatic interaction leads to the formation 40
of a dense and viscous liquid phase (coacervate) from a homogeneous macromolecular solution of 41
poor solvency as a result of thermodynamic incompatibility. The significance of complex 42
coacervation ranges from its natural occurrence in biological systems, such as providing the outer 43
physical protection of mussels and sand castle worms 2, to biomedical applications, such as 44
scaffold based tissue engineering 3, drug delivery 4 and various food applications, such as 45
biodegradable films, fat replacer and meat analogues 5. Type and size of biopolymers, mixing ratio, 46
total biopolymer concentration, chain conformation and flexibility, distribution of reactive groups 47
and the charge density, solvent conditions (pH, ionic strength and temperature), stirring and 48
pressure are important physicochemical parameters influencing the associative interaction 49
between the two biopolymers 6. 50
Although complex coacervation has been studied in a wide range of polyelectrolyte 51
systems, protein-protein complex coacervation is a relatively new undertaking. Understanding the 52
mechanism of the heteroprotein complex coacervation will open enormous opportunities for 53
immediate use in food and non-food applications (pharmaceuticals, cosmetics, biomedicals), 54
where biocompatibility is a key issue. Heteroprotein complex coacervation between cationic 55
lactoferrin (LF) and anionic く-lactoglobulin 7-13 as well as casein 14, 15 has captured much research 56
attention in recent years. Yan and co-workers 9 observed that LF and BLG coacervates were 57
formed at very low salt concentration and narrow pH range around 5.7−6.2, which has been 58
Page 5
4
recently confirmed by Peixoto and coworkers 12 using fluorescence intensity measurements and 59
nuclear magnetic resonance. On the other hand, Anema and de Kruif 16 observed that the 60
coacervation of lactotransferrin and く-lactoglobulin over a relatively wide pH range of pH 5-7.3 61
and higher ionic strength. Studies by Nigen et al. showed presence of both coacervation and 62
complexation with presence of unique micro-spherical particles between lysozyme and calcium-63
depleted g-lactalbumin (apo g-LA) 17, both processes being largely temperature dependent 18. 64
In this study, we utilized two globular proteins: lactoferrin (LF) and a mixed plant protein, 65
pea protein isolate (PPI). Lactoferrin (LF) is a metal-binding glycoprotein with a molar mass of 80 66
kDa and a high isoelectric point (pI) of ~8.5 providing it a novel feature of maintaining positive 67
charge over a wide range of pH 9. Pea (Pisum sativum L.) is an important vegetable source of 68
protein and has attracted significant research attention because of its biological value, functional 69
properties in food applications, and relatively low cost. Pea protein is dominated by two major 70
globulin (legumin and vicilin) and one minor (convicilin) proteins. Pea protein is limited in 71
sulphur-containing amino acids, so it might be a strategy to complement the protein with dairy 72
protein, the latter being rich in all essential amino acids. To our knowledge, there are no reported 73
studies on heteroprotein coacervation between LF and plant protein. Nonetheless, LF/ PPI 74
coacervate-based biomaterials can not only lead to a novel class of food matter, but can potentially 75
be employed in a wide range of applications. However, to design such a functional coacervate, 76
efforts must be undertaken to identify the precise range of working conditions for formation of 77
complexes, coacervate and their structural aspects at different length scales. 78
The objective of this study was to identify the conditions for creation of LF/ PPI heteroprotein 79
coacervate and complexes, which were characterized by electrophoretic mobility, dynamic light 80
scattering (DLS) and turbidimetry. In addition, SAXS (small-angle X-ray scattering) and AFM 81
Page 6
5
(atomic force microscopy) were employed to gain structural insights of the LF-PPI complexes and 82
coacervate at specified conditions. 83
84
2. EXPERIMENTAL SECTION 85
2.1.Materials. 86
The bovine lactoferrin (LF) was kindly donated by Ingredia Nutritional (Arras, France). According 87
to the technical specification provided by the supplier, it was purified from bovine milk and 88
contained 96% protein, 0.5% ash and iron saturation was 10-20%. Pea protein isolate (PPI) 89
(Nutralys®) was obtained from Roquette (Lestrem, France) and contained 85% protein, 7% 90
moisture, and 4% ash. Sodium azide was purchased from Sigma-Aldrich Chemical Company (St. 91
Louis, MO, USA). Milli-Q water (water purified of 18.2 M っ.cm by Milli-Q apparatus, Millipore 92
Corp., Bedford, MA, USA) was used as a solvent in all experiments. Hydrochloric acid (1 N HCl) 93
and sodium hydroxide (1 N NaOH) were diluted from concentrated ~37% w/v) HCl-water solution 94
or 10 M NaOH solution (Sigma-Aldrich), respectively. 95
96
2.2.LF-PPI Complex and Coacervate Preparation. 97
Dispersions of LF (4 g/L) and PPI (4g/L) were prepared by dissolving an exact amount of LF 98
powder or PPI powder in Milli-Q water, respectively for 2 h at 25 ヨC using a magnetic stirrer to 99
ensure complete solubilisation. The dispersions were centrifuged at 20,000 × g for 30 minutes, 100
filtered through Whatman No. 4 filter paper and 0.22 µm syringe filter to remove any residues. 101
The resultant LF stock solution showed 99.8% soluble protein yield, whereas PPI showed 30% 102
soluble protein yield, i.e. referring to a concentration of 1.2 g/L measured by using Kjeldahl 103
analysis (AOAC 981.10) 19. Note that this soluble fraction of PPI is further on referred to as the 104
PPI stock solution. The mineral composition analysed using ICP-MS (Inductively Coupled Plasma 105
Page 7
6
Mass Spectrometry) of the stock solutions was the following (g/100 g): LF: Na 0.0568, K 0.0017, 106
Mg < detection limit (0.00004), Ca 0.0022, Fe 0.025, P 0.050 and PPI: Na 0.2542, K 0.0588, Mg 107
0.0086, Ca 0.0077, Fe 0.00043, P 0.1637. Different semi-dilute concentrations of PPI working 108
solutions (0.00035-0.07 mM) were prepared by dilution of the PPI stock solution (1.2 g/L, i.e. 0.07 109
mM) using Milli-Q water. Appropriate volumes of PPI and LF at pH 7.0 were mixed for the molar 110
ratio study. The molar concentrations of LF and PPI were calculated using respective molecular 111
weights (discussed in SDS-PAGE section) and the molar ratio was based on the assumption that 112
all different fractions of PPI (legumin, vicilin, convicilin) participated equally in complex 113
formation with LF in the same ratio as they existed in the working solutions. For the pH study, the 114
pH of PPI/ LF with a molar ratio of 0.15 (mixture of 0.007 mM PPI and 0.047 mM LF) was 115
adjusted to target pH from pH 2-9 using 1 N standard HCl or NaOH as shown in Figure 1 magnetic 116
stirring conditions (500 rpm). Appropriate volumes (5.0 mL) of LF stock solution was rapidly 117
poured into an equal volume of freshly prepared PPI working solutions in a beaker followed by 118
mixing at 500 rpm. As described in previous literature 9, for “high to low”, PPI and LF working 119
solutions at pH 9.0 were mixed and then the mixtures were rapidly adjusted to a target pH while 120
mixing. For “low to high”, LF and PPI solutions were mixed at pH 2.0 and then the mixtures were 121
adjusted to a target pH quickly while mixing. The polymer-rich phase (coacervate) was collected 122
using mild centrifugation at 500 × g for 10 minutes and characterized using AFM, SAXS and 123
TEM. Sodium azide (0.02 wt%) was added to prevent any bacterial growth in samples only at ≥ 124
pH 7.0. No significant difference in coacervate structure were observed in terms of sizing, turbidity 125
measurements and zeta potential as compared to fresh samples without the addition of 0.02 wt% 126
azide in above-mentioned pH conditions. 127
Page 8
7
128
Figure 1. Schematic illustrations of steps of production of heteroprotein complex coacervate 129
showing the visual aspect of the viscous phase (macroscale). 130
131
132
2.3. Size and ȗ-potential Measurements. 133
The mean hydrodynamic radius (Rh) of the pure protein solutions, complex and coacervate was 134
measured by dynamic light scattering (DLS) at 25 °C equipped with a 4 mW helium/neon laser at 135
a wavelength output of 633 nm. Sizing was performed at 10 s intervals in disposable plastic 136
cuvettes (ZEN 0040) using noninvasive backscattering at a detection angle of 173 °C. Assuming 137
the scattering particles to be spherical, their apparent hydrodynamic radius was calculated from 138
the diffusion parameters using Stokes-Einstein equation, i.e. Rh = kBT/(θヾさDT), where kB is the 139
Boltzmann constant, T is absolute temperature, and さ is solvent viscosity. 140
The こ-potential values of the pure protein solutions, their complexes and coacervates were 141
measured using a laser Doppler velocimetry and phase analysis light scattering (M3-PALS0) using 142
disposable electrophoretic mobility cells (DTS 1060). The effective electric field, E, applied in the 143
Page 9
8
measurement cell was between 50 and 150 V. The electrophoretic mobility, た, was calculated 144
assuming spherical particles at 20 °C according using Equation 1: 145
146 (1)
where, v is the drift velocity of a dispersed particle (m/s) and E is the applied electric field strength. 147
The こ-potential (mV) was calculated via the Smoluchowski Equation 2: 148
149 (2)
which is valid for r >> せ-1, where i is the electric permittivity of the solvent, さ is the solvent 150
viscosity (Pa s), r is the radius of particle and せ-1 is the Debye length. Both Z-average diameter and 151
こ-potential were measured with a Zetasizer Nano ZS (Malvern Instruments Ltd, Malvern, 152
Worcestershire, UK). The results were reported as mean Z-average mean diameter or mean こ-153
potential of five readings and standard deviations were calculated. 154
155
2.4. Turbidity Measurements 156
The turbidity of pure protein solutions and their complex/ coacervate were measured by a Jenway 157
6715 UV-Visible Spectrophotometer (Bibby Scientific Limited, Beacon Road, Stone, 158
Staffordshire, ST15 OSA, UK) using 1 cm disposable plastic cuvette at 600 nm. Milli-Q water was 159
used as blank reference resulting in 100% transmittance. The turbidity (T) was calculated using 160
equation (3): 161
162 (3)
where, I is the transmitted intensity and I0 is the incident light intensity. 163
164
E
0
lnI
IT
Page 10
9
2.5. Small-angle X-ray scattering (SAXS). 165
Small angle X-ray scattering (SAXS) patterns were recorded in order to determine the size (radius 166
of gyration) of 0.007 mM PPI stock solution, 0.047 mM LF at pH 7.0 and their complexes or 167
coacervates at pH 5.4, 5.8, 6.2 and 7.0, respectively. The SAXS camera set-up (SAXSpace, Anton 168
Paar, Austria) is described in great detail elsewhere 20. Briefly, the collimation block unit vertically 169
focuses a line shaped beam of Cu-Kg radiation with a wavelength, そ = 0.154 nm on to the detector 170
plane. For the SAXS experiments the high resolution mode was chosen, which permits to detect a 171
minimum scattering vector, qmin, of 0.04 nm-1 (q = (ζヾ/そ) sinし, where 2し is the scattering angle). 172
All studied samples were filled into the same vacuum-tight, reusable 1 mm quartz capillary to 173
guarantee exactly the same scattering volume. The capillary was placed in the temperature 174
controlled sample stage at 25 °C ± 0.1 °C. All samples as well as the aqueous buffers and empty 175
capillaries were exposed for 120 minutes. The SAXStreat software (Anton Paar) was used to 176
correct the scattering patterns with respect to the position of the primary beam. The SAXS data 177
was further transmission-corrected by setting the attenuated scattering intensity at q = 0 to unity 178
and the background was subtracted using the SAXS Quant software (Anton Paar). The scattering 179
vector q was calibrated with silver-behenate, which has a known lattice spacing of 5.84 nm. The 180
reduced scattering pattern were finally analyzed with the GIFT software package in order to fit the 181
scattering data by Indirect Fourier Transformation (IFT), generate the Pair-Distance Distribution 182
Functions (PDDF) and to determine the radius of gyration of the pure proteins and their 183
coacervates. 184
185
Page 11
10
2.6.Atomic force microscopy (AFM) Measurements. 186
Complexes, coacervate and pure proteins were investigated with an Icon Fast-Scan Bio Atomic 187
Force Microscope (Bruker Nano Surfaces, Santa Barbara, CA). Samples were prepared for 188
deposition by serial dilution of the stock solutions at the required pH. Good dispersions were 189
generally found at a dilution of 1×10⁶ times, and continuous films at 100× dilution. 20 L of each 190
diluted sample was pipetted onto a freshly cleaved ruby mica disc and incubated for 5 minutes, 191
before rinsing with approximately 5 mL of Milli-Q water, drying by wicking onto filter paper 192
followed by a stream of nitrogen. The LF and LF-PPI complex at lower pH value (pH 5.4) adhered 193
well, but the complex at pH 7.0 would only adhere to the mica if it had been pre-treated with Mg2+ 194
ions (50 L of 5 mM MgCl2 solution for half an hour), the rationale being that the charge on the 195
complex was negative hence repelling from the mica which is also negatively charged at neutral 196
pH. Pure PPI did not adhere well to the mica, although lower quality images could be obtained by 197
drying the sample without rinsing. Samples were scanned using TESPA-V2 probes (Bruker) with 198
tapping mode in air, at a resonant frequency of 340-350 kHz and minimum set point, at a typical 199
scan rate of 3-4 Hz depending upon image size. Multiple scans across the samples were obtained 200
to ensure good statistics, typically at 2 m scan size and 1536 or 2048 pixel resolution. AFM 201
images were analysed using the Particle Analysis function in ImageJ (NIH). Each image was 202
converted into a binary image using a manual threshold to prepare for the automated analysis. The 203
outline of each complex was fitted with an ellipse, with the major and minor axes describing the 204
length and width of each complex respectively. Sizing of the individual proteins was carried out 205
in Nanoscope Analysis software (Bruker, version 1.5) using the manual ruler tool. 206
207
Page 12
11
2.8 Protein content, solubility curve and composition 208
Both protein stock solutions (LF and PPI) were examined after centrifugation and filtration for 209
crude protein content (AOAC 981.10). The PPI stock solution (1.2 g/L) was analyzed for its 210
solubility as a function of pH from pH 2-9 19. The composition was assessed using sodium dodecyl 211
sulphate polyacrylamide gel electrophoresis (SDS-PAGE) technique. 50 µL of protein solution (at 212
4 g/L for LF, 1.2 g/L for PPI) was mixed with 50 µL of Laemmli sample buffer (62.5 mM Tris-213
HCl, 2% SDS 25% glycerol, 0.01% bromophenol blue, 5% く-mercaptoethanol) and the mixture 214
was heated to 95 ° C for 5 min. The samples were cooled to room temperature and 20 µL was 215
loaded onto SDS gels previously prepared on a Mini-PROTEAN II system (Bio-Rad Laboratories). 216
Gels were run for 10 min at 100 mV followed by a phase of 30 minutes at 200 mV. The gels were 217
stained with Coomassie Blue R-250 [0.05% (w/v) in 25.0% (v/v) isopropanol 10.0% (v/v) acetic 218
acid] for at least 4 hours, after which they were destained with water for one hour. Gels were 219
scanned using a flat-bed scanner (Bio-Rad Molecular Imager, Chemi-Dco XRST) and the 220
intensities of the protein bands were quantified using Image LabTM software version 5.1 Beta. 221
The percentage composition of each sample was determined by scanning the areas for each band. 222
223
3. RESULTS AND DISCUSSION 224
Figure 2 shows the SDS-PAGE electrophoretogram of the LF and PPI stock solution tested. 225
Lactoferrin (LF) stock solution (0.047 mM) had protein content of 96% (Kjeldahl, N×6.38), in 226
agreement with the specification stated by the manufacturer of which 95% was lactoferrin (Figure 227
2). On the other hand, pea protein isolate stock solution (0.007 mM) had protein content of 97% 228
(Kjeldahl, N×6.25) and exhibited a wide variety of polypeptide subunits of molecular weight (Mw) 229
ranging from 20 to 75 kDa, consisting of three main sets of protein subunits i.e. convicillin (72.4-230
Page 13
12
77.9 kDa, 13.5%), vicillin (28.7-47.3 kDa, 33.2%) and legumin (g-subunits, 40.9 kDa, 21.2%; く-231
subunit, 22.3-23.1 kDa, 18.1%), which is in agreement with findings of previous authors 21. The 232
legumin/vicillin (L/V) ratio was 1.2 which is within the lower range of values reported in literature 233
22. The solubility curve of PPI stock solution shows that the isoelectric point (pI) is pH 4.0, which 234
is in accordance with previous reports 23. 235
236
Figure 2. SDS-PAGE of LF (0.047 mM) and PPI (0.007 mM) stock solutions. M is the molecular 237
weight marker (10–250 kDa). 238
239 Structure of coacervates formed by proteins with complementary charges are driven by 240
electrostatic interactions. Hence, it is obvious that pH, ionic conditions, molar ratio of the charged 241
moieties, protein characteristics (type, size, shape, molecular weight, and surface charge density) 242
etc. may strongly influence the kinetics and thermodynamics of complex coacervation, and most 243
of these parameters cannot be varied independently of each other 24. The approach toward charge 244
neutralization can be via alteration of the charge of one or both partner macroions, or alteration of 245
the combining ratio (microstoichiometry) within the complex 25. In this study, we first discuss the 246
Page 14
13
effect of different molar ratios of PPI/ LF on complex and/or coacervate formation at pH 7. This 247
sets the scene for understanding the effect of the pH on the structure of LF-PPI complexes and 248
coacervates at a fixed PPI/ LF molar ratio and identifies the boundary pH conditions leading to 249
LF-PPI complex coacervation 250
251
3.1. Effects of biopolymer mixing ratio on LF-PPI complex formation. 252
Typically, complexation occurs under solvent conditions, where both biopolymers have opposing 253
charges. Selection of pH 7 was justified for the biopolymer mixing ratio as LF and PPI have a net 254
positive and negative charge, respectively. Figure 3 shows the influence of PPI addition on the 255
hydrodynamic radius and turbidity of the LF as a function of PPI/ LF ratio varying from 0.007 to 256
0.15 mM at neutral pH. Almost optically clear LF-PPI solutions (Figure 3A) underwent a turbidity 257
onset at > 0.04 mM PPI solution that was measurable with increase of optical density OD600 (Figure 258
3B). The turbidity corresponds to appearance of scattering particles in the medium and the 259
formation of LF-PPI complexes. The OD600 exhibited its highest value (0.39) at PPI/LF molar ratio 260
of 0.06, making the solution significantly cloudy indicating the maximum formation of insoluble 261
complexes. Beyond PPI/ LF ratio of 0.06, intermediate levels of turbidity were observed with less 262
cloudy appearance. 263
To assign the macroscopic turbidity data to hetero-protein coacervation, we used DLS and 264
こ-potential measurements. As shown in Figure 3B, in agreement with the turbidity data, Rh 265
increased slowly from 51 nm to 57.6 nm as PPI/LF ratio increased by one order of magnitude, 266
followed by maxima (~ 82 nm) at a PPI/ LF ratio of 0.06 and then a decrease. At and above the 267
molar ratio of PPI/ LF of 0.08, the Rh reached a plateau. The effect of biopolymer mixing ratio was 268
critical for controlling the charge balance within the mixed systems. 269
Page 15
14
(A)
(B)
Figure 3. Visual images (A) and dependence of hydrodynamic radius, Rh (bold line), turbidity 270
(dotted line) (B) on PPI/ LF ratio on mixing LF (0.047 mM) with different concentrations of PPI 271
at pH 7. Error bars represent standard deviations. Rh = 8.9 ± 0.13 and 41 ± 0.51 nm and PDI 272
(polydispersity index) equals 0.12 and 0.18 for the pure LF and PPI stock solutions, respectively. 273
274
275
Figure 4. Mean ȗ-potential values as a function of PPI/ LF ratio on mixing LF (0.047 mM) with 276
different concentrations of PPI at pH 7. Error bars represent standard deviations. 277
278
Zeta potential (ȗ), the electro-kinetic potential difference between the dispersion medium and the 279
slip plane (stationary layer of fluid attached to the dispersed particle) of moving particles 280
confirmed an associative driving force for complexation between the positively charged amino 281
acids of LF and the negative charges on PPI at very low biopolymer concentrations (Figure 4). In 282
0.01 0.025 0.05 0.075 0.1 0.15 0.2
PPI (wt%)
0.007 0.02 0.04 0.06 0.08 0.1 0.15 PPI/ LF molar ratio
Page 16
15
absence of added PPI, 0.047 mM LF was cationic at pH 7 and the こ-potential was +12 mV. On 283
addition of PPI, the positive charge of the mixture decreased to be electrically neutral (-2.5 mV) 284
at 0.075 wt%. 285
This means that at molar ratio of PPI/ LF of 0.06, the number of positively charged amino 286
groups were nearly equivalent to that of the carboxylic acid groups, validating charge neutral 287
complex formation, in agreement with the largest Rh and turbidity maxima. Above PPI/LF molar 288
ratio of 0.06, the negative こ-potential increased steadily to -12.3 mV, which might be attributed to 289
LF molecules being covered by PPI moieties and thus formation of soluble complexes. Similar 290
behavior for mixtures of LF and other proteins showing inter-protein interactions with increase in 291
negative charge of mixed solutions have been observed previously14. We selected this PPI/LF ratio 292
of 0.15 to investigate the behavior of rather “soluble LF-PPI complex” with almost no visible 293
turbidity (OD600 <0.15) as a function of pH drift in the next section 294
295
3.2. Effects of pH on coacervate formation. 296
Hetetoprotein coacervation differs from native protein self-aggregation based on the degree 297
of pH-dependence of complex and kinetics of aggregation9, 10. It is known that coacervation 298
can get overshadowed by protein self-aggregation. Hence, the hydrodynamic radius of native 299
LF (0.047 mM), PPI (0.007 mM) and their mixtures at PPI/ LF ratio of 0.15 were measured 300
as a function of pH 2-9 (Figure 5A) to discriminate between self-aggregation (if any) and LF-301
PPI interaction. 302
There was no significant change in hydrodynamic radius of LF as a function of pH (< 50 303
nm). In the case of PPI, the hydrodynamic radius remained below 80 nm at pH 6 to 9. However, 304
the particle size was higher in the acidic region with possible PPI-PPI self-aggregation reaching 305
Page 17
16
maximum at pH 4 (~ 332 nm), being the isoelectric point of PPI 26. This trend agrees well with the 306
measured the solubility curve. In the case of LF-PPI mixtures, the hydrodynamic radius remained 307
below 75 nm in all pH except at pH 5-6, where the larger aggregates seemed to appear with maxima 308
at pH 5.4 (Figure 5B). These large sizes might be attributed to the scattering from particles of 309
turbid LF-PPI mixtures. The interaction between LF and PPI did not readily lead to a new “liquid” 310
phase. However, when these turbid materials at pH 5.4 and 5.8 were separated by mild 311
centrifugation, presence of glossy, viscous liquid (Figure 5A, zoomed image in Figure 1) in the 312
Eppendorf tubes had the clear signature of formation of coacervates 14. As observed in several LF-313
based coacervate studies 27, the coacervates created might have coalesced into this concentrated 314
viscous phase. The opacity of the viscous phase might suggest the coexistence of pure coacervates 315
and some degree of PPI-PPI linkage facilitated aggregates. Post pH 6.2, the samples were 316
exhibiting rather “one-phase” with 35 nm sized complex. 317
318
Page 18
17
(A)
(B)
Figure 5. Evolution of hydrodynamic radius, Rh of 0.047 mM LF solution (), 0.007 mM PPI 319
solution (ズ) and mixture of 0.047 mM LF and 0.007 mM PPI solutions (Ÿ) (PPI/ LF molar ratio 320
of 0.15) as a function of pH with corresponding visual images taken after mild centrifugation of 321
the LF-PPI mixtures (A) and zoomed-in mean hydrodynamic diameter of LF-PPI mixtures in pH 322
5-7 region (B). Error bars represent standard deviations. 323
324
3.3. Identification of boundary conditions for coacervate formation. 325
Since complex coacervation between LF and PPI is due to electrostatic interaction between 326
oppositely charged proteins, the charge characteristics of the individual components were 327
measured by Doppler electrophoresis in a wide pH range of 2.0–9.0. (Figure 6). The こ-potential of 328
LF decreased from +24.8 mV to -1.5 mV as increased pH from 2 to 9 and reached zero at around 329
pH 8.5, which is the isoelectric point of LF. The isoelectric point of LF is in line with the theoretical 330
net charge and fits closely with the pI value reported previously 9. 331
5.4 5.8 7.0 8.0 3
Page 19
18
On the other hand, こ-potential value of PPI changed from +23.2 mV to -28.2 mV as pH 332
increased and close to zero around pH 4 (pI). This is in line with the increase in Rh data, solubility 333
curve validating the aggregation of pea protein molecules near its isoelectric point. The observed 334
pI of PPI is within the range reported by previous authors 23. When the LF (0.047 mM) and PPI 335
(0.007 mM) were mixed, the こ-potential decreased from +32.5 mV to -18.6 mV as a function of 336
pH, with values approximately zero in the pH range from 5-6. Zooming in further the こ-potential 337
values in pH 5-6, it can be observed that from pH 5-5.8, the こ-potential values remained ≤ -5 mV 338
and it is only at pH 6.2 and beyond, the negative charge started increasing. 339
(A)
(B)
Figure 6. Mean ȗ-potential values of 0.047 mM LF solution (), 0.007 mM PPI solution (ズ) and 340
mixture of 0.047 mM LF and 0.007 mM PPI solutions (メ) (PPI/ LF molar ratio of 0.15) as a 341
function of pH showing pHc, pHl1, pHmax, and pHl2 (A) and the zoomed-in mean ȗ-potential values 342
of LF-PPI mixtures in pH 5-7 region highlighting the isoelectric point (ヤ) (B). Error bars represent 343
standard deviations. 344
345
Page 20
19
Although the mechanism of the complex coacervate formation is not fully understood, we 346
hypothesize the following sequential processes based on previous literature. Below pH 4, both LF 347
and PPI molecules being cationic molecules (pH> pI) appear to repel each other and this prevents 348
the formation of a complex between the two protein molecules. 349
This is in line with the low particle size, turbidity measurements and transparent appearance 350
of the mixed biopolymer solutions (Figure 5). Dubin, et al. 28 showed that two polyelectrolytes that 351
contain like (negative or positive) charge could form soluble complex. Hence, in our case, the LF 352
and PPI might be present as individual biopolymer molecules or as soluble complexes below pH 353
4. Above pH 5.0, Rh gradually increased above the value that corresponds to the Rh of LF or PPI 354
alone observed for pH < pH券2 25. The pure (precipitate-free) coacervate formation appeared to be 355
initiated above pH 5.0, followed by growth of primary complexes to form quasi-neutralized 356
insoluble complexes (pH券2), with a depletion of charge at pH 5.0. Further kinetic experiments 357
should be performed to confirm this growth mechanism. At pH 5.4 (pHmax), electrical equivalence 358
was achieved between the proteins with こ-potential reaching zero, the particle scattering being 359
highest with a steep rise in Rh (Figure 5B) and the turbidity reaching as well its maximum. This is 360
seen in other studies where LF has been shown to form coacervate with anionic proteins at this pH 361
range. For instance, Anema and de Kruif 14 observed maximum coacervation for く-lg (く-362
lactoglobulin)-LF complexation at pH 6.3, where the こ-potential was nearly zero. In our case, 363
coacervation is maximized at pH 5.4, which is closer to the pI of PPI than that of LF, as halfway 364
between the respective pI’s would be pH 6.25 (=(4+8.5)/2). 365
Soluble complexes are formed between biopolymers when net charge is high and electrostatic 366
interaction is lower whereas insoluble complexes and coacervate formation occurs when 367
electrostatic interaction between molecules is strong and net charge was low. In our case, we 368
Page 21
20
suggest that at pH 5.0-6.0 there was formation of coacervate, whereas ≥ pH思1 (6.2), soluble 369
complexes were formed and the boundary is designated as pHc (pH 7), i.e. 1.5 units away from 370
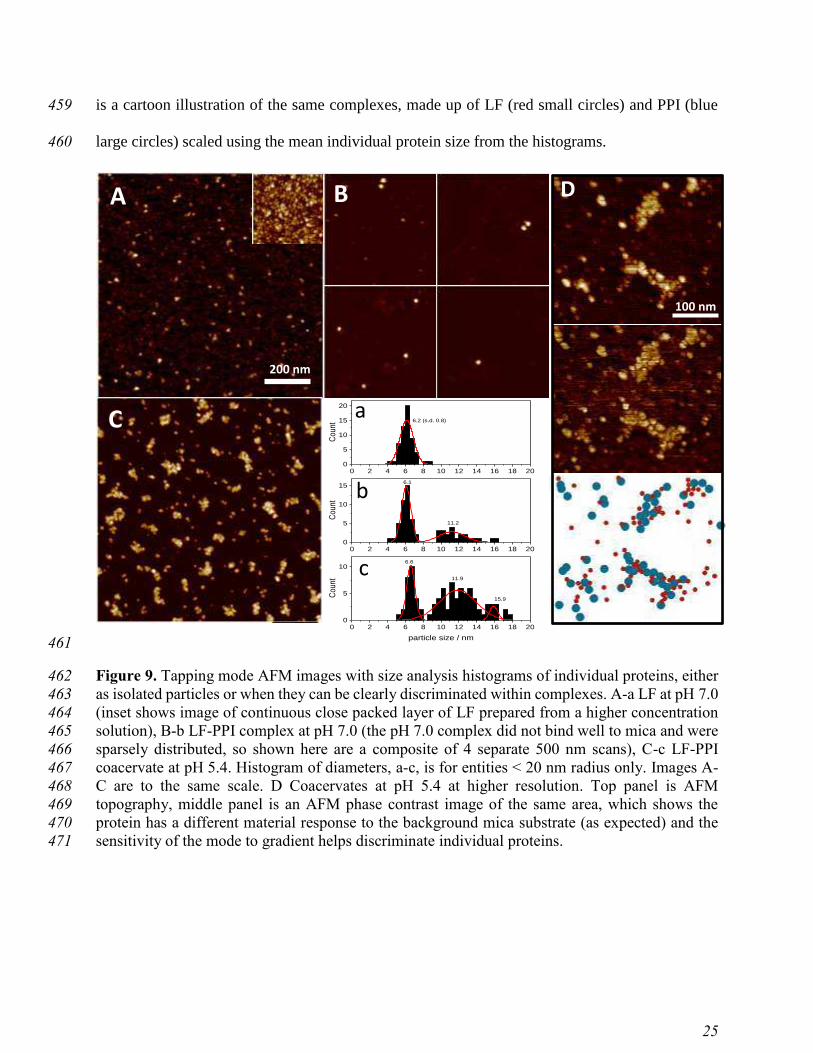
isoelectric point of LF. Above pH 8.5, both LF and PPI carried a similar net charge. To reveal the 371
distribution of size of these complexes and/or coacervates, small angle X-ray scattering (SAXS) 372
and atomic force microscopy (AFM) were used. 373
374
3.4. Small Angle X-ray Scattering (SAXS). 375
The SAXS pattern of pure dispersions of LF and PPI were recorded at pH 7 at 25 °C and analyzed 376
by the Generalized Indirect Fourier Transform (GIFT) method 29 (Figure 7). The determined SAXS 377
data of LF and of PPI (Figure 7A) compared well to previous literature data 30-32. As revealed in 378
the PDDFs (Figure 7B) LF was not perfectly globular, but composed of two globular lobes, which 379
are compactly arranged in protein crystals, but under solution conditions can open up. In solution, 380
Grossmann et al. 31 determined a radius of gyration, Rg = 3.3-3.6 nm for human lactoferrin 381
measured at pH 7.5. Since our samples were measured at a slightly lower pH, the difference in our 382
observed value of Rg = 4.2 nm for bovine lactoferrin might be related to a bigger opening of the 383
inter-domain cleft. Note, that the smallest cleft is observed in the crystal form of lactoferrin, in 384
which the corresponding Rg is smaller than 3 nm 30, 31. Concerning PPI, a maximum extension of 385
about 25 nm and furthermore a double peak distribution is apparent in the PDDF. The PPI 386
consisted mainly of legumin and vicilin and in minor part of convicilin (13%; referring to results 387
from Fig. 2), and as discussed elsewhere 33. We note, legumin has Rg = 4.45 nm 34 and vicilin has 388
Rg = 4.4 nm 35. 389
Page 22
21
390
Figure 7. A) SAXS curves of 0.007 mM PPI, 0.047 mM LF and their complex formed at pH=7. 391
The solid lines represent the fitted curves obtained by Indirect Fourier Transformation (IFT) 392
analysis. B) The corresponding Pair-Distance Distribution Functions (PDDFs) are displayed as a 393
function of the radial distance (z). 394
395
Thus, the PDDF confirms that the PPI aggregates into oligomers (about 3-6 proteins), which was 396
first shown as a pseudo-hexagonal, ring-like appearance by scanning electron tunneling 397
microscopy 32. The extension of PPI the ring-like aggregates is in the order of 20-25 nm, which 398
compares well to a maximum extension of about 25 nm displayed in the PDDF (Figure 7B). 399
400
Page 23
22
Table 1. Radius of gyration of PPI, LF and their complex at pH 7.0. 401
402
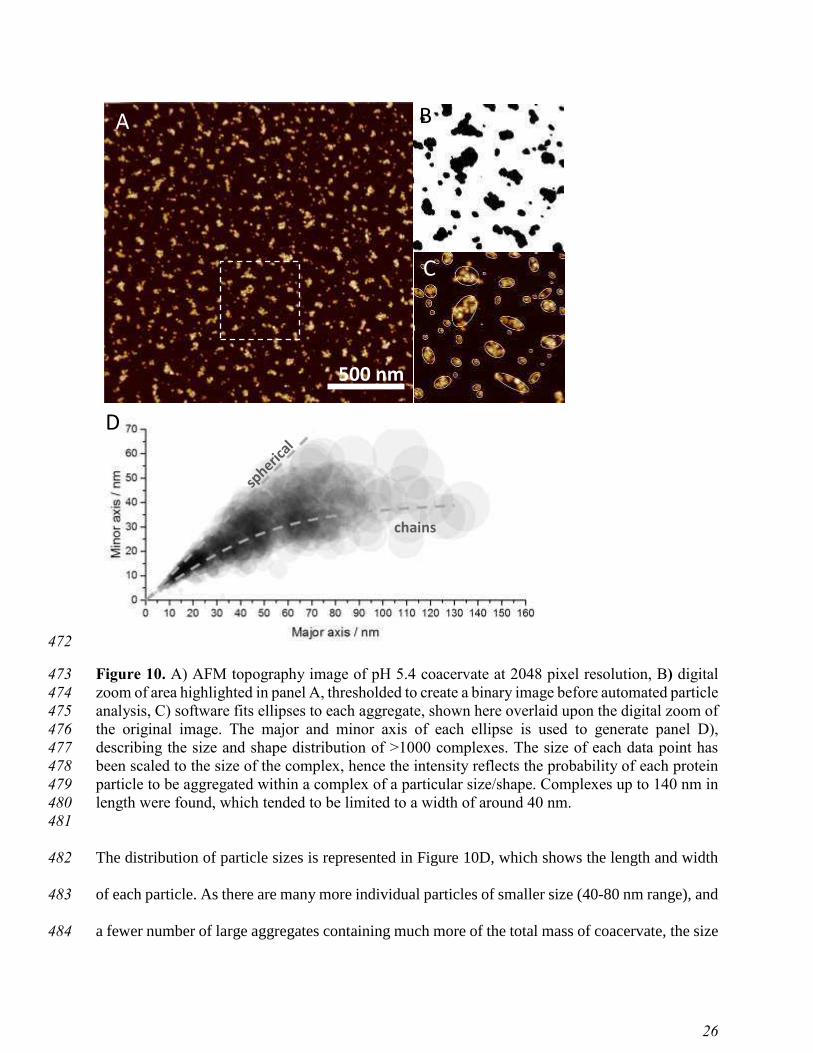
Sample Radius of gyration
(nm)
LF 4.22
PPI 9.47
LF-PPI complex 13.1
403
Figure 8 gives an overview of all measured LF-PPI complexes and coacervates at various pH 404
values. As clearly shown at pH 7.0, complexes were composed of both LF and PPI, since a simple 405
superposition of the individual LF and PPI scattering curves would not lead to a SAXS curve with 406
Rg = 13.1 nm. Therefore, in this case the amount of self-aggregated protein can practically be 407
ignored. In accordance with the ȗ-potential measurements (compare Figure 6), the biggest 408
coacervates were formed at pH 5.4. Their maximum extension reached values of about 80 nm 409
(Figure 8B), leading to rough estimate of coacervate radius of 40 nm. Since the majority of the 410
involved proteins (legumin and vicilin) have similar radii (Rg = 4.0 to 4.5 nm, which relates to R 411
= ටହଷ Rg = 5.2 to 5.8 ≈ 5.5 nm), we can roughly estimate the number of proteins involved in the 412
biggest coacervates: Vcoacervate /Vprotein ≈ 380 proteins. Assuming a protein packing density similar 413
to the closest packing density of spheres (0.74), we obtain a corrected estimate of about 280 414
proteins per coacervate at pH 5.4. The highest solubility of proteins was determined for pH 6.2 415
(smallest Rg = 7.7 nm), which corresponds to about 4-5 proteins per complex. Further increasing 416
the pH increased the size of the complexes again: at pH 7, roughly 36 proteins were involved. We 417
note, however, that these are only indicative estimates, and should be taken with due care, as we 418
are considering ideal hard sphere packing of the proteins and also have not taking into account the 419
Page 24
23
convicilin proteins. Importantly, a closer inspection of the PDDF’s in Figure 8B reveals that the 420
size distributions of the coacervates were not fully symmetric (note, that each PDDF displays a 421
shoulder at higher distances). This bimodal size distribution was further confirmed by AFM 422
measurements (see section 3.5) and can be assigned to differently shaped coacervates, i.e. to 423
spherical and elliptically shaped complexes, respectively 36. 424
425
Figure 8. A) Small angle scattering curves of the LF-PPI coacervates and/or soluble complexes at 426
various pH values. B) The corresponding Pair-Distance Distribution Functions (PDDFs) were 427
evaluated based on Indirect-Fourier Transformation and show that the largest coacervate formed 428
at pH=5.4. 429
430
Table 2. Radius of gyration of LF-PPI coacervates (at pH 5.4 and 5.8) and soluble complexes (at 431
pH 6.2 and 7.0). 432
433
pH Radius of Gyration (nm)
7.0 13.1 6.2 7.7 5.8 30.3 5.4 31.3
434
435
Page 25
24
3.5. AFM micrographs of the coacervates. 436
Atomic force microscopy (AFM) images were analyzed to investigate structure of LF, LF-PPI 437
complex (pH 7.0) and LF-PPI coacervate (pH 5.4) adsorbed to mica surfaces (Figure 9). As can 438
be observed from Figure 9A and histogram a, LF showed uniform spherical particles, with a mean 439
radius of 6.2 nm. From SAXS, the lactoferrin radius was 4.2 nm. This increase in apparent size 440
can be described by the well-known tip-magnification effect in AFM. A tip radius of 7.5 nm, 441
typical of the TESPA-V2 (Bruker) probes used in this study, would result in an apparent size of 442
6.2 nm for the lactoferrin. The complexes formed at pH 7.0 were very sparse owing to a weak 443
electrostatic attachment, despite the use of the divalent cation Mg2+ to modify the surface of mica 444
37. This may be because of the influence of ionic strength change on the narrow boundary 445
conditions of LF-PPI complex and coacervate formation. 446
The radius of the soluble complexes (Figure 10Bb) from AFM images was found to lie in 447
the broader range between 9-15 nm (mean radius = 11.2 nm) which is in close agreement with 448
SAXS data (PPI: Rg = 9.5 nm, LF-PPI complex: Rg = 13.1 nm, both at pH 7.0). Most importantly, 449
the coacervates formed at pH 5.4 were clearly visible as groups of individual proteins forming 450
complexes of greater than 40 nm in size. The analysis of complex morphology is shown in Figure 451
10. While a dense and space filling structure of coacervates was formed at pH 5.4 (Figure 9C), the 452
complexes produced at pH 7.0 (Figure 9B) were less clustered. Figure 9D shows the detail of the 453
large single coacervate in topography and AFM phase contrast. Below, we present a schematic 454
representation created from circular unit with measurements taken from the AFM images of pure 455
LF and PPI and overlaid onto the image (Figure 9D top) as closely as possible. The underlying 456
image was then deleted to reveal a stylised cartoon of the coacervate, which suggests that LF were 457
forming bridges between predominantly PPI moieties forming the structural units. Bottom panel 458
Page 26
25
is a cartoon illustration of the same complexes, made up of LF (red small circles) and PPI (blue 459
large circles) scaled using the mean individual protein size from the histograms. 460
461
Figure 9. Tapping mode AFM images with size analysis histograms of individual proteins, either 462
as isolated particles or when they can be clearly discriminated within complexes. A-a LF at pH 7.0 463
(inset shows image of continuous close packed layer of LF prepared from a higher concentration 464
solution), B-b LF-PPI complex at pH 7.0 (the pH 7.0 complex did not bind well to mica and were 465
sparsely distributed, so shown here are a composite of 4 separate 500 nm scans), C-c LF-PPI 466
coacervate at pH 5.4. Histogram of diameters, a-c, is for entities < 20 nm radius only. Images A-467
C are to the same scale. D Coacervates at pH 5.4 at higher resolution. Top panel is AFM 468
topography, middle panel is an AFM phase contrast image of the same area, which shows the 469
protein has a different material response to the background mica substrate (as expected) and the 470
sensitivity of the mode to gradient helps discriminate individual proteins. 471
200 nm
A B
C
0 2 4 6 8 10 12 14 16 18 200
5
10
Cou
nt
particle size / nm
0 2 4 6 8 10 12 14 16 18 200
5
10
15
11.9
6.2 (s.d. 0.8)
Cou
nt
0 2 4 6 8 10 12 14 16 18 200
5
10
15
20
15.9
6.6
Cou
nt
11.2
6.1
100 nm
;
H
I
D
Page 27
26
472
Figure 10. A) AFM topography image of pH 5.4 coacervate at 2048 pixel resolution, B) digital 473
zoom of area highlighted in panel A, thresholded to create a binary image before automated particle 474
analysis, C) software fits ellipses to each aggregate, shown here overlaid upon the digital zoom of 475
the original image. The major and minor axis of each ellipse is used to generate panel D), 476
describing the size and shape distribution of >1000 complexes. The size of each data point has 477
been scaled to the size of the complex, hence the intensity reflects the probability of each protein 478
particle to be aggregated within a complex of a particular size/shape. Complexes up to 140 nm in 479
length were found, which tended to be limited to a width of around 40 nm. 480
481
The distribution of particle sizes is represented in Figure 10D, which shows the length and width 482
of each particle. As there are many more individual particles of smaller size (40-80 nm range), and 483
a fewer number of large aggregates containing much more of the total mass of coacervate, the size 484
A
ヵヰヰ ミマ
Iエ;キミゲ
B
C
D
Page 28
27
of each data point was scaled to be directly proportional to the size of each particle. This better 485
represents the most likely size and shape of the coacervate, and hence directly comparable to SAXS 486
data. Overall, the distribution contained strong clusters of the axis lengths around 40-50 nm (minor 487
axis) and 60-80 nm (major axis), which agrees well with the SAXS-derived PDDA data (Figure 488
8B). More spherical clusters are represented by the straight line with the major and minor axes of 489
the same size, whilst the elongated complexes by the distribution along the x-axis, with no further 490
increase in width. Interestingly, the complexes appeared to grow directionally forming ordered 491
chains with width of 30-50 nm. In fact, once the clusters start to grow, they were more likely to 492
elongate, which might be facilitated by PPI-PPI linkages. We speculate that additional PPI-PPI 493
linked aggregation might be responsible for the formation of clearly chain-like aggregates. Indeed, 494
in rarer cases, elongated aggregates with a major axis length up to 140 nm and minor axis of 40 495
nm were observed (Figure 10D). 496
However, importantly, most frequent cluster sizes group around 40-80 nm with spherical to 497
elliptical shapes (axis aspect ratio ≤ 2), whereas elongated to chain-like structures appeared to be 498
less frequent. The latter has also been confirmed the SAXS data (Fig. 8A), where the low q-value 499
data at pH 5.4 and 5.8 (referring to big particle sizes) were exclusively fitted with particle sizes up 500
to 80 nm. Further, the concentration of clusters with elliptical shapes with typical axis ratios of 80 501
to 40 nm dominated over the purely spherical nanocomplexes of 40 nm (Figure 10D). This bimodal 502
size distribution was also reflected in the SAXS data (Figure 8D). In conclusion, we believe that 503
this major population of spherical and elliptical nanocomplexes were responsible for the formation 504
of coacervate, shown by the liquid behavior of the dense viscous phase at a macroscopic scale post 505
centrifugation. Similar spherical to elliptic shaped clusters have also been reported in other 506
Page 29
28
coacervate systems, such as in bovine serum albumin (BSA) and poly(dimethyldiallylammonium 507
chloride) (PDADMAC)38 and polyelectrolyte-mixed micelle.39 508
509
4. CONCLUSIONS 510
Mixing cationic lactoferrin (LF) and anionic pea protein isolate (PPI) lead to complex formation 511
and coacervate formation under specific conditions of pH range with maximum level of coacervate 512
formation observed at charge neutrality. The DLS, ȗ-potential data and turbidity measurements 513
enabled identification of the optimum pH conditions where coacervation was most favorable (pH 514
5.4), and where soluble complexes were maximized (pH 7). The SAXS measurements confirmed 515
the formation of heteroprotein complexes with a radius of gyration of 13 nm at pH 7. Coacervates 516
with maximum extensions of about 80 nm were observed at pH 5.4. Both, the bimodal size 517
distribution and characteristic length scales deduced from SAXS data are in excellent agreement 518
with the AFM analysis, showing a distribution containing frequent clusters with particles sizes 519
around 40-80 nm, with a predominance of elliptical over spherical LF-PPI coacervates. However, 520
with respect to the rarer observed chain-like aggregations, additionally facilitated PPI-PPI 521
aggregation cannot be fully ignored and thus the interplay between LF-PPI coacervation and PPI-522
PPI aggregation mediated clusters requires further investigation. Future studies are needed to 523
understand the electrostatic interactions between LF and pure individual fractions of legumin, 524
vicillin and convicilin from pea sources, respectively. 525
526
SUPPLEMENTARY INFORMATION 527
< Details of solubility curve of PPI stock solution, raw correlograms of LF and PPI stock solutions 528
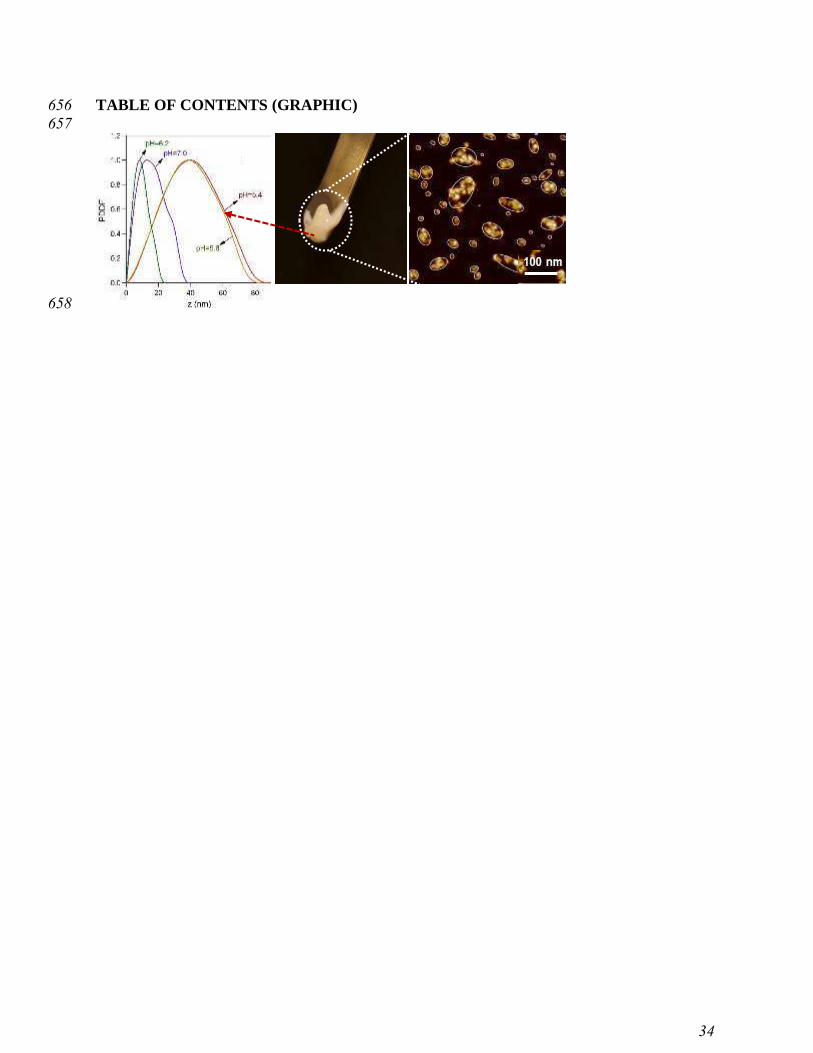
(DLS) and turbidity curves of LF-PPI mixtures as a function of pH are reported> 529
Page 30
29
AUTHOR INFORMATION 530
Corresponding Author 531
*Email: [email protected] 532
Food Colloids and Processing Group, 533
School of Food Science and Nutrition, University of Leeds, Leeds, LS2 9JT, United Kingdom. 534
535
AUTHOR CONTRIBUTIONS 536
AnS initiated and designed the research, EA performed the experiments, SDC performed AFM, 537
AmS performed SAXS. AnS, EA, SDC and MR analysed the data. The manuscript was written 538
through contributions of all authors. AnS had primary responsibility for final content. All authors 539
have given approval to the final version of the manuscript. 540
541
ACKNOWLEDGMENT 542
Author (EA) kindly acknowledges TUBITAK Visiting fellowship for conducting this research at 543
University of Leeds as a part of her PhD studies. 544
545
Page 31
30
REFERENCES 546
1. Salvatore, D.; Croguennec, T.; Bouhallab, S.; Forge, V.; Nicolai, T., Kinetics and 547
structure during self-assembly of oppositely charged proteins in aqueous solution. 548
Biomacromolecules 2011, 12, (5), 1920-1926. 549
2. Hwang, D. S.; Zeng, H.; Srivastava, A.; Krogstad, D. V.; Tirrell, M.; Israelachvili, J. N.; 550
Waite, J. H., Viscosity and interfacial properties in a mussel-inspired adhesive coacervate. Soft 551
Matter 2010, 6, (14), 3232-3236. 552
3. Toh, Y.-C.; Ho, S. T.; Zhou, Y.; Hutmacher, D. W.; Yu, H., Application of a 553
polyelectrolyte complex coacervation method to improve seeding efficiency of bone marrow 554
stromal cells in a 3D culture system. Biomaterials 2005, 26, (19), 4149-4160. 555
4. Jin, K.-M.; Kim, Y.-H., Injectable, thermo-reversible and complex coacervate 556
combination gels for protein drug delivery. J. Controlled Release 2008, 127, (3), 249-256. 557
5. Bi-cheng, W.; Brian, D.; David Julian, M., Soft matter strategies for controlling food 558
texture: formation of hydrogel particles by biopolymer complex coacervation. Journal of 559
Physics: Condensed Matter 2014, 26, (46), 464104. 560
6. Schmitt, C.; Sanchez, C.; Desobry-Banon, S.; Hardy, J., Structure and technofunctional 561
properties of protein-polysaccharide complexes: A review. Critical Reviews in Food Science and 562
Nutrition 1998, 38, (8), 689-753. 563
7. Chapeau, A.-L.; Tavares, G. M.; Hamon, P.; Croguennec, T.; Poncelet, D.; Bouhallab, S., 564
Spontaneous co-assembly of lactoferrin and く-lactoglobulin as a promising biocarrier for vitamin 565
B9. Food Hydrocolloids 2016, 57, 280-290. 566
8. Tavares, G. M.; Croguennec, T.; Hamon, P.; Carvalho, A. F.; Bouhallab, S., Selective 567
coacervation between lactoferrin and the two isoforms of く-lactoglobulin. Food Hydrocolloids 568
2015, 48, 238-247. 569
9. Yan, Y.; Kizilay, E.; Seeman, D.; Flanagan, S.; Dubin, P. L.; Bovetto, L.; Donato, L.; 570
Schmitt, C., Heteroprotein complex coacervation: Bovine く-lactoglobulin and lactoferrin. 571
Langmuir 2013, 29, (50), 15614-15623. 572
10. Flanagan, S. E.; Malanowski, A. J.; Kizilay, E.; Seeman, D.; Dubin, P. L.; Donato-Capel, 573
L.; Bovetto, L.; Schmitt, C., Complex equilibria, speciation, and heteroprotein coacervation of 574
lactoferrin and く-lactoglobulin. Langmuir 2015, 31, (5), 1776-1783. 575
11. Kizilay, E.; Seeman, D.; Yan, Y.; Du, X.; Dubin, P. L.; Donato-Capel, L.; Bovetto, L.; 576
Schmitt, C., Structure of bovine -lactoglobulin-lactoferrin coacervates. Soft Matter 2014, 10, 577
(37), 7262-7268. 578
12. Peixoto, P. D. S.; Tavares, G. M.; Croguennec, T.; Nicolas, A.; Hamon, P.; Roiland, C.; 579
Bouhallab, S., Structure and dynamics of heteroprotein coacervates. Langmuir 2016, 32, (31), 580
7821-7828. 581
Page 32
31
13. Du, X.; Seeman, D.; Dubin, P. L.; Hoagland, D. A., Nonfreezing water structuration in 582
heteroprotein coacervates. Langmuir 2015, 31, (31), 8661-8666. 583
14. Anema, S. G.; de Kruif, C. G., Phase separation and composition of coacervates of 584
lactoferrin and caseins. Food Hydrocolloids 2016, 52, 670-677. 585
15. Anema, S. G.; de Kruif, C. G., Interaction of lactoferrin and lysozyme with casein 586
micelles. Biomacromolecules 2011, 12, (11), 3970-3976. 587
16. Anema, S. G.; de Kruif, C. G., Complex coacervates of lactotransferrin and beta-588
lactoglobulin. J. Colloid Interface Sci. 2014, 430, 214-220. 589
17. Nigen, M.; Croguennec, T.; Madec, M.-N.; Bouhallab, S., Apo g-lactalbumin and 590
lysozyme are colocalized in their subsequently formed spherical supramolecular assembly. FEBS 591
J. 2007, 274, (23), 6085-6093. 592
18. Nigen, M.; Croguennec, T.; Renard, D.; Bouhallab, S., Temperature affects the 593
supramolecular structures resulting from g-lactalbumin−lysozyme interaction. Biochemistry 594
2007, 46, (5), 1248-1255. 595
19. AOAC, Official methods of analysis of Association of Official Analytical Chemists In 596
Washington, DC, USA, 1995. 597
20. Patil-Sen, Y.; Sadeghpour, A.; Rappolt, M.; Kulkarni, C. V., Facile preparation of 598
internally self-assembled lipid particles stabilized by carbon nanotubes. J. Visualized Exp. 2016, 599
(108), e53489. 600
21. Barac, M.; Cabrilo, S.; Pesic, M.; Stanojevic, S.; Zilic, S.; Macej, O.; Ristic, N., Profile 601
and functional properties of seed proteins from six pea (Pisum sativum) genotypes. Int. J. Mol. 602
Sci. 2010, 11, (12), 4973-4990. 603
22. Mertens, C.; Dehon, L.; Bourgeois, A.; Verhaeghe-Cartrysse, C.; Blecker, C., 604
Agronomical factors influencing the legumin/vicilin ratio in pea (Pisum sativum L.) seeds. J. Sci. 605
Food Agric. 2012, 92, (8), 1591-1596. 606
23. Liu, S.; Low, N. H.; Nickerson, M. T., Effect of pH, salt, and biopolymer ratio on the 607
formation of pea protein isolate−gum arabic complexes. J. Agric. Food Chem. 2009, 57, (4), 608
1521-1526. 609
24. Qazvini, N. T.; Bolisetty, S.; Adamcik, J.; Mezzenga, R., Self-healing fish gelatin/sodium 610
montmorillonite biohybrid coacervates: Structural and rheological characterization. 611
Biomacromolecules 2012, 13, (7), 2136-2147. 612
25. Kizilay, E.; Kayitmazer, A. B.; Dubin, P. L., Complexation and coacervation of 613
polyelectrolytes with oppositely charged colloids. Adv. Colloid Interface Sci. 2011, 167, (1–2), 614
24-37. 615
Page 33
32
26. Gharsallaoui, A.; Cases, E.; Chambin, O.; Saurel, R., Interfacial and emulsifying 616
characteristics of acid-treated pea protein. Food Biophys 2009, 4, (4), 273-280. 617
27. Croguennec, T.; Tavares, G. M.; Bouhallab, S., Heteroprotein complex coacervation: A 618
generic process. Adv. Colloid Interface Sci. Accepted, In Press (10.1016/j.cis.2016.06.009). 619
28. Dubin, P. L.; Gao, J.; Mattison, K., Protein-Purification by Selective Phase-Separation 620
with Polyelectrolytes. Sep. Purif. Methods 1994, 23, (1), 1-16. 621
29. Bergmann, A.; Fritz, G.; Glatter, O., Solving the generalized indirect Fourier 622
transformation (GIFT) by Boltzmann simplex simulated annealing (BSSA). J. Appl. Crystallogr. 623
2000, 33, (5), 1212-1216. 624
30. Anderson, B. F.; Baker, H. M.; Dodson, E. J.; Norris, G. E.; Rumball, S. V.; Waters, J. 625
M.; Baker, E. N., Structure of human lactoferrin at 3.2-A resolution. Proc. Natl. Acad. Sci. U. S. 626
A. 1987, 84, (7), 1769-1773. 627
31. Grossmann, J. G.; Neu, M.; Pantos, E.; Schwab, F. J.; Evans, R. W.; Townes-Andrews, 628
E.; Lindley, P. F.; Appel, H.; Thies, W.-G.; Hasnain, S. S., X-ray solution scattering reveals 629
conformational changes upon iron uptake in lactoferrin, serum and ovo-transferrins. J. Mol. Biol. 630
1992, 225, (3), 811-819. 631
32. Welland, M. E.; Miles, M. J.; Lambert, N.; Morris, V. J.; Coombs, J. H.; Pethica, J. B., 632
Structure of the globular protein vicilin revealed by scanning tunnelling microscopy. Int. J. Biol. 633
Macromol. 1989, 11, (1), 29-32. 634
33. Mession, J.-L.; Sok, N.; Assifaoui, A.; Saurel, R., Thermal denaturation of pea globulins 635
(Pisum sativum L.)—Molecular interactions leading to heat-induced protein aggregation. J. 636
Agric. Food Chem. 2013, 61, (6), 1196-1204. 637
34. Plietz, P.; Zirwer, D.; Schlesier, B.; Gast, K.; Damaschun, G., Shape, symmetry, 638
hydration and secondary structure of the legumin from Vicia faba in solution. Biochim. Biophys. 639
Acta, Protein Struct. Mol. Enzymol. 1984, 784, (2), 140-146. 640
35. I'Anson, K. J.; Miles, M. J.; Bacon, J. R.; Carr, H. J.; Lambert, N.; Morris, V. J.; Wright, 641
D. J., Structure of the 7S globulin (vicilin) from pea (Pisum sativum). Int. J. Biol. Macromol. 642
1988, 10, (5), 311-317. 643
36. Dmitri, I. S.; Michel, H. J. K., Small-angle scattering studies of biological 644
macromolecules in solution. Rep. Prog. Phys. 2003, 66, (10), 1735. 645
37. Pastré, D.; Piétrement, O.; Fusil, S.; Landousy, F.; Jeusset, J.; David, M.-O.; Hamon, L.; 646
Le Cam, E.; Zozime, A., Adsorption of DNA to mica mediated by divalent counterions: A 647
theoretical and experimental study. Biophys. J. 2003, 85, (4), 2507-2518. 648
38. Kaibara, K.; Okazaki, T.; Bohidar, H. B.; Dubin, P. L., pH-Induced coacervation in 649
complexes of bovine serum albumin and cationic polyelectrolytes. Biomacromolecules 2000, 1, 650
(1), 100-107. 651
Page 34
33
39. Liberatore, M. W.; Wyatt, N. B.; Henry, M.; Dubin, P. L.; Foun, E., Shear-induced phase 652
separation in polyelectrolyte/mixed micelle coacervates. Langmuir 2009, 25, (23), 13376-13383. 653
654
655
Page 35
34
TABLE OF CONTENTS (GRAPHIC) 656
657
658


![Conductometric Study of Complex Formation Between Cu(II) Ion …downloads.hindawi.com/journals/jchem/2008/364510.pdf · Conductometric Study of Complex Formation 553 where [ML +],](https://static.documents.pub/doc/80x56/5e6821b14cfdc3147d3edc6d/conductometric-study-of-complex-formation-between-cuii-ion-conductometric-study.jpg)


