Heuristic evaluation: Comparing ways of finding and reporting usability problems Ebba Thora Hvannberg a, * , Effie Lai-Chong Law b , Marta Kristı ´n La ´rusdo ´ ttir c a University of Iceland, Hjardarhaga 2-6, 107 Reykjavik, Iceland b Eidgeno ¨ ssische Technische Hochschule Zu ¨ rich Gloriastrasse 35, CH-8902, Zu ¨ rich, Switzerland c Reykjavik University, Ofanleiti 2, 103 Reykjavik, Iceland Received 28 June 2005; received in revised form 29 August 2006; accepted 11 October 2006 Available online 1 December 2006 Abstract Research on heuristic evaluation in recent years has focused on improving its effectiveness and efficiency with respect to user testing. The aim of this paper is to refine a research agenda for comparing and contrasting evaluation methods. To reach this goal, a framework is presented to evaluate the effectiveness of different types of support for structured usability problem reporting. This paper reports on an empirical study of this framework that compares two sets of heuristics, Nielsen’s heuristics and the cognitive principles of Gerhardt-Pow- als, and two media of reporting a usability problem, i.e. either using a web tool or paper. The study found that there were no significant differences between any of the four groups in effectiveness, efficiency and inter-evaluator reliability. A more significant contribution of this research is that the framework used for the experiments proved successful and should be reusable by other researchers because of its thorough structure. Ó 2006 Elsevier B.V. All rights reserved. Keywords: User interface; Heuristic evaluation; Reporting; Web tool; Effectiveness; Efficiency; Comparison framework 1. Introduction Since the early 1990s, researchers have carried out stud- ies comparing and contrasting some of the methods brought forward to uncover usability problems of interac- tive computer systems, (Desurvire et al., 1992; Holzinger, 2005; Jeffries et al., 1991; Karat et al., 1992). Current research on usability evaluation clearly searches for meth- ods that produce beneficial results for users and developers alike at low cost in an ever-increasing competitive industry. In this paper, we report a case study of a framework for validating the use of usability evaluation methods and of problem registration tools and other support for enabling structured usability problem reporting. The focus is on refining a research agenda for comparing and contrasting evaluation methods. In the case study, the number and the seriousness of problems found per evaluator in heuris- tic evaluation, with two different sets of usability heuristics: Nielsen’s heuristics and the cognitive principles of Ger- hardt-Powals (Gerhardt-Powals, 1996), were compared. Furthermore, two different ways of reporting usability problems, on paper and with the help of a web tool, are compared to the results found in user testing. The case study thus serves as an example of how the framework can be used. 1.1. Tool vs. paper In our previous empirical studies on heuristic evaluation (Law and Hvannberg, 2004a), evaluators complained that 0953-5438/$ - see front matter Ó 2006 Elsevier B.V. All rights reserved. doi:10.1016/j.intcom.2006.10.001 Abbreviations: AE, actual efficiency; DV, dependent variable; HE, heu- ristic evaluation; ICT, Information and Communication Technology; IV, independent variable; PUP, predicted usability problems; SUPEX, Struc- tured Usability Problem EXtraction; SUS, System Usability Scale; UAF, User Action Framework; UP, usability problem; UT, user test. * Corresponding author. Tel.: +354 525 4702; fax: +354 525 4937. E-mail addresses: [email protected] (E.T. Hvannberg), [email protected](E.L.-C. Law), [email protected] (M.K. La ´rusdo ´ ttir). www.elsevier.com/locate/intcom Interacting with Computers 19 (2007) 225–240
Transcript
Heuristic evaluation: Comparing ways of finding and reportingusability problems
Ebba Thora Hvannberg a,*, Effie Lai-Chong Law b, Marta Kristın Larusdottir c
a University of Iceland, Hjardarhaga 2-6, 107 Reykjavik, Icelandb Eidgenossische Technische Hochschule Zurich Gloriastrasse 35, CH-8902, Zurich, Switzerland
c Reykjavik University, Ofanleiti 2, 103 Reykjavik, Iceland
Received 28 June 2005; received in revised form 29 August 2006; accepted 11 October 2006Available online 1 December 2006
Abstract
Research on heuristic evaluation in recent years has focused on improving its effectiveness and efficiency with respect to user testing.The aim of this paper is to refine a research agenda for comparing and contrasting evaluation methods. To reach this goal, a frameworkis presented to evaluate the effectiveness of different types of support for structured usability problem reporting. This paper reports on anempirical study of this framework that compares two sets of heuristics, Nielsen’s heuristics and the cognitive principles of Gerhardt-Pow-als, and two media of reporting a usability problem, i.e. either using a web tool or paper. The study found that there were no significantdifferences between any of the four groups in effectiveness, efficiency and inter-evaluator reliability. A more significant contribution ofthis research is that the framework used for the experiments proved successful and should be reusable by other researchers because of itsthorough structure.� 2006 Elsevier B.V. All rights reserved.
Keywords: User interface; Heuristic evaluation; Reporting; Web tool; Effectiveness; Efficiency; Comparison framework
1. Introduction
Since the early 1990s, researchers have carried out stud-ies comparing and contrasting some of the methodsbrought forward to uncover usability problems of interac-tive computer systems, (Desurvire et al., 1992; Holzinger,2005; Jeffries et al., 1991; Karat et al., 1992). Currentresearch on usability evaluation clearly searches for meth-ods that produce beneficial results for users and developersalike at low cost in an ever-increasing competitive industry.
In this paper, we report a case study of a framework forvalidating the use of usability evaluation methods and ofproblem registration tools and other support for enablingstructured usability problem reporting. The focus is onrefining a research agenda for comparing and contrastingevaluation methods. In the case study, the number andthe seriousness of problems found per evaluator in heuris-tic evaluation, with two different sets of usability heuristics:Nielsen’s heuristics and the cognitive principles of Ger-hardt-Powals (Gerhardt-Powals, 1996), were compared.Furthermore, two different ways of reporting usabilityproblems, on paper and with the help of a web tool, arecompared to the results found in user testing. The casestudy thus serves as an example of how the frameworkcan be used.
1.1. Tool vs. paper
In our previous empirical studies on heuristic evaluation(Law and Hvannberg, 2004a), evaluators complained that
0953-5438/$ - see front matter � 2006 Elsevier B.V. All rights reserved.
doi:10.1016/j.intcom.2006.10.001
Abbreviations: AE, actual efficiency; DV, dependent variable; HE, heu-ristic evaluation; ICT, Information and Communication Technology; IV,independent variable; PUP, predicted usability problems; SUPEX, Struc-tured Usability Problem EXtraction; SUS, System Usability Scale; UAF,User Action Framework; UP, usability problem; UT, user test.
reporting problems on paper was cumbersome and time-consuming. This motivated us to attempt to improve theevaluation method by providing evaluators with a webtool. We wanted to improve the problem descriptions withfurther characterization of usability problems, such as con-text, cause, severity and relevant usability heuristics. Theultimate goal is to advance the validity of predictive meth-ods, such as heuristic evaluation, with respect to user test-ing. In other words, to try to predict serious problems sothat they are corrected in revisions of the user interfaceand to try to minimize the number of serious problemsfalsely predicted. We can reason that reporting usabilityproblems using a software tool may help due to the follow-ing qualities:
• More accessible explanation of usability heuristics alongwith concrete examples.
• Easier to search, review, modify problem descriptionsand link to relevant material (Gladwell, 2002).
• Faster entry of usability problems, thus making it moreefficient.
In addition, the following may improve immediate man-agement of usability problems:
• Merging of problem sets from different evaluators to geta unique set of problems.
• Measuring reliability of usability problems, i.e. whetherone or more evaluators report them.
• Prioritizing usability problems according to impact, e.g.severity and cost of removal; tracking them throughrevisions, etc.
• Locating problematic contexts or tasks in the applica-tion, followed by designing task scenarios for user teststo evaluate these problems.
• Associating problems with previously proven patterns ofsolutions.
On the other hand, a software tool can have a negativeeffect on the usability problem reporting:
• Switching back and forth between the application beingtested and the software tool can decrease the sense ofcontext in the application for the evaluator. On theother hand, users frequently use a number of softwareapplications in their work so such context-switching iscommon.
• More noise in the problem descriptions because of easyreporting, i.e. more False Alarms.
• Bias towards certain values in classification because ofdefault values or order of values presented in menus.
So far, only a few software tools have been developed tosupport usability problem analysis, classification andreporting. A tool to assist evaluators with cognitive walk-through and to record the results has been shown toimprove the evaluation process over paper walkthrough
(Rieman et al., 1991). The User Action Framework(UAF) (Andre et al., 2001) has a number of tools, includ-ing a usability design guide to be used during interactiondesign and usability lab testing, usability problem inspectorto be used during formative evaluation, usability problemclassifier and usability problem database. This databasecan provide valuable input to project management, solu-tions to problems, guidelines and relevant on-line litera-ture. Emerging holistic frameworks, such as UAF, whichcan potentially support evaluators in using more thanone method, can prepare them with appropriate training,help them with analysis, problem tracking and manage-ment. To the best of our knowledge, there has not beenany empirical study, which compares the effectiveness ofpaper-based vs. tool-based usability problem reporting.
1.2. Nielsen vs. Gerhardt-Powals
Numerous sets of heuristics can be applied during heu-ristic evaluation (Folmer and Bosch, 2004). Many of themhave common factors, such as consistency, task match,appropriate visual presentation, user control, memory-loadreduction, error handling and guidance and support. Niel-sen’s heuristics have resulted from studies of practicalapplications in various contexts (Nielsen, 1993; Nielsenand Molich, 1990) but there is a lack of a sound theoreticalframework to explain how they work. The less well-knownprinciples, which were put forward by Gerhardt-Powals(1996), and are based on situation awareness and cognitivetheory, have proven useful in a dynamic application suchas anti-submarine warfare. Nielsen’s heuristics are synthe-sized from a number of guidelines. Alternative sets ofusability heuristics have been developed and tested. Mostof the heuristics are design guidelines and refer to the sys-tem’s user interface, and only a few heuristic sets are basedon the understanding of user cognition (cf. Norman’s the-ory of action model (Norman, 1986)) or situation aware-ness. Gerhardt-Powals put forward a set of guidelinesbased on cognitive principles. These guidelines are basedon theory, but have not been adequately evaluated in prac-tice. Specifically, we hypothesize that principles derivedfrom cognitive engineering, which are strongly rooted intheories of cognitive psychology and other related disci-plines, can well serve as a promising tool for heuristicevaluation.
Several factors, besides the set of usability heuristics,can influence the performance of heuristic evaluation,such as evaluator training, evaluator knowledge of theapplication domain, task coverage, problem extraction/description, merging, etc. A number of attempts havebeen carried out to improve heuristic evaluation, includ-ing the inspective, descriptive and analytical part. Toimprove the descriptive and the analytical part, Cocktonand Woolrych (2001) have suggested a problem-reportingform and a way to analyse more accurately researchprocedures which can accurately count the number ofproblems discovered.
226 E.T. Hvannberg et al. / Interacting with Computers 19 (2007) 225–240
Evaluator’s selection of tasks is an important part of auser test. Model-based evaluation has supported this inpart, for example, by letting a task model guide the evalu-ator through the application. As most surveys (Rosenbaumet al., 2000) on usability methods indicate, practitionersapply more than one method, some of which are orthogo-nal to one another, such as paper prototyping and heuristicevaluation, and some of which complement one anotherlike expert reviews and user testing. The discount usabilityengineering method (Nielsen, 1993, p. 17) uses four tech-niques: user and task observation, scenarios, simplifiedthinking aloud and heuristic evaluation. Nielsen (1994b,p. 58) suggests that there are two major reasons for alter-nating between heuristic evaluation and user testing. First,heuristic evaluation does not require users, who can behard to get, and can be used initially to rinse out a numberof usability problems. Second, a number of studies haveshown that the two methods, heuristic evaluation and usertesting, find distinct sets of problems. Frøkjær andLarusdottir (1999) conducted an empirical study, whichshowed that performing heuristic evaluation (HE) priorto user tests on the same system could somehow helpnon-expert evaluators uncover more usability problems inuser testing, especially the severe ones. Such observationwas derived from comparing the results of the two usertests, which were performed with and without doing HEbeforehand. Besides, this combination of evaluation meth-ods could eliminate one of the most important weaknessesof HE when used by non-experts, the proneness to address-ing many false problems.
1.3. Task selection
One reason for a large number of predicted problemsbeing False Alarms, i.e. not confirmed in user testing, isthat users may not have been instructed to carry out theappropriate tasks and their set of tasks covered differentcontexts from the contexts that evaluators visited duringheuristic evaluation. Thus, the issue of coverage of theapplication is of concern, when applying user tests to vali-date heuristic evaluation by comparing the respective listsof usability problems generated by these two UEMs(Usability Evaluation Methods). In heuristic evaluation,the portion of the application covered is up to the evalua-tor, especially if he/she is given total freedom of whataspects to cover. In a study of discovery methods, Cocktonet al. (2003b) report that most evaluators choose to use sys-tem-searching or system-scanning more often than goal-playing and method-following. In a think-aloud user-test-ing, the coverage is influenced by the set of tasks presentedto the user. Comparing two independent usability problemsets from two UEMs has drawbacks. An evaluator maypredict problems that are miscoded as False Alarms sincea user never had an opportunity to see them during usertesting because he or she did not visit that part of the appli-cation (Cockton and Woolrych, 2001; Cockton et al.,2003b, 2004; Woolrych et al., 2004). Cockton and Wool-
rych (2001) suggest to systematically derive task sets foruser testing from the initial set of predicted problems iden-tified in heuristic evaluation so as to increase the power ofuser testing for exposing all predicted problems that reallyexist, i.e. eliminating instances of ‘genuine’ False Alarms.Another reason for the small overlap of predicted and actu-al usability problems is that the predicted problems statecauses of problems but usability problems reported duringuser testing are frequently described as effects on the users(Cockton and Woolrych, 2001; Doubleday et al., 1997).
In view of the above discussion, we put forward in thispaper the following research questions:
1.3.1. Tool vs. Paper
Do we achieve benefits in increased effectiveness, effi-ciency and inter-evaluator reliability in terms of a highernumber of real usability problems in a shorter period byusing a software tool to report predicted problems overusing paper?
1.3.2. Nielsen vs. Gerhardt-Powals
Are Gerhardt-Powals’ cognitive engineering principlesmore effective than Nielsen’s usability heuristics in enablingevaluators to identify a higher number of real usabilityproblems (higher validity) in a shorter time (higherefficiency)?
1.3.3. Task selection
Can the validity of heuristic evaluation be increased byusing the set of usability problems so identified to guidethe task selection of user tests whose results are in turn usedto validate the outcomes of heuristic evaluation?
2. Materials and methods
Two experiments are described in this paper. A web por-tal called EducaNext (www.educanext.org) was evaluatedin both experiments. In the first experiment, the portalwas evaluated with heuristic evaluation with two sets ofusability heuristics and two ways of reporting usabilityproblems. In a two by two between-subject experimentaldesign involving five evaluators in each of four cells,labelled A–D, we collected qualitative and quantitativedata of predicted usability problems discovered duringheuristic evaluation. The four groups are A, C (Nielsenheuristics), B, D (Gerhardt-Powals principles), where Aand B used paper forms and C and D used the web toolfor problem reporting.
Next, 8 task scenarios were designed based on the resultsfrom heuristic evaluation. In the second experiment, Edu-caNext was evaluated in user tests with 10 participantssolving the task scenarios to check how many of the pre-dicted usability problems (PUP) reported during heuristicevaluation were experienced by users as real problems(UP). We describe in detail how the predicted usabilityproblems are filtered and matched with the usability prob-lems discovered in the user test. The task selection process
E.T. Hvannberg et al. / Interacting with Computers 19 (2007) 225–240 227
for the user test is also described. The two experiments aredescribed subsequently and an overview of the workflow isgiven in Fig. 1.
2.1. Heuristic evaluation
Members of higher education, research organizationsand professional communities share, retrieve and reuselearning resources in a web portal, called EducaNext. Edu-caNext fosters collaboration among educators andresearchers, allowing them to participate in knowledgecommunities; communicate with experts in their field; toexchange learning resources; to work together on the pro-duction of educational material e.g. textbooks, lecturenotes, case studies and simulations; to deliver distributededucational activities: lectures, courses, workshops andcase study discussions and to distribute electronic contentunder license. Nineteen Computer Science students in theirfinal year of their BS-degree studies and one BS Computer
Science graduate evaluated EducaNext using heuristic eval-uation (HE). They had good knowledge of usability evalu-ation but little practice. Ten evaluators evaluated the portalusing heuristics from Nielsen (1993), and 10 using heuris-tics from Gerhardt-Powals (1996) as a basis for the heuris-tic evaluation. Furthermore, usability problems werereported in two ways, 10 evaluators used a paper formand 10 used a web tool specially made for reporting prob-lems for heuristic evaluation. Hence, there were five evalu-ators in each of the four groups, as seen in Table 1. Insummary, two independent variables are Medium ofReporting (Paper vs. Tool) and Set of Heuristics (Nielsenvs. Gerhardt-Powals). A 2 · 2 between-subject factorialdesign was employed.
All evaluators were asked to evaluate EducaNext inde-pendently. They received email containing a checklist ofthe activities they were asked to perform. The instructionsincluded a pre-evaluation questionnaire, a post-evaluationquestionnaire, and an introduction material in a digital
Fig. 1. Workflow of experiment.
228 E.T. Hvannberg et al. / Interacting with Computers 19 (2007) 225–240
audio-file and slides including: (a) guidelines for the proce-dure of the evaluation; (b) introduction to the heuristicevaluation; (c) introduction to the EducaNext system and(d) introduction to the reporting of the usability problems.In the post-evaluation questionnaire, evaluators wereasked to report the time spent, in hours, on the evaluation,and were asked to give a list of facilitators and hindrancesof the heuristic evaluation method that they had applied.
2.2. Medium of reporting
Evaluators reported the usability problems in one of twoways, using a web tool (see Fig. 2) or on a paper form. Astructured problem report format adapted from Cocktonand Woolrych (2001) was used to report seven attributesof each predicted usability problem (PUP) (Table 2). Note-worthy is that the use of the structured problem report for-mat can improve the reliability of merging PUPs and thereliability of matching predicted to actual problems (Cock-ton et al., 2003a), thereby increasing the overall internalvalidity of the usability evaluation results. The same attri-butes were reported on paper and with the tool, and thedesign of the forms on both media was similar. Heuristicsused and severity rate were selected with combo boxesand a default value was given in both cases. Examplesfor reporting problems were provided on paper for thepaper form, but in the web tool, evaluators could get helpon attributes and a complete example usability problem. Alist of all the heuristics and a list of the levels of severity,with further explanations via tooltips, were given in thetool, but the evaluators using the paper form were encour-aged to print these out and have in front of them duringevaluation.
The people using the web tool for reporting problemsreceived a short introduction to the tool. They were recom-mended to use two computers, one for keeping EducaNextmaximized and a laptop for reporting the usability prob-lems in parallel.
2.3. Translating predicted problems into task scenarios
According to Cockton et al. (2003a), usability inspectionmethods (UIMs), such as heuristic evaluation, can serve as‘discovery resource’ for user testing, which are designed tofocus on potential problems predicted by UIMs, therebyimproving construct validity (Gray and Salzman, 1998).Furthermore, Cockton and his colleagues (2004) demon-strate how UIM predicted problems could be translatedinto task scenarios of user testing. As the goal of falsifica-tion testing is to maximize confidence in false positive cod-ing, definition of task sets for user tests shouldsystematically be derived from UIM analysts’ predictions.A task definition methodology essentially consists of threeprocedures: processing predictions, translating predictionsinto tasks, and verifying tasks against predictions. Here,we delineate how these three procedures have been imple-mented in our studies.
2.3.1. Processing PUPs
A usability specialist (E1), who is highly knowledgeableabout the system tested, first examined closely each of thePUPs discovered by individual evaluators to discard with-in-evaluator duplicate or incomprehensible PUP descrip-tions. Then, E1 applied the ‘problem reduction method’described in Connell and Hammond (1999) to filter outany overlapping PUPs to generate a list of unique PUPs.E1 then grouped these PUPs according to the attribute‘Specific Context’ in the standard problem report form(Table 2), resulting in 15 groups, e.g. ‘Access Content’,‘Advanced Search’, ‘Simple Search’, ‘Browse Catalogue’,‘Content Provision’, ‘Left Navigation Bar’, etc.
2.3.2. Translating PUPs
With reference to her experiences about the usages ofthe system, E1 assessed the severity of individual PUPsand prioritized them within each group. PUPs with highpriority were translated into task scenarios by abstractingthe actions leading to their discovery (cf. the attribute‘Short Description’ in the structured problem report).
Table 1The experimental design of the Heuristic Evaluation
Nielsen Gerhardt-Powals
Paper Group A: 5 novice evaluators Group B: 5 novice evaluatorsTool Group C: 5 novice evaluators Group D: 5 novice evaluators
Fig. 2. User interface of a web tool for reporting usability problems.
Table 2Structured problem report format (adapted from Cockton and Woolrych(2001))
1. A numeric identifier of the problem2. A short description of the problem3. Likely difficulties for the user4. Specific context (the location of the problem in the interface)5. Possible causes of the problem (what is wrong in the design)6. The heuristic(s) used7. The severity rate, containing 3 levels: severe, moderate and minor
E.T. Hvannberg et al. / Interacting with Computers 19 (2007) 225–240 229
Caution was exercised to avoid over-constraining a user’saction with too detailed task descriptions. As the 15 groupsof PUPs are somewhat interrelated, one task scenario canaddress more than one group of PUPs. Finally, eight taskscenarios (Table 3) with a set of sub-tasks addressing differ-ent PUPs were developed.
2.3.3. Verifying task scenarios
It was critical to check the coverage of the task scenariosto see whether any significant PUPs were left out from fur-ther validation. Another usability specialist (E2) mappedeach of the unique PUPs against the eight task scenariosand found that 15 PUPs were not covered by any of thescenarios. E1 repeated the same mapping exercise and iden-tified two mapped cases that E2 interpreted differently. E1and E2 then negotiated to assess the relevance of the omit-ted PUPs. Consequently, they decided to ignore eight ofthese PUPs, which were highly situational (e.g. dependingon the type of the content that the user retrieved fromthe portal) or trivial, and incorporated the other five intothe existing task scenarios.
2.4. User tests
The user tests (UT) were conducted to find out howmany of the predicted problems reported by the evaluatorsusing the heuristic evaluation were real problems for users.The task sets for the user tests were derived from the resultsof the heuristic evaluation, asking the users to use thosefeatures of EducaNext that were found to be problematicin the heuristic evaluation (Section 2.3). This method wasadopted to increase the power of the user tests for validat-ing the predicted usability problems.
Ten participants (P1, . . ., P10) were asked to solve eighttasks (Table 3) while thinking aloud. First, the participantsanswered a pre-test questionnaire about their personal andtechnical background. Then, they solved the task scenariosone by one and answered a so-called ‘After Scenario Ques-tionnaire’ (Lewis, 1991) in between measuring their subjec-tive satisfaction about that task. Everything that happenedon the screen was captured using a screen capture tool anda web camera was used to record both sound and video ofthe session. After completing the eight tasks, the users wereasked to answer a post-test questionnaire SUS (SystemUsability Scale) (Brooke, 1996) measuring their subjectivesatisfaction about EducaNext as a whole. SUS has been
proved a robust, reliable, and low-cost usability assessmenttool that is widely used in industry. The 10 participantswere all university staff, either professors or administrators.There were five males and five females. Two participantswere in their thirties, seven participants were in their fortiesand one in her fifties. The average ICT (Information andCommunication Technology) competence was self-assessedat 3.5 (out of 5, N = 10) (SD = 0.97). Participants reportedan average of 3.5 (out of 5, N = 10) grade when askedabout experience in e-learning (SD = 1.27). Seven of theparticipants had developed or organized online learningcontent.
An experimenter observed the users unobtrusively, inthe same room, while they were performing the task scenar-ios. For each task, she reported the user’s performance(start-time, end-time, number and type of errors, instanceand type of help seeking, instance of expressed frustration),comments and problems with a template on a laptop. Theexperimenter checked these data against the screen cap-tures and audio recordings to ensure their accuracy.
2.5. Problem extraction, filtering and matching procedures
The inability to expose all actual problems is recognizedas an inherent limitation of user testing. Notwithstanding,user test results are employed to validate UIMs. Errors ingenerating a set of actual problems, identified in user tests,may lead to miscoding predicted problems as False Alarms.The SUPEX (Structured Usability Problem EXtraction)method (Cockton and Lavery, 1999) addresses this issueof problem extraction. However, the usability of thismethod, especially the learnability, is questionable becauseof its involved stages and sub-stages. The efficiency ofapplying SUPEX appears low, given the time-consumingprocesses such as segmentation, transcription and coding.The cost-effectiveness of the method is not clear. Depend-ing on the budgetary constraint and other contextual fac-tors, stages and sub-stages of SUPEX can be skipped.What is left, when stripping the method to its core ele-ments, will be a common approach to problem extraction,which is more or less the same as the one adopted in thecurrent study. Such flexibility in applying the methodmakes it difficult to decide between SUPEX and non-SUPEX, and to prove its claimed advantages. The compre-hensive assessment and development of SUPEX is yet to bedone, especially its usability and reliability. Consequently,we relied on the traditional approach to problem extractionfrom the user tests.
The usability specialist E1, who has performed severaluser tests on different versions of EducaNext, became veryknowledgeable about the system, which was vital for effec-tive and efficient problem extraction. Specifically, shereferred to the conventional definition of usability problemto guide the extraction task, namely:
‘‘Simply stated, a usability problem is any aspect of a user
interface that is expected [or observed] to cause users
Table 3List of eight tasks for the user-test
Task 1: Apply for an EducaNext Portal User AccountTask 2: Login and Edit User PreferencesTask 3: Browse the Catalogue of the EducaNext PortalTask 4: Simple SearchTask 5: Advanced SearchTask 6: Check the Booking HistoryTask 7: Create and Join an EducaNext CommunityTask 8: Provide and Offer Educational Material
230 E.T. Hvannberg et al. / Interacting with Computers 19 (2007) 225–240
problems with respect to some salient usability measure
isfaction) and that can be attributed to a single design
aspect’’ (Nielsen, 1993, p. 388), [our addition].
For individual users, E1 derived a list of usability prob-lems from their think-aloud protocols and from the exper-imenter’s detailed observation notes. Furthermore, the 10lists of usability problems were merged and the overlappingones filtered out. Problem instances rather than problemtypes were counted (John and Mashyna, 1997). In otherwords, the same problem identified in two different con-texts would be counted as occurring twice rather than once.Observed UPs were recorded in the same structured reportformat used for PUPs, sharing the same set of attributes,including Identifier, Users/Evaluators Involved, Descrip-tion, Context, Severity and Frequency, thereby facilitatingthe matching task.
In addition, E1 devised a so-called two-way mappingprocedure (forward- and backward-matching) for validat-ing the PUPs of heuristic evaluation against the UPs ofuser tests. First, we took PUP1 and mapped it to each ofthe 58 UPs; then repeated the same procedure for PUP2up to PUP85. Then, we took the UP1 and mapped it toeach of the 85 PUPs; then repeated the same procedurefor the remaining UPs. With this approach, the reliabilityof the mapping results could be enhanced, though it wastedious and time-consuming. Fig. 1 illustrates the afore-mentioned procedures.
3. Results
In the following three subsections, we report on theresults of the heuristic evaluation experiment, user testsand the validity and thoroughness of heuristic evaluationcompared to the user tests after the usability problems ofthe two experiments have been filtered and compared.We, thus, report how well the evaluators conducting heu-ristic evaluation were able to predict usability problemsreported by the users. Finally, we compare two and twogroups together, i.e. on the one hand, those that applyNielsen vs. Gerhardt-Powals and those applying paper vs.tool, on the other hand. To compare the different groups,we calculated the thoroughness, validity and efficiency ofthe evaluation. The any-two-agreement measures of theevaluators (Hertzum and Jacobsen, 2001) within thegroups were evaluated.
3.1. Data analysis from heuristic evaluation
During heuristic evaluation, there were altogether 160predicted usability problems (PUPs) reported by 20 evalu-ators. Note that no PUP was reported by B1 (see Table 4).Groups A, B, C and D reported 33, 37, 43 and 47 PUPs,respectively. v2 test showed that there were no significantdifferences in the number of PUPs between the four groups.Examining means of the four groups revealed that there
was close to significant difference at the 0.05 level in thenumber of PUPs between Group A and Group C(t = 2.21, df = 8, p = 0.06), i.e. between paper and tool reg-istration when using the Nielsen’s heuristics, but no differ-ence when using the Gerhardt-Powals’ principles.
Note that B1, who apparently was not motivated for thegiven task, uncovered zero PUPs. When that subject wasremoved from the population, analysis further showed thatthere was significant difference in the number of PUPsbetween Group A and Group B (t = �2.62, df = 7,p = 0.04), i.e. between Nielsen and Gerhardt-Powals whenusing paper for problem reporting, with the latter discover-ing more usability problems than the former.
A usability specialist examined each of the PUPs anddiscarded 12 of them, which were reported more than onceby the same participant or were found to be incomprehen-sible. Consequently, 148 out of the original 160 PUPs wereconsolidated to eliminate any duplicate (Section 3.2), usingthe procedure described in Connell and Hammond (1999).This exercise filtered out duplicates and led to a list of 85unique instances of PUPs, on which the design of task sce-narios of a user test (UT) were based; these PUPs were val-idated by the results of the user test thus developed (seebelow).
Hertzum and Jacobsen (2001) developed a metric knownas ‘‘Any-Two Agreement’’ (see Eq. 1) to estimate inter-evaluator reliability, i.e. the probability that a particularusability problem is identified by more than one evaluator.This measure is supposed to be more accurate than the con-ventional method of using simple problem discovery rate(p), which can be much inflated when a sample size is small.
Any-two-agreement ¼ Average of jP i \ P jj=jP i [ P jj ð1Þover all 1/2 n (n � 1) pairs of users, where Pi and Pj are thesets of UPs identified by useri and userj, and n is the num-ber of users.
We computed Any-two-agreement for all the 20 evalua-tors of heuristic evaluation as a whole, for each of the fourgroups and for a combination of the groups sharing a com-mon feature. The overall Any-two-agreement for the 20evaluators was 0.043 (or 0.046 for the 19 evaluators exclud-ing B1). The results are shown in Table 5, with the numbersin parentheses including evaluator B1.
Table 4Number of predicted usability problems (PUPs) per evaluator in eachgroup
Nielsen Heuristics
Paper ID A1 A2 A3 A4 A5 M = 6.6PUPs 6 5 6 9 7 SD = 1.4
Tool ID C1 C2 C3 C4 C5 M = 8.6PUPs 10 10 8 8 7 SD = 1.2
Gerhardt-Powals PrinciplesPaper ID B1 B2 B3 B4 B5 M = 7.4
PUPs 0 10 8 8 11 SD = 3.9Tool ID D1 D2 D3 D4 D5 M = 9.4
PUPs 4 8 11 13 11 SD = 3.1
E.T. Hvannberg et al. / Interacting with Computers 19 (2007) 225–240 231
The overall inter-evaluator reliability was very low, or0.046, in comparison with the average Any-two-agreementvalue of 0.101 within the group of user-test participants.The low reliability can be attributed to the heterogeneousbackgrounds of the evaluators, especially their experienceand knowledge of usability evaluation and of the domainof the system evaluated (i.e. e-learning). Besides, the twoindependent variables (i.e. set of heuristics and type ofmedium for problem reporting) had certain effects on thenature and number of usability problems identified. Fur-thermore, the differences between the groups were not sta-tistically significant. Group C showed the highest level ofagreement. It may be explained by the two factors: theevaluators’ familiarity with Nielsen’s heuristics and thefacilitating effect of the tool. Nonetheless, due to the smallnumber of participants, these assumptions cannot beconfirmed.
After coding the qualitative data on facilitators and hin-drances the evaluators mentioned, we obtained the resultslisted in Table 6. It is interesting to note that the heuristicset was considered as both a facilitator (n = 6) and a hin-drance (n = 7), and that Gerhardt-Powals’ were perceivedas more hindering than were Nielsen’s. This finding raisesthe issue whether evaluators, without being given anyguidelines (i.e. control), could outperform those with anyof the two sets. At least two studies, comparing guidelinesto a control group, where the control group does not relyon any guidelines but only their own knowledge, have beenperformed in the past (Bastien et al., 1999; Connell andHammond, 1999). In the study by Bastien et al. (1999),where median number of usability problems uncoveredby the participants was used as a metric, the control andthe ergonomic criteria groups differed significantly, withthe latter uncovering more problems but also spendingmore time on the evaluation. In the same study, significantdifferences did not appear between the control group and agroup using ISO/DIS 9241-10 dialogue principles. In thestudy by Connell and Hammond (1999), where Nielsen’s
heuristics and a set of 30 principles were compared to acontrol group, no significant differences were foundbetween the conditions for a group of novices. That moreevaluators perceived training as a facilitator than a hin-drance implies that the training given was somewhat effec-tive and desirable. Three of the 20 evaluators thought thatthey did not have enough time to evaluate the application.This may indicate that the task was more time-consumingthan they expected and could have been broken down tomore than one assignment. It raises the question whetherthe number of usability problems discovered is highlydependent on the amount of time spent. The Pearson cor-relation showed that there is a moderate relationshipbetween the two variables (r = 0.48, p = 0.03).
3.2. Analysis of usability problems from the user tests
There were altogether 125 unconsolidated usabilityproblems (UPs) experienced by the 10 participants in usertesting. The average number of problems reported per par-ticipant during user testing was M = 12.5, SD = 4.2,N = 10, which was higher than that of heuristic evaluation(M = 8.0, SD = 2.9, N = 20).
Because of the filtering procedure, a list of 58 UPs wasproduced, of which 10 were severe, 27 were moderate and21 were minor. Besides, only one participant experienced24 of these 58 UPs and six participants experienced onlyone UP, which was severe (see Fig. 3). This list was usedto validate the PUPs reported in heuristic evaluation.
The average problem discovery rate (p) over the 10 par-ticipants was 0.22, which was not particularly high. Inother words, at least seven users were required to identify80% of the discoverable UPs (cf. the assumption of ‘‘MagicNumber 5’’ (Barnum, 2003) – five users can yield 80% ofthe findings from a usability test – also supported by Niel-sen (2000) and other human factors engineer (e.g. Virzi,1992) – but questioned by several researchers (Faulkner,2003; Law and Hvannberg, 2004b; Spool and Schroeder,2001; Woolrych and Cockton, 2001)). Furthermore, theproblem discovery rate (p) for severe problems was 0.3,which was higher than that of moderate (p = 0.21) and thatof minor problems (p = 0.18).
Table 5Inter-evaluator reliability measured with any-two-agreement
Nielsen Gerhardt-Powals
Paper A = 0.042 B = 0.088 (0.053)a A + B = 0.045 (0.041)Tool C = 0.073 D = 0.070 C + D = 0.055
A + C = 0.047 B + D = 0.046 (0.034) All = 0.046 (0.043)
a Numbers in parenthesis include evaluator B1.
Table 6Hindrances and facilitators
Hindrance Freq. Facilitator Freq.
Unclear training/still not aproblem
1 Training Material 8
Heuristic guidelines 7 Heuristic guidelines 6Lack of experience 1 Previous experience 1Lack of time 3 Using two computers 1Difficult application/
EducaNext3 Easy application/
EducaNext1
24
14
11
6
2 10
5
10
15
20
25
30
1 2 3 4 5 6
Number of User
Fre
qu
ency
of
UP
Fig. 3. Number of users experiencing UPs with different frequencies.
232 E.T. Hvannberg et al. / Interacting with Computers 19 (2007) 225–240
The 10 participants were required to fill out an After-Scenario Questionnaire (ASQ) for each of the eightscenarios to assess the perceived ease, perceived time andperceived utility of online help. Each of these three aspectswas measured with the seven-point Likert Scale with theleft and right anchor being ‘‘Strongly Disagreed’’ and‘‘Strongly Agreed’’, respectively. Furthermore, uponattempting all the tasks, the participants were required tocomplete a post-test questionnaire (SUS) to assess theiroverall subjective satisfaction with EducaNext. The aver-age SUS score was 57.25 (N = 10, SD = 16.43). Note thatSUS scores have a range of 0 to 100 (Brooke, 1996). Foreach of the 10 participants, we computed two differentobjective measures: UP-severity-ratings and total-time-on-tasks. Specifically, we added up the severity ratings(severe = 3, moderate = 2 and minor = 1) of all the UPsthat a participant experienced, resulting in his or herUP-severity-ratings. Similarly, we added up the time thata participant spent on all the tasks attempted. The averageUP-severity-rating was 23.6 (N = 10, SD = 7.79) and theaverage total-time-on-tasks was 54.6 min (N = 10,SD = 12.04).
3.3. Mapping the results of heuristic evaluations with those of
user tests
Using the two-way mapping procedure described in Sec-tion 2.5, the following results were obtained:
Number of Hits ði:e: PUPs verified by UPsÞ ¼ 32
Number of False Alarms
ði:e: PUPs not verified by any UPÞ ¼ 53
We studied how many of Hits and False Alarms wereidentified by different groups of HE evaluators. Resultsare displayed in Table 7. Note that within-group duplicateswere not counted, yielding so-called ‘filtered Hits’. Forinstance, PUP20 was a hit uncovered by A1, A3, C1 andC5; however, the corresponding frequency of hit was onlyincreased by 1 for Group A and for Group C. v2 tests wereapplied to these results. On average, an evaluator in theheuristic evaluation demonstrated similar performance interms of Hits and False Alarms, irrespective of the typesof supports given, i.e. heuristic sets and reporting medium.Compared to the results of heuristic evaluation, the groupthat used Nielsen’s heuristics and reported on paper
(Group A) identified on average 6.6 usability problemsper evaluator, but on average only 2.6 of these problemsper evaluator could be verified in the user test.
Furthermore, to find out whether tool-based reportingwas more effective than reporting on paper, we collapsedthe data of the respective groups (Table 7) and performedt-tests between Group A + Group B and GroupC + Group D. No significant differences in the number ofHits or False Alarms between tool-based and paper-basedevaluator were found. Similarly, to find out whether Niel-sen’s usability heuristics were more effective than Ger-hardt-Powals principles, we collapsed the data of therespective groups and performed t-tests between GroupA + Group C and Group B + Group D. No significant dif-ferences were found either. In summary, on average, anevaluator in the heuristic evaluation demonstrated similarperformance, irrespective of the types of supports given.
Besides, it is intriguing to know how many severe veri-fied UPs and unique verified UPs (i.e. UPs were reportedonly by the evaluators belonging to one particular group)individual groups identified. Table 8 displays the results.Group B appeared to be the most effective in identifyingsevere UPs and Group B and C in identifying additionalUPs, but the differences were insignificant.
In addition to Hits and False Alarms, misses are denot-ed as those usability problems that inspection methodshave missed but are found in user testing. We computedthe overall effectiveness of heuristic evaluation based onthe following formulae (Hartson et al., 2001): Effective-ness = Validity * Thoroughness, where
In addition, we researched whether the HE evaluators andUT users tended to identify the real UPs with a similar fre-quency. To answer this question, we correlated the two fre-quencies of individual Hits. The non-parametric SpearmanRank-Order Correlation Coefficient rs was 0.23 (p = 0.2,N = 32), showing that the two groups, HE evaluatorsand UT users, were not significantly correlated in thisrespect.
Table 7Distribution of Hits and False Alarms – filtered sets
Hits False Alarms
NielsenHeuristics
Gerhardt-Powalsprinciple
NielsenHeuristics
Gerhardt-Powalsprinciple
Paper GroupA = 8
Group B = 13 GroupA = 18
Group B = 12
Tool GroupC = 15
Group D = 11 GroupC = 19
Group D = 26
Table 8Distribution of severe verified problems and unique verified problems
Severe problems Unique problems
NielsenHeuristics
Gerhardt-Powalsprinciple
NielsenHeuristics
Gerhardt-Powalsprinciple
Paper GroupA = 2
Group B = 5 GroupA = 2
Group B = 6
Tool GroupC = 2
Group D = 2 GroupC = 8
Group D = 4
E.T. Hvannberg et al. / Interacting with Computers 19 (2007) 225–240 233
3.4. Results according to heuristics
To answer the question which of the two sets of heuris-tics can result in higher validity and thoroughness, we col-lapsed the data of the respective groups and analysed them.
We adopted the following definition (Law and Hvann-berg, 2004a):
Actual efficiencyðAEÞ ¼ Number of Hits identified
within the Testing Session=Total durationðhoursÞ of
the Testing Session ð5Þ
From Table 9, we see that the validity is almost the samefor the two sets of heuristics, i.e. less than half of the pre-dicted problems could be verified in the user tests. (Notethat if a problem was discovered with Nielsen’s heuristicseither with paper or the tool, it was only counted once.)If the results of the user tests are the baseline, i.e. the truththat we can compare to, the measures indicate that about60% of the effort of doing heuristic evaluation has beenwasted. Similarly, the thoroughness for the two sets was al-most identical. The measures indicate that more than 60%of the usability problems discovered by the users wereundetected by the evaluators in the heuristic evaluation.
The usefulness of a usability evaluation method dependsin part on whether it enables the evaluator to discover themost severe problems and whether it avoids misleadingdevelopers to fix False Alarms (i.e. those reported problemsnot verified by the user tests). The distribution of problemseverity between heuristic sets in Table 10 was notsignificant.
The average time it took each evaluator to do the eval-uation with Nielsen’s set of heuristics (2 h 18 min) was only5 min less than the average time it took an evaluator withGerhardt-Powals principles (2 h 23 min).
The evaluators’ satisfaction was mixed. Independent ofheuristic sets, some said it was time-consuming to use theheuristics, there were too many heuristics and hard tounderstand, while others said they had no problems. Manymentioned that while evaluating, they first found a problem
and then had a hard time finding the right heuristic to referto. This may indicate that the heuristics are not alwaysexplicitly guiding the evaluators to discover problems orthat the evaluators are finding problems for which thereexist no heuristics in the respective set of heuristics. Relat-ing to the first issue, i.e. guidance of heuristics in discover-ing a problem, in a study where an extended problemreport format was used, Cockton et al. (2003b) found sig-nificant improvements in appropriateness scores increasingto a mean score of 61% from an earlier one of 31% (Cock-ton and Woolrych, 2001). They contributed at least part ofthe difference to discovery methods and part to the extend-ed problem report format. Cockton and Woolrych (2001)have termed inappropriate heuristics when an expert ratherthan a heuristic evaluation is being applied. Regarding thesecond issue, i.e. no heuristics existing, apparently, it is dif-ficult to design a heuristic set, which has total coverage.Already, Nielsen (1994a) showed that in a factor analysis,only 30% of the variance was due to seven main heuristicsfactors which motivated him to relax the criterion of cover-age from a problem matching a single heuristic perfectly(rating of 5) to a partial match (rating of 3). With this cri-terion, he assumed that usability problems are due to abroad variety of underlying phenomena.
Law and Hvannberg (2004a) show that not only is itsometimes difficult for the evaluators to find the matchingheuristic, but they find it difficult to associate a problemwith any of the heuristics. Their study concluded that eval-uators ‘‘identified quite a number of the severe UPs based on
their own personal experiences and intuitions’’ (Law andHvannberg, 2004a, p. 247), and more so for the Ger-hardt-Powals principles than for the Nielsen’s heuristics.
3.5. Effectiveness and efficiency according to the medium of
reporting
The medium of reporting could have some impact onhow many usability problems are found during heuristicevaluation and how serious the problems are rated. Wecomputed the validity, thoroughness and efficiency of theresults for the two different media used to report the usabil-ity problems, paper or the tool, with 10 evaluators in eachgroup.
Table 11 shows that the validity was almost the same forusing a paper and using a tool, i.e. even though many moreproblems were reported using the tool than the paper. Soalmost 60% of the effort has been wasted using paper andabout 55% of the effort has been wasted using a tool.
Table 9Validity and thoroughness of heuristics problem sets
234 E.T. Hvannberg et al. / Interacting with Computers 19 (2007) 225–240
The thoroughness for using a tool was slightly higher.The measure indicates that almost 70% of the usabilityproblems experienced by the users were not reported bythe evaluators in the heuristic evaluation using a paperform, and 60% of the usability problems experienced bythe users were not reported by the evaluators in the heuris-tic evaluation using a tool to report the problems.
There was no significant difference in the distribution ofsevere, moderate and minor problems (see Table 12).
The average length of an evaluation session per evalua-tor using a tool was 2 h 14 min, which was 16 min less thanusing a paper (2 h 30 min).
The evaluators using the paper form stated that it wouldbe tiring in the long run to use the paper form. The toolusers were very positive, stating, that the tool was easy touse; it was effective to have tooltips and examples for guid-ance for reporting the problems; it was efficient to usedrop-down lists to choose the severity rate and heuristicsused to find the problem. They would rather use the toolthan similar paper form.
4. Comparing two empirical studies
Previously, the authors performed an empirical study onestimating and improving the effectiveness of heuristicevaluation. The former study (Study 1) (Law and Hvann-berg, 2004a) shared some similarities with the current one(Study 2), including:
• Employing Nielsen’s heuristics and Gerhardt-Powalsprinciples and applying them to an e-learning platform(NB: versions v.0.85 and v.1.0 of the same platform weretested in Study 1 and Study 2, respectively).
• Validating the results of heuristic evaluations with thoseof user tests.
• Comparable number of participants (n = 4 or 5) foreach of the four groups.
In contrast, there are four major important differences(see Table 13) between the two studies, including:
1. More structured and detailed information about the sys-tem evaluated was provided to the evaluators in Study 2than in Study 1.
2. Between-subject design was used in Study 2 instead ofwithin-subject design in Study 1.
3. Using ‘‘Paper-based reporting vs. tool-based reporting’’as one of the two independent variables in Study 2instead of using ‘‘Textual descriptions versus Graphicalrepresentations’’ about the system tested in Study 1.
4. User tests were conducted after heuristic evaluations andwere designed based on the data of heuristic evaluationsin Study 2, whereas user tests were conducted before
heuristic evaluations in Study 1.
The major finding in Study 1 was that Nielsen’s heuris-tics could enable the evaluators to identify significantlymore actual usability problems (Hits) than Gerhardt-Pow-als principles, irrespective of the type of the other support-ing information the evaluator received. However, Study 2could not corroborate this finding. It is intriguing to tryto understand what may contribute to this contradictoryconclusion. We examine the four factors delineated above:
Factor 1: the extra information given to the evaluatorsin Study 2 focused on the system evaluated but not onthe heuristics or principles. Hence, assuming that the posi-tive effect of increasing the understanding of the system was
Table 12Verified problems according to the problem severity and medium ofreporting
a (Validity) = % of verified problems against the total number ofusability problems of respective severity identified in the user test.
Table 13Comparison of the two studies
Former (Study 1) Current (Study 2)
Researchdesign
Independentvariables (IV)
IV1: Textual vs. Graphical description of the system IV1: Paper- vs. Tool-based problemreporting
IV2: Reference set – Nielsen vs. Gerhardt-PowalsDependentvariable (DV)
Number and quality of usability problems
Experimentaldesign
Within-subject design (4 cells, each with 5 subjects) Between-subject design (4 cells, eachwith 5 subjects)
Pre-test training Focus on the usability guidelines Focus on the main features of thesystem
Validation Results of user tests [validate] Heuristic Evaluation [guide]design of user tests
Results of Heuristic Evaluation Results of user tests [validate]Results of Heuristic Evaluation
Mainfindings
Form of support(IV1)
No effect on dependent variable
Heuristic set (IV2) Significant difference: Nielsen more effective No significant differences
E.T. Hvannberg et al. / Interacting with Computers 19 (2007) 225–240 235
more or less equal for all the four groups, it is ratherunlikely that this factor can explain the insignificant differ-ence between Nielsen and Gerhardt-Powals in Study 2.
Factor 2: We argued elsewhere for the legitimacy ofusing within-subject design in the context of Study 1 andalso analyzed the inherent characteristics of Nielsen’s heu-ristics that may render them more effective than Gerhardt-Powals’ principles (Law and Hvannberg, 2004a).
Factor 3: Given the insignificant effects of the indepen-dent variable ‘‘textual vs. graphical’’ of Study 1 and ‘‘paperversus tool’’ of Study 2 in yielding more Hits or even moreFalse Alarms, this factor should play no role in explainingthe contradictory conclusion.
Factor 4: The special arrangements of the user tests forvalidating heuristic evaluations in Study 2 were to enhancethe validity of the mapping results, and this purportedeffect should be more or less equal for all the four groups.
However, we cannot definitely eliminate the possibilitythat the significant differences found in Study 1 could bean artifact of the experimental design. Hence, Factor 4may partially, but not fully, explain the insignificant differ-ences found in Study 2. Apparently, the so-called user effect(Law and Hvannberg, 2004b) and evaluator effect (Hertz-um and Jacobsen, 2001; Molich et al., 2004) can accountfor the contradictory finding between the two studies. Infact, evaluator effect can boil down to individual differences(Dillon and Watson, 1996) that are difficult to control inempirical studies in HCI.
Nonetheless, given the small number of evaluators pergroup, the effect size or power of the statistical testsemployed in both studies is not particularly high. Clearly,an empirical study of a larger scale is required. Noteworthyis that the overall effectiveness of heuristic evaluation wasdisappointingly low in both studies – 0.22 for Study 1and 0.21 for Study 2. This finding may threaten the claimthat heuristic evaluation is an effective discount methodfor evaluating usability.
5. Discussion
Before we summarise the answers to the research ques-tions we raised in Section 1 and suggest research issuesfor further work, we will point out the context of the studythat will help us draw conclusions from the results.
Novice evaluators performed the heuristic evaluation inthe first of the two experiments presented in this paper. Asstated by Molich and Jeffries (2003), the former being oneof the inventors of heuristic evaluation, it can be applied by‘‘someone without particular knowledge of usability engi-
neering to evaluate a user interface’’ (Molich and Jeffries,2003, p. 1060). Hertzum and Jacobsen (2001, p. 424) alsostated that: ‘‘Any computer professional should be able to
apply heuristic evaluation, but the informality of the method
leaves much to the evaluator.’’
Indeed, some of the gaps between the results of theheuristic evaluation and those of the user tests in thispaper could be attributed to the evaluator effect (Hertzum
and Jacobsen, 2001), i.e. levels of expertise and experienceof individual evaluators have observable influences onusability evaluation outcomes. We tried to mitigate theevaluator effect by providing highly structured trainingmaterial on heuristic evaluation and on the system. Theevaluators got a checklist of the activities they were askedto perform and a digital audio-file introducing heuristicevaluation, the EducaNext system and the process ofreporting problems. An analysis of the qualitative dataon facilitators and hindrances of the heuristic evaluationshowed that 8 of 20 evaluators found that the trainingmaterial helped them, but one evaluator mentioned thattraining was a hindrance and one mentioned lack ofexperience.
In the following, we summarize the answers to theresearch questions we raised in Section 1 and put forwardfurther research issues.
5.1. Tool-based vs. Paper-based Reporting
Part of this study is an attempt to answer whether tool-based reporting is superior to paper-based in terms ofyielding a higher number of real usability problems(increased validity) within a shorter period of time(increased efficiency). The proposition is that typing canbe faster than handwriting, digital content is more accessi-ble and easily modifiable than its paper version and instruc-tions are more readily available. We achieved small benefitsof tool over paper, the effectiveness was 0.18 when using atool compared to 0.13 using paper, but the difference wasnot significant. No significant differences in Actual Efficien-cies per evaluator were found between Group A (AE:M = 1.34, SD = 1.1) and Group C (AE: M = 2.1,SD = 2.2) or between Group B (AE: M = 1.32, SD = 0.9)and Group D (AE: M = 2.2, SD = 1.1) or between GroupA + B and Group C + D. While the evaluators using Niel-sen’s heuristics tended to type more with the web tool thanto write with the conventional paper-and-pen (t = 2.21,df = 8, p = 0.06), it did not imply a higher quality of thesePUPs. When asking participants to list hindrances andfacilitators of heuristic evaluation, none of them mentionedthe registration tool but one in group A mentioned thepaper form as a hindrance. The ineffectiveness of our toolin enhancing the validity or efficiency can be attributedby the three negative effects addressed earlier in Section1, including the cognitive load caused by switching betweenthe two software systems, hasty data entry resulting in falsealarms, and biased use of certain classification values.
We may need to implement more intelligence in the toolto gain further advantages. As it is, the tool provides agood basis for problem recording, providing help to itsusers that they reportedly liked. Although an earlier study(Law and Hvannberg, 2004a) showed no differencebetween those that used training material (Lavery et al.,1996) for heuristic evaluation and those who did not, thereason may have been that the training material was notat hand during evaluation but was exposed to the evaluator
236 E.T. Hvannberg et al. / Interacting with Computers 19 (2007) 225–240
before the analysis. Additional assistance to evaluatorsmay be given in a tool by:
• Linking the usability problem better to the context interms of screen scenarios or individual design features,for richer problem description and hopefully more effi-cient problem fixes.
• Helping evaluators go through falsification testing tomitigate, if not totally eradicate, instances of falsealarms.
• Pointing out gaps in testing coverage of the applicationto avoid missed problems.
• Pointing to previously proven problematic areas thatneed to be retested (i.e. inspecting a revised version ofthe system).
• Giving them ‘usability problems profile’ that consists ofproblematic areas commonly identified for the type ofproducts or interfaces under evaluation (Chattratichartand Brodie, 2004).
• Fostering the reliability and validity of problem severityratings with automatable problem-rating rules derivedfrom a robust theoretical and computational model(Blackmon et al., 2005) that are built in an intelligentreporting tool.
Research of the features and affordances of tool vs.paper has taken place in different domains, such as air traf-fic control, document handling (Gladwell, 2002) and userinterface design (Cook and Bailey, 2005). Whereas paperhas a unique set of affordances such as being tangible, spa-tially flexible and tailorable, digital documents can easily besearched, shared, stored, accessed remotely and linked toother related material (Gladwell, 2002). These affordancesof paper, it is claimed, make paper attractive for creativecollaboration and help maintain workers’ mental models.In addition to these features, designers have reported thatthey find paper quicker, easier and more portable, in earlydesigns (Cook and Bailey, 2005). Note that the differencebetween the representation of designers and evaluators ofthis study is that the latter produced text as deliverablesbut the former worked with sketches and text. We didnot study the collaborative task of merging usability prob-lems, but this may be an interesting subject for furtherstudy.
5.2. Nielsen vs. Gerhardt-Powals
Another approach to improving heuristic evaluation isto search for better heuristic sets. The validity of the twoheuristic sets, Nielsen’s and Gerhardt-Powals’, with respectto user testing was the same. The overall effectiveness was0.14 in both cases. Percentage wise, Gerhardt-Powals’ prin-ciples could enable more severe problems to be foundalthough the difference was not significant. Only lookingat predicted problems, both the average number of prob-lems and the standard deviation for Gerhardt-Powals’principles were higher than those for Nielsen’s heuristics.
This indicates that the Gerhardt-Powals’ principles couldfurther be exploited but that evaluators need more training.The findings of this study are contradictory to those of aprevious study (Law and Hvannberg, 2004a), which impliesthat an empirical study of larger scale is needed.
The low effectiveness may be due to mismatch in theapplication domain knowledge between the evaluators inthe two groups. Furthermore, in comparison with Nielsen’sheuristics, the hypothesized strengths of cognitive engineer-ing heuristics may not be exploited in a web-applicationwith standard operations such as search, insert, access,and delete. The implication of this observation for futureresearch is to compile and systematically evaluate a list ofusability heuristics for e-learning systems. Indeed, therehave been some recent studies in developing tailor-madeusability heuristics to fit special application contexts (e.g.ambient displays, (Mankoff et al., 2003)) and large screendisplay information exhibits (Somervell et al., 2003), andthey are proven to be more effective than Nielsen’s heuris-tics (Somervell and McCrickard, 2005). A tool, with theadded intelligence of creating taxonomies of problems invarious application contexts to context specific heuristics,can make such a selection of heuristics more effective.
5.3. Task selection
The difficulty in creating tasks for user testing was two-fold: the heuristic evaluation revealed that some of theproblems were not reproducible at all from the problemdescriptions, and some problems were situational and con-textual, i.e. depending on particular data retrieved orentered by the evaluator, and on the stability of the serverwhere the system evaluated resided.
A simple count of number of problem contexts, that canbe defined as an identifiable place within the application, ineach of the two problem sets – heuristic evaluation and usertests – shows that of the 23 contexts with usability prob-lems in the user tests, PUPs covered 18 of those contexts.Evaluators predicted problems in nine contexts not discov-ered in user test. Note that the definition of a context needsfurther investigation. Other researchers have moved awayfrom using problem counts and used a more qualitativeapproach with an analysis of types of usability issues anduser-system misfits (Connell et al., 2004). Another steptowards acknowledging the qualitative nature of the prob-lem descriptions, instead of using merely the stringent con-cepts of Hits, Misses and False Alarms as is traditionallyused, is to introduce Possible Hits (PH), which are lessclear-cut, ambiguous, but nevertheless plausible matchesbetween two methods, and Not Directly Observable conse-quences (NDO) (Connell et al., 2004). Therefore, false pos-itives and NDOs are restricted to expert analysis and maybe given less priority in revisions unless their frequencies orseverities give rise to other actions. An empirical study ofhow developers prioritize usability problems to correctand whether there is a difference in problem revision strat-egies for two sets of usability problems being derived from
E.T. Hvannberg et al. / Interacting with Computers 19 (2007) 225–240 237
different usability evaluation methods should help shedlight on this issue.
6. Concluding remark
The framework for comparing evaluation methods thatwe have described in this paper can be reused by otherresearchers because of its thorough structure. The studycan be seen as a first one of this framework but subsequentstudies may show that it needs to be improved. As a finalphase of this framework, we will in this section refine aresearch agenda for comparing and contrasting evaluationmethods.
While no conclusive claims about the two variables ofinterest – two sets of usability heuristics and two mediaof problem reporting – can be derived from the results ofthe present study, some implications for usability practitio-ners and researchers can be drawn. From the practicalpoint of view, a web tool for capturing and recordingusability problems in heuristic evaluation is recommended,especially when remote evaluation becomes increasinglypopular, thanks to the relentless expansion of the Internet.Besides, easy access to and effective management of thedata being captured in usability evaluation will enable col-laborative efforts of practitioners and researchers distribut-ed in different locations to work on common problems ofinterest. Further development of the tool creates opportu-nities for more intelligence in all aspects of evaluation,namely inspective, descriptive and analytical parts. In otherwords, the tool can improve the way we conduct the inspec-tion of user interfaces, the way we report usability prob-lems thus identified, and the way we consolidate a list ofusability problems (i.e. eliminating duplicates as well asFalse Alarms and accurate severity rating), enabling prac-titioners to prioritize and correct urgent problems.
Similar to our two sets of heuristics, the literature hasexamined two different types of heuristics. One type is syn-thesized, (Connell and Hammond, 1999; Nielsen, 1994a),that is, a heuristic set is created bottom up from a largerset of heuristics or types of usability problems. Anothertype of heuristics is defined from abstract theories (Horn-bæk and Frøkjær, 2004). The potential challenges thatevaluators have with the former type is that, whenresearchers or practitioners find a common title for a syn-thesized heuristic, some details may be lost. With the sec-ond type, when the heuristics are described concretely,with one or two examples, evaluators may miss problemsif they are unable to understand the abstract description.
Our evaluators appreciated the help they receivedthrough examples in the tool. ‘‘Learning by Examples’’ isa well-researched topic in cognitive psychology (Renkland Atkinson, 2003). A caveat needs to be made that exam-ples themselves should be of good quality; otherwise, theywould impede rather than facilitate learning. Moreover,examples can rigidify how learners interpret heuristics,i.e. lower their free creative responses. Zhang’s perspectivebased evaluation (Zhang et al., 1999) asks the evaluator to
view the human computer interaction with a certain per-spective, i.e. user type. Concrete examples, e.g. of noviceand expert users are given. This method has resulted in30% increase of usability problems over heuristics evalua-tion for 3 evaluators.
One recommendation that comes out of the work pre-sented in this paper is that better training schemes needto be devised. More good concrete examples need to beshown, but also help with understanding the abstractmeaning behind the heuristics, which will give evaluatorsenough freedom to identify problems not explicitly listedin the training material. Depending on the knowledgeand experience gaps being identified, training should beadapted and personalized to specific profiles of individualevaluators. To help devise those examples and abstracttools, the following research question is posed:
• How can usability heuristics help evaluators identifyproblems? What is the cognitive mechanism underpin-ning heuristic evaluation? Has the heuristic or principlenamed really guided the evaluator to uncover a usabilityproblem or the evaluator named it to justify her/hisbehaviour? Indeed, Cockton and Woolrych (2001)attempted to check the accuracy of heuristics that theirevaluators attributed to usability problems. The corre-sponding metric was coined as appropriateness. Accord-ingly, appropriate heuristic applications can bedetermined by correspondence between predicted diffi-culties and applicability criteria as stated in a HE train-ing manual (Lavery et al., 1996). Nonetheless, weassume that the reliability of such accuracy checks varieswith assessors’ level of expertise, both in the heuristicsand application domain.
One of the reasons that Gerhardt-Powals’ set of heuris-tics did not yield better outcomes than Nielsen’s may bethat it did not fit the application of a brokerage system.Furthermore, with the high complexity of an applicationbut limited resource, evaluation thus needs to be scopedand goal-oriented. Somervell’s and McCrickard’s (2005)work focuses on the creation of so-called ‘critical parame-ter-based’ heuristics, based on critical parameters proposedby Newman and Taylor (1999). For the class of large-scaledisplay systems Somervell and McCrickard identified threecritical parameters, namely Interruption, Reaction andComprehension. Clearly, the mapping of heuristics to thesystem’s characteristics is important. But Somervell andMcCrickard (2005) emphasize that mapping is not at thelevel of an individual system but a class of systems. Thisassertion aligns with Nielsen’s recommendation ‘‘Further-
more, it is possible to develop category-specific heuristics
that apply to a specific class of products as a supplement
to the general heuristics’’ (Nielsen, 1994b, p. 29). He furthersuggests performing competitive analysis and user testingto create abstract categories of specific heuristics, but Som-ervell and McCrickard (2005) use claims-analysis as a basisfor heuristic creation. A registration tool may help collect
238 E.T. Hvannberg et al. / Interacting with Computers 19 (2007) 225–240
the most commonly found faults in this class of applica-tions or design features, depending on the granularity ofthe subject of evaluation. For brokerage systems, criticalparameters could be Relevance (search results), Ease ofupload/download (learning objects) and Security (intellec-tual property right). To further develop this issue we for-mulate another research question:
• How should a set of usability heuristics be so selectedthat they can best fit the context of the applicationdomain, the goal of the evaluation and availableresources? Is it possible to develop meta-guidelines toaddress this context fitness?
One reason for the low thoroughness of the two heuris-tic sets may be the large set of features or task scenariosthat are described to the evaluator. Instead of inspectingan application for a few hours, a more iterative approachin a series of inspection sessions where a set of featuresor tasks are inspected each time may be more effective(Molich et al., 2004; Nielsen, 1994b). Inspection work isvery tedious and tiring, and it could be that at the end ofthe session evaluators stopped or showed decreased perfor-mance because of fatigue. An iterative inspection sessioncould reveal more differences between the two heuristic setslists. Such an iterative approach may also give rise to adebriefing session in between iterations. Thus, evaluatorscan discuss problems discovered and, hence, raise theirunderstanding of the heuristics or the domain. A thirdresearch question we pose is:
• Are evaluation results not only dependent on number ofevaluators but also on the number and duration of iter-ative inspection sessions?
In summary, there remain challenges for usabilitypractitioners and researchers to overcome. To cope withthe problem of generalizability and transferability acrosscontexts, extensive collaboration within the usabilitycommunity to conduct multi-site experiments and tosupport exchange of ideas and experiences is deemedessential.
References
Andre, T.S., Hartson, R.H., Belz, S.M., McCreary, F.A., 2001. The useraction framework: a reliable foundation for usability engineeringsupport tools. International Journal of Human-Computer Studies 54,107–136.
Barnum, C.R., 2003. What’s in a number. Available from : <http://www.stcsig.org/usability/newsletter/0301-number.html>, Accessed 2006,Society for Technical Communication.
Bastien, J.M.C., Scapin, D., Leulier, C., 1999. The Ergonomic Criteriaand the ISO 9241-10 Dialogue Principles: a comparison in anevaluation task. Interacting with Computers 11, 299–322.
Blackmon, M.H., Kitajima, M., Polson, P.G., 2005. Tool for accuratelypredicting website navigation problems, non-problems, problemseverity, and effectiveness of repairs. In: Conference on HumanFactors in Computing Systems archive Proceedings of the SIGCHI
Conference on Human factors in Computing Systems, ACM, Port-land, Oregon, USA, pp. 31–40.
Brooke, J., 1996. SUS: A ‘quick and dirty’ usability scale. In: Jordan, P.W.,Thomas, B., Weerdmeester, B.A., McClelland, I.L. (Eds.), UsabilityEvaluation in Industry. Taylor & Francis, London, pp. 189–194.
Chattratichart, J., Brodie, J., 2004. Applying user testing data to UEMperformance metrics. In: CHI 2004, ACM, Vienna, Austria, pp. 1119–1122.
Cockton, G., Lavery, D., 1999. A framework for usability problemextraction. In: Sasse, A., Johnson C. (Eds.), INTERACT 1999, pp.347–355.
Cockton, G., Woolrych, A., 2001. Understanding inspection methods:lessons from an assessment of heuristic evaluation. In: Blandford, A.,Vanderdonckt, J., Gray, P.D. (Eds.), People and Computers XV.Springer-Verlag, Lille, France, pp. 171–182.
Cockton, G., Lavery, D., Woolrych, A., 2003a. Inspection-based evalu-ation. In: Jacko, J.A., Sears, A. (Eds.), The Human-ComputerInteraction Handbook, Lawrence Erlbaum Associates, NJ.
Cockton, G., Woolrych, A., Hall, L., Hindmarch, M., 2003b. Changinganalysts’ tunes: the surprising impact of a new instrument for usabilityinspection method assessment. In: Palangue, P., Johnson, P., O’Neill,E. (Eds.), HCI 2003. Springer-Verlag, Bath, pp. 145–162.
Cockton, G., Woolrych, A., Hindmarch, M., 2004. Reconditionedmerchandise: extended structured report formats in usability inspec-tion. In: CHI’2004, ACM, Vienna, Austria, pp. 1433–1436.
Connell, I.W., Hammond, N.V., 1999. Comparing usability evaluationprinciples with heuristics. In: Sasse, A., Johnson C. (Eds.), Proceedingsof the 7th IFIP international conference on Human-computer Inter-action, INTERACT’99, IOS Press, Edinburgh.
Connell, I., Blandford, A., Green, T., 2004. CASSM and cognitivewalkthrough: usability issues with ticket vending machines. Behaviourand Information Technology 23, 307–320.
Cook, D.J., Bailey, B.P., 2005. Designers’ use of paper and theimplications for informal tools. In: OZCHI 2005, vol. 122, ACM,Canberra, Australia, pp. 1–10.
Desurvire, H.W., Kondziela, J.M., Atwood, M.E., 1992. What is gainedand lost using evaluation methods other than empirical testing. In:Monk, A., Diaper, D., Harrison M.D. (Eds.), HCI, Proceedings of theConference on People and Computers VII, pp. 89–102.
Dillon, A., Watson, C., 1996. User analysis HCI – the historical lessonsfrom individual differences research. International Journal of Human-Computer Studies 45, 619–638.
Doubleday, A., Ryan, M., Springett, M., Sutcliffe, A., 1997. A comparisonof usability techniques for evaluating design. In: DIS’97, ACM Press,Amsterdam, pp. 101–110.
Faulkner, L., 2003. Beyond the five-user assumption: benefits of increasedsample sizes in usability testing. Behavior Research Methods, Instru-ments, and Computers 35, 379–383.
Folmer, E., Bosch, J., 2004. Architecting for usability: a survey. TheJournal of Systems and Software 70, 61–78.
Frøkjær, E., Larusdottir, M.K., 1999. Predictions of usability: comparingmethod combinations. In: Managing Information Technology Resourc-es in Organizations in the Next Millennium, Idea group publishing.
Gerhardt-Powals, J., 1996. Cognitive engineering principles for enhancinghuman-computer performance. International Journal of Human-Computer Interaction 8, 189–211.
Gladwell, M., 2002. The social life of paper. In: The New Yorker, TheNew Yorker Magazine , Newyork, NY, pp. 92–96.
Hartson, H.R., Andre, T.S., Williges, R.C., 2001. Criteria for evaluatingusability evaluation methods. International Journal of Human-Com-puter Interaction 13, 373–410.
Hertzum, M., Jacobsen, N.E., 2001. The evaluator effect: a chilling factabout usability evaluation methods. International Journal of Human-Computer Interaction 13, 421–443.
Holzinger, A., 2005. Usability engineering methods for software develop-ers. Communication of the ACM 48, 71–74.
E.T. Hvannberg et al. / Interacting with Computers 19 (2007) 225–240 239
Hornbæk, K., Frøkjær, E., 2004. Usability inspection by metaphors ofhuman thinking compared to heuristic evaluation. InternationalJournal of Human-Computer Interaction 17, 357–374.
Jeffries, R., Miller, J.R., Wharton, C., Uyeda, K.M., 1991. User interfaceevaluation in the real world: a comparison of four techniques. In:ACM CHI’91, New Orleans, LA, pp. 119–124.
John, B.E., Mashyna, M.E., 1997. Evaluating a multimedia authoringtool. Journal of the American Society for Information Science 48,1004–1022.
Karat, C., Campbell, R., Fiegel, T., 1992. Comparison of empirical testingand walkthrough methods in user interface evaluation. In: ACMCHI’92 Conference, Monterey, California, pp. 397–404.
Law, E.L.-C., Hvannberg, E.T., 2004a. Analysis of strategies forimproving and estimating the effectiveness of heuristic evaluation. In:NordiCHI 2004, Tampere, Finland, pp. 241–250.
Law, E.L.-C., Hvannberg, E.T., 2004b. Analysis of the combinatorial usereffect of international usability tests. In: CHI 2004, ACM, Vienna,Austria, pp. 9–16.
Lewis, J.R., 1991. Psychometric evaluation of an after-scenario question-naire for computer usability studies: the ASQ. In: ACM SIGCHIBulletin, vol. 23, pp. 78–81.
Mankoff, J., Dey, A.K., Hsieh, G., Kientz, J., Lederer, S., Ames, M., 2003.Heuristic evaluation of ambient displays. In: CHI 2003, ACM Press,Florida, USA., pp. 169–176.
Molich, R., Jeffries, R., 2003. Comparative Expert Reviews. In: CHI 2003:New Horizons, ACM, Ft. Lauderdale, Florida, USA, pp. 1060–1061.
Molich, R., Ede, M.R., Kaasgaard, K., Karyukin, B., 2004. Comparativeusability evaluation. Behaviour and Information Technology 23, 65–74.
Newman, W., Taylor, A., 1999. Towards a methodology employingcritical parameters to deliver performance improvements in interactivesystems. In: Sasse, M.A., Tauber M. (Eds.), INTERACT’99, 7th IFIPTC.13 International Conference on Human-Computer Interaction,Edinburgh, Scotland, pp. 605–612.
Nielsen, J., 1993. Usability Engineering. Academic Press, New York.Nielsen, J., 1994a. Enhancing the explanatory power of usability heuris-
tics. In: CHI’94, ACM, Boston, Massachusetts USA, pp. 152–158.Nielsen, J., 1994b. Heuristic evaluation. In: Nielsen, J., Mack, R.L. (Eds.),
Usability Inspection Methods. John Wiley & Sons, pp. 25–62.
Nielsen, J., 2000. Why you only need to test with 5 users? Available from:<http://www.useit.com/alertbox/20000319.html>, Accessed 2005.
Nielsen, J., Molich, R., 1990. Heuristic evaluation of user interfaces. In:Proceedings ACM CHI’90 Conference, ACM, Seattle, WA, pp. 249–256.
Norman, D.A., 1986. Cognitive engineering. In: Norman, D.A., Draper,S.W. (Eds.), User Centered System Design: New Perspectives onHuman-Computer Interaction. Lawrence Erlbaum Associates, Hills-dale, NJ, pp. 31–61.
Renkl, A., Atkinson, R.R., 2003. Structuring the transition from examplestudy to problem solving in cognitive skills acquisition: a cognitiveload perspective. Educational Psychologists 38, 15–22.
Rieman, J., Davies, S., Hair, D.C., Esemplare, M., Polson, P., Lewis, C.,1991. An automated cognitive walkthrough. In: Proceedings of theSIGCHI conference on Human factors in computing systems: Reach-ing through technology, ACM, New Orleans, Louisiana, UnitedStates, pp. 427–428.
Rosenbaum, S., Ronn, J.A., Humburg, J., 2000. A Toolkit for StrategicUsability: Results from Workshops, Panels, and Surveys. In: Turner,T., Szwillus, G., Czerwinski, M., Paterno F. (Eds.), CHI’2000, ACM,Hague, Amsterdam, pp. 337–344.
Somervell, J., McCrickard, D.S., 2005. Better discount evaluation:illustrating how critical parameters support heuristic creation. Inter-acting with Computers 17, 592–612.
Somervell, J., Wahid, S., McCrickard, D.S., 2003. Usability heuristics forlarge screen information exhibits. In: Rauterberg, M., Menozzi, M.,Wesson J. (Eds.), INTERACT 2003, Zurich, Switzerland., pp. 904–907.
Spool, J., Schroeder, W., 2001. Testing web sites: five users is nowherenear enough. In: CHI ’01 Extended Abstracts on Human factors inComputing Cystems, Seattle, Washington, pp. 285–286.
Virzi, R.A., 1992. Refining the test phase of usability evaluation: Howmany subjects is enough? Human Factors 34, 457–468.
Woolrych, A., Cockton, G., 2001. Why and when five test users aren’tenough. In: Vanderdonckt, J., Blandford, A., Derycke, A. (Eds.),IHM-HCI, vol. 2. Toulouse, France, pp. 105–108.
Woolrych, A., Cockton, G., Hindmarch, M., 2004. Falsification testingfor usability inspection method assessment. In: Fincher, S., Marko-poulos, P., Moore, D., Ruddle R. (Eds.), HCI, BCS, Bath.
Zhang, Z., Basili, V., Shneiderman, B., 1999. Perspective-based usabilityinspection: an empirical validation of efficacy. Empirical SoftwareEngineering 4 (1), 43–69.
240 E.T. Hvannberg et al. / Interacting with Computers 19 (2007) 225–240


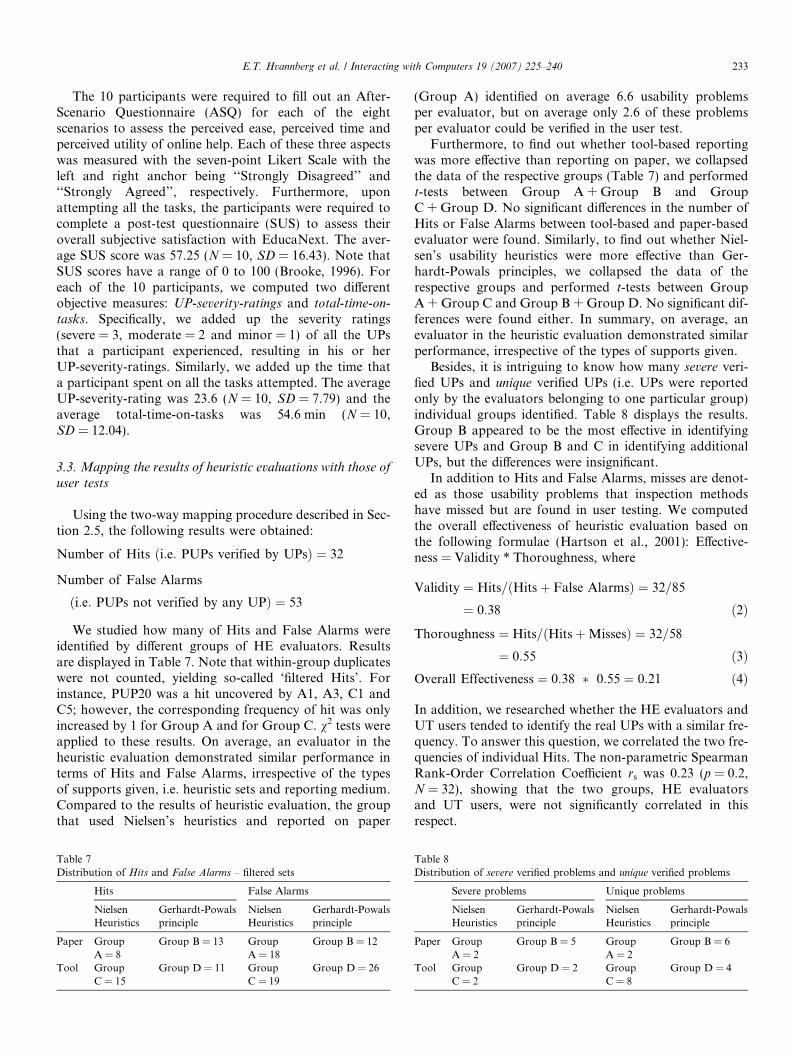
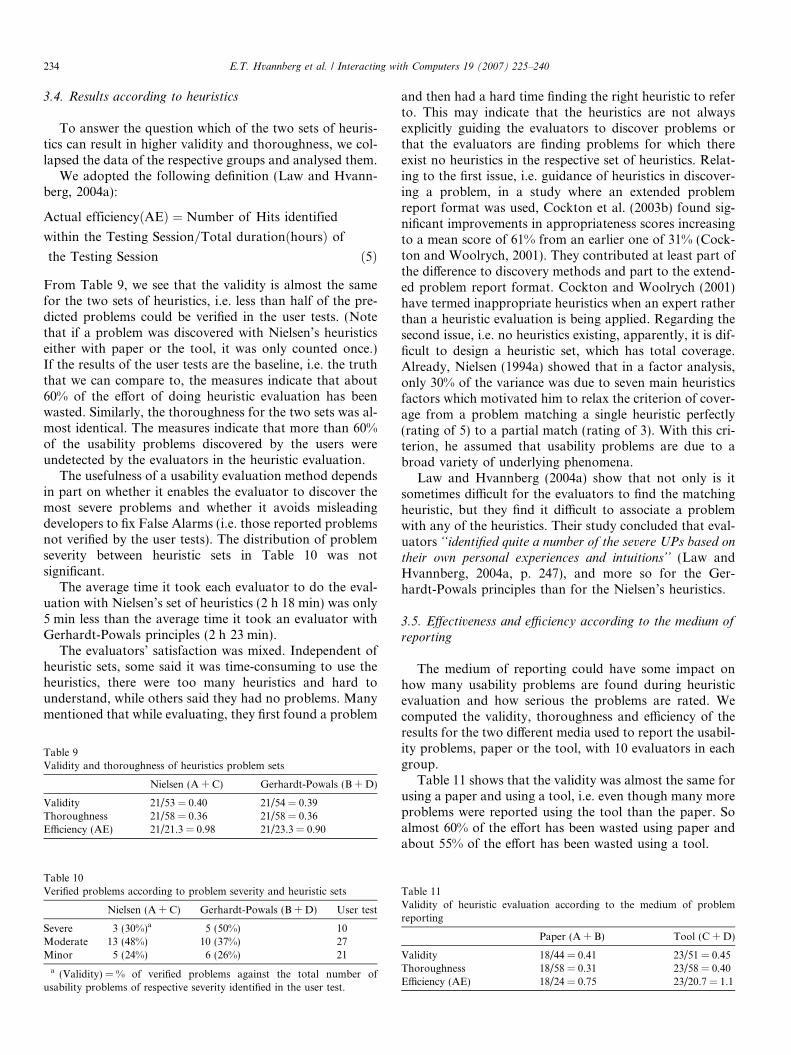


![Informed [Heuristic] Search - University of Delawaredecker/courses/681s07/pdfs/04-Heuristic...Informed [Heuristic] Search Heuristic: “A rule of thumb, simplification, or educated](https://static.documents.pub/doc/80x56/5aa1e13c7f8b9a84398c48b6/informed-heuristic-search-university-of-delaware-deckercourses681s07pdfs04-heuristicinformed.jpg)


