72
“Space Avaialble” Report Review & Analysis 1 Heywood Sanders’ “Space Available” Report Review & Analysis Focused on Convention & Tradeshow Industry Growth 2005 to 2008 Developed by May 2009
| Date post: | 05-Sep-2018 |
| Category: |
Documents |
| Upload: | dinhkhuong |
| View: | 215 times |
| Download: | 0 times |

“Space Avaialble” Report Review & Analysis
1
Heywood Sanders’ “Space Available” Report Review & Analysis
Focused on Convention & Tradeshow Industry Growth 2005 to 2008
Developed by
May 2009
“Space Avaialble” Report Review & Analysis
2
“There are two places that have historically done well in expanding their convention business: that’s Las Vegas and Orlando. And historically, they have managed to grow their business with great regularity. New Orleans for a long time in the 1990s seemed to be successful. Anaheim and San Diego may, but because of a lack of available information that I’ve been able to get my hands on, it’s not entirely clear. But there’s something in common certainly about the first two of them, and to some extent, about the other three, that’s worth noting.”
-- Heywood Sanders, November 2004 “Conventions are big business, attracting free-spending visitors booking downtown hotel rooms, eating at restaurants, and thronging theaters and night spots. At any rate, that’s the theory.”
-- Heywood Sanders, “Space Available” report, January 2005 * * * * * “According to a January 2009 study of convention and tradeshow producers by Tradeshow Week, the following activities represent the behavior of at least 25% of attendees when they attend an event:
• Visit restaurants: 91% • Participate in “Other Entertainment”: 52% • Shopping: 44% • Stay Over in the City or Region Post-Event: 25% • Arrive Early for Pre-Event Site-Seeing: 19% • Cultural and Educational Activities: 17% • Sports Events: 12% • Outdoor Recreation: 6% • Family Events: 2% • Other Activities: 10%
The same survey determined 17% of event attendees bring a spouse or friend with them to the host city.”
-- Tradeshow Week, January 2009
“Space Avaialble” Report Review & Analysis
3
“There were more than 630,000 registered attendees for primary events at the SDCC during 2007. Including non-registered friends and relatives in the event attendee’s travel group, there were an estimated 743,000 SDCC visitors to San Diego. About 84% (625,500 est.) of the SDCC visitors reported hotel accommodations in San Diego and they reported an average of almost 1.4 people per room. The average length of hotel stay was 3.73 nights generating an estimated 1,688,000 total hotel room nights during 2007.” “The 630,000 primary event attendees spent an average of $1,462 each in San Diego (including spending for non-registered members of their travel party and $378 in association and exhibitor company spending per event attendee). This generated total direct spending of almost $921 million in San Diego. Lodging spending generated by SDCC primary events totaled nearly $374 million including about $35.5 million in transient lodging taxes.”
-- CIC Research, 2007 San Diego Visitor Profile Study

“Space Avaialble” Report Review & Analysis
4
Table of Contents Introduction..............................................................................................................5 Executive Summary.................................................................................................6
I. Response to the “Space Available” Report’s Key Themes ....................11 II. Convention Industry Supply and Demand Growth.................................18 III. Direct Spending and Economic Impact ..................................................33 IV. The Competitive Convention Center Industry........................................41 V. Convention Center Critical Success Factors and City Success Stories: Boston,
Denver, Las Vegas and San Diego ..........................................................43 VI. Specific Convention Center Developments Citied in the “Space Available”
Report......................................................................................................45 VII. Areas in Which Tradeshow Week Agrees with Heywood Sanders........56
Data Sources ..........................................................................................................58 Appendix I: Industry Response to the Space Available Report.............................59 Appendix II: The Power of Face-to-Face Marketing.............................................64 Appendix III: Testimony on Convention Centers and Economic Development ...65 Appendix IV: HVS Response to Space Available Report 2005 ............................67 Appendix V: Partial List of Conventions and Tradeshows that Increased Attendance in 2008........................................................................................................................69
“Space Avaialble” Report Review & Analysis
5
Introduction This report by Tradeshow Week Research responds to the key points and claims made by Heywood Sanders concerning the convention center industry. The focus is on the report “Space Available” released in January 2005. Other recent reports and presentations made by Heywood Sanders are also reviewed. This report covers a range of themes including:
• Response to the “Space Available” Report’s Key Themes – a response to the themes outlined on page one of the Space Available report.
• Convention Industry Supply and Demand Growth – an overview of
convention and tradeshow industry growth compared to U.S. GDP and the expansion of exhibition space.
• Direct Spending and Economic Impact – analysis of various attendee,
event management and exhibitor spending categories and an economic impact analysis of San Diego conventions.
• Convention Center Critical Success Factors and City Success
Stories: Boston, Denver, Las Vegas and San Diego – an overview of factors that have helped these cities increase major convention and tradeshow bookings along with adding new venues and expansions.
• Specific Convention Center Developments Cited in the “Space
Available” Report – a discussion covering a number of the report’s city- and venue-specific claims with performance tracked from 2005 to 2008.
• Areas in Which Tradeshow Week Agrees with Heywood Sanders –
valid points that Tradeshow Week confirms. A number of appendices are also included at the end of the report.

“Space Avaialble” Report Review & Analysis
6
Executive Summary Convention Industry Supply and Demand Growth
• The “Space Available” Research Brief, published in January 2005, is largely an assessment of convention center and event industry performance during a noted U.S. economic downturn. The U.S. economic slowdown between 2000 and 2003 was exacerbated by historically significant events including the internet investment bubble and burst, the terror attacks of September 11th 2001, and worldwide pandemic known as SARS (Severe Acute Respiratory Syndrome).
• In the chart below U.S. GDP and convention and tradeshow net square footage
and attendance are plotted from 1990 to 2004. While the Research Brief measured tradeshow attendance using the “Tradeshow 200” the table below uses Tradeshow Week Quarterly Reports of Business-to-Business Conventions and Tradeshows with over 30,000 net square feet. The Quarterly Reports track 400 to 500 shows per year. The Research Brief puts the years 2000 to 2004 under the microscope, yet fails to notice a drop-off in U.S. GDP that coincides with a decrease in convention attendance. Note the sharp decline in late 2001 and early 2002 was primarily due to the impact of 9/11.
U.S. GDP, Convention Attendees and Net Square Feet 1990 to 2004
-6.0%
-4.0%
-2.0%
0.0%
2.0%
4.0%
6.0%
8.0%
1990 1991 1992 1993 1994 1995 1996 1997 1998 1999 2000 2001 2002 2003 2004
GDP Attendance Net Square Feet
Source: U.S. Department of Commerce, Bureau of Economic Analysis, Tradeshow Week Quarterly Reports of Business-to-Business Tradeshows with over 30,000 net sq. ft.

“Space Avaialble” Report Review & Analysis
7
• The table below shows the rise of both attendance and net square feet of exhibit
space during a timeframe that the Research Brief concludes that an imminent turnaround in the industry was unlikely.
5-Year Growth 2002 to 2006: Convention Attendees and Net Square Feet
-6.0%
-4.0%
-2.0%
0.0%
2.0%
4.0%
6.0%
2002 2003 2004 2005 2006
Attendance Net Square Feet
Source Tradeshow Week Quarterly Reports of Business-to-Business Tradeshows
• Since the release of the Research Brief the Travel Industry Association has released their 2005 “U.S. Travel Market Overview – Travel Volumes & Trends”. The report notes that 25% of the 1,992.4 million person-trips recorded in 2005 (498.1 million person-trips) were attributed to the Business/Convention category – an increase of 260.42% during the two years immediately after the Research Brief’s assessment of no turnaround.
• The Research Brief states “improved quality of telecommunications and the rise
of Internet” will negatively impact the convention industry. In a 2006 survey of 223 corporate exhibitors conducted by Tradeshow Week, 83% indicated that the internet is an “opportunity”, 1% said it was a “threat” to their event marketing campaigns and 16% said the internet would have “no impact.”
• Continued International Investment in Convention Centers: In 2008, Tradeshow
Week tracked 323 major convention centers outside of the U.S. and Canada. In comparison, in 2007, Tradeshow Week counted 306 venues. These international facilities have in aggregate 181,2371,276 gross square feet of exhibit space, up from 166,002,824 gross square feet in 2007, a significant annual 9.3% growth rate.

“Space Avaialble” Report Review & Analysis
8
• The table below illustrates that attendance at the annual shows in the Tradeshow
200 shows increased by 3.5% in 2005, 3.1% in 2006, and 1.6% in 2007. Conventions and tradeshows track the industries that they serve and collectively the overall health of the U.S. economy.
Tradeshow 200 Growth Rates 1998 to 2008
Year Net Square Feet Exhibiting Companies
Attendees
2008 -1.6% -2.7% -3.0% 2007 2.5% 2.3% 1.6% 2006 2.6% 1.4% 3.1% 2005 3.2% 1.5% 3.5% 2004 2.3% 2.8% 2.5% 2003 -0.7% 1.2% 3.4% 2002 -6.0% -2.6% -4.4% 2001 -1.3% -2.0% -4.5% 2000 3.2% 3.4% 2.8% 1999 2.8% 1.1% 4.4% 1998 5.2% 3.4% 2.4%
Source: Tradeshow Week 200
Tradeshow 200 Attendance Growth Rates 1998 to 2008
-6.0%
-4.0%
-2.0%
0.0%
2.0%
4.0%
6.0%
1998 1999 2000 2001 2002 2003 2004 2005 2006 2007 2008
Attendance Growth

“Space Avaialble” Report Review & Analysis
9
Direct Spending and Economic Impact
• According to a January 2009 study of U.S. convention and tradeshow producers conducted by Tradeshow Week, the following activities represent the behavior of at least 25% of attendees when they are “in-town” for an event:1
• Visit restaurants: 91% • Participate in “Other Entertainment”: 52% • Shopping: 44% • Stay Over in the City or Region Post-Event: 25% • Arrive Early for Pre-Event Site-Seeing: 19% • Cultural and Educational Activities: 17% • Sports Events: 12% • Outdoor Recreation: 6% • Family Events: 2% • Other Activities: 10%
• The same 2009 survey found that 17% of event attendees bring a spouse or friend
with them to the event city.
• In 2004, The International Association of Convention & Visitor Bureaus estimated the average convention and tradeshow attendee generated an economic impact of $1,391 per visit.
• According to Tradeshow Week surveys, about half of the more than 80 million
attendees that go to conventions and exhibitions pay for some type of conference or educational program associated with events. It is critical to note that convention and exhibition producers are also in the professional education business. The amount of professional education that takes place in convention centers is second only to our college and university system.
• The Research Brief fails to measure the potential costs to a city of doing nothing.
What are the economic impacts of lost business (eroding market share) resulting from undersized and out-of-date venues?
• Each city and its venues must be examined separately. If over-building exists, it
exists because industry consolidation is not an option. In some cases venue builds and expansions have not provided just rewards. In others, increased exhibit space has resulted in increased attendance and growth in economic impact.
1 The exact question was: Which of the following activities do at least 25% of your attendees and exhibitors participate in when at your event destination? (Please estimate if necessary; and please check all that apply.)
“Space Avaialble” Report Review & Analysis
10
• There is more to destination marketing than simply building exhibit space or a hotel. There is marketing. Each city competes for events by developing and communicating unique value propositions and messages to event planners. Determining the proper message and correct channels to broadcast that message are essential to the success of convention center and destination marketing.
Heywood Sanders Interview by Neil deMause on Convention Centers, September 07, 2004
• Question: “Have you seen anywhere that a city has put money into a convention center, and it’s actually been money well spent?”
o Heywood Sanders Answer: “There are two places that have historically
done well in expanding their convention business: that’s Las Vegas and Orlando. And historically, they have managed to grow their business with great regularity. New Orleans for a long time in the 1990s seemed to be successful. Anaheim and San Diego may, but because of a lack of available information that I’ve been able to get my hands on, it’s not entirely clear. But there’s something in common certainly about the first two of them, and to some extent, about the other three, that’s worth noting.”
“Space Avaialble” Report Review & Analysis
11
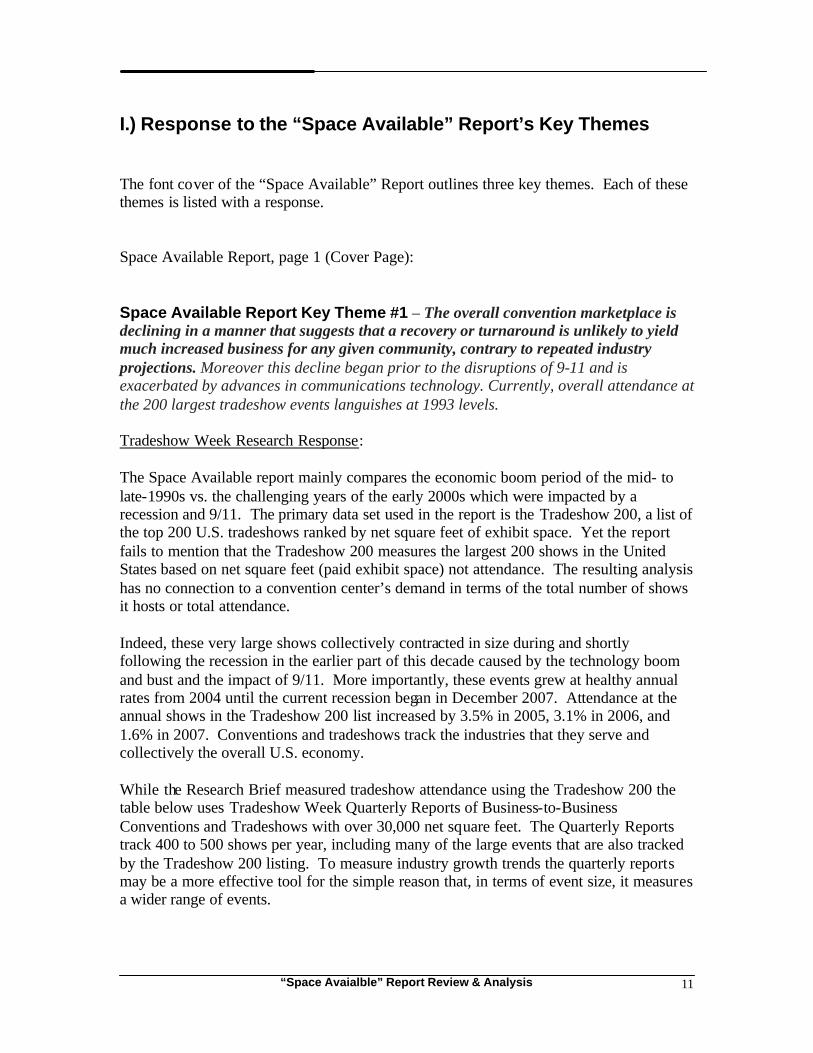
I.) Response to the “Space Available” Report’s Key Themes The font cover of the “Space Available” Report outlines three key themes. Each of these themes is listed with a response. Space Available Report, page 1 (Cover Page): Space Available Report Key Theme #1 – The overall convention marketplace is declining in a manner that suggests that a recovery or turnaround is unlikely to yield much increased business for any given community, contrary to repeated industry projections. Moreover this decline began prior to the disruptions of 9-11 and is exacerbated by advances in communications technology. Currently, overall attendance at the 200 largest tradeshow events languishes at 1993 levels. Tradeshow Week Research Response: The Space Available report mainly compares the economic boom period of the mid- to late-1990s vs. the challenging years of the early 2000s which were impacted by a recession and 9/11. The primary data set used in the report is the Tradeshow 200, a list of the top 200 U.S. tradeshows ranked by net square feet of exhibit space. Yet the report fails to mention that the Tradeshow 200 measures the largest 200 shows in the United States based on net square feet (paid exhibit space) not attendance. The resulting analysis has no connection to a convention center’s demand in terms of the total number of shows it hosts or total attendance. Indeed, these very large shows collectively contracted in size during and shortly following the recession in the earlier part of this decade caused by the technology boom and bust and the impact of 9/11. More importantly, these events grew at healthy annual rates from 2004 until the current recession began in December 2007. Attendance at the annual shows in the Tradeshow 200 list increased by 3.5% in 2005, 3.1% in 2006, and 1.6% in 2007. Conventions and tradeshows track the industries that they serve and collectively the overall U.S. economy. While the Research Brief measured tradeshow attendance using the Tradeshow 200 the table below uses Tradeshow Week Quarterly Reports of Business-to-Business Conventions and Tradeshows with over 30,000 net square feet. The Quarterly Reports track 400 to 500 shows per year, including many of the large events that are also tracked by the Tradeshow 200 listing. To measure industry growth trends the quarterly reports may be a more effective tool for the simple reason that, in terms of event size, it measures a wider range of events.

“Space Avaialble” Report Review & Analysis
12
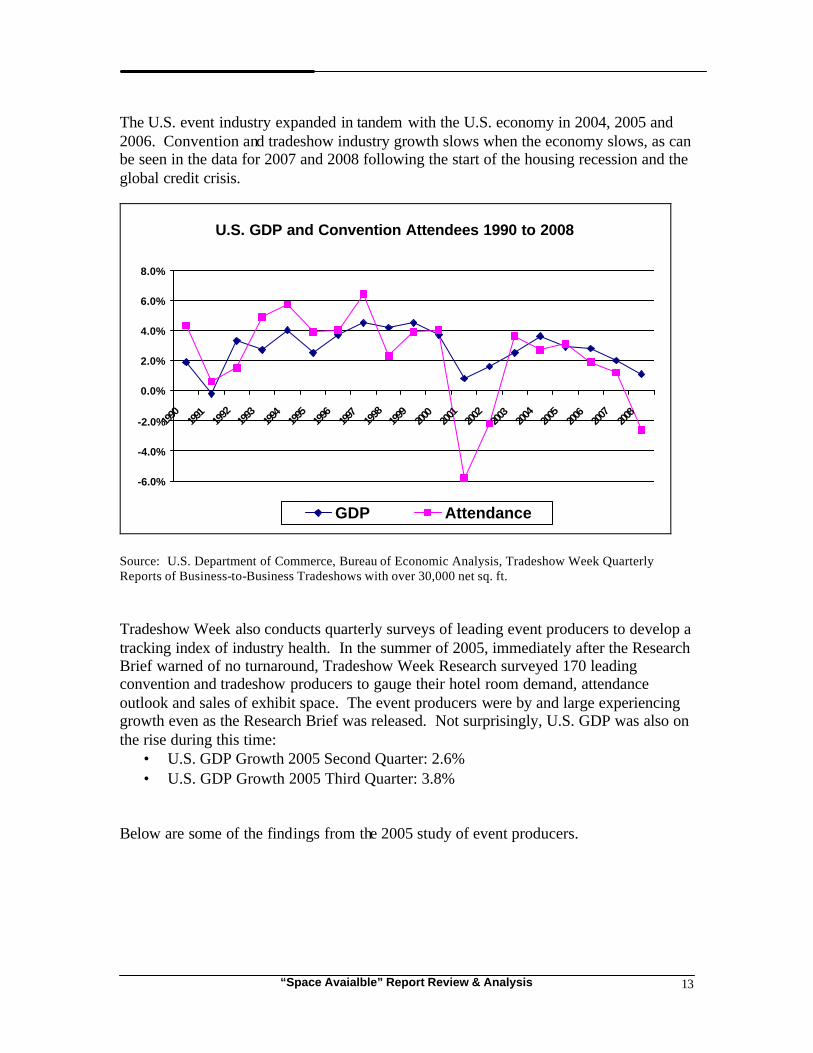
The table below illustrates the parallel fluctuations of exhibition attendance and changes in the U.S. economy. The Research Brief puts the years 2000 to 2004 under the microscope, yet fails to explain the drop-off in U.S. GDP that coincided with a downward trend in convention attendance. Note the decline in late 2001 and early 2002 were due to the impact of 9/11 which dramatically reduced airline travel and hotel bookings in the U.S.
U.S. GDP and Convention Attendees 1990 to 2004
-6.0%
-4.0%
-2.0%
0.0%
2.0%
4.0%
6.0%
8.0%
1990 1991 1992 1993 1994 1995 1996 1997 1998 1999 2000 2001 2002 2003 2004
GDP Attendance
Source: U.S. Department of Commerce, Bureau of Economic Analysis, Tradeshow Week Quarterly Reports of Business-to-Business Tradeshows with over 30,000 net sq. ft.
“Space Avaialble” Report Review & Analysis
13
The U.S. event industry expanded in tandem with the U.S. economy in 2004, 2005 and 2006. Convention and tradeshow industry growth slows when the economy slows, as can be seen in the data for 2007 and 2008 following the start of the housing recession and the global credit crisis.
U.S. GDP and Convention Attendees 1990 to 2008
-6.0%
-4.0%
-2.0%
0.0%
2.0%
4.0%
6.0%
8.0%
1990
1991
1992
1993
1994
1995
1996
1997
1998
1999
2000
2001
2002
2003
2004
2005
2006
2007
2008
GDP Attendance
Source: U.S. Department of Commerce, Bureau of Economic Analysis, Tradeshow Week Quarterly Reports of Business-to-Business Tradeshows with over 30,000 net sq. ft. Tradeshow Week also conducts quarterly surveys of leading event producers to develop a tracking index of industry health. In the summer of 2005, immediately after the Research Brief warned of no turnaround, Tradeshow Week Research surveyed 170 leading convention and tradeshow producers to gauge their hotel room demand, attendance outlook and sales of exhibit space. The event producers were by and large experiencing growth even as the Research Brief was released. Not surprisingly, U.S. GDP was also on the rise during this time:
• U.S. GDP Growth 2005 Second Quarter: 2.6% • U.S. GDP Growth 2005 Third Quarter: 3.8%
Below are some of the findings from the 2005 study of event producers.

“Space Avaialble” Report Review & Analysis
14
Survey Question: In terms of your most promising areas of your exhibition, what do you believe is driving this growth?
• Economic improvement: 47% of convention and tradeshow producers • Improved value: 41% • Better marketing: 36% • Stronger sales approach: 18% • Weak competition: 7% • Not sure: 10% • Other: 15%
Survey Question: So far in 2005, for all of your shows that have been held or to be held, please estimate the percentage change in net square footage of exhibit space (purchased by exhibitors) compared to 2004. Has net square footage increased or decreased?
• Increase: 52% • Decrease: 10% • Stay the same: 38%
Overall percentage growth: 6% Survey Question: By what percentage has the number of attendees in 2005 increased or decreased compared to 2004?
• Increase: 56% • Decrease: 19% • Stay the same: 25%
Overall percentage growth: 7% Survey Question: Will your organization be blocking more, less or the same number of hotel rooms for your largest upcoming event in 2005 vs. the last time this event was held?
• More: 28% • Less: 10% • Same: 59% • Don’t know: 4%
Survey Question: For your largest upcoming event, has the pricing for blocked hotel rooms increased, decreased, or stayed the same vs. the last time the event was held?
• Increased: 56% • Decreased: 6% • Stayed the same: 35% • Don’t know: 3%
“Space Avaialble” Report Review & Analysis
15
Also as outlined in this key theme, the “decline” in the industry was “exacerbated by advances in communications technology”. This is not the case. For example, in a 2006 survey of 223 exhibitors Tradeshow Week directly questioned the impact of the internet on event marketing. The results indicate that exhibitors welcome the internet as an “opportunity” rather than a “threat” to their event marketing campaigns. Survey Question: Do you consider the Internet as a threat, opportunity or having no impact on your event marketing campaign?
• Threat: 1% • Opportunity: 83% • No impact: 16%
Survey Question: How closely are your exhibits integrated with your organization's advertising and/or strategic marketing messages and goals?
• Integrated very closely: 48% • Integrated moderately closely: 40% • Not at all integrated: 12%
The internet has also provided convention and tradeshow managers with a means to extend the event community beyond the traditional few days of the show. Today, show producers utilize the internet as a marketing tool as well as a means to generate ancillary revenue. In 2007 and again in 2008, The Society of Independent Show Organizers, The Jordan, Edmiston Group, Inc. and Tradeshow Week partnered to examine event management’s use of the web and digital media to create and extend relationships with exhibitors, sponsors, attendees and partners. Below are a few of the key findings that exemplify how show producers are using the internet to their advantage:
• Three out of four event producers (76%) stay in touch with their community “365-days a year” via e-newsletters.
• The top three online lead generators used to drive show attendance are:
1. Online Advertising (banners, etc.): 80% 2. Partnership Marketing (linking to partner sites): 78% 3. Online Subscriptions (e-newsletters, etc.): 64%
• Nearly 60% of event producers drive ancillary revenue through their web sites.
Event producers indicated that, on average, 6% of their show revenue is generated via the event web site. In the next three years, event producers are hoping to more than double this mark to generate 12.4% of their total show revenue via the web.
“Space Avaialble” Report Review & Analysis
16
According to show producer comments, going forward they will pursue the following new opportunities created by the internet:
• “Automated sales and registration.” • “Creating a stronger content-rich community from which to drive additional
revenue and discussion areas beyond the event.” • “Engaging registered attendees through customized site tools and personalized
pages.” • “Identifying younger audiences – members and prospects – and reaching out to
them with online options.” • “Keeping the customers in touch with one another and feeding them content
through the year.” • “Marketing based on user behavior to identify and act upon intent.”
Space Available Report Key Theme #2 – Nonetheless, localities, sometimes with state assistance, have continued a type of arms race with competing cities to host these events, investing massive amounts of capital in new convention center construction and expansion of existing facilities. Over the past decade alone, public capital spending on convention centers has doubled to $2.4 billion annually, increasing convention space by over 50 percent since 1990. Nationwide, 44 new or expanded convention centers are now in planning or construction. Tradeshow Week Research Response: Following the release of the Space Avaible report in 2005, municipalities have continued to open new venues and expansion projects and plan for future development. In fact, since 2005 there have been 33 new convention centers opened, 39 expansions, and 31 venue renovations opened or completed. Today, over 60 major new convention centers or expansions are being planned. Clearly, municipalities have felt that their investment in these facilities has provided a quality return on investment. It is important to understand that visitors and event attendees primarily pay for convention center development via hotel room night taxes and other tourism taxes tha t may include:
• Convention center fee per room/per night in hotels • Rental car tax • Airport departure tax
According to public facility consulting firm CSL, “Overwhelmingly it is the visitor industry that is footing the bill for facility development.” Local taxpayers usually do not pay for convention centers. According to the 2007 San Diego Visitor Profile Study by CIC Research, lodging spending generated by San Diego Convention Center events generated about $35.5 million in transient lodging taxes.
“Space Avaialble” Report Review & Analysis
17
Space Available Report Key Theme #3 – Faced with increased competition, many cities spend more money on additional convention amenities, like publicly-financed hotels to serve as convention “headquarters.” Another competitive response has been to offer deep discounts to tradeshow groups. Despite dedicated taxes to pay off the public bonds issued to build convention centers, many—including Washington, D.C and St. Louis—operate at a loss. Tradeshow Week Research Response: Over the past ten years hotel development has become just as important, and possibly more important, than convention center development. Most cities have ample exhibition space today, which causes event planners to compare city locations based on their hotel capacity, quality, price points and proximity to the convention center. Discounting is also common, but mainly to help attract the largest most important conventions and tradeshows. Various Tradeshow Week surveys conducted since 2005 of convention and tradeshow producers have found that essentially the top 25% of event planners have been offered free or very low-cost exhibit space as an incentive to move their show by at least one venue or CVB. Cities, venues, CVBs and hotels in many cases feel these selective discounts are helpful in winning key events and providing a quality return on investment measured by room nights, spending on event services, direct spending by attendees in the community and resulting economic impact.
“Space Avaialble” Report Review & Analysis
18
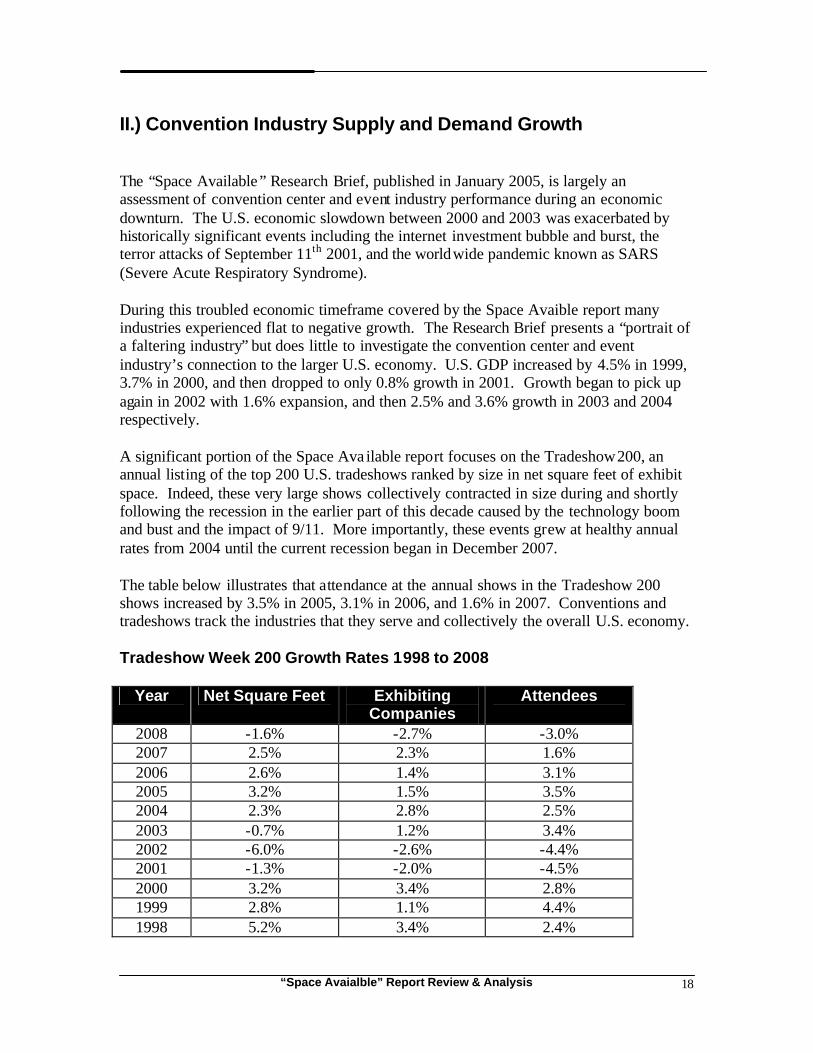
II.) Convention Industry Supply and Demand Growth The “Space Available” Research Brief, published in January 2005, is largely an assessment of convention center and event industry performance during an economic downturn. The U.S. economic slowdown between 2000 and 2003 was exacerbated by historically significant events including the internet investment bubble and burst, the terror attacks of September 11th 2001, and the worldwide pandemic known as SARS (Severe Acute Respiratory Syndrome). During this troubled economic timeframe covered by the Space Avaible report many industries experienced flat to negative growth. The Research Brief presents a “portrait of a faltering industry” but does little to investigate the convention center and event industry’s connection to the larger U.S. economy. U.S. GDP increased by 4.5% in 1999, 3.7% in 2000, and then dropped to only 0.8% growth in 2001. Growth began to pick up again in 2002 with 1.6% expansion, and then 2.5% and 3.6% growth in 2003 and 2004 respectively. A significant portion of the Space Ava ilable report focuses on the Tradeshow 200, an annual listing of the top 200 U.S. tradeshows ranked by size in net square feet of exhibit space. Indeed, these very large shows collectively contracted in size during and shortly following the recession in the earlier part of this decade caused by the technology boom and bust and the impact of 9/11. More importantly, these events grew at healthy annual rates from 2004 until the current recession began in December 2007. The table below illustrates that attendance at the annual shows in the Tradeshow 200 shows increased by 3.5% in 2005, 3.1% in 2006, and 1.6% in 2007. Conventions and tradeshows track the industries that they serve and collectively the overall U.S. economy. Tradeshow Week 200 Growth Rates 1998 to 2008
Year Net Square Feet Exhibiting Companies
Attendees
2008 -1.6% -2.7% -3.0% 2007 2.5% 2.3% 1.6% 2006 2.6% 1.4% 3.1% 2005 3.2% 1.5% 3.5% 2004 2.3% 2.8% 2.5% 2003 -0.7% 1.2% 3.4% 2002 -6.0% -2.6% -4.4% 2001 -1.3% -2.0% -4.5% 2000 3.2% 3.4% 2.8% 1999 2.8% 1.1% 4.4% 1998 5.2% 3.4% 2.4%

“Space Avaialble” Report Review & Analysis
19
In the chart below, U.S. GDP and convention and tradeshow attendance is plotted from 1990 to 2004. While the Research Brief measured tradeshow attendance using the Tradeshow 200, the table below uses Tradeshow Week Quarterly Reports of Business-to-Business Conventions and Tradeshows with over 30,000 net square feet. The Quarterly Reports track 400 to 500 shows per year, including many of the large events that are also tracked by the Tradeshow 200 listing. To measure industry growth trends the quarterly report may be a more effective tool for the simple reason that, in terms of event size, it measures a wider range of events. The table below illustrates the parallel fluctuations of exhibition attendance and changes in the U.S. economy. The Research Brief puts the years 2000 to 2004 under the microscope, yet fails to explain the drop-off in U.S. GDP that coincided with a downward trend in convention attendance. Note the decline in late 2001 and early 2002 was due to the impact of 9/11 which dramatically reduced airline travel and hotel bookings in the U.S. According to the Center for Exhibition Industry Research, “in 2001, the recession took hold and by the end of August, according to the American Bus iness Travel Association, 77% of U.S. based companies had reduced all but essential travel.”
U.S. GDP and Convention Attendees 1990 to 2004
-6.0%
-4.0%
-2.0%
0.0%
2.0%
4.0%
6.0%
8.0%
1990 1991 1992 1993 1994 1995 1996 1997 1998 1999 2000 2001 2002 2003 2004
GDP Attendance
Source: U.S. Department of Commerce, Bureau of Economic Analysis, Tradeshow Week Quarterly Reports of Business-to-Business Tradeshows In general convention attendees react first to changes in the economy and are followed several months later by corporate exhibitors. The reason for the lag between attendee and exhibitor activity is that exhibitors commit to shows earlier and therefore need a longer period of time to adjust to changes in their sales and marketing strategies.

“Space Avaialble” Report Review & Analysis
20
The chart below compares annual growth of U.S. GDP to convention and tradeshow attendance and net square footage demand growth. Note how attendance recovered faster than net square feet as attendee activity more closely reflects economic trends.
U.S. GDP, Convention Attendees and Net Square Feet 1990 to 2004
-6.0%
-4.0%
-2.0%
0.0%
2.0%
4.0%
6.0%
8.0%
1990 1991 1992 1993 1994 1995 1996 1997 1998 1999 2000 2001 2002 2003 2004
GDP Attendance Net Square Feet
Source: U.S. Department of Commerce, Bureau of Economic Analysis, Tradeshow Week Quarterly Reports of Business-to-Business Tradeshows
“Space Avaialble” Report Review & Analysis
21
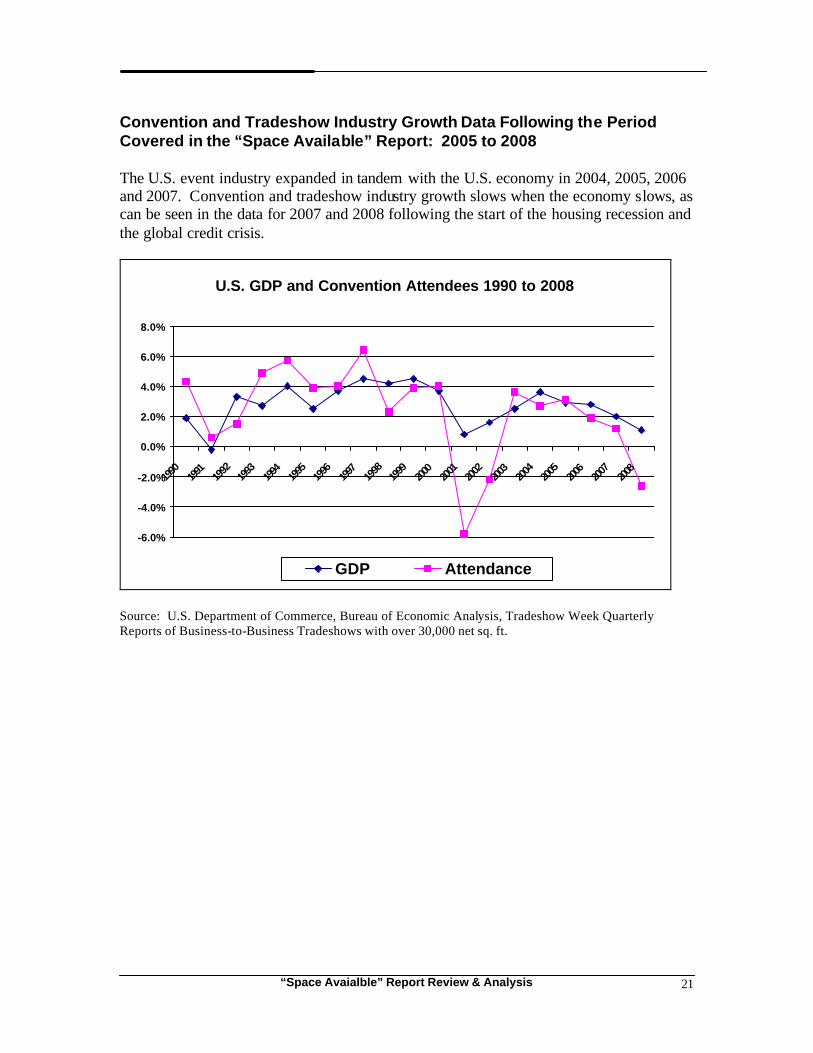
Convention and Tradeshow Industry Growth Data Following the Period Covered in the “Space Available” Report: 2005 to 2008 The U.S. event industry expanded in tandem with the U.S. economy in 2004, 2005, 2006 and 2007. Convention and tradeshow industry growth slows when the economy slows, as can be seen in the data for 2007 and 2008 following the start of the housing recession and the global credit crisis.
U.S. GDP and Convention Attendees 1990 to 2008
-6.0%
-4.0%
-2.0%
0.0%
2.0%
4.0%
6.0%
8.0%
1990
1991
1992
1993
1994
1995
1996
1997
1998
1999
2000
2001
2002
2003
2004
2005
2006
2007
2008
GDP Attendance
Source: U.S. Department of Commerce, Bureau of Economic Analysis, Tradeshow Week Quarterly Reports of Business-to-Business Tradeshows with over 30,000 net sq. ft.
“Space Avaialble” Report Review & Analysis
22
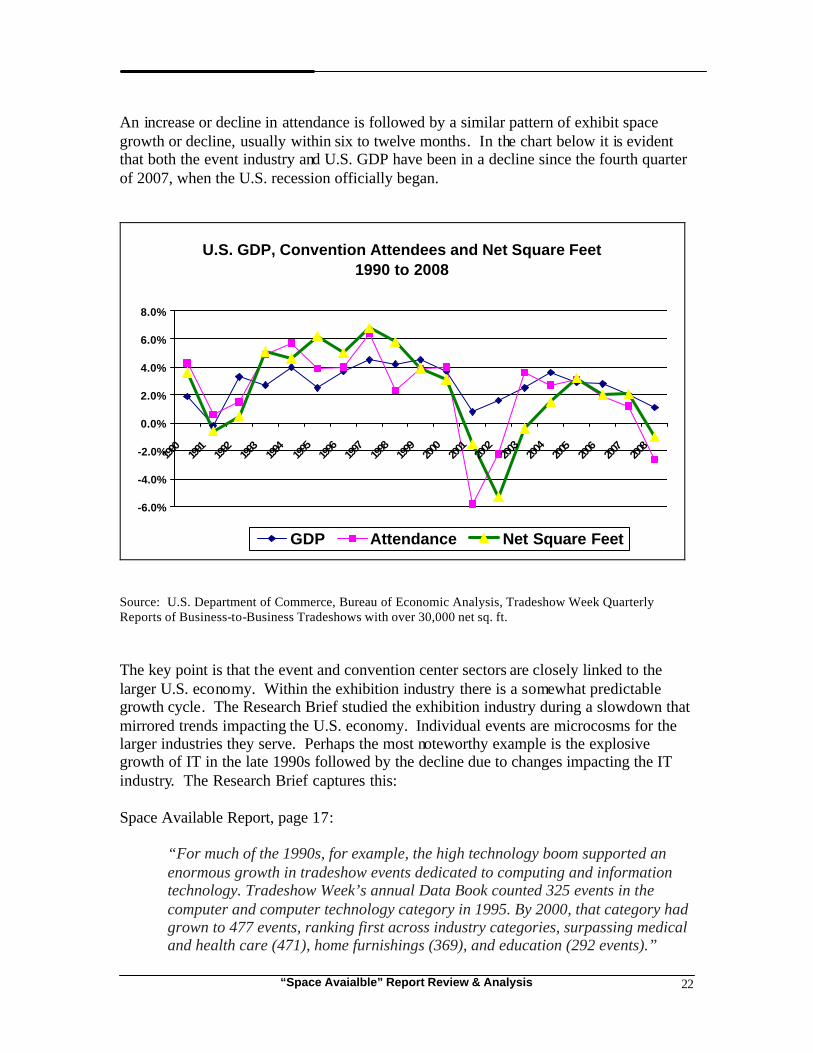
An increase or decline in attendance is followed by a similar pattern of exhibit space growth or decline, usually within six to twelve months. In the chart below it is evident that both the event industry and U.S. GDP have been in a decline since the fourth quarter of 2007, when the U.S. recession officially began.
U.S. GDP, Convention Attendees and Net Square Feet 1990 to 2008
-6.0%
-4.0%
-2.0%
0.0%
2.0%
4.0%
6.0%
8.0%
1990
1991
1992
1993
1994
1995
1996
1997
1998
1999
2000
2001
2002
2003
2004
2005
2006
2007
2008
GDP Attendance Net Square Feet
Source: U.S. Department of Commerce, Bureau of Economic Analysis, Tradeshow Week Quarterly Reports of Business-to-Business Tradeshows with over 30,000 net sq. ft. The key point is that the event and convention center sectors are closely linked to the larger U.S. economy. Within the exhibition industry there is a somewhat predictable growth cycle. The Research Brief studied the exhibition industry during a slowdown that mirrored trends impacting the U.S. economy. Individual events are microcosms for the larger industries they serve. Perhaps the most noteworthy example is the explosive growth of IT in the late 1990s followed by the decline due to changes impacting the IT industry. The Research Brief captures this: Space Available Report, page 17:
“For much of the 1990s, for example, the high technology boom supported an enormous growth in tradeshow events dedicated to computing and information technology. Tradeshow Week’s annual Data Book counted 325 events in the computer and computer technology category in 1995. By 2000, that category had grown to 477 events, ranking first across industry categories, surpassing medical and health care (471), home furnishings (369), and education (292 events).”
“Space Avaialble” Report Review & Analysis
23
“But as the information technology sector has been buffeted by economic change, so too have the tradeshow events that serve it. The 2002 event total for computing came to 371. By 2004, the computing area had fallen sharply to 303 total events. This pattern holds true even among the very largest information technology events—those in the Tradeshow Week 200. In 1999, events in the broadly defined “computers and electronics” category made up 21 of the “200,” including two of the top six in terms of exhibit space. Yet by 2003, only eight of those 21 remained among the “200” with the others having either dropped off the list because they decreased in size or, like a number of Internet shows, ceased to exist. Those eight shows which persisted on the “200” listing had 478,393 attendees in 1999. By 2003, their total attendance had fallen to 257,026—a decline of 46.3 percent.”
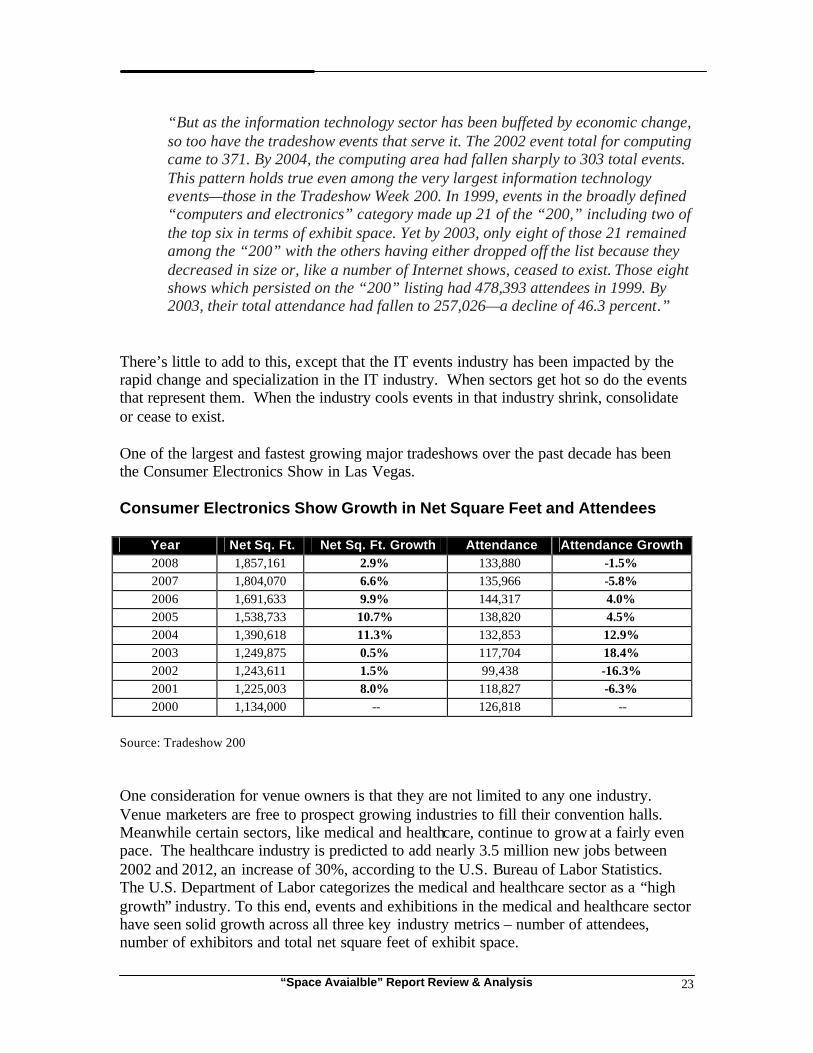
There’s little to add to this, except that the IT events industry has been impacted by the rapid change and specialization in the IT industry. When sectors get hot so do the events that represent them. When the industry cools events in that industry shrink, consolidate or cease to exist. One of the largest and fastest growing major tradeshows over the past decade has been the Consumer Electronics Show in Las Vegas. Consumer Electronics Show Growth in Net Square Feet and Attendees
Year Net Sq. Ft. Net Sq. Ft. Growth Attendance Attendance Growth 2008 1,857,161 2.9% 133,880 -1.5% 2007 1,804,070 6.6% 135,966 -5.8% 2006 1,691,633 9.9% 144,317 4.0% 2005 1,538,733 10.7% 138,820 4.5% 2004 1,390,618 11.3% 132,853 12.9% 2003 1,249,875 0.5% 117,704 18.4% 2002 1,243,611 1.5% 99,438 -16.3% 2001 1,225,003 8.0% 118,827 -6.3% 2000 1,134,000 -- 126,818 --
Source: Tradeshow 200 One consideration for venue owners is that they are not limited to any one industry. Venue marketers are free to prospect growing industries to fill their convention halls. Meanwhile certain sectors, like medical and healthcare, continue to grow at a fairly even pace. The healthcare industry is predicted to add nearly 3.5 million new jobs between 2002 and 2012, an increase of 30%, according to the U.S. Bureau of Labor Statistics. The U.S. Department of Labor categorizes the medical and healthcare sector as a “high growth” industry. To this end, events and exhibitions in the medical and healthcare sector have seen solid growth across all three key industry metrics – number of attendees, number of exhibitors and total net square feet of exhibit space.

“Space Avaialble” Report Review & Analysis
24
In fact the Research Brief mentions the steady growth in the healthcare sector. Space Available Report, page 17:
“While a few sectors did see increases in tradeshow activity—Tradeshow Week reported a total of 538 medical and health care events in 2004, for example, up from 471 events in 2000—a number of other large, industry-dominant tradeshows have sustained notable attendance losses.”
Tradeshow Week publishes a Medical and Pharmaceutical Show Report on an annual basis. To be included in the report, a show must have at least 15,000 net square feet of paid exhibit space. The table below shows that medical conventions and tradeshows grew by a considerable 7.8% in attendance in 2006, then 3.1% in 2007 and were flat in 2008, a recession year. Medical and Pharmaceutical Convention and Tradeshow Growth 2006 to 2008
Year Net Square Feet Exhibit Companies Attendance 2008 0.6% -0.5% 0.1% 2007 2.0% 0.9% 3.1% 2006 0.7% 2.9% 7.8%
Source: Tradeshow Week Medical and Pharmaceutical Show Reports Additionally, according to the Healthcare Convention and Exhibitors Association, professional attendance at healthcare meetings rose nearly 11.4% over the last five years. Space Available Report, page 2:
“Conventions are big business, attracting free-spending visitors booking downtown hotel rooms, eating at restaurants, and thronging theaters and night spots. At any rate, that ’s the theory.”
It is not a theory, it is a fact. According to a January 2009 study of U.S. convention and tradeshow producers conducted by Tradeshow Week, the following activities represent the behavior of at least 25% of attendees when they are “in-town” for an event:

“Space Avaialble” Report Review & Analysis
25
• Visit restaurants: 91% • Participate in “Other Entertainment”: 52% • Shopping: 44% • Stay Over in the City or Region Post-Event: 25% • Arrive Early for Pre-Event Site-Seeing: 19% • Cultural and Educational Activities: 17% • Sports Events: 12% • Outdoor Recreation: 6% • Family Events: 2% • Other Activities: 10%
The same survey determined 17% of event attendees bring a spouse or friend with them to the event city. Supply and Demand Growth Space Available Report, page 2:
“Many cities have seen their convention attendance fall by 40 percent, 50 percent, and more since the peak years of the late 1990s. The sharp drop has occurred across a range of communities, including a number of the historically most successful convention locales in the nation.”
Overall the Research Brief never connects slowdowns in the convention center and event industry that match U.S. economic downturns. In the statements above the Research Brief is assessing the U.S. economic recessionary and recovery years of 2000 to 2003. Space Available Report, page 4-5:
“After hitting a peak of 5.1 million in total attendance in 1996, it then dropped down to 4.5million in 1999, before rising to 4.8 million in 2000 (Figure 2). Something had begun to change in the convention and tradeshow industry such that—well before September 11—the largest and most successful events in the business were not yielding more attendees.”
The U.S. economic downturn began in 2000 before September 11, 2001 (GDP slowed from 4.5% in 1999 to 3.7% in 2000 before dropping to 0.8% in 2001) and predictably coincides with the decreased growth of tradeshows. When the economy slows, corporate budgets are cut, travel and spending decrease, and tradeshow attendance declines. Exhibitors already committed to events lag attendee cut back decisions.
“Space Avaialble” Report Review & Analysis
26
Space Available Report, page 5:
“…It would not be until its 2003 edition that the “200” summary could report some positive news, that the industry could “see the light” – exhibit space use down just 0.7 percent from 2002, but attendance up 3.4 percent…”
When the U.S. economy brightened in 2003 so too did the event industry. Again, attendees react faster to fluctuations in the U.S. economy than exhibitors. In general, early signs of recovery within the event industry are signaled by attendance increasing faster than net square feet. Space Available Report, page 5:
“This “imminent turnaround” view of convention and tradeshow activity is no doubt heartening to those in the industry and to local officials. It is, unfortunately, wrong—an artifact of Tradeshow Week’s peculiar methodology and the narrowness of focusing on only 200 very large events. Tradeshow Week calculates annual percentage change figures by asking event organizers what their exhibit space and attendance were in the previous year and a year earlier. If (as is commonly the case), organizers report a revised figure for two years ago, that usually smaller older figure becomes the base for calculating change. And they only include events noted in a previous year, shrinking the base for comparison and often including in the growth calculation data for biennial shows from two years previously.”
In the above statement the Research Brief is suggesting the event industry did not grow during the earlier part of this decade, i.e., there was no “imminent turnaround”. Below are quarterly tradeshow statistics tracked by Tradeshow Week. These statistics represent a wider range of events than those covered in the Tradeshow 200. The Tradeshow Week Quarterly Reports measure growth and decline of Business-to-Business Tradeshows with over 30,000 net square feet. The table shows the rise of both attendance and net square feet of exhibit space.

“Space Avaialble” Report Review & Analysis
27
2002 to 2006: Convention Attendees and Net Square Feet
-6.0%
-4.0%
-2.0%
0.0%
2.0%
4.0%
6.0%
2002 2003 2004 2005 2006
Attendance Net Square Feet
Space Available Report, page 16:
“Whatever the sense a few years ago of the scale, import, or sectoral dominance of these and other tradeshows, it should now be clearly evident that “the boom” has not continued, and that the convention and tradeshow business has witnessed a sea change.”
Looking back during 2004 at the U.S. economy one could in fact echo the sentiment of those days that “the boom” in the U.S. economy was over. The peak year of U.S. economic growth was 1999, riding the wave of technology, before that bubble burst, and the terror attacks of September 11th, 2001. One could easily re-write many of the phrases in the Research Brief (like the one above) and switch out the words “tradeshows” or “conventions” with the “U.S. economy” and draw exactly the same conclusions. Space Available Report, page 16:
“The Travel Industry Association’s annual estimate of business and convention travel, for example, has declined from 164.3 million person-trips in 1999 to 142.4 million in 2002 and 138.2 million trips in 2003. That amounts to a 15.9 percent drop, one that began before 2001. At the same time, the improved quality of telecommunications and the rise of Internet use have provided businesses with means of selling and promoting products and providing information without the cost, difficulties, and time consumption of inter-city travel.”
“Space Avaialble” Report Review & Analysis
28
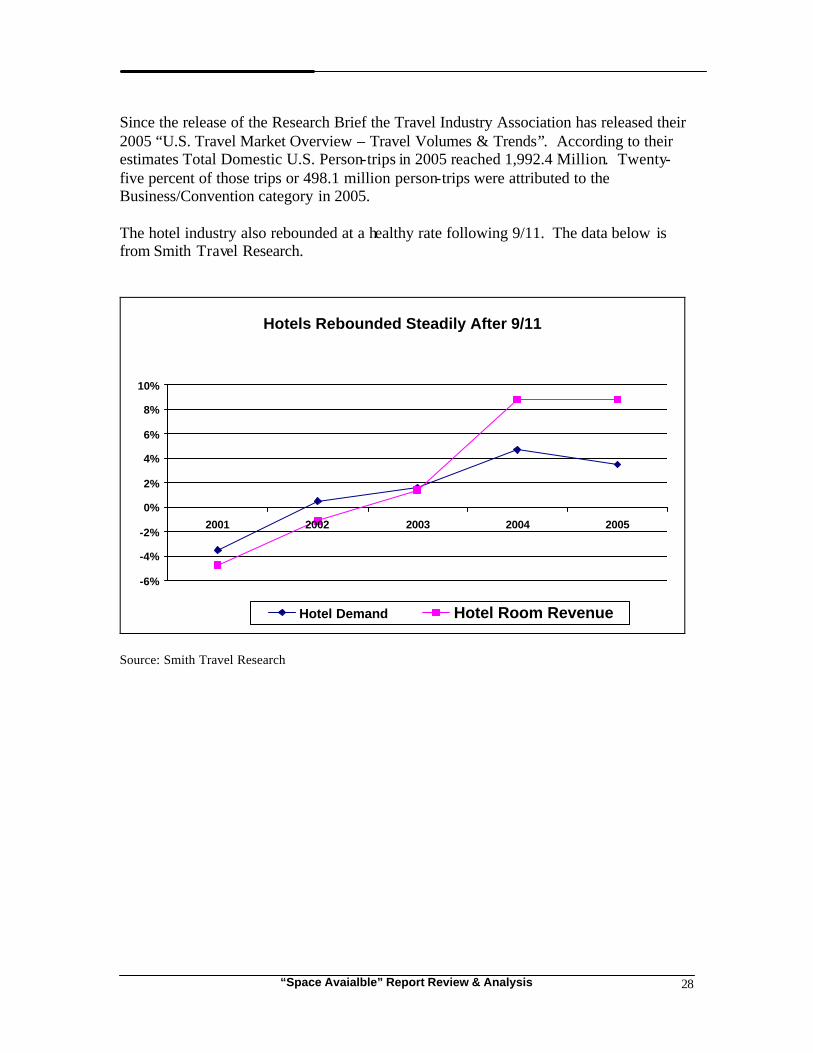
Since the release of the Research Brief the Travel Industry Association has released their 2005 “U.S. Travel Market Overview – Travel Volumes & Trends”. According to their estimates Total Domestic U.S. Person-trips in 2005 reached 1,992.4 Million. Twenty-five percent of those trips or 498.1 million person-trips were attributed to the Business/Convention category in 2005. The hotel industry also rebounded at a healthy rate following 9/11. The data below is from Smith Travel Research.
Hotels Rebounded Steadily After 9/11
-6%
-4%
-2%
0%
2%
4%
6%
8%
10%
2001 2002 2003 2004 2005
Hotel Demand Hotel Room Revenue
Source: Smith Travel Research

“Space Avaialble” Report Review & Analysis
29
Space Available Report, page 18:
“Additionally, there is no evidence that the convention center building boom is over or even seriously slowing. And so the competition for events—large and small—becomes ever fiercer).”
Since the Space Available report was released in 2005 there have been 33 new convention centers opened, 39 expansions, and 31 venue renovations opened or completed. Number of New Buildings, Expansions and Renovations in the U.S. and Canada 2005 2006 2007 2008 Total Total
All Projects
New Buildings Opened 13 12 2 6 33 Expansions Completed 14 10 7 8 39 Renovations Completed 3 7 9 12 31
103
Source: Major Exhibit Hall Directory While the venue industry has been described as “booming” over the past ten years, even through the challenging period between 2000 and 2002, the types of venue projects has been shifting. The primary shift is to expansions and renovations from new builds. New Convention Centers and Expansion Projects in Various Stages of Development
New Convention Centers and Expansion Projects in Various Stages of Development 1996 to 2008
0
20
40
60
80
100
120
1996 1997 1998 1999 2000 2001 2002 2003 2004 2005 2006 2007 2008
Projects In Development

“Space Avaialble” Report Review & Analysis
30
Nevertheless, competition is strong and increasing between cities. The parameters for competing are also changing. In November 2008, Tradeshow Week surveyed over 150 convention center managers. Below are some of the findings: Survey Question: In your opinion, will your venue require a new build, renovation or expansion in the next five to ten years to remain competitive with other venues?
• Yes: 63% • No: 20% • Don’t know: 17%
Survey Question: Are you planning a new build, expansion or renovation? (Please choose all that apply)
• New build: 9% • Expansion: 27% • Renovation: 27% • No development plans currently: 50%
Space Available Report, page 20:
“But as centers seek to expand, the reality of the industry is that there are relatively few large events in terms of exhibit space. While the largest of Tradeshow Week’s 200 events for 2003 used 1.25 million square feet, the median-sized event used just 235,000 square feet. The biggest convention centers in the nation—in Chicago, Atlanta, and Orlando—are not expanding in order to serve the relative handful of very large events. They are expanding in order to accommodate simultaneous small and medium-sized events, the kinds of events that now use far smaller centers.”
It is important to note that in the convention and tradeshow industry there are only approximately 20 prime weeks of the year; therefore leading events often want the same or overlapping dates. The Research Brief paints this seasonality aspect of the tradeshow industry as though it is breaking news when in fact this is well known throughout the industry. Space Available Report, page 20:
“Thus the American Psychological Association is holding its 2004 annual convention in the quite modestly-sized Hawaii Convention Center before moving to Washington for 2005 and New Orleans the following year, in part because the Honolulu facility was trying to fill the dates.”
The Research Brief portrays the American Psychological Association’s selection of Hawaii as a negative reflection of the event industry. This seems misdirected considering
“Space Avaialble” Report Review & Analysis
31
Hawaii is a leading international tourist destination with a quality convention center. The Research Brief attaches some stigma to the Hawaii Convention Center’s need and ability to fill unused dates. It is unclear why it would be a negative for any convention center to sell unused space or dates. Selling unused dates or space is basic to convention center operations. In this case the Hawaii Convention Center sold space to a rotating show that draws out-of-town attendees. In short, the Research Brief has offered a practical example of how a show that rotates annually has more options available today than ever before. Space Available Report, page 20:
“The end result is a kind of “churning” where meeting planners try out new venues and locations, responding to incentives and opportunities and the possibilities offered by a far larger number of centers with potential space. And if a new city or venue fails to support the level of attendance sought, there are always other alternatives.”
The Research Brief defines events that rotate as “churning”. Though in fact, many association shows rotate from city-to-city for the practical purpose of reaching their audience that is scattered across the country.

“Space Avaialble” Report Review & Analysis
32
Convention Center Exhibit Space Supply Growth Compared to Convention and Tradeshow Exhibit Space Demand Growth The table below provides a comparison of the expansion of convention center exhibition space and the growth of convention and tradeshow demand for space. This should not be reviewed as an exact “supply and demand” analysis. It provides the growth of total exhibition space supply in the U.S. and Canada compared to the annual growth of conventions and tradeshows with over 30,000 square feet of exhibit space. The data shows that it is hard to pin down an exact formula to determine if the relationship of convention center supply and demand is too high or too low. At various times over the past two decades the growth of convention center exhibition space supply and demand has fluctuated. During some periods supply growth has out-stripped demand, and at others the reverse has been the rule.
Convention Center Exhibition Space and Net Square Feet Demand Growth 1987 to 2008
-6.0%
-4.0%
-2.0%
0.0%
2.0%
4.0%
6.0%
8.0%
10.0%
12.0%
1987
1988
1989
1990
1991
1992
1993
1994
1995
1996
1997
1998
1999
2000
2001
2002
2003
2004
2005
2006
2007
2008
Net Square Feet of Paid Exhibit Space Convention Center Exhibit Space

“Space Avaialble” Report Review & Analysis
33
III.) Direct Spending and Economic Impact Space Available Report, page 2:
“Conventions are big business, attracting free-spending visitors booking downtown hotel rooms, eating at restaurants, and thronging theaters and night spots. At any rate, that’s the theory.”
That conventions and tradeshows drive considerable economic impact via attendee spending is not a theory. It is a fact. Municipal convention centers are primarily developed to stimulate new direct spending and economic impact in a city and metropolitan area. What is “new” about this spending is that it would not take place in the city if the convention center and event and tourism related infrastructure was not built. Most of this spending results from event attendees and delegates that are based outside the region visiting the area as a result of an annual event or an event that rotates into the city. Spending is also generated by event managers, and if the event has an exhibit space component, from the corporate exhibitors who spend on “show services” for their exhibit booths. These show services are often provided by local union labor. Direct Spending Convention, tradeshow, conference and meeting attendees as well as event producers and exhibitors spend a considerable amount to participate in events. A breakout of spending categories when these groups are in a city is provided below. Attendee Spending Categories
• Hotel lodging • Restaurants • Transportation (car rental, subway, bus, cab, private car, etc.) and parking • Retail stores • Work or job task related supplies and expenditures (copy and shipping services) • Event admission, tickets, registration, etc. expenses • Other tourism, entertainment and service spending

“Space Avaialble” Report Review & Analysis
34
Event Management Spending Categories
• Exhibit hall and meeting space rental • General service contracting, labor and decorations, etc. • Food and beverage, catering • Audio-visual services • Security • Equipment rental • Advertising, marketing and public relations • Registration management and staffing expenses • Conference expenses • Hotel expenses (direct expenses for the event) • Show management payroll related to on-site expenses • Entertainment, talent and speaker expenses • Staff lodging and entertainment
Total event management spending for large events can easily total in the hundreds of thousands in the city per event. Exhibitor and Sponsor Spending Categories
• Exhibit space rental • Exhibit booth set-up/tear-down and labor expenditures • Audio-visual • Computer rental • Cleaning • Other on-site show and event services • Supplies and equipment used in the exhibit booth • Security • Shipping • Work or job task related expenditures (copy services, etc.) • Special events such as corporate meetings, client or product launch entertainment,
parties and related activities • Advertising and promotion • Payroll and staffing and lodging • Event admission, tickets, registration, etc. expenses • Other products and services
The average sized tradeshow has about 300 exhibitors. Estimating that exhibitors may spend at least $2,500 in the city (a very low estimate), total spending would be $775,000 per show. Some exhibitors spend millions to participate in major industry shows.

“Space Avaialble” Report Review & Analysis
35
Convention and Tradeshow Producers Estimate Spending Activity by Attendees According to a January 2009 study of U.S. convention and tradeshow producers conducted by Tradeshow Week, the following activities represent the behavior of at least 25% of attendees when they are “in-town” for an event:
• Visit restaurants: 91% • Participate in “Other Entertainment”: 52% • Shopping: 44% • Stay Over in the City or Region Post-Event: 25% • Arrive Early for Pre-Event Site-Seeing: 19% • Cultural and Educational Activities: 17% • Sports Events: 12% • Outdoor Recreation: 6% • Family Events: 2% • Other Activities: 10%
The same survey found that event producers estimate that 17% of their event attendees bring a spouse or friend with them to the event host city. Economic Impact Studies Economic impact studies are usually based on two important data sets:
1. Direct, proprietary surveys of event delegates and attendees analyzing their spending during their visit.
2. Accessing spending benchmarks and multipliers from industry associations, the
Bureau of Economic Analysis and other organizations. When studying economic impact there are a number of factors to consider:
• Quantifying direct and secondary impacts – i.e., direct spending (“first round spending”) with multipliers applied to develop total impacts.
• Origination of event attendees – assessing the portion of the attendees that reside outside the greater metropolitan region.
• Event attendee spending – quantifying the spending in area hotels, restaurants, retail and other visitor industry establishments.
• Determination of net new spending – the portion of attendee spending that would not have taken place in the area had the event(s) not taken place.
• Tourism related employment and taxes.
“Space Avaialble” Report Review & Analysis
36
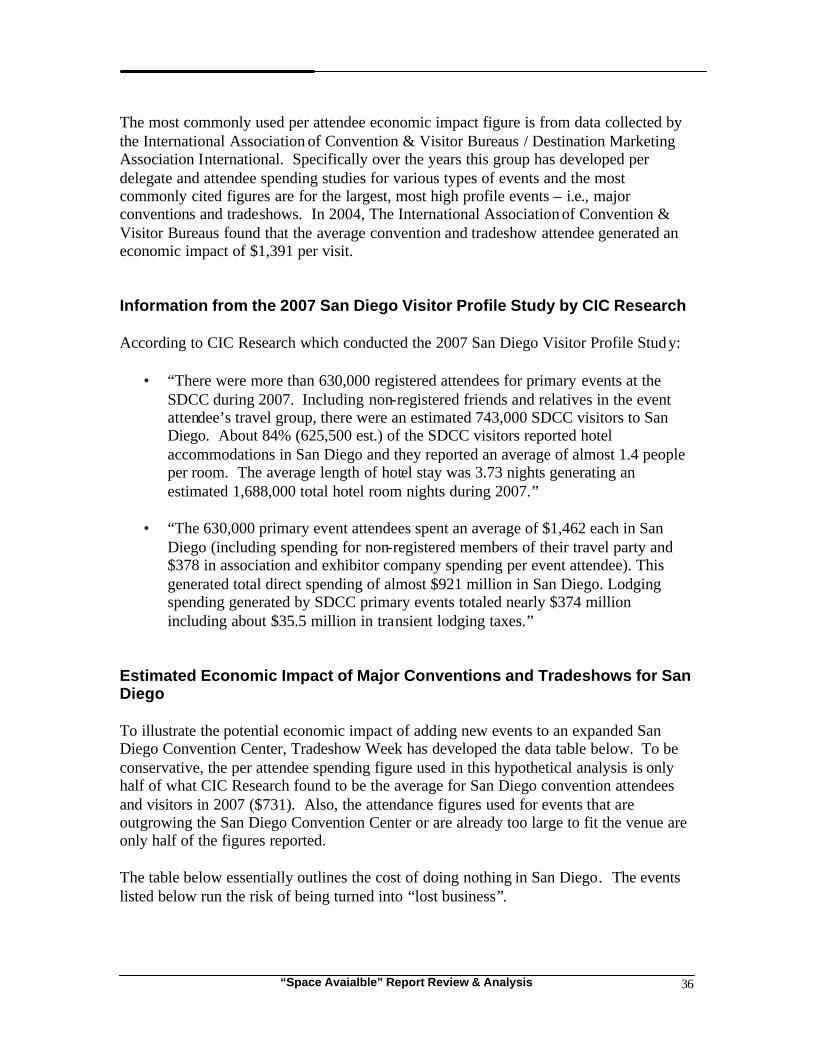
The most commonly used per attendee economic impact figure is from data collected by the International Association of Convention & Visitor Bureaus / Destination Marketing Association International. Specifically over the years this group has developed per delegate and attendee spending studies for various types of events and the most commonly cited figures are for the largest, most high profile events – i.e., major conventions and tradeshows. In 2004, The International Association of Convention & Visitor Bureaus found that the average convention and tradeshow attendee generated an economic impact of $1,391 per visit. Information from the 2007 San Diego Visitor Profile Study by CIC Research According to CIC Research which conducted the 2007 San Diego Visitor Profile Study:
• “There were more than 630,000 registered attendees for primary events at the SDCC during 2007. Including non-registered friends and relatives in the event attendee’s travel group, there were an estimated 743,000 SDCC visitors to San Diego. About 84% (625,500 est.) of the SDCC visitors reported hotel accommodations in San Diego and they reported an average of almost 1.4 people per room. The average length of hotel stay was 3.73 nights generating an estimated 1,688,000 total hotel room nights during 2007.”
• “The 630,000 primary event attendees spent an average of $1,462 each in San
Diego (including spending for non-registered members of their travel party and $378 in association and exhibitor company spending per event attendee). This generated total direct spending of almost $921 million in San Diego. Lodging spending generated by SDCC primary events totaled nearly $374 million including about $35.5 million in transient lodging taxes.”
Estimated Economic Impact of Major Conventions and Tradeshows for San Diego To illustrate the potential economic impact of adding new events to an expanded San Diego Convention Center, Tradeshow Week has developed the data table below. To be conservative, the per attendee spending figure used in this hypothetical analysis is only half of what CIC Research found to be the average for San Diego convention attendees and visitors in 2007 ($731). Also, the attendance figures used for events that are outgrowing the San Diego Convention Center or are already too large to fit the venue are only half of the figures reported. The table below essentially outlines the cost of doing nothing in San Diego. The events listed below run the risk of being turned into “lost business”.

“Space Avaialble” Report Review & Analysis
37
Events that are Outgrowing or are Already too Large for the San Diego Convention Center
Event Attendance Half of Attendance
Half of San Diego Attendee
Economic Impact
Est. Economic Impact
American Academy of Ophthalmology 24,000 12,000 $731 $8,772,000
American Academy of Orthopedic Surgeons 31,000 15,500 $731 $11,330,500
American Association of Retired Persons 25,000 12,500 $731 $9,137,500
American College of Cardiology 28,000 14,000 $731 $10,234,000
American Heart Association 30,000 15,000 $731 $10,965,000
American Institute of Architects 25,000 12,500 $731 $9,137,500
American Pet Products Manufacturing Association
10,000 5,000 $731 $3,655,000
American Public Transportation Association 19,000 9,500 $731 $6,944,500
American Urological Association 18,000 9,000 $731 $6,579,000
ASIS International 22,000 11,000 $731 $8,041,000
Biotechnology Industry Organization 25,000 12,500 $731 $9,137,500
Comic Com 125,000 62,500 $731 $45,687,500
ESRI 12,000 6,000 $731 $4,386,000
Golf Course Superintendents 15,000 7,500 $731 $5,482,500
Health Information Management Systems Society
28,000 14,000 $731 $10,234,000
Infocomm International 31,700 15,850 $731 $11,586,350
Institute of Food Technologists 25,000 12,500 $731 $9,137,500
International Helicopter Association 14,000 7,000 $731 $5,117,000
Microsoft Convergence 9,000 4,500 $731 $3,289,500
National Association of Music Merchandisers 35,000 17,500 $731 $12,792,500
Produce Marketing Association 18,600 9,300 $731 $6,798,300
Radiological Society of North America 61,000 30,500 $731 $22,295,500
SAP Sapphire 20,000 10,000 $731 $7,310,000
Society for Neuroscience 32,000 16,000 $731 $11,696,000
Water Environment Federation 16,000 8,000 $731 $5,848,000
Average 27,972 13,986 NA $10,223,766
Median 25,000 12,500 NA $9,137,500
Source: San Diego Convention Center Corporation; CIC Research
“Space Avaialble” Report Review & Analysis
38
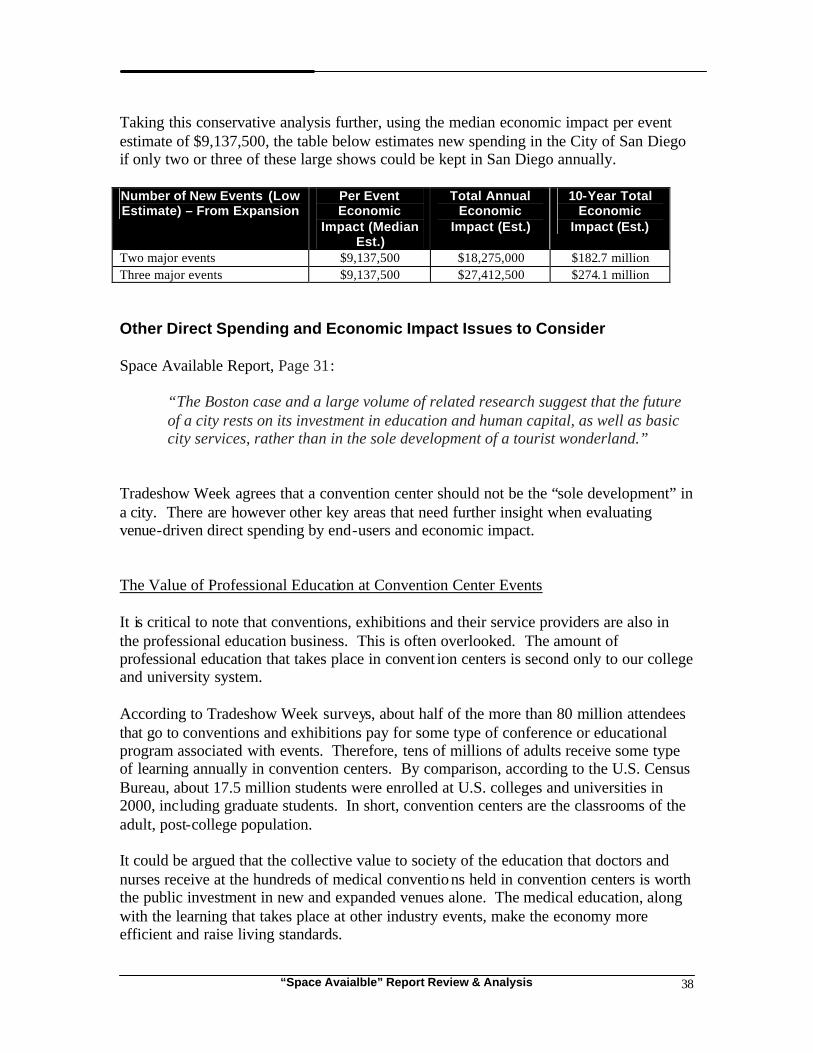
Taking this conservative analysis further, using the median economic impact per event estimate of $9,137,500, the table below estimates new spending in the City of San Diego if only two or three of these large shows could be kept in San Diego annually. Number of New Events (Low Estimate) – From Expansion
Per Event Economic
Impact (Median Est.)
Total Annual Economic
Impact (Est.)
10-Year Total Economic
Impact (Est.)
Two major events $9,137,500 $18,275,000 $182.7 million Three major events $9,137,500 $27,412,500 $274.1 million Other Direct Spending and Economic Impact Issues to Consider Space Available Report, Page 31:
“The Boston case and a large volume of related research suggest that the future of a city rests on its investment in education and human capital, as well as basic city services, rather than in the sole development of a tourist wonderland.”
Tradeshow Week agrees that a convention center should not be the “sole development” in a city. There are however other key areas that need further insight when evaluating venue-driven direct spending by end-users and economic impact. The Value of Professional Education at Convention Center Events It is critical to note that conventions, exhibitions and their service providers are also in the professional education business. This is often overlooked. The amount of professional education that takes place in convent ion centers is second only to our college and university system. According to Tradeshow Week surveys, about half of the more than 80 million attendees that go to conventions and exhibitions pay for some type of conference or educational program associated with events. Therefore, tens of millions of adults receive some type of learning annually in convention centers. By comparison, according to the U.S. Census Bureau, about 17.5 million students were enrolled at U.S. colleges and universities in 2000, including graduate students. In short, convention centers are the classrooms of the adult, post-college population. It could be argued that the collective value to society of the education that doctors and nurses receive at the hundreds of medical conventions held in convention centers is worth the public investment in new and expanded venues alone. The medical education, along with the learning that takes place at other industry events, make the economy more efficient and raise living standards.

“Space Avaialble” Report Review & Analysis
39
Moreover, the informal networking at events is nearly impossible to quantify financially, but is a primary reason why attendees participate. It is also important to consider the fact that municipalities invest in convention centers primarily to serve the national association industry with its rotating conventions and conferences that bring new spending to cities. Most associations are not- for-profit (as are convention centers). The public’s investment in venues primarily benefits associations that work to enhance their membership through education, information and commerce. Associations help enhance personal and organizational efficiency, which also translates into rising living standards. So in one sense, the value of convention center investment is real and quantifiable. In another, the impact is so vast that it is nearly incalculable. Consumer Shows Provide Real Economic Impact While most convention centers focus on booking business-to-business conventions, tradeshows, conferences and meetings, to drive attendance from outside the region, consumer and public shows also provide economic impact. Consumer shows are often a key sales and marketing outlet for many small businesses in a region. Consumer shows “make a market” for products and services throughout local economies. If merchants didn’t feel that consumer shows provided them with new sales leads and opportunities to meet new customers, consumer and public shows would not exist. Information from the Center for Exhibition Industry Research in Response to the Space Available Report “The economic theory of convention center construction is a combination of both immediate and long-term increased employment in the city, coupled with attracting visitors to the destination to attend events that otherwise would not come to the destination. The brief does not refute the theory; however it alleges that the employment benefit is overstated. The brief chose to focus on the number of full-time employees of hotels as an employment measure. That challenge to the employment benefit ignores the work force employed to build the facility and several extremely significant employee groups essential to producing a convention and exhibition. Contractors employ thousands of skilled and unskilled workers in the host community to handle materials, build and tear down exhibits, provide electrical power, water, waste, Internet connections and a host of services required to mount and dismantle each event. Temporary workers provide food service, security, transportation, registration support, booth personnel, cleaning, and a host of logistical functions during the event. The brief also failed to include exhibiting company expenditures as an element in the economic benefit.

“Space Avaialble” Report Review & Analysis
40
The immediate economic benefit of visitors to the city is first felt by those directly employed in the hospitality industry. That includes hotel workers, taxi drivers, and restaurant and retail employees. These workers then in turn stimulate the rest of the economy by spending their earnings. It is estimated a visitor dollar turns over seven times in a community before it leaves, thus the entire community is positively impacted economically by the new revenue the exhibition provides.” How is Convention Center Success Measured? The Space Available Report looks at total attendance at convention centers, but a better metric to analyze is hotel room nights. In fact, according to a 2007 Association for Convention Sales and Marketing Executives and Tradeshow Week survey, “total number of booked hotel rooms” is primarily how convention centers are measured. “Total number of visitors” is considered one of the success measures by only 36% of venues and CVBs.
How is Convention Center Success Measured?
1. Total number of booked hotel rooms 79% 2. Total economic impact 68% 3. Convention center profit / loss 45% 4. Hotel community occupancy levels 38% 5. Total number of visitors 36% 6. Visitor-related tax revenues 30% 7. Public relations 21% 8. Hotel community gross sales/profit 7% 9. Bureau profit/loss 2% 10. Other 16% 11. Do not measure 11%
Source: Association for Convention Sales and Marketing Executives and Tradeshow Week Survey of Venue and CVB Executives
“Space Avaialble” Report Review & Analysis
41
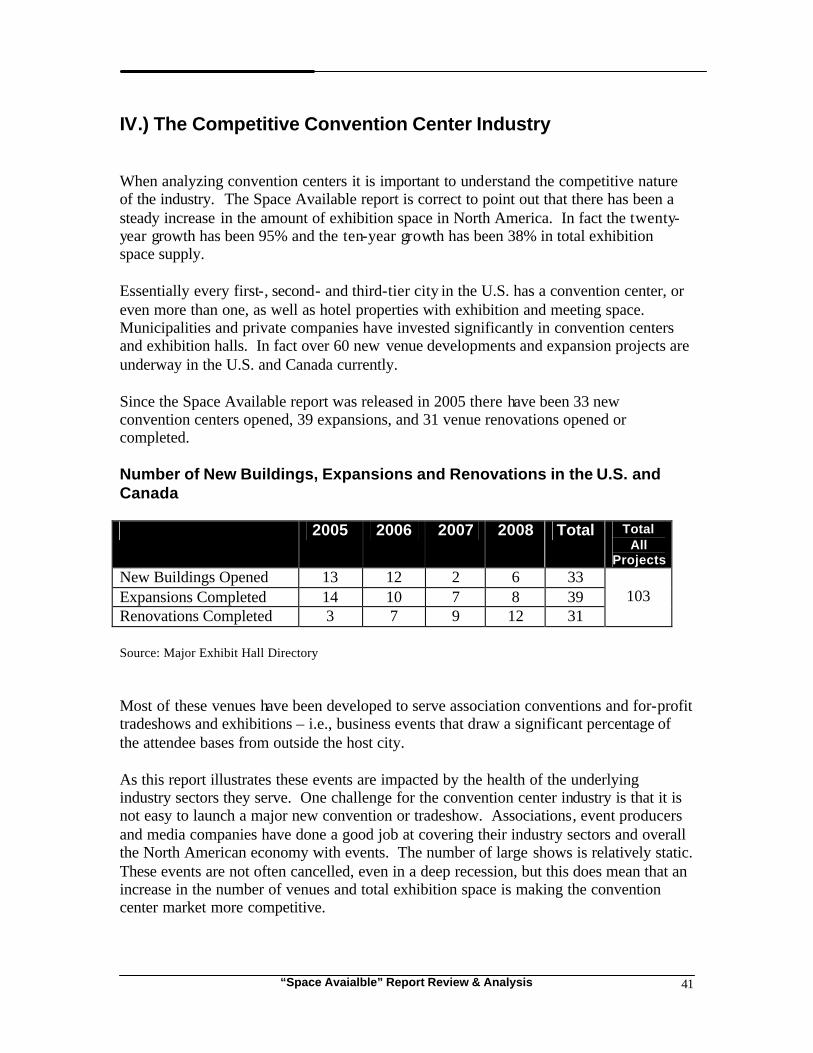
IV.) The Competitive Convention Center Industry When analyzing convention centers it is important to understand the competitive nature of the industry. The Space Available report is correct to point out that there has been a steady increase in the amount of exhibition space in North America. In fact the twenty-year growth has been 95% and the ten-year growth has been 38% in total exhibition space supply. Essentially every first-, second- and third-tier city in the U.S. has a convention center, or even more than one, as well as hotel properties with exhibition and meeting space. Municipalities and private companies have invested significantly in convention centers and exhibition halls. In fact over 60 new venue developments and expansion projects are underway in the U.S. and Canada currently. Since the Space Available report was released in 2005 there have been 33 new convention centers opened, 39 expansions, and 31 venue renovations opened or completed. Number of New Buildings, Expansions and Renovations in the U.S. and Canada 2005 2006 2007 2008 Total Total
All Projects
New Buildings Opened 13 12 2 6 33 Expansions Completed 14 10 7 8 39 Renovations Completed 3 7 9 12 31
103
Source: Major Exhibit Hall Directory Most of these venues have been developed to serve association conventions and for-profit tradeshows and exhibitions – i.e., business events that draw a significant percentage of the attendee bases from outside the host city. As this report illustrates these events are impacted by the health of the underlying industry sectors they serve. One challenge for the convention center industry is that it is not easy to launch a major new convention or tradeshow. Associations, event producers and media companies have done a good job at covering their industry sectors and overall the North American economy with events. The number of large shows is relatively static. These events are not often cancelled, even in a deep recession, but this does mean that an increase in the number of venues and total exhibition space is making the convention center market more competitive.

“Space Avaialble” Report Review & Analysis
42
Today, cities are often still developing new venues or are expanding their facilities – but they are also getting more sophisticated in terms of marketing to events. In the face of this competition, it is understandable if cities and venues considered holding back on their investment in venues and marketing. But to date, no first or second tier city has officially “gotten out of the convention and meetings business”, even those that may have lost market share recently. What is happening is that the increasing competition for conventions and tradeshows has spurred more investment and improved marketing because these cities and their convention bureaus feel they are still receiving a quality return on investment. In November 2008, Tradeshow Week surveyed over 150 convention center managers. The survey found that 63% of venue managers feel they will require a new build, renovation or expansion in the next five to ten years to remain competitive with other venues.

“Space Avaialble” Report Review & Analysis
43
V.) Convention Center Critical Success Factors and City Success Stories: Boston, Denver, Las Vegas and San Diego Cities do not, or should not, rely on building new convention centers and major expansion projects alone to be successful. A number of location-based and market-related critical success factors for convention centers are listed below. Location-Based
• Venue location, i.e., integrated within a city center rather than “stranded” • Proximate cultural, entertainment and restaurant amenities • Appropriate hotel(s) close to or attached to venue • Airport capacity and distance from venue • Distance from regional feeder markets/population centers • Access to major area highways and public transportation hubs • Political and community support (for municipal venues)
Market-Related
• Regional professional and economic demographics including population, average household income higher than or similar to competitive markets, etc.
• Regional industry concentration(s), e.g., technology concentration, medical etc. • Adequate inventory and pricing of available hotel rooms • Lodging market seasonality and occupancy patterns • Strengths or weaknesses of competitive set • Additions to supply • Overall convention and meetings industry growth • Exhibited demand for facility (lost business reports, etc.) • Management and marketing expertise • Ability to hold several events, including various large tradeshows, at the same
time

“Space Avaialble” Report Review & Analysis
44
The table and information below analyzes the last decade in terms of the expansion of total exhibition space in four leading convention host cities.
1999 Gross SF Exhibit
Space
2008 Gross SF Exhibit
Space
Added Exhibit
Space SF
TSW 200 Events 1999
TSW 200 Events 2008
Added TSW 200 Events
Boston – Hynes Convention Center and Boston Convention & Exhibition Center (not open in 1999)
193,000 516,000 + 323,000 0 5 +5
Denver – Colorado Convention Center
300,000 584,000 + 284,000 0 2 +2
Las Vegas – Las Vegas Convention Center; Sands Expo; Mandalay Bay Convention Center (not open in 1999)
2,156,233 4,000,962 + 1,844,729 34 49 +15
San Diego – San Diego Convention Center
349,338 616,363 + 267,025 1 10 +9
Source: Major Exhibit Hall Directory and Tradeshow 200 The four cities in the table above are different in many ways, but their success has been based not only on adding exhibition space but a number of additional similar features. These include:
• All four cities in the table above have developed quality, new hotels near-by the main convention center(s).
• In three of the four cities essentially one organization is in control of the venue
marketing. Sales and marketing for the main convention centers are maintained solely by the venue owner in Boston (an authority) and San Diego (a corporation), instead of the CVB. In Las Vegas, the Las Vegas Convention Center is owned and managed by the Las Vegas Convention & Visitors Authority which is also the “CVB” for the city. The Colorado Convention Center is owned by the state but managed by a private facility management company SMG.
• Until the recent recession, all four cities experienced relatively strong economic
growth, in particular the cities in the Western U.S.: Denver, Las Vegas and San Diego.
• All four cities have unique tourism, entertainment and/or cultural attributes that
help drive event bookings and attendance. • The venues in Boston, Las Vegas and San Diego are relatively close to the
airports in these markets.
“Space Avaialble” Report Review & Analysis
45
VI.) Specific Convention Center Developments Cited in the “Space Available” Report This section analyzes a number of the Space Available report’s city- and venue-specific claims with a focus on some of the major national host cities: Chicago, New York, Atlanta, New Orleans, Las Vegas, Orlando, Boston and San Francisco. Chicago Space Available Report, page 7:
“Chicago’s McCormick Place is prime example of a successful center feeling the squeeze of recent trends. Propelled by a series of expansions, McCormick has led the space race since the 1960s and today boasts 2.2 million square feet of exhibit space. It has also hosted the greatest fraction of the Tradeshow Week 200 event s. In 1991, McCormick held 28 of the “200,” second only to New York. Two years later, that total reached 30 events with attendance (including exhibitors) of 1.1 million, putting Chicago first in events ahead of Las Vegas (26) and New York (25). At its peak in 1996, the center managed 24 of the “200” with attendance of 1.14 million.
Space Available Report, page 7
“By 1999, however, the tide began to shift. McCormick’s convention and tradeshow event count for that year fell to 22 with attendance of 831,163. Although attendance grew to 960,149 in 2000, by 2002, the event count was only 19, with attendance of just 688,354 (Figure 3). Things began to look up in a bit in 2003, with an event count of 25 and attendance of 767,207.
In the passage above the Research Brief is reporting on the Tradeshow 200 shows not all conventions and exhibitions hosted by McCormick Place. So while it indicates “McCormick’s convention and tradeshow event count for that year fell to 22”, a number that seems exceptionally low, this is actually 22 of the 200 largest shows in the U.S. By this measure Chicago ranked second to Las Vegas, which hosted 34. Space Available Report, page 7
“The picture is less rosy if you look at McCormick’s total attendance in 2003, which includes public shows along with conventions and tradeshows. The 2003 total attendance figure of 2,512,168 is substantially below the levels for 2002 (2.7 million), 2001 (3.0 million), and 2000 (3.3 million), amounting to a drop of 25

“Space Avaialble” Report Review & Analysis
46
percent over the three year period. Indeed, it is the lowest total since the attendance reports began in 1994.”
The primary method for assessing McCormick Place is pitting recession era data against earlier U.S economic growth years. The Research Brief also skips over the rise of Las Vegas, Orlando and San Diego as convention powerhouses, and also the expense of exhibiting in Chicago due to union rules. It has taken years to realign union costs at McCormick Place that for years hampered exhibitors. A Tradeshow Week article published June 6th, 2004 included these details: “Matters came to a crescendo at McCormick Place recently after the Chicago Sun-Times ran a detailed account of the criminal records and questionable backgrounds of current and former members of the Machinery Movers, Riggers and Machinery Erectors Union Local 136. …Tradeshow consultant Candy Adams said McCormick Place has a tough contract. “You'll get the most number of people working in your exhibit.” For instance, if you order a forklift driver, you'll also get a spotter and a supervisor, and still have to wait for an electrician to show up.” In a more recent Tradeshow Week article (6/23/2008) its clear that McCormick Place unionized labor has come a long way toward meeting true exhibitor needs: “New rules that could be easier on exhibitors' pocketbooks include straight time rates from 4:30 to 8:30 p.m. Monday through Friday at the break of a show and the time-and-a-half rate window being expanded from eight hours to 12 hours on Saturdays, said Juan Ochoa, president and CEO of the Metropolitan Pier and Exposition Authority. Previously, time-and-a-half and double overtime rates were charged, respectively. “That's pretty good in terms of what the overall costs will mean to the shows,” he added. “(It shows) we're consistently moving in the right direction as it relates to our competitiveness.”

“Space Avaialble” Report Review & Analysis
47
New York Space Available Report, page 7:
“New York City’s Jacob K. Javits Convention Center is decidedly smaller than McCormick Place with only 800,000 square feet of exhibit space, but in 1991 it led the nation in the count of “200” events with 29. The ensuing years saw a marked shift in New York’s preeminence, however, with its “200” total falling to just 18 by 1997, 15 for 2000, and 14 in 2003, as the city was obliged to compete with other destinations.
It is true that the Javits Center, like McCormick Place and all other venues are “obliged to compete with other destinations.” Essentially the Research Brief is pointing out that the Javits Center, which did not expand, is now losing market share to the venues that expanded. Notable competition during the timeframe measured by the Research Brief is the rise of Las Vegas, Orlando and San Diego as destination and event industry leaders. Space Available Report, page 7:
“Overall, the Javits Center housed about 60 conventions and tradeshows annually through the 1990s. But since the Javits managed its peak convention attendance from these events, 1.4 million in 1997, the pattern has been similar to that of Chicago. Despite boosting its convention and tradeshow event count from 62 in 2000 and 61 in 2001 to 70 in 2003, attendance slipped first to 1.25 million in 2000, then to 977,600 in 2001, 931,850 in 2002, and finally 955,150 for 2003. Overall, the Javits’ convention and tradeshow attendance has dropped 32 percent from the 1997 total.”
Event demand, in terms of the number of shows hosted in the Javits Center, is testament to New York City’s destination appeal. However, show size has been capped by the limited size of the venue. The Research Brief completely misses or fails to mention the reasons behind a drop in attendance. A January 2005 Tradeshow Week article examined the happenings at the Javits Center. Below is an excerpt from the article: “There have been gripes about the glut of exhibit space for years, especially in smaller U.S. cities; however, several large and midsize metropolises — such as New York, Las Vegas, Philadelphia and Indianapolis — turn business away as they race to keep up with exhibition space demand. Sanders states in the 36-page report that — among other cities — New York has seen a “significant loss in recent convention activity.”
“Space Avaialble” Report Review & Analysis
48
However, the city's Jacob K. Javits Convention Center reports that it has had to avert tradeshows for years due to its lack of space. Managers of the facility's existing shows have had long waiting lists of exhibitors, because their shows' growth has been stunted by the facility's size. In December, the Javits' long-awaited $1.4 billion expansion was approved and, within hours of its go-ahead, show managers were fighting for choice future dates. New York is “a perfect example of a destination where demand has remained high,” said Robert Canton of PricewaterhouseCoopers' convention and tourism practice. Canton, who wrote an analysis supporting the Javits expansion, said Sanders' study is flawed by its countless blanket statements about expansions. “You have to really understand each individual market,” Canton said. Furthermore, he said, major convention centers that responded to PWC's 20-year-old occupancy survey indicated that demand for exhibit space increased 7 percent between 2003 and 2004. Sanders disagrees — slightly. “It's not clear that the (Javits) expansion would yield any addition tradeshow attendance beyond what was there in the 1990s,” he said. However, Sanders added, the likelihood that the expansion's projected additional attendance will show up is “of course, open to question.” PWC's feasibility study projected that an expanded Javits Center would attract an incremental attendance of approximately 419,000 visitors per year.” Pent-Up Demand for New Apparel Tradeshows at the Javits Center – from a New York City Economic Development Corporation 2008 Study According to a 2008 study conducted by the New York City Economic Development Corporation, the primary issue impacting New York City fashion and apparel tradeshow producers is their demand for more convention and exhibition space at the Javits Center and around the city. The study uncovered apparel show producers’ interest to grow existing tradeshows and to launch new events in New York City. In fact, the study uncovered pent-up demand for 24 new shows to be launched and expanded with more exhibition space and that this level of new event activity could drive an incremental $175 million in annual travel-related spending in the city. Source: New York City Economic Development Corporation

“Space Avaialble” Report Review & Analysis
49
Atlanta Space Available Report, page 8:
“Atlanta’s Georgia World Congress Center (GWCC) has also been among the nation’s dominant centers, with a total of 18 “200” events in 1991. Fueled by substantial state fiscal support, GWCC expanded in 1992 to 950,000 square feet, and again in June 2002 to a total of 1.4 million square feet of exhibit space. The convention and tradeshow attendance at the GWCC boomed through the 1990s with the exception of the year when it was largely used in support of the Olympic Games, reaching a total of 837,752 attendees in fiscal 1997 (ending June 30, 1997).” “By fiscal 1999, as Figure 4 shows, that total had slipped to 723,284, and by fiscal 2002 fell further to 569,887. The expansion of the center—opened in June 2002 (prior to the 2003 fiscal year)—was justified in large part by a consultant study that forecast increased attendance, to 1.45 million by 2006.”
The 2006 Annual Report released by the Georgia World Congress Center (GWCC), which is based on actual data rather than the Research Brief’s predictions, tells a very different story of its performance. The GWCC 2006 annual report states “An estimated 1.4 million visitors attending events at the Georgia World Congress Center during Fiscal Year 2006 generated an estimated $1.5 billion for the local and state economy.” This is very close to the Research Brief’s doubting mention of “a consultant study that forecast increased attendance, to 1.45 million by 2006.” The actual attendance according to the GWCC annual report was 1,380,617. Space Available Report, page 7:
“Instead, convention and tradeshow attendance came to just 512,194 in fiscal 2003, lower than the year before. Preliminary attendance figures for fiscal year 2004 show total convention and tradeshow attendance dropping even further, to 396,517—less than half the fiscal 1997 sum.”
The Research Brief is pulling data from an economic recession as a means to suggest the Georgia World Congress Center (GWCC) is in a state of freefall. A few years after the release of the Research Brief, the economy turned and the GWCC experienced noticeable growth. Below are a few excerpts from the GWCC 2006 Annual Report:

“Space Avaialble” Report Review & Analysis
50
• “Fiscal Year 2006, ending June 30, was extraordinary for the Georgia World Congress Center. Starting the year with a forecast net operating loss of over $1 million, a profit of $4.4 million was unexpected.”
• “The nation’s fourth largest convention center hosted 56 major tradeshows, 20
public and consumer shows and 276 meetings and other events in FY 2006. This represents an increase of 19 events from the previous year, including 17 tradeshows. The excellent reputation of the convention center and a rebounding economy played important roles in this growth.”
• “According to a University of Georgia study conducted by the Selig Center for
Economic Growth, these visitors spent 1.5 million “new dollars” in Georgia restaurants, hotels, retail shops and on entertainment, generating an economic impact of more than $2.5 billion.”
• “The facility generated more than $198 million in state and local tax revenue.”
• “The Georgia World Congress Center also boosts the state’s economy by
sustaining jobs in the hospitality industry. Events held at the GWCC sustained 32,567 jobs totaling personal income of $969 million for the state’s workforce.”
Source: Georgia World Congress Center Authority, 2006 Annual Report New Orleans Space Available Report, page 8:
“A prime visitor destination city, New Orleans’ Morial Convention Center is the fourth major U.S. convention facility. For 1998, just prior to the opening of a major expansion, the Morial managed total convention attendance (including exhibitors and guests) of 789,271. With a boost to 1.1 million square feet of exhibit space in January 1999, the center hit a record total attendance of 1.06 million (Figure 5). A year later, however, the center’s attendance slipped to 834,947, dropping each year after to just 622,250 for 2003—a loss of 41.5 percent from 1999.”
Again, this is partly a measure of performance during a U.S. economic downturn. In the chart below, originally from the Research Brief, we added notable happenings in U.S History to help clarify cause and effect on trade show attendance. The added data is boxed in green highlight.

“Space Avaialble” Report Review & Analysis
51
Space Available Report, page 8:
“In sum, despite their historically dominant competitive position and place as major commercial centers, Chicago, New York, Atlanta, and New Orleans have all seen significant recent loss in convention activity, even as they expanded their convention centers. In part, their losses reflect the emergence of two new convention locales, which have succeeded in both massively expanding their own exhibit space and luring events and attendees from the traditional destinations.”
Yes, the key trend impacting convention centers to this day – besides the economic slowdown – is that this industry continues to become more competitive. The rise of Las Vegas and Orlando over the past ten to twenty years has had an impact on all cities vying to host conventions and exhibitions. Las Vegas Space Available Report, page 9:
“But as Figure 6 indicates, the convention center began to face a more difficult competitive situation starting in 2001. Despite the major expansion in 2002, attendance dropped that year, and then fell again in 2003 to less than 1.2 million. Measured in terms of average attendance per convention event, the Las Vegas center has seen a dramatic fall-off in the last two years—from an average of 26,154 in 1999 to just 16,369 in 2003.”
In addition to the downturn in the U.S. economy, the Research Brief actually goes on to explain some of the competition within Las Vegas:

“Space Avaialble” Report Review & Analysis
52
“The Las Vegas Center’s most recent performance may in part reflect the impact of a new privately-owned convention center in the city. The Mandalay Bay Convention Center opened in 2003 with 1 million square feet of exhibit space, and has already lured events from other venues, including the SIA SnowSports tradeshow from the Las Vegas center and Promotional Products Expo from Dallas.”
In a Tradeshow Week article (1/31/05) released just after the Research Brief, additional reasoning is offered for the Las Vegas Convention Center’s expansions. Below is an excerpt from that article: “The Las Vegas Convention Center is one facility that may never have enough space. The massive center was one of three venues for the Jan. 6–9 Intl. CES, which spanned over 1.5 million net square feet. The Las Vegas Convention & Visitors Authority in January unveiled a $400 million expansion and renovation of the LVCC. Although the project will only add about 40,000 sq. ft. of exhibit space, the reward from retaining popular shows like Intl. CES is priceless. This year, Intl. CES generated $167.4 million in non-gaming economic impact and broke attendance records, with an estimated 142,585 attendees.” Orlando Space Available Report, page 10:
“Orlando’s annual convention and tradeshow event count grew from 66 in 1990 to 116 in 2000, with parallel attendance growth from 376,973 to 921,247. The center then saw a dramatic attendance drop in 2001, with a modest recovery in 2002 to a level still well below that of 1998, 1999, and 2000. The center managed another increase of 5.9 percent to 859,188 for 2003, some 60,000 of whom attended events in the newly opened North/South Hall.”
The down year in 2001 may be the result of terror attacks perpetrated on September 11, 2001. Also, the downward trend in the U.S. economy was a likely factor. Space Available Report, page 10:
“Perhaps the most telling point about Orlando’s performance is the projected level of attendance (based on bookings) for 2004 and 2005, with double the exhibit hall space of previous years. The Orange County center is forecast to

“Space Avaialble” Report Review & Analysis
53
house just 113 conventions and tradeshows in 2004 with estimated attendance about 1.1 million. And as of mid-June 2004, definite bookings for 2005 come to only 77 conventions and tradeshows with estimated attendance of 955,000. So with double the space built at a cost of $748 million, Orlando will probably see only slightly more convention business than it managed in 2000.”
Despite the short term assessment of Orlando and Las Vegas, Heywood Sanders the author of the Research Brief, is actually bullish on the long term outlook of both cities. In January 2005 Tradeshow Week published an article covering several points raised in the Research Brief. Below is an excerpt from the 2005 Tradeshow Week article: “Another January show, THE INTL. BUILDERS' SHOW, made Orlando city officials grateful for their continual investments in the 2 million-plus sq. ft. Orange County Convention Center. The show was the OCCC's largest show ever — at more than 1.5 million gross sq. ft. with 105,000 attendees. Nevertheless, Sanders claims in his report: “Las Vegas and Orlando too have been hard hit by the recent change in the industry, with major new expansions yielding almost nothing in terms of increased business.” However, Sanders told TSW, Orlando is “really quite promising. I would say that the OCCC will do well,” but, he added, “some folks may go to Orlando and choose not to come back.” Besides, Las Vegas and Orlando will always be the powerhouses of the industry, Sanders said. “A city like Las Vegas or a community like Orange County (Fla.) have revenue bases that year in and year out will generate so much money that they can out-market, out-advertise and out build almost anyone else,” he said.” Boston Space Available Report, page 11:
“During the 1990s, hotel room nights averaged about 328,000, with a peak of 401,367 in 2000. As Figure 7 shows, the 2001 total dropped to 337,200 and fell to 253,698 for 2003. The center’s occupancy rate, which had varied between 65 and 70 percent during the 1990s, fell to 52 percent in 2002 and 2003. Booking estimates for 2004 indicate about 258,000 hotel room nights—a continuation of the 2003 activity level. And estimates based on bookings for the next few years show no evidence of a turnaround, with about 260,000 room nights for fiscal year 2005 and 220,000 for fiscal 2006.”

“Space Avaialble” Report Review & Analysis
54
Similar to most findings in the Research Brief that point to a drop in attendance during 2001, Boston was not immune to the aftershocks of terror attacks of September 11, 2001. Also, larger forces in the U.S. economy contribute to decreased travel and convention participation. A review of the 2007 Massachusetts Convention Center Authority (MCCA) Annual Report indicates growth in key convention areas. According to the MCCA Annual Report “Bookings are up nearly 10 percent from 2006 and over the next five years more than 600 projected events will be held at the Hynes, with nearly 1.8 million attendees and 1.5 million hotel room nights.” The 2008 MCAA Annual Report details increased revenue at Hynes, particularly noting, “Hynes Convention Center set a record for annual revenues as it continues to draw mid-sized meetings and conventions that thrive in the downtown setting of the Boylston Street neighborhood.” Space Available Report, page 11:
“Even as the Hynes has been losing business, the Massachusetts Convention Center Authority has been busy building a new Boston Convention and Exhibition Center with some 512,000 square feet of exhibit space, which opened in July 2004. The 1997 market and feasibility study for the new BCEC projected a total of 38 events with 302,800 attendees yielding 398,135 room nights for the center’s first year of operation, rising to 57 conventions and tradeshows with 470,600 attendees (and 675,000 room nights) by the fifth year. Current bookings show only six events (including four conventions) with about 65,000 attendees for the partial first year. But even that figure is wildly inaccurate, as it includes an estimated 50,000 attendees for the July 2004 East Coast Macworld Expo. The actual attendance for Macworld came to just over 8,000. For 2005, the authority has about 67,000 room nights on its books. Current estimates are that the BCEC will reach about 200,000 room nights in fiscal year 2008, less than a third of the feasibility study estimate. And a large fraction of the center’s future business represents events like the Boston Seafood Show, New England Grows, and the Boston Gift Show—events that have long been held in other Boston venues.”
The reality in the Boston convention centers is more positive than the Research Brief projections. Overall the MCAA 2008 Annual Report notes continued growth and success for the combined convention centers.
• “In 2008, the BCEC and the Hynes Convention Center generated $522.2 million in economic impact against $68 million in operating costs. The MCCA saw an 18% percent increase in attendees at the 239 events hosted by the BCEC and the Hynes.”
• “Since the BCEC’s opening in 2004, the MCCA has seen over one million
attendees and exhibitors from all industries convene in Boston from all corners of
“Space Avaialble” Report Review & Analysis
55
the world. This surge has resulted in an enormous economic impact for the Commonwealth: more than $1.7 billion in the last four years.”
Source: 2008 Massachusetts Convention Center Authority (MCCA) Annual Report San Francisco Space Available Report, page 12:
The convention attendance at Moscone came to 728,771 at 56 events for fiscal year 1997–98, followed by 790,548 the following year. A sharp drop in fiscal 2000 was followed by a return to previous level—737,694 at 52 events in fiscal 2001 (prior to September 11). Convention attendance and events then dropped for 2002, and again for fiscal 2003. The fiscal 2003 attendance of 600,975 was 24 percent less than the peak in fiscal 1999, and about equal to Moscone’s attendance in fiscal 1993. The convention event count came to 39—a 36 percent drop from fiscal 1999.
The first consideration is the U.S. economic downturn between 2000 and 2003. The Research Brief particularly notes “The fiscal 2003 attendance of 600,975 was 24 percent less than the peak in fiscal 1999, and about equal to Moscone’s attendance in fiscal 1993.” A close look at U.S. GDP over this same span indicates GDP growth dropped from 4.5% in 1999 to a low of .08% in 2001 and finally 2.5% in 2003. Also, much like the attendance levels in 2003 falling inline with 1993 levels, GDP grew 2.5% in 2003 and an eerily similar 2.7% in 1993. Another factor to consider with the expansion at Moscone is the somewhat unconventional add-on of exhibit space in Moscone West in 2003. Moscone West is not physically attached to the Moscone Center, a factor that is perceived as a negative attribute by show producers. The Moscone Center was also impacted by the significant slowdown in IT conventions, tradeshows and corporate events following the “dot.com” bubble.

“Space Avaialble” Report Review & Analysis
56
VII.) Areas in Which Tradeshow Week Agrees with Heywood Sanders This chapter analyzes areas in which Tradeshow Week agrees with points made in the Space Available report. Space Available Report, page 3:
“National data on a great many sectors of the economy—retail sales, new home starts, public and private construction, air travel, auto sales, manufacturing orders—is readily available in a consistent and relevant form. Not so for the convention and tradeshow industry.” “Despite the commitment of billions of dollars by a variety of state and local governments, the available national data on convention demand is at best scant, murky, and of limited reliability. The national market data regularly employed by consultants comes from a small number of industry sources, and often reflects estimates rather than performance, guesses rather than substance.”
It has long been an issue with the trade, convention and event industry that there is not one unified voice. Considering the size and scope of the industry it is somewhat surprising that The Bureau of Economic Analysis does not provide GDP performance for the event industry, which is estimated as follows:
• $130 billion total market size (with attendee travel spending included) • Exhibitor spending: approximately $20 billion • Show owners, producers revenues: $10 billion • 4,500+ major shows in U.S. and Canada; tens of thousands of conferences.
One possible explanation for this dearth in industry data is the fragmented nature of the event industry. No investor group has built a mega-company that controls more than a single-digit-percentage share of the North American exhibition market. Space Available Report, page 4:
“What supposedly justifies the public commitment to a convention center in the face of the cost of debt service and operating loss is its potential yield in convention and tradeshow attendees, a yield that is a function of larger economic and market forces, the competitive position of an individual city, and efforts of every other community seeking a piece of the convention “boon.” In other words, the real test for Washington, or Chicago, Orlando, or even Schaumburg, is how many people come and what they leave behind for the local economy.”
“Space Avaialble” Report Review & Analysis
57
Agreed, the industry is competitive and incapable of consolidating, i.e., Chicago will never buy Orlando and put Orlando out of business. What’s at stake is a per attendee economic impact of $1,400 per person per visit. The event industry is a $130 billion annual industry – with over half from attendee/visitor spending (80 million total attendees). Space Available Report, page 9:
“Orlando’s Orange County Convention Center, like the Las Vegas Convention Center, has benefited from the combined fiscal benefit of tens of thousands of local hotel rooms— which generate a substantial revenue stream for center expansion and marketing—and the unique leisure and visitor amenities of its location.
Agreed, abundant local hotel rooms, substantial potential revenue streams for expansion and marketing, unique leisure and visitor amenities are key factors that could contribute to success. Space Available Report, page 17:
“As new industrial sectors and new products rise, for-profit event organizers will seek to capitalize on the opportunity for new shows and new locations—all to the benefit, of course, of those cities able to land them.”
Agreed, for-profit event organizers seek to capitalize on opportunity. Cities that book tradeshows will benefit from the economic input. Space Available Report, page 28:
“One solution to this issue would to subject these consultant feasibility and market studies to a process of independent, outside audit and review that assesses the assumptions which undergird the promises, and the methodology which shapes the performance forecasts and predictions. Where a consulting firm has a history of overestimating likely attendance or economic impact, that history and background should play a role in assessing the potential for success and the likelihood of failure.”
Agreed, cities and their convention center assessment committees must do their “due diligence” before deciding whether to proceed with a convention center new build, expansion or renovation.
“Space Avaialble” Report Review & Analysis
58
Data Sources
• “Space Available”, Brookings Institution • Bureau of Economic Analysis • CEIR • Executive Outlook Corporate Exhibitor • Executive Outlook Show Management • GWCC • HVS • IACVB/DMAI • MCCA • NYCEDC • San Diego Convention Center Corporation • Surveys of Convention and Tradeshow Managers • Surveys of Convention Center General Managers • Surveys of Corporate Exhibitors • Tradeshow Week 200 • Tradeshow Week Data Book • Tradeshow Week Major Exhibit Hall Directory • Tradeshow Week Quarterly Reports • U.S. Bureau of Labor Statistics • U.S. Census Bureau, 2002 County Business Patterns
“Space Avaialble” Report Review & Analysis
59
Appendix I: Industry Response to the Space Available Report In February 2005, Tradeshow Week asked a number of industry members their thoughts on the Space Available report. Below are the responses from industry leaders in the convention center, convention and visitor bureau and event management sectors. Michael Gehrisch, President and CEO IACVB (Now the Destination Marketing Association International – DMAI) “Professor Sanders has fervently expressed his point of view now for almost 20 years. Yet we have seen continuing convention center success — and the resulting rewards. “Sanders correctly asserts that due diligence and integrity in research is necessary when proposing a new or expanded convention center project. However, what is confounding in this latest assault against convention centers is the merely casual acknowledgement of negative influencing factors of the last decade: a milestone recessionary U.S. economy; Sept. 11, 2001 (and all the lingering effects of terrorism fears); the Iraq war; and the SARS outbreaks. “Unfortunately for our industry, many centers were already on the build or newly completed when this unprecedented confluence of extraordinarily unfavorable events occurred. Had it not been for the diligent efforts of our member CVBs and local community support of convention travel, the effects would have been even more severe. “Intl. Assn. of Convention & Visitor Bureaus appreciates tha t USA Today in its Jan. 17, 2005, article, 'Convention centers grow, fewer go,' included positive predictions from the Travel Industry Assn. of America for leisure and business travel and Tradeshow Week's exhibition outlook. All of travel and tourism is poised for a comeback.” * * * * * James E. Rooney, Executive Director Massachusetts Convention Center Authority “I find it interesting that the opinion of one man, who clearly doesn't understand the industry, gets so much coverage in the national press, yet he doesn't seem to be stopping anyone from going forward with their building and expansion plans. “Sanders skillfully uses a downturn in the economy, industry-generated data, inflated bookings and economic projections against the convention industry — and I include Boston in that criticism. The bookings projections of the mid-1990s made in support of

“Space Avaialble” Report Review & Analysis
60
building a new center in Boston were wildly exaggerated, but we would have built it anyway. “I do not subscribe to Sanders' glass-half-empty view of the industry. However, I caution cities not to set expectations that may never be achieved and that Sanders will use to haunt them later — as he is me.” * * * * * Nathan Smurdon Meetings Sales Manager Indianapolis Convention & Visitors Association “Convention attendance is only one indicator of performance and, in reality, a weak and incomplete one. The success of a destination and its convention facilities is better gauged by hotel room demand, room revenue generated and visitor spending in the community. “While these metrics may be more difficult to tabulate, they better represent the impact of a convention facility on the local community. It obviously takes much more than just the construction of a convention center to attract groups to a destination.” * * * * * Chris Bowers, CEO Chicago Convention & Tourism Bureau “This report is a very narrow focus of a rapidly changing industry. We’re in very different situation now than we were in the ‘90s.” * * * * * Bill Geist, President Zeitgeist Consulting “Sanders made a couple of good points, and his underlying premise is correct. There is an arms race to build public assembly facilities. “However, Sanders used flawed data by focusing most of his rationale on the Tradeshow Week 200, an incredibly small piece of the (meetings and conventions) pie. He rails that our industry doesn't have solid data like the automotive industry, as he fails to understand that the tourism/hospitality/meetings industry is the ultimate horizontal industry.
“Space Avaialble” Report Review & Analysis
61
“Of course, that makes it easier for him to attempt to debunk our industry as only 1 percent of the workforce when he points to the hotel industry as the only beneficiary.” * * * * * Chuck Schwartz, Chairman ConvExx “The report is more about facility over-expansion than anything. The cities having problems are those that are no longer competitive. Each city has its own negatives: poor hotel package, overpriced hotels, excessive room taxes, out-of-control work rules, poor air travel schedules and no 'wow' factor. “Las Vegas is king of the hill right now, but escalating room rates could cause it to fall out of favor for some events in a down economy. Our shows are all experiencing attendance increases, contrary to the report. One thing for sure, producing and marketing tradeshows is a different animal from pre-dot-com, pre-9/11, and pre-industry consolidation. But those that do it right will ... have success.” * * * * * David Korse, President and CEO IDG World Expo “I don't agree with the broad generalizations he made. Recent industry statistics will argue against his assumptions. Although I think that some venues may have overbuilt, I also think that other venues need to invest in more and better space to meet industry demand. If he had consulted other sources, such as Center for Exhibition Research published statistics, I think he may have come to different conclusions.” * * * * * Mary Upton, Vice president, tradeshow operations The ASI Show! “Convention business is less robust now than pre-9/11, but is rebounding as the economy rebounds. No technology beats face-to-face interaction in business. “There are some cities that have clearly lost their edge in the competition, such as Dallas. However, other cities are on the rise, such as Chicago, Las Vegas and Orlando, and need the retrofits, improvements, additions and amenities to remain competitive in the market as much as, or more than, the declining cities.
“Space Avaialble” Report Review & Analysis
62
“Convention centers are loss leaders, and always have been. To stop building or improving convention centers for economic reasons is fallacious reasoning that will ultimately cost those cities much business.” * * * * * Philip McKay Group vice president and general manager, Gartner Vision Events “Sanders is taking a narrow view, focusing on the past five to seven years, which has been a down and recessive cycle, not just for the events and meetings industry but the economy as a whole. Take the long view; all business is cyclical. “Convention growth in the last 20 years has been realized in Las Vegas, Orlando, San Diego and New Orleans, to cite some prime examples. “It’s true that certain cities will be losers in the short and/or long term. It’s a competitive market. But other cities will be winners. Cities with major convention centers have a chance to lose, but cities without them will definitely lose. “Attendance has declined for many major events, but other more targeted events have seen growth. Attendance will revive with a strengthened economy. Rumors of the demise of face-to-face marketing have come up during other down cycles. The events business always recovered — in a different form perhaps, but always as a vital and necessary platform.” * * * * * Don Freeman, Chairman and CEO Freeman “It is my impression that Mr. Sanders has long been a critic of the convention business and once again has cited inaccurate or incomplete information to substantiate his position. His statistics are clearly contrary to surveys done by Tradeshow Week, CEIR (Center for Exhibition Research) and Trade Show Executive, and certainly do not reflect the experience of our company.” * * * * * Doug Ducate, President and CEO Center for Exhibition Industry Research
“Space Avaialble” Report Review & Analysis
63
“The performance of the largest 200 exhibitions is meaningless, considering there are some 13,000 exhibitions a year. They are indicative only of those 200 events and not the industry as a whole. “Convention centers that make a decision not to upgrade and stay technically up-to-date will lose business. That is why so many centers are expanding and upgrading at the same time. If they don’t keep up, they will no longer be destinations. “Convention centers by definition are loss leaders. They were built to be given away because of the benefit to the community the visitors bring.” * * * * *

“Space Avaialble” Report Review & Analysis
64
Appendix II: The Power of Face-to-Face Marketing The Space Available report fails to capture the business need for face-to-face marketing. American Business Media commissioned Forrester Consulting to conduct an independent analysis of the trends in spend ing across 21 categories of business-to-business advertising in 2006. The survey results are based on 867 marketers. Key findings are presented below: “In-person events” are considered the #1 marketing tactic used to effectively build brand image:
• In-person events: 60.9% • Public relations: 51.7% • Industry-specific/trade magazines: 50.2% • Custom publications: 44.6% • TV: 42.9% • Online marketing: 39.8% • Direct mail: 39.7% • Printed newsletters: 39.0% • General business magazines: 37.9% • Newspapers: 37.4% • Radio: 31.8% • Printed directories: 29.9%
“In-person events” are considered the #1 marketing approach used to generate qualified leads:
• In-person events: 62.6% • Industry-specific /trade magazines: 47.4% • Public relations : 45.4% • Online marketing: 42.1% • Direct mail: 42.0% • Custom publications: 41.3% • TV: 36.3% • Printed newsletters: 35.3% • General business magazines: 34.6% • Newspapers: 33.3% • Printed directories: 31.7% • Radio: 31.8%

“Space Avaialble” Report Review & Analysis
65
Appendix III: Testimony on Convention Centers and Economic Development This appendix provides information from Heywood Sanders’ testimony on convention centers from March 2007. Tradeshow Week has added comments and other data. Page 6 of testimony transcript:
“The new Washington Convention Center opened in 2003. In 1994, as a new structure was being debated, the Census Bureau’s annual County Business Patterns reported a total of 14,473 hotel jobs in the District. For the most recent year, 2004, the County Business Patterns report showed 14,632 hotel jobs.”
This equates to 1.09% increase or 159 new jobs. Perhaps a more significant way to look at this is to start with 2002, the year before the new Washington Convention Center opened, the Census Bureau’s annual County Business Patterns reported a total of 11,982 hotel jobs in the District. For the most recent year available online, 2006, the County Business Patterns report showed 14,385 hotel jobs. This is a substantial 20.05% increase or 2,403 new jobs. Taking an even wider view of growth in Washington D.C. is an analysis of Accommodation and Food services in the district. In 2002, according to the Census Bureau’s annual County Business Patterns, the number of employees in Accommodation and Food services industries in D.C. totaled 41,406. In 2006 the total number employed rose to 49,414. This is a 19.34% increase or 8,008 new jobs. U.S. Census Bureau, 2006 County Business Patterns
Industry Code
Industry Code Description
Number of Employees for week including March 12
1st Quarter Payroll ($1,000)
Annual Payroll ($1,000)
Total Establishments
72 Accommodation & food services
49,414 273,907 1,184,873 2,016
72111 Hotels (except Casino Hotels)
and Motels
14,385 114,519 501,863 104
Source: U.S. Census Bureau, 2002 County Business Patterns
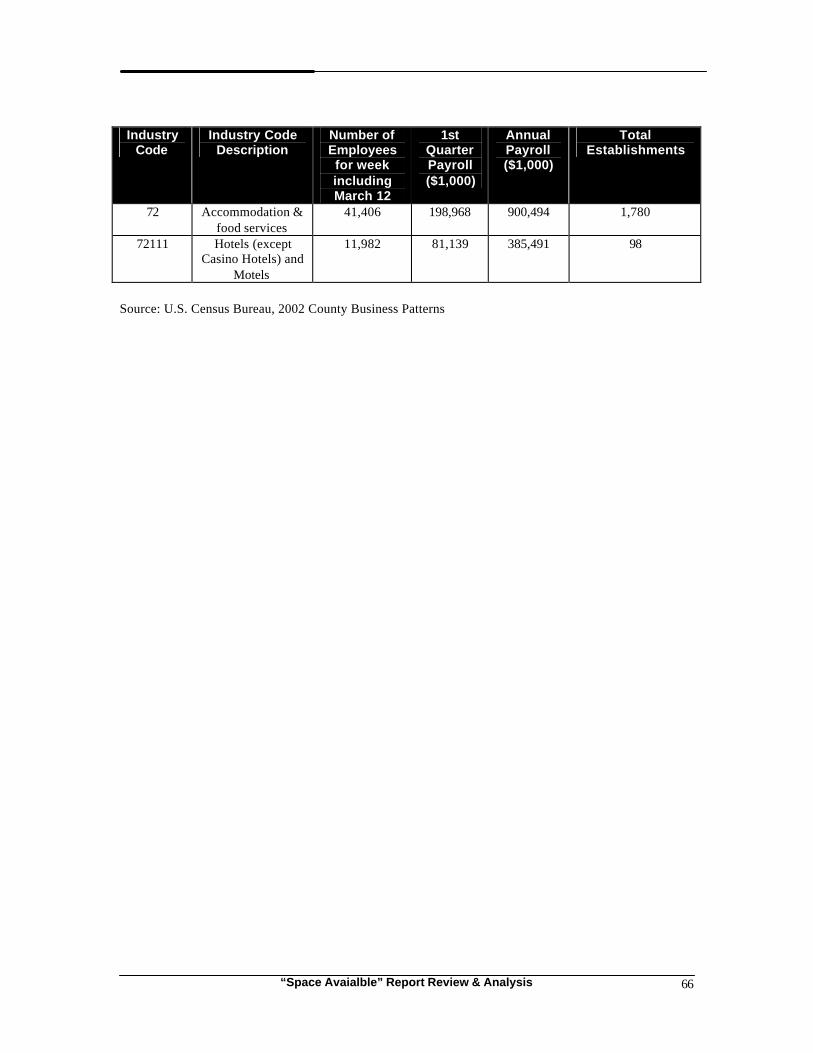
“Space Avaialble” Report Review & Analysis
66
Industry
Code Industry Code
Description Number of Employees for week including March 12
1st Quarter Payroll ($1,000)
Annual Payroll ($1,000)
Total Establishments
72 Accommodation & food services
41,406 198,968 900,494 1,780
72111 Hotels (except Casino Hotels) and
Motels
11,982 81,139 385,491 98
Source: U.S. Census Bureau, 2002 County Business Patterns
“Space Avaialble” Report Review & Analysis
67
Appendix IV: HVS Response to Space Available Report This appendix provides information from a response to the Space Available report by HVS developed in 2005. (From Page 3 of HVS report) In addition to his reliance on a small and unrepresentative sample of events, Sanders goes further, stating unequivocally that these data do not show the “real magnitude of convention and tradeshow change.” To bolster an even broader argument that the convention and tradeshow industry is in the process of “structural change” and permanent decline, Sanders compiles data on events, attendance and room nights generated at 19 of the 442 convention centers in the U.S. (Footnote: The cities include Chicago, New York, Atlanta, New Orleans, Las Vegas, Boston, Orlando, San Francisco, Baltimore, Indianapolis, Washington DC, Dallas, Charlotte, Cincinnati, Houston, Los Angeles, Philadelphia, San Jose and Phoenix.) Among all the events that may use exhibition space, Sanders singles out “conventions and tradeshows” excluding consumer shows and other events that may occur in exhibition space. The purpose of this selectivity is to highlight the trends in events that have more potential economic impact because they generate a high rate of out of town visitation. While this is a reasonable point of focus, the fact that it is a subset of events should further call into question Sanders’ conclusions about the overall level of exhibition space utilized. The data on the 19 cities are not consistently presented for the same years. In some cases Sanders analyzes center attendance data and in others room nights generated. Use of room night data adds another layer of complexity because room night data usually relies on information from hotel room block reservations and actual use of those room blocks. Event planners’ requests for room blocks have decreased in recent years in part because attendees are using the internet with increasing frequency to directly book rooms. These direct bookings often do not get counted in estimates of room nights. He presents data on nine of these facilities in charts throughout the article. Sanders does not present any aggregate data, rather, he draws general conclusions from anecdotal narratives on each facility. In our view the data on these 19 selected facilities cannot be properly construed to support Sanders’ argument that the structural change in demand for convention centers began in the mid-1990s. The data show erratic variations in attendance in each facility from year to year through the 1990s until 2000, after which most (but not all) of the convention centers in Sanders’ sample experienced declines in attendance or room nights. Using data from the nine of the 19 facilities that Sanders illustrated in charts, we calculated the aggregate annual percent change in attendance or room nights for these

“Space Avaialble” Report Review & Analysis
68
facilities. The results are illustrated in the chart below. (Footnote: Since Sanders did not provide all the specific data points, we relied on a reading of the graphics to generate the data.) Percent Change in Attendance or Room Nights for the 9 Cities Charted in the Brookings Brief
The pattern shows growth throughout the 1990s’ with the exception of 1995. A sudden drop occurred in 2001 and the percentage rate of decline slowed in 2002 and 2003. Aggregated, Sanders’ own data do not support his conclusion of “structural change” beginning the mid- 1990s. The state of the economy and geo-political events that followed September 11, 2001 seem like more plausible explanations. However, the more fundamental problem in using Sanders’ data on 19 facilities to make general inferences about demand in the industry as a whole is that it does not take into account the increase in competitive supply that occurred over the past decade. If supply is increasing at a rate faster than demand, as Sanders himself contends, then one would expect the utilization of some convention centers to decline. Utilization rates alone tell us nothing about industry-wide demand unless we also factor in the effects of changes in supply.

“Space Avaialble” Report Review & Analysis
69
Appendix V: Partial List of Conventions and Tradeshows that Increased Attendance in 2008 The table below provides a sample of conventions and tradeshows tracked by Tradeshow Week in 2008 that increased their attendance. It is not a definitive list of all shows, as other shows experienced growth as well as declines in attendance.
Show Name Attend. 2007 Attend. 2008 2008 Percentage Change
HIMSS Annual Conference & Exhibition (Healthcare Information & Management Systems Society)
10,088 29,177 189.2%
INDUSTRIAL FIRE, SAFETY & SECURITY 2008 998 1,901 90.5%
catersource Conference & Tradeshow 3,246 5,561 71.3%
Oregon Logging Conference - Logging Construction, Trucking & Heavy Equipment Expo
1,200 2,000 66.7%
MPI WEC MeetingPlace 3,349 5,507 64.4%
Intl. Esthetics, Cosmetics & Spa Conference Las Vegas 18,200 28,987 59.3%
ASHE 2008 International Conference & Exhibition on Health Facility Planning Design & Construction (PDC)
1,680 2,600 54.8%
ASI Show New York 1,850 2,856 54.4%
SHOT SHOW (Shooting, Hunting & Outdoor Trade Show) 20,390 30,785 51.0%
IFPE 2008 (International Exposition for Power Transmission) 17,521 26,203 49.6%
MINExpo Intl. - Natl. Mining Assn. 15,520 22,433 44.5%
International Air-Conditioning, Heating, Refrigerating Exposition (AHR Expo) 28,170 38,534 36.8%
Intl. Air-Conditioning, Heating, Refrigerating Exposition (AHR Expo) 28,170 38,534 36.8%
American College of Surgeons Annual Clinical Congress 6,577 8,950 36.1%
Natl. Teaching Institute & Critical Care Exposition 6,861 9,290 35.4%
Council for Exceptional Children Annual Convention & Expo 5,382 7,237 34.5%
Salon Rendez-vous HRI Show (Hotel Restaurant Institution) 8,300 10,891 31.2%
Golf Industry Show 8,793 11,343 29.0%
Joint Warfighting Conference 3,871 4,900 26.6%
IACP Annual Conference Law Enforcement Education and Technology Exposition
8,576 10,783 25.7%
IEEE/PES Transmission & Distribution Conference & Exposition (Institute of Electrical & Electronics Engineers/Power Engineering Society)
6,294 7,843 24.6%
Greenbuild Intl. Conference and Expo 22,726 28,224 24.2%
American College of Cardiology 57th Annual Scientific Session Exposition 15,018 18,542 23.5%
Intl. Jewelry Fair/General Merchandise Show - Fall 15,123 18,517 22.4%
Canadian Pool & Spa Conference & Expo 1,022 1,244 21.7%
LandWarNet 2,687 3,269 21.7%
MRO Americas Conference & Exhibition 3,788 4,599 21.4%
Ontario Fashion Exhibitors 3,032 3,663 20.8%
Truck World 2008 14,912 17,981 20.6%
I/ITSEC (Interservice/Industry Training, Simulation & Education Conference) 10,000 12,000 20.0%
Imaging USA 5,395 6,450 19.6%
ISA's Annual Conference & Trade Show (Intl. Society of Arboriculture) 1,800 2,150 19.4%
TS² 1,420 1,688 18.9%

“Space Avaialble” Report Review & Analysis
70
Canadian Health Food Assn. Expo East Trade Show & Conference 3,651 4,300 17.8%
NATPE 2008 (Natl. Assn. of Television Program Executives) 5,118 6,006 17.4%
HELI-EXPO 2008 14,806 17,356 17.2%
High Point Market (Apr.) 44,801 52,210 16.5%
RIMS Annual Conference & Exhibition 4,521 5,265 16.5%
AAOS 2008 Annual Meeting (American Academy of Orthopaedic Surgeons) 14,465 16,821 16.3%
Global Petroleum Show 39,843 46,235 16.0%
DEMA Show 2008 (Diving Equipment & Marketing Assn.) 3,302 3,825 15.8%
ABC KIDS EXPO 6,120 7,064 15.4%
EMS Expo (Emergency Medical Services) 3,270 3,738 14.3%
Natural Products Expo West/Supply Expo 31,736 36,125 13.8%
PMA Fresh Summit Intl. Convention & Exposition (Produce Marketing Assn.) 9,384 10,671 13.7%
CONEXPO-CON/AGG 2008 97,913 111,273 13.6%
ATA Archery Trade Show 2,832 3,214 13.5%
Offshore Technology Conference 44,305 50,200 13.3%
PDAC International Convention, Trade Show & Investors Exchange 12,643 14,322 13.3%
Firehouse World Conference & Exposition 5,507 6,222 13.0%
ISSA/INTERCLEAN North America 9,561 10,752 12.5%
AIIM & ON DEMAND Expo 25,000 28,000 12.0%
WESTEC 2008 Exposition 13,167 14,721 11.8%
Assn. of the United States Army Annual Meeting & Exposition 19,381 21,610 11.5%
New Orleans Gift & Jewelry Show/Spring 6,973 7,768 11.4%
CLEO/QELS/PhAST (Conference on Lasers & Electro-Optics/Quantum Electronics & Laser Conference/Photonic Applications, Systems & Technologies)
3,576 3,978 11.2%
WasteExpo 7,865 8,720 10.9%
Portland Gift & Accessories Show 3,625 4,000 10.3%
InfoComm Intl. 2008 21,649 23,851 10.2%
NACDS Marketplace Conference (Natl. Assn. of Chain Drug Stores) 3,754 4,129 10.0%
Power-Gen Intl. 17,000 18,669 9.8%
POWER-GEN Intl. 17,000 18,669 9.8%
Fabtech Intl. & AWS Welding Show (American Welding Society) 19,257 21,139 9.8%
American Urological Assn. Annual Meeting 8,766 9,581 9.3%
WWIN (WomensWear in Nevada) 5,500 6,000 9.1%
Buildex, The BC Construction Show & Design NW 8,846 9,642 9.0%
National Pavement Expo 2,026 2,200 8.6%
The PPAI Expo (Promotional Products Assn. Intl.) 12,941 14,022 8.4%
NRF's Annual Convention & Expo - Retail's BIG Show 9,233 10,000 8.3%
WEFTEC.08 11,073 11,982 8.2%
California Dental Assn. Spring Scientific Session 20,050 21,686 8.2%
BIOMEDevice 3,010 3,251 8.0%
Texas Food & Fuel Expo 1,003 1,081 7.8%
ENDO 2008: The Endocrine Society Annual Meeting 6,785 7,300 7.6%
APTA Intl. Public Transportation Expo (American Public Transportation Assn.)
10,237 10,978 7.2%
Outdoor Retailer Winter Market 6,513 6,970 7.0%
Ocean City Hotel-Motel-Restaurant Association Spring Trade Expo 3,000 3,200 6.7%
AFCEA Technology Showcase at DISA Customer Partnership Conference (Armed Forces Communications & Electronics Assn.)
2,182 2,325 6.6%

“Space Avaialble” Report Review & Analysis
71
Navy League Sea-Air-Space 2008 6,380 6,792 6.5%
HealthAchieve2008 6,160 6,525 5.9%
Cable-Tec Expo 10,388 11,000 5.9%
Farm Science Review 119,550 126,555 5.9%
Nightclub & Bar Convention & Trade Show 30,000 31,500 5.0%
FDIC - Indianapolis (Fire Department Instructors Conference) 22,942 24,077 4.9%
Off-Price Specialist Show 7,894 8,284 4.9%
ISC East (Intl. Security Conference) 6,186 6,490 4.9%
Yankee Dental Congress 23,085 24,206 4.9%
AUSA Winter Symposium & Exposition 1,842 1,931 4.8%
AAPA's Annual Physician Assistant Conference 5,800 6,075 4.7%
Medical Design & Manufacturing (MD&M) West, Pacific Design & Manufacturing, WestPack, Automation Technology Expo (ATX) West, Electronics West, PLASTEC West, and Green Manufacturing Expo
45,526 47,674 4.7%
Greater New York Dental Meeting 47,639 49,884 4.7%
HSMAI's Affordable Meetings Natl. (Hospitality Sales & Marketing Assn. Intl.)
1,623 1,699 4.7%
The NAMM Show 67,566 70,666 4.6%
Mid-South Jewelry & Accessory Fair/Fall 4,893 5,117 4.6%
Medical Design & Manufacturing (MD&M) Minneapolis Conference & Exhibition and MidPak
7,703 8,036 4.3%
Intl. WorkBoat Show 7,268 7,575 4.2%
ASHE Annual Conference & Technical Exhibition (American Society for Healthcare Engineering)
1,378 1,436 4.2%
Seatrade Cruise Shipping Convention 5,396 5,616 4.1%
Las Vegas Market - Summer 50,000 52,000 4.0%
SURTEX 5,000 5,200 4.0%
AAO-HNS/F Annual Meeting & OTO Expo 6,153 6,380 3.7%
CAMEX 2008 (Campus Market Expo) 2,228 2,309 3.6%
Canadian Waste & Recycling Expo 2,572 2,661 3.5%
NATL. HARDWARE SHOW and Lawn & Garden World 14,236 14,719 3.4%
INTL. CONTEMPORARY FURNITURE FAIR 25,033 25,880 3.4%
Intl. Contemporary Furniture Fair 25,033 25,880 3.4%
NRA Annual Meeting & Exhibits (Natl. Rifle Assn.) 61,327 63,354 3.3%
Hearth, Patio & Barbecue EXPO 6,227 6,431 3.3%
Imprinted Sportswear Show - Orlando 4,992 5,152 3.2%
AORN Annual Congress (Assn. of periOperative Registered Nurses) 6,261 6,445 2.9%
International Poultry Exposition 19,461 20,029 2.9%
Intl. Poultry Expo/Intl. Feed Expo 19,461 20,029 2.9%
APhA Annual Meeting & Exposition 6,714 6,906 2.9%
Licensing Intl. Expo 2008 18,000 18,500 2.8%
Intl. Vision Expo East 15,374 15,791 2.7%
Buyers Market of American Craft (Feb.) 6,260 6,425 2.6%
The Travel Goods Show 2,321 2,380 2.5%
Kitchen/Bath Industry Show & Conference 44,154 45,234 2.4%
Premiere Orlando 2008 45,000 46,000 2.2%
HD Boutique Exposition & Conference (Hospitality Design) 4,003 4,087 2.1%
Healthcare Information Systems Symposium - Exhibition 1,200 1,225 2.1%
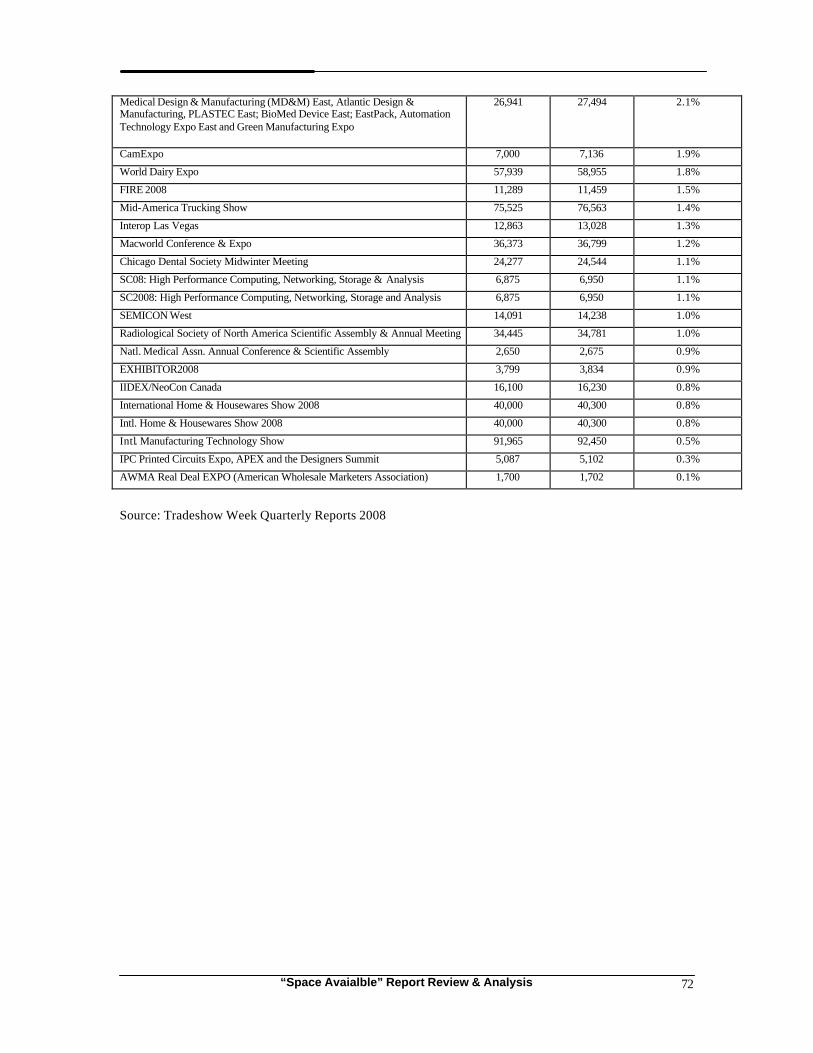
“Space Avaialble” Report Review & Analysis
72
Medical Design & Manufacturing (MD&M) East, Atlantic Design & Manufacturing, PLASTEC East; BioMed Device East; EastPack, Automation Technology Expo East and Green Manufacturing Expo
26,941 27,494 2.1%
CamExpo 7,000 7,136 1.9%
World Dairy Expo 57,939 58,955 1.8%
FIRE 2008 11,289 11,459 1.5%
Mid-America Trucking Show 75,525 76,563 1.4%
Interop Las Vegas 12,863 13,028 1.3%
Macworld Conference & Expo 36,373 36,799 1.2%
Chicago Dental Society Midwinter Meeting 24,277 24,544 1.1%
SC08: High Performance Computing, Networking, Storage & Analysis 6,875 6,950 1.1%
SC2008: High Performance Computing, Networking, Storage and Analysis 6,875 6,950 1.1%
SEMICON West 14,091 14,238 1.0%
Radiological Society of North America Scientific Assembly & Annual Meeting 34,445 34,781 1.0%
Natl. Medical Assn. Annual Conference & Scientific Assembly 2,650 2,675 0.9%
EXHIBITOR2008 3,799 3,834 0.9%
IIDEX/NeoCon Canada 16,100 16,230 0.8%
International Home & Housewares Show 2008 40,000 40,300 0.8%
Intl. Home & Housewares Show 2008 40,000 40,300 0.8%
Intl. Manufacturing Technology Show 91,965 92,450 0.5%
IPC Printed Circuits Expo, APEX and the Designers Summit 5,087 5,102 0.3%
AWMA Real Deal EXPO (American Wholesale Marketers Association) 1,700 1,702 0.1%
Source: Tradeshow Week Quarterly Reports 2008


