53
H.H. SHEIKH SABAH AL-AHMAD AL-JABER AL-SABAHThe Amir of The State of Kuwait
H.H. SHEIKH NAWAF AL-AHMAD AL-JABER AL-SABAHThe Crown Prince
H.H. SHEIKH JABER AL-MUBARAK AL-HAMAD AL-SABAHThe Prime Minister
Kuwait Financial Centre - S.A.K. (Closed) and Subsidiaries
2
TABLE OF CONTENTS Page
Directors’ Report 4
Independent Auditors’ Report 14
Consolidated Statement of Income 15
Consolidated Statement of Comprehensive Income 16
Consolidated statement of Financial Position 17
Consolidated Statement of Changes in Equity 18-19
Consolidated Statement of Cash Flows 20-21
Notes to the Consolidated Financial Statements 22-51
Annual Report 2012
3
BOARD OF DIRECTORS
Mr. Diraar Yusuf Alghanim Chairman & Managing Director
Sheikh Humoud Sabah Al-Sabah Vice Chairman
Mr. Faisal AbdulAziz Al-Jallal Director
Mr. Ayman Abdulatif Alshaya Director
Mr. Fahad Yaqoub Al-Jouan Director
Mr. Fouzi Ebrahim Al-Mukaimi Director
Mr. Adel Mohammed AlGhannam Director
BOARD STEERING COMMITTEE
Diraar Yusuf Alghanim Chairman
Ayman Abdulatif Al-Shaya Director
Fahad Yaqoub Al-Jouan Director
Manaf AbdulAziz Alhajeri Committee Secretary
AUDIT COMMITTEE
Faisal AbdulAziz Al-Jallal Chairman
Fouzi Ebrahim Al-Mukaimi Director
Adel M. AlGhannam Director
Maha I. Al-Kadi Committee Secretary
MANAGEMENT TEAM
Manaf A. Alhajeri Chief Executive Officer
Ali H. Khalil Chief Operating Officer
Gopal Menon Executive Vice President – International Investments
Bassam N. Al-Othman Executive Vice President – MENA Real Estate
Amani I. Al-Omani Executive Vice President – MENA Equities
Khaled A. Chowdhury Executive Vice President – Financial Management
M.R. Raghu Senior Vice President – Research
Ali Mustafa Abdal Senior Vice President – Human Resources & Administration
Maha I. Al-Kadi Senior Vice President – Private Equity & Fund Administration
Leila Badine Vice President – Markaz Lebanon Branch
Fahad G. Al-Abdul Jaleel Vice President – Private Banking
Hussan Ali Zainaldeen Vice President (Acting Head) – Compliance & Risk Management
Johnny Al-Khoury Vice President – Information Technology
Basma A. Ghareeb Vice President – Media & Communications
Kuwait Financial Centre - S.A.K. (Closed) and Subsidiaries
4
DIRECTORS’ REPORT 2012 Dear Stakeholders,
Capital markets in most developed economies posted favorable returns in 2012, which was accompanied with unusual high volatility stemming from the European sovereignty debt crisis. The near collapse of the Greek economy weakened the foundation of the Euro currency, and adversely impacted large European economies, such as Spain and Italy. In response to the crisis, the European Central Bank (ECB) launched a program to buy government and private debt securities in debt-heavy countries. Although, it offered a tentative solution, the ECB program relieved the situation by effectively lowering the interest rates on distressed sovereign debt giving the two economies a breather to revamp their balance sheets.
The global economy faced another difficult challenge in 2012, coined as the “U.S. Fiscal Cliff.” The expiration of “tax cuts” would have certainly taken the economy into another recession, as consumer spending as well as government expenditure would have been curbed at a time when the economy remains frail. The “U.S. Fiscal Cliff” was avoided when the Administration and the U.S. Congress agreed at the last minute on a tax relief bill.
The markets reacted positively to the European and the US measures, and ended the year positively despite the aforementioned challenges. However, we remain concerned that the factors that led to positive returns in 2012 may not be sustainable in 2013; and the quantitative easing will eventually result in other economic challenges.
In the Middle East and North Africa region, political uncertainty continued to adversely affect the investment climate, especially among countries that underwent political change. Despite the region’s strong economic fundamentals, investors’ appetite for development projects remained weak due to the political uncertainty across the region. Yet, some regional capital markets, such as Egypt and Dubai, posted strong returns in 2012 readjusting from the losses and weak returns that dominated the markets in 2011.
In Kuwait, His Highness The Emir took decisive measures to end the political stalemate that had curtailed the country’s economic growth despite the record-high oil revenues resulting in a large budget surplus that is unlikely to continue at this rate. We are hopeful that, moving forward, the country’s executive and legislative authorities will work closely together to formulate policies that lead the country towards sustainable development through economic and administrative reforms. These reforms are essential for the creation of a partnership between the private sector and the Government to achieve sustainable economic growth and create jobs for Kuwaiti citizens.
The year 2013 marked the beginning of a new political era triggered by the outcome of the December 2012 parliamentary elections; resulting in an assembly that may prove to be a promising platform to legislate and facilitate the implementation of economic reforms. Immediately after the election, the new parliament ratified the Emiri decree that enacted the new Companies’ Law (25/2012) that facilitates business formation, allows for new sophisticated financial instruments, imposes better governance and transparency on public companies. This constitutes a major milestone on the path for economic reform.
The new laws and the impact on the private sector was subject to high profile public debates in 2012; which also extended to include the importance of having the public sector adhere to the same values imposed on the private sector by the new laws. Such values would also hold the public sector accountable for achieving the promised goals and objectives related to economic development plans. There are, nevertheless, concerns that the quick implementation of the new laws will encumber companies and hinder their ability to recover and compete after a long and painful crisis.
The investment sector is still not fully recovered from the 2009 crisis, and the much-needed regulations that have prevailed over the past three years continue to pose a challenge on the sector and the capital market in Kuwait. Investment companies are burdened by heavy reporting requirements, and had to mobilize substantial resources to meet the increasing layers of regulators in a short period. However, we remain
Capital markets in most developed economies posted favorable returns in 2012.
Quantitative easing will eventually result in other economic challenges in 2013.
A new political era triggered by the outcome of the December 2012 parliamentary elections.
Anticipating Kuwait’s executive and legislative authorities to work closely towards sustainable development.
Annual Report 2012
5
hopeful that the sector’s regulatory bodies consisting of the Central Bank of Kuwait (CBK), Capital Markets Authority (CMA) and the Ministry of Commerce and Industry, will understand the importance of balancing between their duty of regulating the sector on one hand, and providing an environment that facilitate and promote business creation and economic growth.
It is our view that enforcing laws related to governance on companies cannot be made effectively until the regulatory administration develops an appropriate approach and methodology applicable to the public as well as the private sector. This can only be achieved by reforming the government agencies that are in charge of economic development. These reforms include establishing sound decision making mechanisms, promoting transparency and accountability, and adopting Key Performance Indicators (KPIs) to ensure fair appraisal and merit-oriented promotions in public agencies. Without such reforms, governance law would be an obstacle hindering the competitiveness of the overall economy rather than a catalyst for change and a starting point for the march towards sustainable economic growth.
Although the legal and judicial environment in Kuwait lacks the framework to deal with companies’ insolvency and bankruptcy, distressed companies have exerted considerable efforts to reach consensual settlements with their creditors. These efforts have succeeded in reducing the investment sector’s debt to KD 5.7 billion, a reduction of 36% over the past three years and half. The deleveraging was achieved through the sale of liquid assets in a shallow market, which caused a sharp decline in asset prices. As a result, the capital market in Kuwait lost KD 32 billion in capitalization during the last three years. Consequently, companies could not be recapitalized due the weak market conditions, and resorted to reduction of capital to absorb the mounting losses. Since 2008, the reduced or scheduled to be reduced capitals by 17 listed companies have mounted to at least KD 360 million. The investment sector was the most affected.
Some investment companies, nonetheless, have managed well their operation and balance sheet throughout the crisis; they remain well capitalized, and still enjoy a high level of liquidity, which enabled them to carry on business as usual. These companies have been able to reap the benefit of their financial prudency, as they become the first choice for institutional investors and quasi-government agencies for investment management. We are proud that “Markaz” is one of two financial institutions that won mandates from government to manage sovereign portfolios.
Financial Results for the Year 2012For the year 2012, Kuwait Financial Centre K.P.S.C. “Markaz”, registered a net profit of KD 4.22 million, or 9 fils per share, as compared with a loss of KD 0.23 million in 2011 (1 fils per share in 2011). “Markaz”’s improvement in earnings came as a result of favorable returns from investments across all asset classes which amounted to a gain of KD 5.2 million compared with a loss of KD 2.2 million in 2011.
As of December 31, 2012, “Markaz”’s total Equity increased to KD 94.22 million as compared with KD 87.55 million in 2011, an increase of 8%. Meanwhile, “Markaz”’s total Assets Under Management (AUM) reached KD 903 million1 as of December 31, 2012, with an increase of 9% compared to the year 2011.
As for CBK stipulated ratios, the leverage ratio for “Markaz” stood at 0.32 against the 2.0 ratio set by the CBK. The quick ratio of “Markaz” arrived at 17%, which is higher than the minimum of 10% imposed by the Central Bank of Kuwait. These ratios reflect “Markaz”’s ability to honor its obligations due to adequate solvency levels.
In June 5, 2012 “Markaz” repaid all of its USD 100 million bonds issued in July 2007 on the specified maturity date. “Markaz”’s ability to timely honor its financial obligations, despite the credit complications in the regional investment climate, is a testament of the company’s strong financial position.
“Markaz”’s Board of Directors proposed to the General Assembly the distribution of a cash dividend of 6% of the par value, or 6 fils per share, for shareholders registered at the time of the AGM.
1 Excluding National Real Estate Portfolio
New laws related to governance require reform in the public and private sectors.
There is a need for a framework to deal with companies’ insolvency and bankruptcy.
Well capitalized investment companies reap the benefit of their financial prudency.
Markaz registered a net profit of KD 422 million (9 fils per share) for the year 2012.
Markaz repaid all of its USD 100 million bonds issued in July 2007.
Kuwait Financial Centre - S.A.K. (Closed) and Subsidiaries
6
DIRECTORS’ REPORT 2012 (continued)
Our Activities
Asset Management
MENA Equities
Saudi Arabia, the largest economy within the region is expected to witness a real GDP growth of 5.4% and inflation subsiding below 4% for the year. TASI witnessed significant increase in turnover during the first few months of 2012 as the average turnover during the initial few months were beyond USD 2 billion/day; Post April 2012, turnover gradually reduced to approx. 25%. Cabinet’s approval of the kingdoms first mortgage law during Jul 2012 was welcomed positively as this acted as a positive catalyst for the banking and real estate sectors in the long run. Meanwhile, credit growth in Saudi Arabia remained robust.
Kuwait’s political issues were the key focus during 2012, which kept on dragging the potential economic progress. Kuwait and Bahrain ended the year with marginal gains while Oman had marginal losses.
Qatar, the economy which witnessed double digit economic growth during the past decade, lost heat and witness the real GDP growth of 6.3% for the year. The Qatari market ended the year with a gain of 2%. UAE stock markets were among the best performing markets within the region; The Dubai property market reclaimed global spotlight.
Egypt was the most volatile market with its high political drama in first half of 2012. Political uncertainty during the last quarter of 2012 did not go well with the market. Despite the recent stock market fall, Egypt was able to pull back the losses it witnessed during 2011.
Markaz funds investing in the Middle East and North Africa region posted positive results for the year 2012. For more details on funds’ performances please visit Markaz website: www.markaz.com
International Investment
As the year of 2012 ended, most equity indices globally recorded gains. MSCI World Index surged 13.18% and MSCI Emerging Market robustly climbed 15.15%. The Dow, S&P, and NASDAQ climbed 7.26%, 13.41%, and 15.91% respectively in the year. European markets continued its bull march as the MSCI Europe Index rallied 15.15% for the year.
Markaz’s strategy is paying off well as we adopted a less aggressive approach by altering our asset allocation throughout the year by lowering our exposure in equities and adding positions in fixed income and hedge funds. In fact, Emerging Market fixed income market ended 2012 as the top performing asset class across both EM and DM fixed income and riskier equity markets, providing equity-like returns ranging from 13% to 16%.
Markaz’s portfolios posted positive returns for the year 2012. Both Atlas Diversified Class, investing in a portfolio of global funds, and Atlas Emerging Market Thematic Class Fund, which invests in a portfolio of Emerging Markets equity funds focusing on selected themes, enjoyed a healthy performance during the year. Moreover, Atlas ETFs Program, which allocates its assets into various Exchange Traded Funds globally, and our long/short product, Creative Investment Program, posted positive performance in the same period. For more details regarding Markaz’s international funds and programs, please visit Markaz website: www.markaz.com
Saudi Arabia is expected to witness a real GDP growth of 5.4%.
Most equity indices globally recorded gains for the year 2012.
Lowering exposure in equities and adding positions in fixed income and hedge funds.
Annual Report 2012
7
Private Equity
The private equity asset class is recovering post-crisis and continues its march forward. The debt markets are healthy, allowing for significant delivering and a moving of the maturity wall. LPs are not reducing but rather increasing their exposure, which is the result of private equity continuing to deliver attractive returns. Net Asset Values are increasing relative to distributions, indicating future distribution, although dry powder remains quite extensive. Nevertheless, the industry continues to make healthy progress toward recovering from its steep contraction following the financial crisis. The number of private placements in 2012 is just slightly below the all-time high for the industry, driven by expansion into new emerging markets and spin outs from existing fund managers. The Markaz Private Equity Portfolio continued to cash in on its tail end funds through secondary sales and overall the portfolio saw positive distributions from the remaining portfolio.
Treasury
Markaz’s Treasury is managing Company’s Assets and Liability Positions. The Treasury Department has maintained sufficient liquidity levels yielding the proper balance of assets and that of liabilities, which enabled Markaz to timely honor its financial obligations. The Treasury Department provides key support to all Departments in providing best banking services. The department is manned with experienced staff and is equipped with Reuters, SWIFT and modern communication facilities enabling the day to day operations to run swiftly and smoothly.
Investment Banking
Corporate Finance Advisory
The year 2012 has witnessed a slowdown in M&A activities in the GCC region, down to 50% of the prior average activity. We attribute this to several factors, mainly, an increased level of uncertainty post 2011 political events, increased regulation and lack of acquisition debt with the continuing reluctance of international banks to expand lending in the Region.
In Kuwait, investment banking activity has been adversely impacted by market conditions with the delay in the launch of the much anticipated Private-Public investment initiative led by the Partnership Technical Bureau (PTB). As with the rest of the region, the government has placed greater emphasis on social programs at the expense of infrastructure development, which has fueled consumer spending. The debt crisis continues to linger in Kuwait, with no signs in the horizon of easing up as the current legal environment is not conducive for consensual restructuring plans. This continues to unfavorably impact a large number of real estate and investment companies, requiring more than ever highly specialized advisors to help them restructure their balance sheets.
Notwithstanding, we are optimistic that the market is well poised for recovery. The debt capital market, is witnessing tightening spreads with average yield on investment grade bond narrowing from an average of 4.9% at the beginning of the year to a current 3.21% which is likely to translate to an increased demand for corporate debt in 2013. Also, the New Companies’ Law Number 25 of 2012 provides for the issuance of various debt and quasi debt structures; which allow company to rethink their capital structure and issue new instruments in the market.
Markaz continues to build strong capabilities in distressed debt transactions, restructuring advisory services (either representing creditors or corporations), liquidating non-core assets for our clients, and raising fresh capital [debt and/or equity] for local corporations. We completed six such assignments this year and we are actively working on creating value for our clients in four ongoing and new mandates.
Debt markets are healthy, allowing for significant delivering and moving of the maturity wall.
Investment banking adversely affected by delay in the launch of Private-Public investment.
Debt capital market witnesses tightening spreads with narrowing average yield on investment grade bond.
Markaz is building strong capabilities in distressed debt transactions and restructuring advisory services.
Kuwait Financial Centre - S.A.K. (Closed) and Subsidiaries
8
DIRECTORS’ REPORT 2012 (continued)
Fixed Income
During the year 2012, Markaz successfully launched a KWD 26.5 million bonds issued for Al-ARGAN International Real Estate Company K.S.C.C. during the second quarter of the year, and acted as a joint lead manager with KAMCO and Burgan Bank. Markaz also played an active role in the arrangement of the KWD105 million, National Industries Group Murabaha Syndication, which was managed by Warba Bank.
Markaz Fixed Income Fund’s “MFIF” assets were allocated to different sectors across GCC countries and across various sectors including government, Financial Services, Oil & Gas, Power & Utilities, Real Estate, Telecom and Transport. The fund registered positive results for 2012. For more details on MFIF performance please visit Markaz website: www.markaz.com
Structured Finance
Markaz Structured Finance team has designed and developed internally a fully-fledged asset management software solution that will integrate the portfolio, fund management and accounting systems of Markaz; thereby enabling Markaz to consolidate and streamline its core operations by means of a single integrated platform that will vastly improve its risk control and management capabilities and its operational efficiency and throughput. The system will be deployed in 2013.
Markaz continues its efforts to provide innovative derivatives solutions to its clients in addition to developing the derivatives market in Kuwait. During 2012 Markaz has agreed with the Kuwait Stock Exchange on the trading rules and regulations for Put Options and the Islamic Call Options (Purchase Through Arboun Contract). The new set of rules and regulations have been approved by the KSE technical committee and were submitted to CMA for final review and approval. Although we continue our drive to expand our derivatives’ capability regionally, dealing with legal and regulatory constraints will remain the primary challenge to our progress.
MENA Real Estate Investment
Residential real estate in GCC countries continue to benefit from strong fundamentals. We expect the residential segment to continue its positive performance in the year 2013, and the commercial and office segments to remain stable.
In November 2012, Markaz obtained the final approval to manage part of the KIA National real estate portfolio valued at KD 250 million, for a period of 10 years targeting investments in Kuwait’s real estate market.
Markaz Real Estate Fund “MREF”, which invests in income generating properties in the Kuwaiti Market, was able to attract significant funds from new investors and acquired a number of income generating properties. For more details on “MREF”, please visit Markaz website: www.markaz.com
Meanwhile, Markaz Real Estate Development Company “MREDco”, conceived to benefit from the demand for residential units in KSA, progressed with its 54 villas development in Al Khobar in the Eastern Province of Saudi Arabia. Sales of the units are progressing with 32 villas sold during the year 2012. We expect to exit the investment by Q2 2013.
“Markaz Real Estate Opportunities Fund”, which manages investments in Lebanon, KSA, Jordan, Syria, Abu Dhabi and Qatar, was able to exit Al Falah Land plot in the city of Riyadh in Saudi Arabia followed by Umm El Summaq residential project in Jordan during the year 2012, achieving returns on investments of 32.87% and -0.57% respectively. The fund accordingly distributed proceeds to its investors. For more details about the fund’s performance, please visit Markaz website: www.markaz.com
Markaz launched a KWD 26.5 million bonds issued for Al-ARGAN International Real Estate Company.
Markaz agreed with KSE on the trading rules and regulations for Put Options and Islamic Call Options.
Markaz obtained the final approval to manage part of the KIA National real estate portfolio.
Markaz Real Estate Development Company “MREDco” progressed with its 54 villas development in Al Khobar, KSA.
Annual Report 2012
9
International Real Estate
Distressed real estate transactions continue to trickle to the market with higher volumes expected in 2013, composed of non-performing commercial mortgage sales by lenders and sale of foreclosed properties to investors. The Federal Deposit Insurance Corporation (FDIC) has been a major agent in this arena, offering for sale pools of commercial mortgages and properties of failed banking institutions in the U.S. within a public-private partnership framework.
Consistent with our outlook and the strengthening core market during 2012, we have started to liquidate the stabilized projects in our apartment development fund, Markaz U.S. Multifamily Realty Investment Unit – IV. Markaz also continues to invest in its U.S. Distressed Debt Program, a program dedicated to investing in sub-performing and non-performing commercial whole loan mortgages. For more details on the performance of these funds and programs, please visit Markaz website: www.markaz.com
Going forward, we expect to continue to invest in and manage our U.S. Distressed Debt Program, with a view to capturing the premium associated with core properties relative to distressed assets. We are also identifying new opportunities in the U.S. and other emerging markets, which we intend to offer to our investors in the future.
Oil and Gas
International energy equities traded almost flat with the MSCI World Energy Index and the Oil Service Sector Index (OSX) ending the year by (0.5%) and 1.8% respectively in 2012. Regional energy equities tracked by the Bloomberg GCC Energy Index, surged by 26% during the year. Regional petrochemicals stocks declined with the Tadawul Petrochemical Industries Index losing -6.0% in 2012.
Markaz manages a diversified portfolio within the oil & gas sector through Markaz Energy Fund “MEF”. The fund improved in 2012 with gains stemming from local and regional oil & gas equities which had a positive effect on the Fund’s performance. For more information about the fund, please visit Markaz website: www.markaz.com
Support Departments
Research
The Published Research Department of Markaz continued its efforts with a heavy focus on GCC infrastructure and sector research. Several country reports on key infrastructure areas such as Power, Ports, Aviation, and Information and Communications Technology were released during 2012. New sectors like Healthcare, Metals and Mining, Investment Banking, and Petrochemicals were also released. Such focus on infrastructure and sector research when the GCC region is witnessing extensive government spending provides necessary depth to planning and execution for various stakeholders. The department also released other strategic reports focussed on important issues such as stock markets, CMA, investment sector, demography, equity risk premium and Index.
Markaz foray into economic policy research continued well into 2012 where several key policy research papers have been produced in collaboration with leading think tanks (IFRI, Paris) and research scholars. The primary focus of such policy research cantered on Kuwait and the GCC marking the need to diversify the structure of the region’s economies. Several other policy research themes including public sector governance and energy are on the anvil for eventual publication, discussion and debate among thought leaders.
The year also saw Markaz strengthening its research team at Marmore MENA Intelligence Pvt. Ltd, the research subsidiary based in Chennai (India). Marmore is committed to providing high quality research support to Markaz and serve external clients through its committed research team. For more details about Markaz research offerings, please visit Markaz website: www.markaz.com
Markaz continues to invest in its U.S. Distressed Debt Program.
Markaz manages a diversified portfolio within the oil & gas sector through Markaz Energy Fund “MEF”.
Markaz releases reports on new sectors like Healthcare, Metals and Mining, Investment Banking and Petrochemicals.
Markaz Economic Policy Research initiative collaborates with IFRI, Paris and research scholars.
Kuwait Financial Centre - S.A.K. (Closed) and Subsidiaries
10
DIRECTORS’ REPORT 2012 (continued)
Private Banking
The Private Banking Department (“PBD”), responsible for the sophisticated investors comprising of High Net Worth Individuals, family offices, and corporations, strives to meet clients’ needs by venturing beyond providing conventional investment solutions and daily monitoring of clients’ assets. The PBD offers our customers a broad range of products that fit with our investment philosophy and meet the goals set by our clients as well as their risk profile. The PBD, therefore, provides value added services that include reporting the latest developments in markets and the different sectorial and geographic classes of assets. These value added services are designed to enable our clients to make sound investment decisions based on well-researched information.
The department is also responsible for the institutional and banking relationships and has continued to market Markaz as the asset manager of choice for the institutions and banks in the region. During the year 2012, the department focussed on initiating new collaborations with other banks in the GCC, with the aim of developing its distribution channels and providing innovative new investment products and solutions to its existing and future clients.
Media and Communications
The Media and Communications Department continues to enhance Markaz communications transparency at the highest standards and maintain brand awareness by utilizing different media channels. The department role exceeds traditional corporate communication standards to include alliances and cooperation with local and international institutions in the fields of economic research.
Markaz continued to support nonprofit activities related to sustainable development through its Corporate Social Responsibility (CSR) policy which is deeply rooted in its business model. During 2012, Markaz focused on issues related to human development and public health. For more details on Markaz communications activities, please visit our website: www.markaz.com
Compliance and Risk Management
Markaz has a comprehensive Risk Management, Compliance and Control Framework in place to ensure that the company and its related entities are appropriately governed. The Board directs the policy and process framework and is responsible for risk management and for all risk control systems that are implemented in Markaz, as well as related entities.
The Board’s governance mandate is implemented through an independent Compliance and Risk Management Department. The department identifies measures, evaluates and reports on all credit risks, liquidity and market risks to which Markaz is exposed.
The department also follows up and documents governance activities in the company including the Board’s Steering Committee, which reviews and approves investment performance and investment decisions; and the Board Audit Committee which checks the effectiveness of internal controls. As part of its mandate, the Department coordinates with Regulatory Auditors, Internal Auditors, and rating agencies.
During 2012, the risk management team has been working closely with the business to enlarge the concept of risk and include measures to enhance the system’s robustness. In continuation of the long term strategy, Markaz risk management team has been adopting a prudent investment policy amidst heightened volatility in the local and international markets. The department was also involved in risk planning for new asset management software to upgrade the service offerings of Markaz.
As per the directives of the CBK, Markaz established an independent AML cell. The AML cell is responsible for AML related compliance. The unit establishes AML related controls for the Company and reviews its compliance. Markaz also established an independent compliance cell as per the CBK directives. The Complaints cell is responsible for receiving and resolving all complaints received from clients, investors and counterparties.
Markaz focusses on new collaborations with banks in the GCC region.
Alliances and cooperation with local and international institutions in the fields of economic research.
A comprehensive Risk Management, Compliance and Control Framework.
An independent AML cell responsible for AML related compliance.
Annual Report 2012
11
Information Technology
The Information Technology Department (ITD) focused during the year 2012 on the Business Continuity plan to indemnify that the Disaster Recovery policies and procedures are applied at a company-wide level. These policies and procedures are designed and implemented according to the industry’s standards and periodically reviewed by a top-tier consulting service.
One of our most recent ventures is overhauling the Markaz website. The new website incorporates cutting-edge technologies used in web design and development, and enriches it with various new features that enhance the user experience; giving Markaz and its clients simplified access to vital information when needed.
Financial Management Department
Financial Management Department (FMD) laid significant emphasis on key financial risks and placed protective measures to minimize losses and stimulate a stable financial management environment that drives continuous improvement in internal checks and control systems. Ultimately, the financial risk management and efficient business process that were embedded in all day to day operations became more secured. FMD ensured that at all times effective financial reporting was carried out which is fundamental to shareholders confidence as well as investors wealth protection.
FMD continues to course in full compliance with the regulatory bodies CMA in particular and strictly adheres to upholding the image of Markaz through stringent test of ensuring the three ratios Liquidity, Leverage and Foreign exposure are adequately maintained and balanced. Additionally, FMD effectively implemented all the changes and developments in IFRS that took a higher stance during the period following the world economic crunch and continues to apply conservative measures through performance checks and budgetary control.
Transaction Processing & Reporting Department
Transaction Processing & Reporting Department (TPR) at Markaz applies comprehensive operational controls to ensure that the company provides safe and sound support for the administration of client accounts. Continuous monitoring and revision of well-defined policies and procedures ensure proficient flow of work and clearly defined responsibilities of the personnel involved in handling transactions, reconciliation and reporting. Limiting employee access to specific functions within the systems is pivotal to our internal control system.
TPR endeavors to provide world class support service by strengthening its computer based Management Information System (MIS) by the adoption of a new system in the coming year 2013. The system will aim to achieve Markaz’s strategic objectives and allow bigger capacity to support current and future transaction volumes and product complexity.
Human Resources & Administration
The Human Resources and Administration Department (HRAD) continued in 2012 its efforts to align Markaz human capital, upgrade their skills and strengthen the organization.
The department targeted the enhancement of communication and promoting accountability aimed to improve efficiency, hence pave the path for developing the desired Performance Management Scheme that will integrate corporate goals and objectives to performance planning/appraisal; talent management; compensation, reward, and recognition. The department also extended its efforts to recruit the appropriate candidates for all Markaz staffing requirements.
HRAD’s main goal is to ensure that convergence and streamlining of related activities are carried out as effectively and efficiently as possible to minimize operational risk. In order to achieve this, the Department continues to streamline, upgrade and update its policies, procedures, and systems as part of its constant improvement process.
Protective measures to stimulate a stable financial management environment.
Comprehensive operational controls to ensure safe and sound administration of client accounts.
Paving the path for the desired “Performance Management Scheme”.
Kuwait Financial Centre - S.A.K. (Closed) and Subsidiaries
12
DIRECTORS’ REPORT 2012 (continued)
Outlook
In Kuwait, we expect economic development to be at the forefront of the government and the new parliament agenda; and as such, we are optimistic that several development projects will be awarded; driving a healthy economic growth in 2013.
The swift ratification Companies’ Law 25, and the amendment thereto shortly after, is a confirmation that the legal commercial framework will be reformed to improve the business environment. Our optimism for 2013 stems from the following:
Balance sheet restructuring and deleveraging of companies in Kuwait will continue in 2013, and will result in investment banking opportunities. The new companies’ law provides for the issuance by companies of alternative financing instruments such as convertible debt, preferred shares, and derivatives of such instruments allowing for the layering of risk. “Markaz” is very well poised to benefit from such opportunities; as it is the only investment company in Kuwait active in in the derivative space, in the underwriting and trading of distressed debt, and is the most active in corporate debt restructuring. In addition, “Markaz” played a key role in three out of eight Kuwaiti bond issues in 2012.
We expect that new laws will be legislated in 2013 targeted at improving the business environment; including a bankruptcy law, that provides an effective and organized framework for dealing with insolvency and illiquidity of companies. Had this bankruptcy law been present, the crisis in Kuwait would have been solved much earlier, sparing the country the lingering of unresolved conflict between creditors and debtors. Also, there is much need for real estate laws that govern co-property ownership related to apartments and office condominiums. This will undoubtedly contribute to the easing of the housing crisis that Kuwait is suffering from.
The Capital Markets Authority (CMA) laws have changed the portfolio management and asset management landscape, and there is an increasing awareness that generating returns from short term trading has become difficult, which favors asset management firms with strong fundamental research capabilities such as “Markaz”. We currently lead the sector in research, and cover a wide range of asset classes including equities, fixed income, real estate and oil and gas. Our research activity is carried on by our subsidiary in India, Marmore MENA Intelligence Pvt. Ltd.
We expect reform and governance to extend to government institutions; especially those that are in charge of the economic development plan. For that to happen, government should improve transparency and publish the key performance indicators for such institutions. The efficiency of such institutions will be crucial in expediting infrastructure projects; which has been seriously lacking behind schedule. Many projects have tendered as public-private-partnerships by these institutions whereby “Markaz” has played an active role in three of them, but no contracts have been awarded so far.
Our fundamentals in the region remain solid. Our population growth and household formation continue to drive the strong demand for consumer goods, services, capital goods, housing, and soft and hard infrastructure. “Markaz” is very well poised to benefit from the demand and continue to build capabilities on sectors that will most benefit from the prevailing trends locally and regionally.
The regulatory bodies represented by the Central Bank of Kuwait (CBK), Capital Markets Authorities (CMA) and Ministry of Commerce and Industries will continue to work effectively together towards the orderly development of our capital market; we are thankful for their cooperation and responsiveness towards the sectors needs which is aimed at benefiting the public good.
New laws and new investment banking opportunities.
A bankruptcy law to provide an effective framework for dealing with companies’ insolvency and illiquidity.
Building strong fundamental research capabilities.
Anticipating reform in government institutions that are in charge of the economic development plan.
Population growth and household formation drive strong demand for consumer goods, services, capital goods, housing and infrastructure.
Annual Report 2012
13
In conclusion, we express our gratitude to our Shareholders and our Clients for their trust and support, and all of our partners for working with us so efficiently. Our colleagues at “Markaz” have adopted the highest ethical and professional values that are at the root of our success, and have allowed your company to grow and withstand the test of time and the test of the severe volatility of the market place in which we operate. This endeavor and the balanced partnership between our shareholders, clients, partners and staff is what made “Markaz” a stable and consistent financial institution that enjoys such high creditability and respect, locally and internationally.
The Board of Directors
February 17, 2013
Kuwait Financial Centre - S.A.K. (Closed) and Subsidiaries
14
INDEPENDENT AUDITORS’ REPORT
To the Shareholders of
Kuwait Financial Centre – SAK (Closed)
Kuwait
Report on the Consolidated Financial StatementsWe have audited the accompanying consolidated financial statements of Kuwait Financial Centre – SAK (Closed) (‘‘parent company”) and its subsidiaries, (“the group”) which comprise the consolidated statement of financial position as at 31 December 2012, and the consolidated statement of income, statement of comprehensive income, statement of changes in equity and statement of cash flows for the year then ended, and a summary of significant accounting policies and other explanatory information.
Management’s Responsibility for the Consolidated Financial Statements
Management is responsible for the preparation and fair presentation of these consolidated financial statements in accordance with International Financial Reporting Standards, as adopted for use in the State of Kuwait and for such internal control as management determines is necessary to enable the preparation of consolidated financial statements that are free from material misstatement, whether due to fraud or error.
Auditors’ Responsibility
Our responsibility is to express an opinion on these consolidated financial statements based on our audit. We conducted our audit in accordance with International Standards on Auditing. Those standards require that we comply with ethical requirements and plan and perform the audit to obtain reasonable assurance about whether the consolidated financial statements are free from material misstatement.
An audit involves performing procedures to obtain audit evidence about the amounts and disclosures in the consolidated financial statements. The procedures selected depend on the auditors’ judgment, including the assessment of the risks of material misstatement of the consolidated financial statements, whether due to fraud or error. In making those risk assessments, the auditors’ consider internal control relevant to the entity’s preparation and fair presentation of the consolidated financial statements in order to design audit procedures that are appropriate in the circumstances, but not for the purpose of expressing an opinion on the effectiveness of the entity’s internal control. An audit also includes evaluating the appropriateness of accounting policies used and the reasonableness of accounting estimates made by management, as well as evaluating the overall presentation of the consolidated financial statements.
We believe that the audit evidence we have obtained is sufficient and appropriate to provide a basis for our audit opinion.
Opinion
In our opinion, the consolidated financial statements present fairly, in all material respects, the financial position of Kuwait Financial Centre – SAK (Closed) and its subsidiaries as at 31 December 2012, and their financial performance and cash flows for the year then ended in accordance with International Financial Reporting Standards, as adopted for use in the State of Kuwait.
Report on Other Legal and Regulatory Matters
In our opinion, proper books of account have been kept by the parent company and the consolidated financial statements, together with the contents of the report of the parent company’s board of directors relating to these consolidated financial statements, are in accordance therewith. We further report that we obtained all the information and explanations that we required for the purpose of our audit and that the consolidated financial statements incorporate all information that is required by the Companies Law No. 25 of 2012 and by the company’s articles of association, as amended, that an inventory was duly carried out and that, to the best of our knowledge and belief, no violations of the Companies Law No. 25 of 2012 nor of the parent company’s articles of association, as amended, have occurred during the year that might have had a material effect on the business or financial position of the parent company.
We further report that, during the course of our audit, we have not become aware of any material violations, during the year, of the provisions of Law No.32 of 1968, as amended, concerning currency, the Central Bank of Kuwait and the organisation of banking business, and its related regulations.
Abdullatif M. Al-Aiban (CPA) Talal Y. Al-Muzaini
(Licence No. 94-A) (Licence No. 209A)
of Grant Thornton – Al-Qatami, Al-Aiban & Partners of Deloitte & Touche – Al-Fahad, Al-Wazzan & Co.
Kuwait
17 Febraury 2013
Annual Report 2012
15
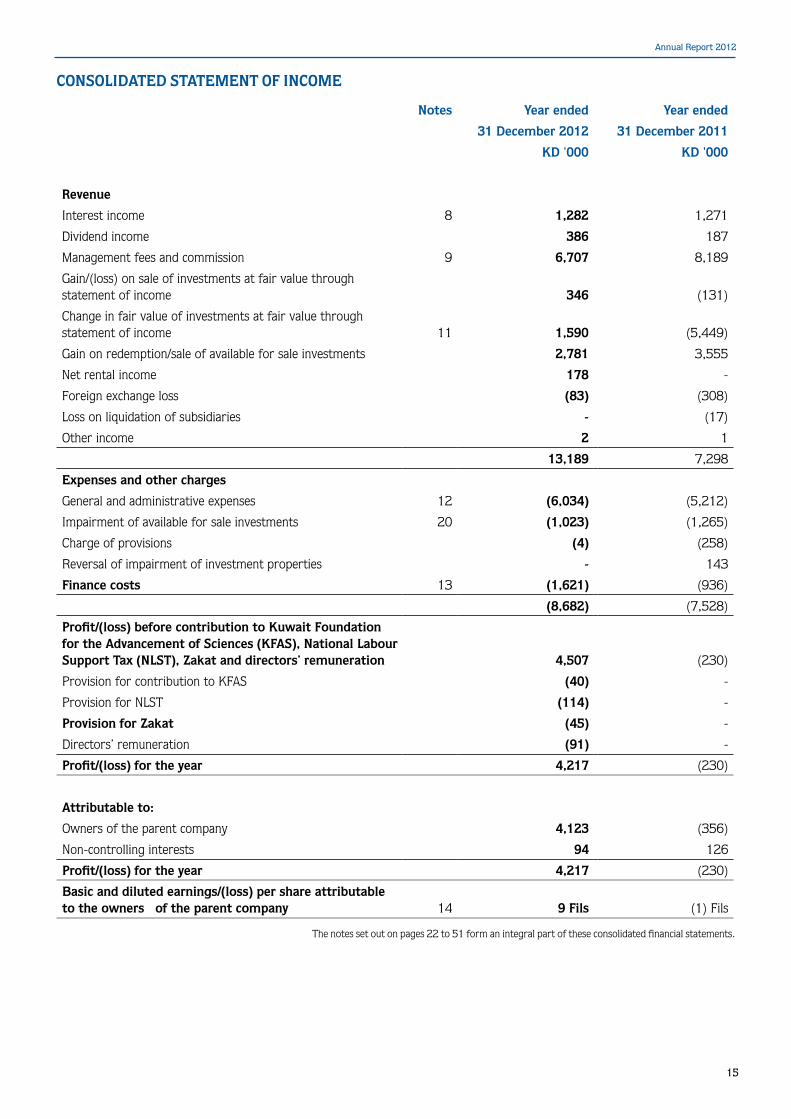
CONSOLIDATED STATEMENT OF INCOME
Notes Year ended Year ended
31 December 2012 31 December 2011
KD '000 KD '000
Revenue
Interest income 8 1,282 1,271
Dividend income 386 187
Management fees and commission 9 6,707 8,189
Gain/(loss) on sale of investments at fair value through statement of income 346 (131)
Change in fair value of investments at fair value through statement of income 11 1,590 (5,449)
Gain on redemption/sale of available for sale investments 2,781 3,555
Net rental income 178 -
Foreign exchange loss (83) (308)
Loss on liquidation of subsidiaries - (17)
Other income 2 1
13,189 7,298
Expenses and other charges
General and administrative expenses 12 (6,034) (5,212)
Impairment of available for sale investments 20 (1,023) (1,265)
Charge of provisions (4) (258)
Reversal of impairment of investment properties - 143
Finance costs 13 (1,621) (936)
(8,682) (7,528)
Profit/(loss) before contribution to Kuwait Foundation for the Advancement of Sciences (KFAS), National Labour Support Tax (NLST), Zakat and directors’ remuneration 4,507 (230)
Provision for contribution to KFAS (40) -
Provision for NLST (114) -
Provision for Zakat (45) -
Directors’ remuneration (91) -
Profit/(loss) for the year 4,217 (230)
Attributable to:
Owners of the parent company 4,123 (356)
Non-controlling interests 94 126
Profit/(loss) for the year 4,217 (230)
Basic and diluted earnings/(loss) per share attributable to the owners of the parent company 14 9 Fils (1) Fils
The notes set out on pages 22 to 51 form an integral part of these consolidated financial statements.
Kuwait Financial Centre - S.A.K. (Closed) and Subsidiaries
16
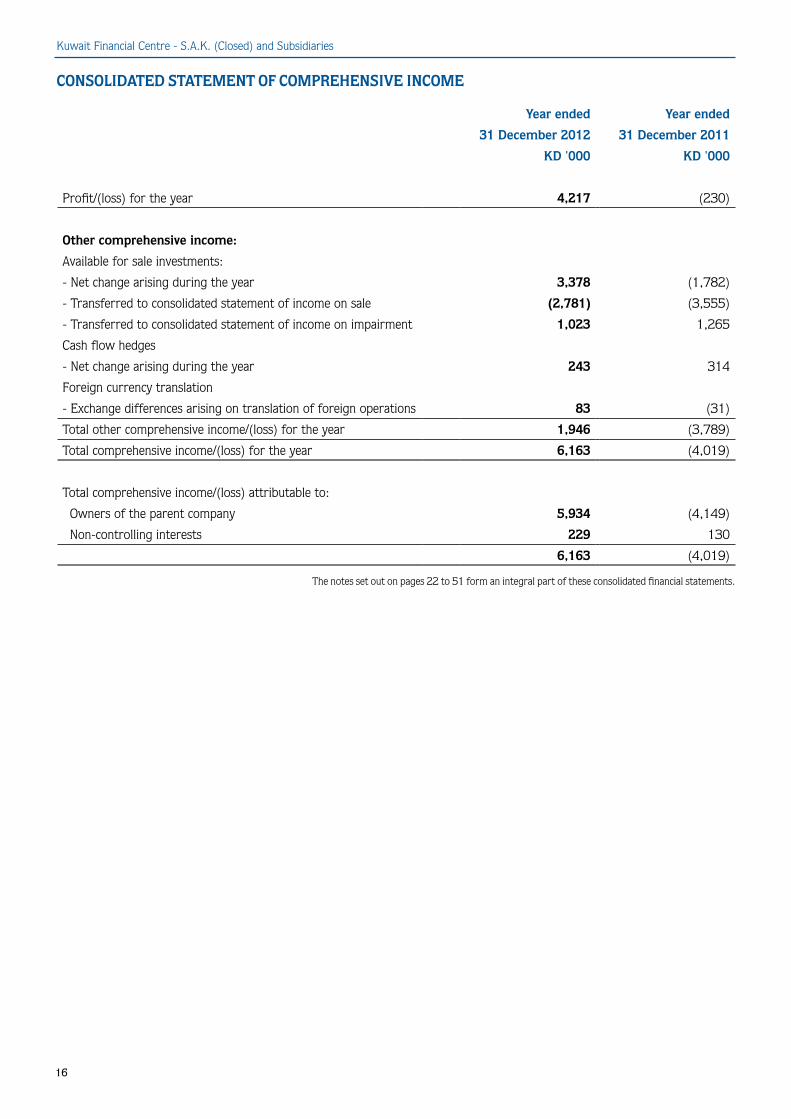
CONSOLIDATED STATEMENT OF COMPREHENSIVE INCOME
Year ended Year ended
31 December 2012 31 December 2011
KD '000 KD '000
Profit/(loss) for the year 4,217 (230)
Other comprehensive income:
Available for sale investments:
- Net change arising during the year 3,378 (1,782)
- Transferred to consolidated statement of income on sale (2,781) (3,555)
- Transferred to consolidated statement of income on impairment 1,023 1,265
Cash flow hedges
- Net change arising during the year 243 314
Foreign currency translation
- Exchange differences arising on translation of foreign operations 83 (31)
Total other comprehensive income/(loss) for the year 1,946 (3,789)
Total comprehensive income/(loss) for the year 6,163 (4,019)
Total comprehensive income/(loss) attributable to:
Owners of the parent company 5,934 (4,149)
Non-controlling interests 229 130
6,163 (4,019)
The notes set out on pages 22 to 51 form an integral part of these consolidated financial statements.
Annual Report 2012
17
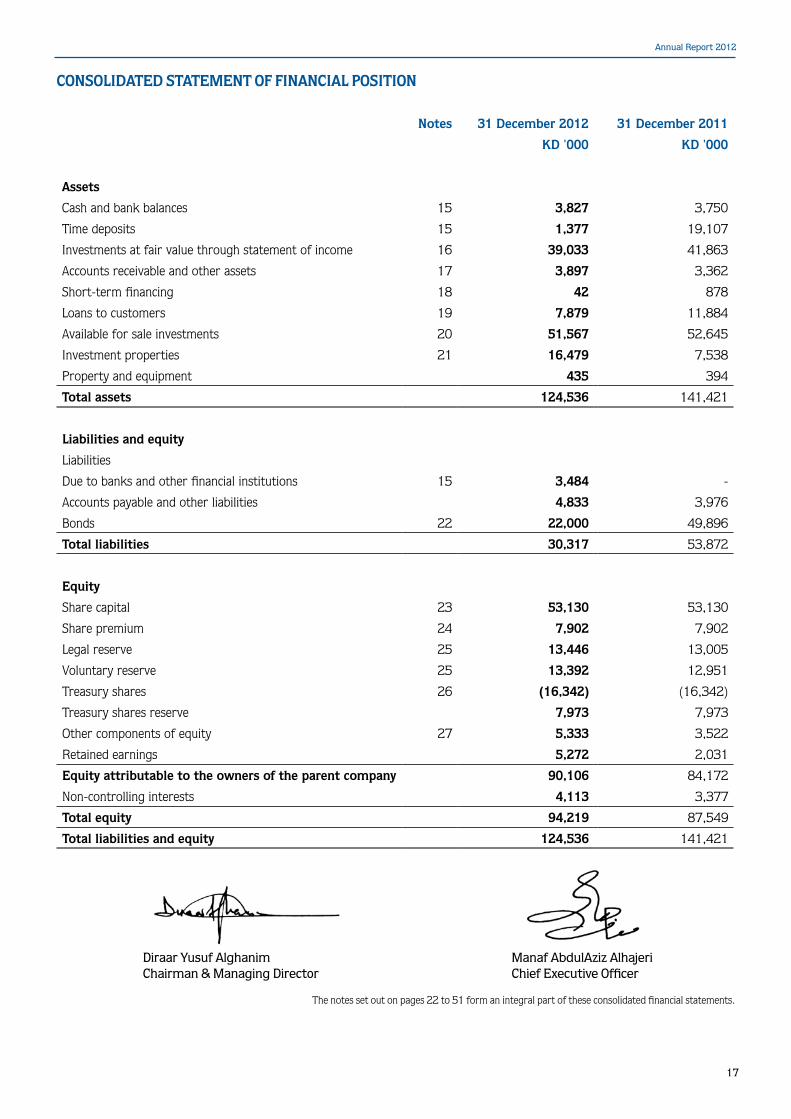
CONSOLIDATED STATEMENT OF FINANCIAL POSITION
Notes 31 December 2012 31 December 2011
KD '000 KD '000
Assets
Cash and bank balances 15 3,827 3,750
Time deposits 15 1,377 19,107
Investments at fair value through statement of income 16 39,033 41,863
Accounts receivable and other assets 17 3,897 3,362
Short-term financing 18 42 878
Loans to customers 19 7,879 11,884
Available for sale investments 20 51,567 52,645
Investment properties 21 16,479 7,538
Property and equipment 435 394
Total assets 124,536 141,421
Liabilities and equity
Liabilities
Due to banks and other financial institutions 15 3,484 -
Accounts payable and other liabilities 4,833 3,976
Bonds 22 22,000 49,896
Total liabilities 30,317 53,872
Equity
Share capital 23 53,130 53,130
Share premium 24 7,902 7,902
Legal reserve 25 13,446 13,005
Voluntary reserve 25 13,392 12,951
Treasury shares 26 (16,342) (16,342)
Treasury shares reserve 7,973 7,973
Other components of equity 27 5,333 3,522
Retained earnings 5,272 2,031
Equity attributable to the owners of the parent company 90,106 84,172
Non-controlling interests 4,113 3,377
Total equity 94,219 87,549
Total liabilities and equity 124,536 141,421
Diraar Yusuf Alghanim Chairman & Managing Director
Manaf AbdulAziz Alhajeri Chief Executive Officer
The notes set out on pages 22 to 51 form an integral part of these consolidated financial statements.
Kuwait Financial Centre - S.A.K. (Closed) and Subsidiaries
18
CON
SOLI
DAT
ED
STA
TEM
EN
T O
F CH
AN
GE
S IN
EQ
UIT
Y
Att
ribu
tabl
e to
the
ow
ners
of
the
pare
nt c
ompa
ny
Non
-co
ntro
lling
in
tere
sts
Tota
l
Shar
e ca
pita
lSh
are
prem
ium
Lega
l re
serv
eVo
lunt
ary
rese
rve
Trea
sury
sh
ares
Trea
sury
sh
ares
re
serv
e
Oth
er
com
pone
nts
of e
quit
y (n
ote
27)
Ret
aine
d ea
rnin
gsSu
b To
tal
KD
'000
KD
'000
KD
'000
KD
'000
KD
'000
KD
'000
KD
'000
KD
'000
KD
'000
KD
'000
KD
'000
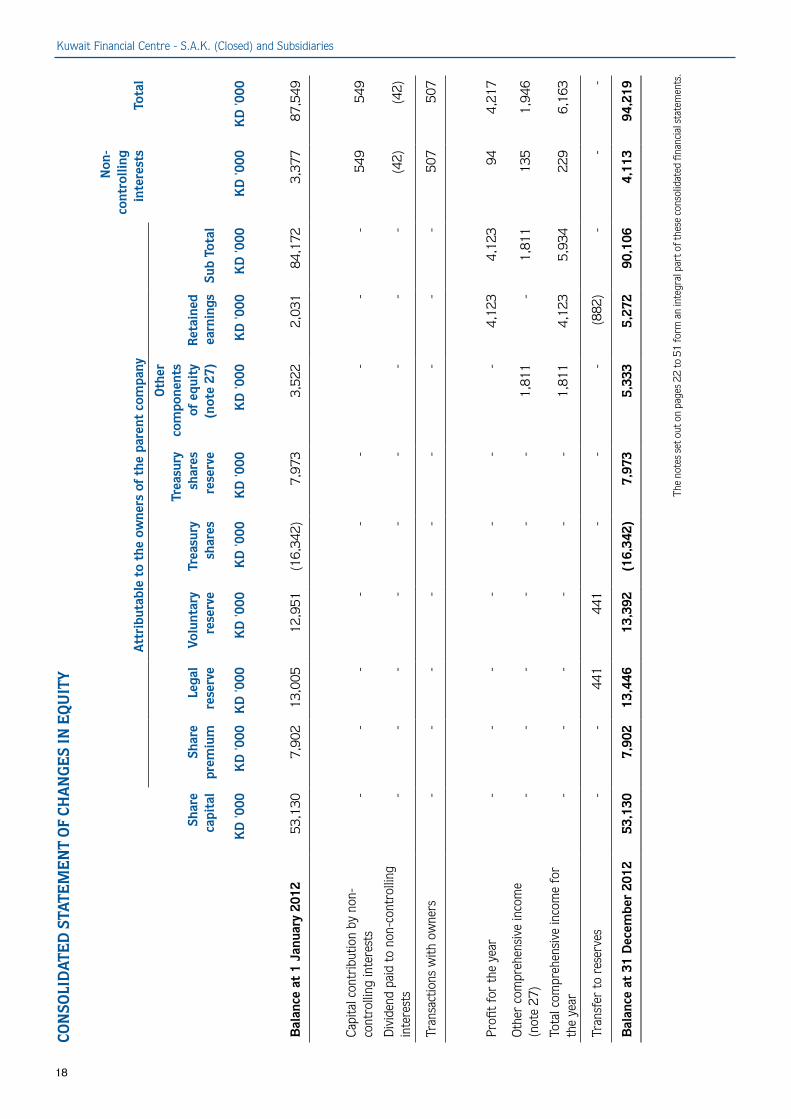
Bal
ance
at
1 Ja
nuar
y 20
1253
,130
7,90
213
,005
12,9
51(1
6,34
2)7,
973
3,52
22,
031
84,1
723,
377
87,5
49
Capi
tal c
ontr
ibut
ion
by n
on-
cont
rolli
ng in
tere
sts
--
--
--
--
-54
954
9
Div
iden
d pa
id t
o no
n-co
ntro
lling
in
tere
sts
--
--
--
--
-(4
2)(4
2)
Tran
sact
ions
with
ow
ners
--
--
--
--
-50
750
7
Profi
t fo
r th
e ye
ar-
--
--
--
4,12
34,
123
944,
217
Oth
er c
ompr
ehen
sive
inco
me
(not
e 27
)-
--
--
-1,
811
-1,
811
135
1,94
6
Tota
l com
preh
ensi
ve in
com
e fo
r th
e ye
ar-
--
--
-1,
811
4,12
35,
934
229
6,16
3
Tran
sfer
to
rese
rves
--
441
441
--
-(8
82)
--
-
Bal
ance
at
31 D
ecem
ber
2012
53,1
307,
902
13,4
4613
,392
(16,
342)
7,97
35,
333
5,27
290
,106
4,11
394
,219
The
note
s se
t out
on
page
s 22
to 5
1 fo
rm a
n in
tegr
al p
art o
f the
se c
onso
lidat
ed fi
nanc
ial s
tate
men
ts.
Annual Report 2012
19
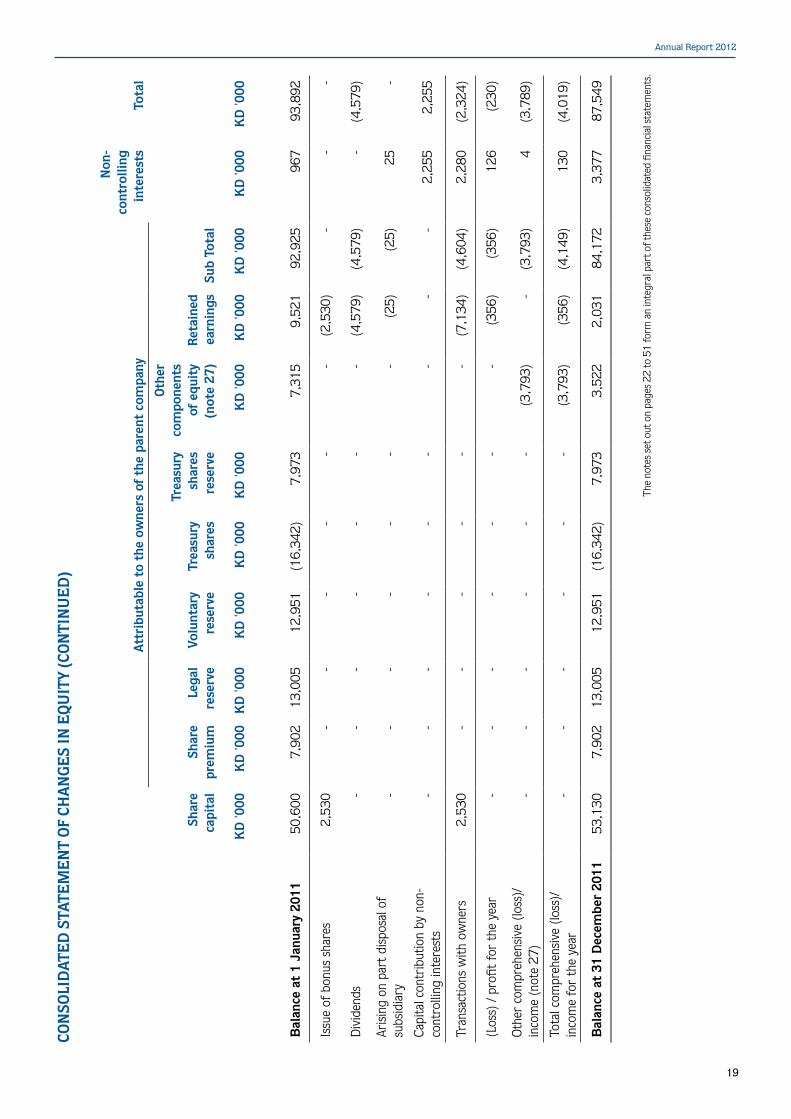
CON
SOLI
DAT
ED
STA
TEM
EN
T O
F CH
AN
GE
S IN
EQ
UIT
Y (C
ON
TIN
UE
D)
Att
ribu
tabl
e to
the
ow
ners
of
the
pare
nt c
ompa
ny
Non
-co
ntro
lling
in
tere
sts
Tota
l
Shar
e ca
pita
lSh
are
prem
ium
Lega
l re
serv
eVo
lunt
ary
rese
rve
Trea
sury
sh
ares
Trea
sury
sh
ares
re
serv
e
Oth
er
com
pone
nts
of e
quit
y (n
ote
27)
Ret
aine
d ea
rnin
gsSu
b To
tal
KD
'000
KD
'000
KD
'000
KD
'000
KD
'000
KD
'000
KD
'000
KD
'000
KD
'000
KD
'000
KD
'000
Bal
ance
at
1 Ja
nuar
y 20
1150
,600
7,90
213
,005
12,9
51(1
6,34
2)7,
973
7,31
59,
521
92,9
2596
793
,892
Issu
e of
bon
us s
hare
s 2,
530
--
--
--
(2,5
30)
--
-
Div
iden
ds
--
--
--
-(4
,579
)(4
,579
)-
(4,5
79)
Aris
ing
on p
art
disp
osal
of
subs
idia
ry
--
--
--
-(2
5)(2
5)25
-
Capi
tal c
ontr
ibut
ion
by n
on-
cont
rolli
ng in
tere
sts
--
--
--
--
-2,
255
2,25
5
Tran
sact
ions
with
ow
ners
2,53
0-
--
--
-(7
,134
)(4
,604
)2,
280
(2,3
24)
(Los
s) /
profi
t fo
r th
e ye
ar-
--
--
--
(356
)(3
56)
126
(230
)
Oth
er c
ompr
ehen
sive
(lo
ss)/
inco
me
(not
e 27
)-
--
--
-(3
,793
)-
(3,7
93)
4(3
,789
)
Tota
l com
preh
ensi
ve (
loss
)/in
com
e fo
r th
e ye
ar-
--
--
-(3
,793
)(3
56)
(4,1
49)
130
(4,0
19)
Bal
ance
at
31 D
ecem
ber
2011
53,1
307,
902
13,0
0512
,951
(16,
342)
7,97
33,
522
2,03
184
,172
3,37
787
,549
The
note
s se
t out
on
page
s 22
to 5
1 fo
rm a
n in
tegr
al p
art o
f the
se c
onso
lidat
ed fi
nanc
ial s
tate
men
ts.
Kuwait Financial Centre - S.A.K. (Closed) and Subsidiaries
20
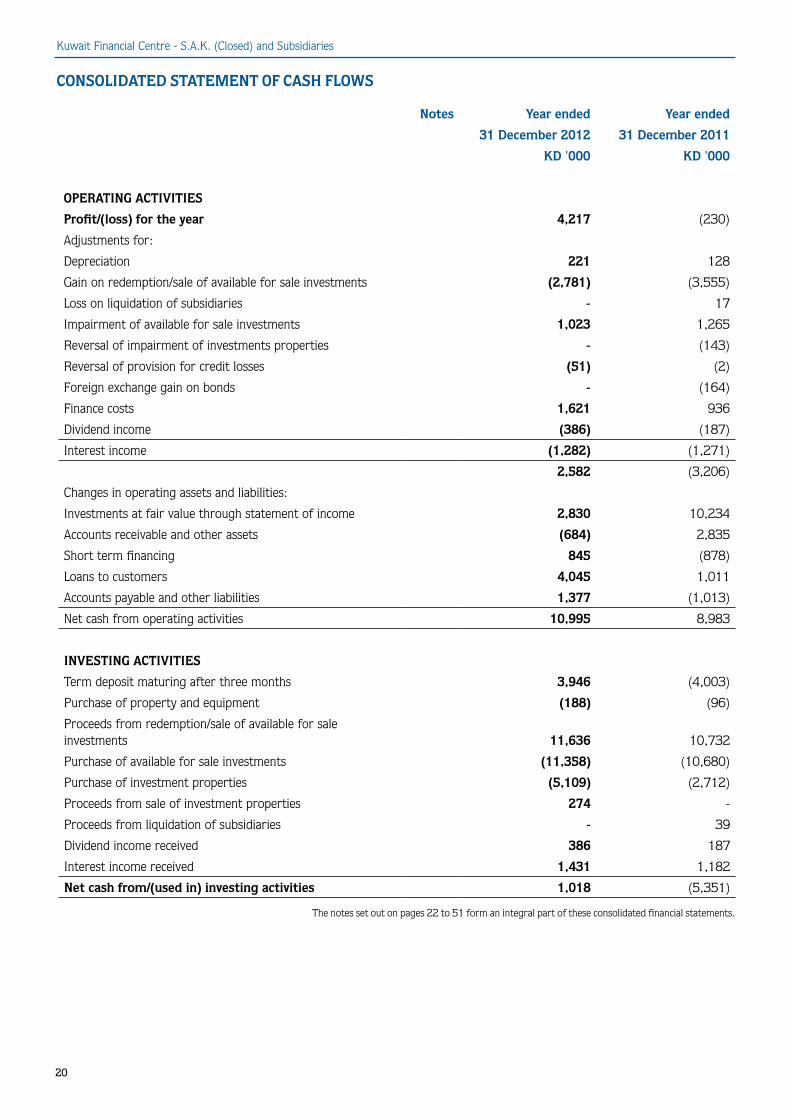
CONSOLIDATED STATEMENT OF CASH FLOWS
Notes Year ended Year ended
31 December 2012 31 December 2011
KD '000 KD '000
OPERATING ACTIVITIES
Profit/(loss) for the year 4,217 (230)
Adjustments for:
Depreciation 221 128
Gain on redemption/sale of available for sale investments (2,781) (3,555)
Loss on liquidation of subsidiaries - 17
Impairment of available for sale investments 1,023 1,265
Reversal of impairment of investments properties - (143)
Reversal of provision for credit losses (51) (2)
Foreign exchange gain on bonds - (164)
Finance costs 1,621 936
Dividend income (386) (187)
Interest income (1,282) (1,271)
2,582 (3,206)
Changes in operating assets and liabilities:
Investments at fair value through statement of income 2,830 10,234
Accounts receivable and other assets (684) 2,835
Short term financing 845 (878)
Loans to customers 4,045 1,011
Accounts payable and other liabilities 1,377 (1,013)
Net cash from operating activities 10,995 8,983
INVESTING ACTIVITIES
Term deposit maturing after three months 3,946 (4,003)
Purchase of property and equipment (188) (96)
Proceeds from redemption/sale of available for sale investments 11,636 10,732
Purchase of available for sale investments (11,358) (10,680)
Purchase of investment properties (5,109) (2,712)
Proceeds from sale of investment properties 274 -
Proceeds from liquidation of subsidiaries - 39
Dividend income received 386 187
Interest income received 1,431 1,182
Net cash from/(used in) investing activities 1,018 (5,351)
The notes set out on pages 22 to 51 form an integral part of these consolidated financial statements.
Annual Report 2012
21
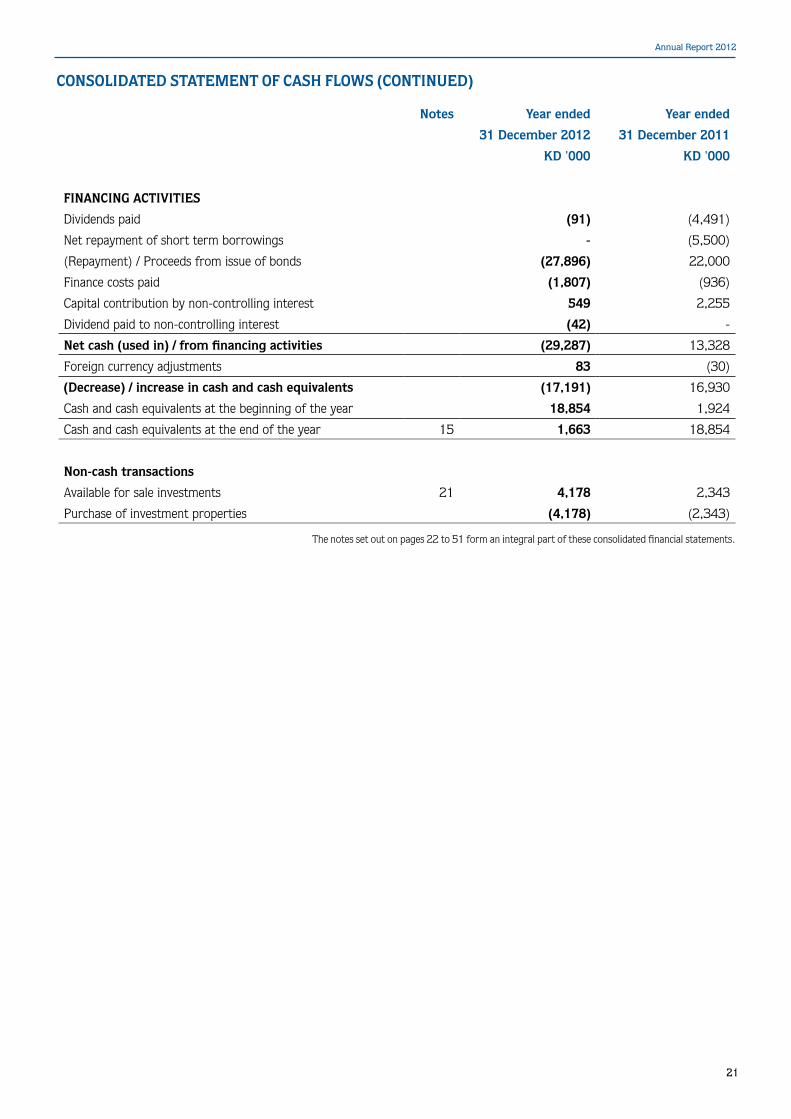
CONSOLIDATED STATEMENT OF CASH FLOWS (CONTINUED)
Notes Year ended Year ended
31 December 2012 31 December 2011
KD '000 KD '000
FINANCING ACTIVITIES
Dividends paid (91) (4,491)
Net repayment of short term borrowings - (5,500)
(Repayment) / Proceeds from issue of bonds (27,896) 22,000
Finance costs paid (1,807) (936)
Capital contribution by non-controlling interest 549 2,255
Dividend paid to non-controlling interest (42) -
Net cash (used in) / from financing activities (29,287) 13,328
Foreign currency adjustments 83 (30)
(Decrease) / increase in cash and cash equivalents (17,191) 16,930
Cash and cash equivalents at the beginning of the year 18,854 1,924
Cash and cash equivalents at the end of the year 15 1,663 18,854
Non-cash transactions
Available for sale investments 21 4,178 2,343
Purchase of investment properties (4,178) (2,343)
The notes set out on pages 22 to 51 form an integral part of these consolidated financial statements.
Kuwait Financial Centre - S.A.K. (Closed) and Subsidiaries
22
NOTES TO THE CONSOLIDATED FINANCIAL STATEMENTS
1. Incorporation and activitiesKuwait Financial Centre – SAK (Closed) (“the parent company”) was incorporated in 1974 in accordance with the Commercial Companies Law in the State of Kuwait. The parent company is listed on the Kuwait Stock Exchange and is governed under the directives of the Central Bank of Kuwait and Capital Market Authority of Kuwait.
The principal activities of the parent company and its subsidiaries (“the group”) are investment management, corporate financing, investment and financial advisory services, private equity funds, mutual funds and real estate funds and real estate funds management, real estate investments, money market and foreign exchange deals.
On 29 November 2012 the Companies Law No. (25) of 2012 was issued by an Amiri Decree. This law is to be implemented and was effective on the date of its publication in the Official Gazette. Companies already established at the time this law comes into effect shall adjust their circumstances in accordance with the provisions of the law within six months of it coming into force and as specified in the executive regulations.
The address of the parent company’s registered office is PO Box 23444, Safat 13095, State of Kuwait.
These consolidated financial statements of the group for the year ended 31 December 2012 were authorised for issue by the parent company’s board of directors on 17 February 2013 and are subject to the approval of the General Assembly of the shareholders.
2. Basis of preparation The consolidated financial statements of the group have been prepared under historical cost convention except for financial assets at fair value through statement of income, financial assets available for sale and derivative financial instruments that have been measured at fair value.
The consolidated financial statements have been presented in Kuwaiti Dinars (“KD”) which is the functional and presentation currency of the parent company rounded off to the nearest thousand.
3. Statement of compliance The consolidated financial statements of the group have been prepared in accordance with International Financial Reporting Standards (IFRS) as issued by the International Accounting Standards Board (IASB) and applicable requirements of Ministerial Order No. 18 of 1990, as modified by the State of Kuwait for financial services institutions regulated by Central Bank of Kuwait.
These regulations require adoption of all IFRS except for the IAS 39 requirement for collective impairment provision, which has been replaced by the Central Bank of Kuwait requirement for a minimum general provision as described under the accounting policy for impairment of financial assets.
4. Changes in accounting policies The accounting policies adopted in the preparation of the consolidated financial statements are consistent with those used in previous year except as below:
4.1 New and amended standards adopted by the group
There are no IFRSs or IFRIC interpretations that are effective for the first time for the financial year beginning on or after 1 January 2012 that would be expected to have a material impact on the group.
4.2 IASB Standards issued but not yet effective
At the date of authorisation of these consolidated financial statements, certain new standards, amendments and interpretations to existing standards have been published by the IASB but are not yet effective, and have not been adopted early by the group.
Management anticipates that all of the relevant pronouncements will be adopted in the group’s accounting policies for the first period beginning after the effective date of the pronouncements. Information on new standards, amendments and interpretations that are expected to be relevant to the group’s financial statements is provided below. Certain other new standards and interpretations have been issued but are not expected to have a material impact on the group’s financial statements.
Annual Report 2012
23
Standard or Interpretation Effective for annual periods beginning
IAS 1 Presentation of Financial Statements – amendment 1 July 2012
IAS 27 Consolidated and Separate Financial Statements - Revised as IAS 27 Separate Financial Statements
1 January 2013
IFRS 9 Financial Instruments: Classification and Measurement 1 January 2015IFRS 10 Consolidated Financial Statements 1 January 2013IFRS 12 Disclosure of Interest in Other Entities 1 January 2013IFRS 13 Fair Value Measurement 1 January 2013IAS 32 Financial Instruments: Presentation – amendments 1 January 2014IFRS 7 Financial Instruments: Disclosures – amendments 1 January 2013Annual Improvements 2009-2011 1 January 2013
- IAS 1 Presentation of Financial Statements
The amendment to IAS 1 requires entities to group other comprehensive income items presented in the consolidated statement of comprehensive income based on those:
a) Potentially reclassifiable to consolidated statement of income in a subsequent period, and
b) That will not be reclassified to consolidated statement of income subsequently.
The group will change the current presentation of the consolidated statement of comprehensive income when the amendment becomes effective.
- IAS 27 Consolidated and Separate Financial statements – Revised as IAS 27 Separate Financial Statements
As a result of the consequential amendments, IAS 27 now deals with separate financial statements.
-IFRS 9 Financial Instruments – Classification and measurement
The IASB aims to replace IAS 39 Financial Instruments: Recognition and Measurement in its entirety. The replacement standard (IFRS 9) is being issued in phases. To date, the chapters dealing with recognition, classification, measurement and derecognition of financial assets and liabilities have been issued. These chapters are effective for annual periods beginning 1 January 2015. Further chapters dealing with impairment methodology and hedge accounting are still being developed. Further, in November 2011, the IASB tentatively decided to consider making limited modifications to IFRS 9’s financial asset classification model to address application issues.
Although earlier application of this standard is permitted, the Technical Committee of the Ministry of Commerce and Industry of Kuwait decided on 30 December 2009, to postpone this early application till further notice.
Management has yet to assess the impact that this amendment is likely to have on the financial statements of the group. However, they do not expect to implement the amendments until all chapters of IFRS 9 have been published and they can comprehensively assess the impact of all changes.
-IFRS 10 Consolidated Financial Statements
IFRS 10 supersedes IAS 27 Consolidated and Separate Financial Statements and SIC 12 Consolidation – Special Purpose Entities. It revises the definition of control together with accompanying guidance to identify an interest in a subsidiary. These new requirements have the potential to affect which of the group’s investees are considered to be subsidiaries and, therefore, change the scope of consolidation. However, the requirements and procedures of consolidation and the accounting for any non-controlling interests and changes in control remain the same. Management’s provisional analysis is that IFRS 10 will not change the classification (as subsidiaries or otherwise) of any of the group’s existing investees at 31 December 2012.
- IFRS 12 Disclosure of Interests in Other Entities
IFRS 12 integrates and makes consistent the disclosure requirements for various types of investments including subsidiaries, joint arrangements, associates and unconsolidated structured entities. It introduces new disclosure requirements about the risks to which an entity is exposed from its involvement with structured entities.
Kuwait Financial Centre - S.A.K. (Closed) and Subsidiaries
24
4. Changes in accounting policies (continued)
- IFRS 13 Fair Value Measurement
IFRS 13 clarifies the definition of fair value and provides related guidance and enhanced disclosures about fair value measurements. It does not affect which items are required to be fair valued. IFRS 13 applies prospectively for annual periods beginning on or after 1 January 2013. Management is in the process of reviewing its valuation methodologies for conformity with the new requirements and has yet to complete its
assessment of their impact on the group’s consolidated financial statements.
- Offsetting Financial Assets and Financial Liabilities (Amendments to IAS 32)
The Amendments to IAS 32 add application guidance to address inconsistencies in applying IAS 32’s criteria for offsetting financial assets and financial liabilities in the following two areas:
• the meaning of ‘currently has a legally enforceable right of set-off’
• that some gross settlement systems may be considered equivalent to net settlement.
The Amendments are effective for annual periods beginning on or after 1 January 2014 and are required to be applied retrospectively. Management does not anticipate a material impact on the group’s consolidated financial statements from these Amendments.
- Disclosures – Offsetting Financial Assets and Financial Liabilities (Amendments to IFRS 7)
Qualitative and quantitative disclosures have been added to IFRS 7 ‘Financial Instruments: Disclosures’ (IFRS 7) relating to gross and net amounts of recognised financial instruments that are (a) set off in the statement of financial position and (b) subject to enforceable master netting arrangements and similar agreements, even if not set off in the statement of financial position. The Amendments are effective for annual reporting periods beginning on or after 1 January 2013 and interim periods within those annual periods. The required disclosures should be provided retrospectively. Management does not anticipate a material impact on the group’s consolidated financial statements from these Amendments.
- Annual Improvements 2009-2011 (the Annual Improvements)
The Annual Improvements 2009-2011 (the Annual Improvements) made several minor amendments to a number of IFRSs. The amendments relevant to the group are summarised below:
Clarification of the requirements for opening statement of financial position:
• clarifies that the appropriate date for the opening statement of financial position is the beginning of the preceding period (related notes are no longer required to be presented)
• addresses comparative requirements for the opening statement of financial position when an entity changes accounting policies or makes retrospective restatements or reclassifications, in accordance with IAS 8.
Clarification of the requirements for comparative information provided beyond minimum requirements:
• clarifies that additional financial statement information need not be presented in the form of a complete set of financial statements for periods beyond the minimum requirements
• requires that any additional information presented should be presented in accordance with IFRS and the entity should present comparative information in the related notes for that additional information.
Tax effect of distribution to holders of equity instruments:
• addresses a perceived inconsistency between IAS 12 ‘Income Taxes’ (IAS 12) and IAS 32 ‘Financial Instruments: Presentation’ (IAS 32) with regards to recognising the consequences of income tax relating to distributions to holders of an equity instrument and to transaction costs of an equity transaction
• clarifies that the intention of IAS 32 is to follow the requirements in IAS 12 for accounting for income tax relating to distributions to holders of an equity instrument and to transaction costs of an equity transaction.
Segment information for total assets and liabilities:
• clarifies that the total assets and liabilities for a particular reportable segment are required to be disclosed if, and only if: (i) a measure of total assets or of total liabilities (or both) is regularly provided to the chief operating decision maker; (ii) there has been a material change from those measures disclosed in the last annual financial statements for that reportable segment.
The Annual Improvements noted above are effective for annual periods beginning on or after 1 January 2013. Management does not anticipate a material impact on the group’s consolidated financial statements from these Amendments.
Annual Report 2012
25
5. Significant accounting policiesThe significant accounting policies adopted in the preparation of the consolidated financial statements are set out below:
5.1 Basis of consolidation
The group financial statements consolidate those of the parent company and all of its subsidiaries (see note 7). Subsidiaries are all entities over which the group has the power to control the financial and operating policies. The group obtains and exercises control through more than half of the voting rights. The financial statements of the subsidiaries are prepared for reporting dates which are typically not more than three months from that of the parent company, using consistent accounting policies. Adjustments are made for the effect of any significant transactions or events that occur between that date and the reporting date of the parent company’s financial statements.
All transactions and balances between group companies are eliminated on consolidation, including unrealised gains and losses on transactions between group companies. Where unrealised losses on intra-group asset sales are reversed on consolidation, the underlying asset is also tested for impairment from a group perspective. Amounts reported in the financial statements of subsidiaries have been adjusted where necessary to ensure consistency with the accounting policies adopted by the group.
Profit or loss and other comprehensive income of subsidiaries acquired or disposed of during the year are recognised from the effective date of acquisition, or up to the effective date of disposal, as applicable.
Non-controlling interests, presented as part of equity, represent the portion of a subsidiary’s profit or loss and net assets that is not held by the group. The group attributes total comprehensive income or loss of subsidiaries between the owners of the parent and the non-controlling interests based on their respective ownership interests.
When a controlling interest in the subsidiaries is disposed off, the difference between the selling price and the net asset value plus cumulative translation difference and goodwill is recognised in the consolidated statement of income.
Changes in the group’s ownership interests in subsidiaries that do not result in the group losing control over the subsidiaries are accounted for as equity transactions. The carrying amounts of the group’s interests and the non-controlling interests are adjusted to reflect the changes in their relative interests in the subsidiaries. Any difference between the amount by which the non-controlling interests are adjusted and the fair value of the consideration paid or received is recognised directly in equity and attributed to the owners of the parent company.
5.2 Revenue
Revenue is recognised to the extent that it is probable that the economic benefits will flow to the group and the revenue can be reliably measured, regardless of when payment is made.
Revenue arises from rendering of services and is measured by reference to the fair value of consideration received or receivable.
The group applies the revenue recognition criteria set out below to each separately indentifiable component of revenue.
5.2.1 Rendering of services
The group earns fees and commission income from diverse range of asset management, investment banking, custody and brokerage services provided to its customers. Fee income can be divided into the following two categories:
Fee income earned from services that are provided over a certain period of time
Fees earned for the provision of services over a period of time are accrued over that period. These fees include commission income and asset management, custody and other management fees.
Fee income from providing transaction services
Fees arising for rendering specific advisory services, brokerage services, equity and debt placement transactions for a third party or arising from negotiating or participating in the negotiation of a transaction for a third party are recognised on completion of the underlying transaction.
5.2.2 Interest income
Interest income are reported on an accrual basis using the effective interest method.
5.2.3 Dividend income
Dividend income are recognised at the time the right to receive payment is established.
5.2.4 Rental income
Rental income arising from investment properties is accounted for on a straight line basis over the lease term.
Kuwait Financial Centre - S.A.K. (Closed) and Subsidiaries
26
5. Significant accounting policies (continued)
5.3 Operating expenses
Operating expenses are recognised in consolidated statement of income upon utilisation of the service or at the date of their origin.
5.4 Borrowing costs
Borrowing costs directly attributable to the acquisition, construction or production of a qualifying asset are capitalised during the period of time that is necessary to complete and prepare the asset for its intended use or sale. Other borrowing costs are expensed in the period in which they are incurred and reported in finance costs.
5.5 Taxation
5.5.1 Kuwait Foundation for the Advancement of Sciences (KFAS)
The contribution to KFAS is calculated at 1% of taxable profit of the group in accordance with the modified calculation based on the Foundation’s Board of Directors’ resolution, which states that income from associates and subsidiaries, Board of Directors’ remuneration, transfer to statutory reserve should be excluded from profit for the year when determining the contribution.
5.5.2 National Labour Support Tax (NLST)
NLST is calculated in accordance with Law No. 19 of 2000 and the Minister of Finance Resolutions No. 24 of 2006 at 2.5% of taxable profit of the group after deducting directors’ fees for the year. As per law, income from associates and subsidiaries, cash dividends from listed companies which are subjected to NLST have to be deducted from the profit for the year.
5.5.3 Zakat
Contribution to Zakat is calculated at 1% of the profit of the group in accordance with the Ministry of Finance resolution No. 58/2007 effective from 10 December 2007.
5.5.4 Taxation on overseas subsidiaries
Taxation on overseas subsidiaries is calculated on the basis of the tax rates applicable and prescribed according to the prevailing laws, regulations and instructions of the countries where these subsidiaries operate.
5.6 Segment reporting
The group has two operating segments: the asset management and investment banking. In identifying these operating segments, management generally follows the group’s service lines representing its main services. Each of these operating segments is managed separately as each requires different approaches and other resources. All inter-segment transfers are carried out at arm’s length prices.
For management purposes, the group uses the same measurement policies as those used in its financial statements. In addition, assets or liabilities which are not directly attributable to the business activities of any operating segment are not allocated to a segment.
5.7 Business combinations
The group applies the acquisition method in accounting for business combinations. The consideration transferred by the group to obtain control of a subsidiary is calculated as the sum of the acquisition-date fair values of assets transferred, liabilities incurred and the equity interests issued by the group, which includes the fair value of any asset or liability arising from a contingent consideration arrangement. Acquisition costs are expensed as incurred. For each business combination, the acquirer measures the non-controlling interests in the acquiree either at fair value or at the proportionate share of the acquiree’s identifiable net assets.
If the business combination is achieved in stages, the acquisition date fair value of the acquirer’s previously held equity interest in the acquiree is remeasured to fair value at the acquisition date through consolidated statement of income.
The group recognises identifiable assets acquired and liabilities assumed in a business combination regardless of whether they have been previously recognised in the acquiree’s financial statements prior to the acquisition. Assets acquired and liabilities assumed are generally measured at their acquisition-date fair values.
When the group acquires a business, it assesses the financial assets and liabilities assumed for appropriate classification and designation in accordance with the contractual terms, economic circumstances and pertinent conditions as at the acquisition date. This includes the separation of embedded derivatives in host contracts by the acquiree.
Annual Report 2012
27
Goodwill is stated after separate recognition of identifiable intangible assets. It is calculated as the excess of the sum of a) fair value of consideration transferred, b) the recognised amount of any non controlling interest in the acquiree and c) acquisition-date fair value of any existing equity interest in the acquiree, over the acquisition-date fair values of identifiable net assets. If the fair values of identifiable net assets exceed the sum calculated above, the excess amount (ie gain on a bargain purchase) is recognised in consolidated statement of income immediately.
5.8 Investment property
Investment properties are properties held to earn rentals and/or for capital appreciation and are initially measured at cost, including transaction costs, Subsequently, investment properties are accounted for using the cost model whereby these investments are stated at cost less accumulated depreciation and impairment losses, if any. The group depreciates its investment property except land on the straight-line method over their expected useful lives of over 45 years for properties held outside Kuwait.
When investment property is sold, its cost and accumulated depreciation are eliminated from the accounts and any gain or loss resulting from the disposal is recognised in the consolidated statement of income.
Transfers are made to or from investment property only when there is a change in use. For a transfer from investment property to owner-occupied property, the deemed cost for subsequent accounting is the fair value at the date of change in use. If owner-occupied property becomes an investment property, the group accounts for such property in accordance with the policy stated under property, plant and equipment up to the date of change in use.
5.9 Property and equipment
Property and other equipment (comprising fittings, furniture, vehicles and decoration) are initially recognised at acquisition cost or manufacturing cost, including any costs directly attributable to bringing the assets to the location and condition necessary for it to be capable of operating in the manner intended by the group’s management.
Vehicles and other equipment are subsequently measured using the cost model, cost less subsequent depreciation and impairment losses. Depreciation is recognised on a straight-line basis to write down the cost less estimated residual value of vehicles and other equipment. The useful life and depreciation method are reviewed periodically to ensure that the method and period of depreciation are consistent with the expected pattern of economic benefits arising from items of property and equipment. The following useful lives are applied:
Office equipment and software 3 - 5 years
Motor vehicles 3 - 4 years
Furniture and fixtures 7 - 10 years
Decorations 7 years
Licence fee 2 - 3 years
When assets are sold or retired, their cost and accumulated depreciation are eliminated from the accounts and any gain or loss resulting from their disposal is recognised in the consolidated statement of income.
5.10 Impairment testing of non financial assets
An impairment loss is recognised for the amount by which the asset’s or cash-generating unit’s carrying amount exceeds its recoverable amount, which is the higher of fair value less costs to sell and value-in-use. To determine the value-in-use, management estimates expected future cash flows from each cash-generating unit and determines a suitable interest rate in order to calculate the present value of those cash flows. The data used for impairment testing procedures are directly linked to the group’s latest approved budget, adjusted as necessary to exclude the effects of future reorganisations and asset enhancements. Discount factors are determined individually for each cash-generating unit and reflect management’s assessment of respective risk profiles, such as market and asset-specific risks factors.
Impairment losses for cash-generating units reduce first the carrying amount of any goodwill allocated to that cash-generating unit. Any remaining impairment loss is charged pro rata to the other assets in the cash-generating unit. With the exception of goodwill, all assets are subsequently reassessed for indications that an impairment loss previously recognised may no longer exist. An impairment charge is reversed if the cash-generating unit’s recoverable amount exceeds its carrying amount.
Kuwait Financial Centre - S.A.K. (Closed) and Subsidiaries
28
5. Significant accounting policies (continued)
5.11 Financial instruments
5.11.1 Recognition, initial measurement and derecognition
Financial assets and financial liabilities are recognised when the group becomes a party to the contractual provisions of the financial instrument and are measured initially at fair value adjusted by transactions costs, except for those carried at fair value through statement of income which are measured initially at fair value.
A financial asset (or, where applicable a part of financial asset or part of group of similar financial assets) is derecognised when:
∑ - rights to receive cash flows from the assets have expired;
∑ - the group has transferred its rights to receive cash flows from the asset or has assumed an obligation to pay the received cash flows in full without material delay to a third party under a ‘pass through’ arrangement and either
(a) the group has transferred substantially all the risks and rewards of the asset or
(b) the group has neither transferred nor retained substantially all risks and rewards of the asset but has transferred control of the asset.
Where the group has transferred its rights to receive cash flows from an asset or has entered into a pass- through arrangement and has neither transferred nor retained substantially all the risks and rewards of the asset nor transferred control of the asset, a new asset is recognised to the extent of the group’s continuing involvement in the asset.
A financial liability is derecognised when the obligation under the liability is discharged or cancelled or expires. When an existing financial liability is replaced by another from the same lender on substantially different terms, or the terms of an existing liability are substantially modified, such an exchange or modification is treated as a derecognition of the original liability and the recognition of a new liability, and the difference in the respective carrying amounts is recognised in consolidated statement of income.
5.11.2 Classification and subsequent measurement of financial assets
For the purpose of subsequent measurement, financial assets other than those designated and effective as hedging instruments are classified into the following categories upon initial recognition:
• Loans and receivables
• Financial assets at fair value through statement of income (FVTSI)
• Available-for-sale (AFS) financial assets.
All financial assets except for those at FVTSI are subject to review for impairment at least at each reporting date to identify whether there is any objective evidence that a financial asset or a group of financial assets is impaired. Different criteria to determine impairment are applied for each category of financial assets, which are described below.
All income and expense relating o financial assets that are recognised in consolidated statement of income are presented within finance costs, finance income or other financial items, except for impairment of loan and receivable which are presented within other expenses.
• Loans and receivables
Loans and receivables are non-derivative financial assets with fixed or determinable payments that are not quoted in an active market. After initial recognition, these are measured at amortised cost using the effective interest rate method, less provision for impairment. Discounting is omitted where the effect of discounting is immaterial.
Individually significant receivables are considered for impairment when they are past due or when other objective evidence is received that a specific counterparty will default. Receivables that are not considered to be individually impaired are reviewed for impairment in groups, which are determined by reference to the industry and region of a counterparty and other shared credit risk characteristics. The impairment loss estimate is then based on recent historical counterparty default rates for each identified group.
In addition, in accordance with Central Bank of Kuwait instructions, a minimum general provision is made on all applicable credit facilities (net of certain categories of collateral) that are not provided for specifically.
The group categorises loans and receivables into following categories:
Annual Report 2012
29
- Loans and advances
Loans and advances are financial assets originated by the group by providing money directly to the borrower that have fixed or determinable payments and are not quoted in an active market. The group loans and advances comprises loan to customers and short term financing.
- Accounts receivable and other assets
Accounts receivable and other assets are stated at original invoice amount less allowance for any uncollectible amounts. An estimate for doubtful debts is made when collection of the full amount is no longer probable. Bad debts are written off as incurred.
- Cash and cash equivalents
Cash and cash equivalents comprise cash on hand, bank balances and term deposits, that are readily convertible into known amounts of cash within 90 days and which are subject to an insignificant risk of changes in value net of due to banks and other financial institutions.
• Financial assets at FVTSI
Classification of investments as financial assets at FVTSI depends on how management monitor the performance of these investments. When they are not classified as held for trading but have readily available reliable fair values and the changes in fair values are reported as part of consolidated statement of income in the management accounts, they are as designated at FVTSI upon initial recognition. All derivative financial instruments fall into this category, except for those designated and effective as hedging instruments, for which the hedge accounting requirements apply (see note 5.11.4).
Assets in this category are measured at fair value with gains or losses recognised in consolidated statement of income. The fair values of financial assets in this category are determined by reference to active market transactions or using a valuation technique where no active market exists.
• AFS financial assets
AFS financial assets are non-derivative financial assets that are either designated to this category or do not qualify for inclusion in any of the other categories of financial assets.
Financial assets whose fair value cannot be reliably measured are carried at cost less impairment losses, if any. Impairment charges are recognised in consolidated statement of income. All other AFS financial assets are measured at fair value. Gains and losses are recognised in other comprehensive income and reported within the fair value reserve within equity, except for impairment losses, and foreign exchange differences on monetary assets, which are recognised in consolidated statement of income. When the asset is disposed of or is determined to be impaired, the cumulative gain or loss recognised in other comprehensive income is reclassified from the equity reserve to consolidated statement of income and presented as a reclassification adjustment within other comprehensive income.
The group assesses at each reporting date whether there is objective evidence that a financial asset available for sale or a group of financial assets available for sale is impaired. In the case of equity investments classified as financial assets available for sale, objective evidence would include a significant or prolonged decline in the fair value of the equity investment below its cost. ‘Significant’ is evaluated against the original cost of the investment and ‘prolonged’ against the period in which the fair value has been below its original cost. Where there is evidence of impairment, the cumulative loss is removed from other comprehensive income and recognised in the consolidated statement of income.
Reversals of impairment losses are recognised in other comprehensive income, except for financial assets that are debt securities which are recognised in consolidated statement of income only if the reversal can be objectively related to an event occurring after the impairment loss was recognised.
5.11.3 Classification and subsequent measurement of financial liabilities
The group’s financial liabilities include due to banks and other financial institutions, accounts payables and other liabilities, bonds and derivatives financial instruments.
The subsequent measurement of financial liabilities depends on their classification as follows:
- Financial liabilities other than at fair value through statement of income
These are stated using effective interest rate method. Due to banks and other financial institutions and bonds are classified as financial liabilities other than at fair value through statement of income.
- Accounts payable and other liabilities
Liabilities are recognised for amounts to be paid in the future for goods or services received, whether billed or not.
Kuwait Financial Centre - S.A.K. (Closed) and Subsidiaries
30
5. Significant accounting policies (continued)
5.11 Financial instruments (continued)
5.11.3 Classification and subsequent measurement of financial liabilities (continued)
- Borrowings
All borrowings are subsequently measured at amortised cost using the effective interest rate method. Gains and losses are recognised in the consolidated statement of income when the liabilities are derecognised as well as through the effective interest rate method (EIR) amortisation process.
- Bonds
Bonds are carried on the consolidated statement of financial position at their principal amount, net of directly related costs of issuing the bonds to the extent that such costs have not been amortised. These costs are amortised through the consolidated statement of income over the life of the bonds using the effective interest rate method.
All derivative financial instruments that are not designated and effective as hedging instruments are accounted for at FVTSI.
All interest-related charges and, if applicable, changes in an instrument’s fair value that are reported in consolidated statement of income, are included within finance costs or finance income.
5.11.4 Derivative financial instruments and hedge accounting
Derivative financial instruments are accounted for at FVTSI except for derivatives designated as hedging instruments in cash flow hedge relationships or fair value hedge relationship, which requires a specific accounting treatment. To qualify for hedge accounting, the hedging relationship must meet several strict conditions with respect to documentation, probability of occurrence of the hedged transaction and hedge effectiveness.
All derivative financial instruments used for hedge accounting are recognised initially at fair value and reported subsequently at fair value in the consolidated statement of financial position. To the extent that the hedge is effective, changes in the fair value of derivatives designated as hedging instruments in cash flow hedges are recognised in other comprehensive income and included within the cash flow hedge reserve in equity. Any ineffectiveness in the hedge relationship is recognised immediately in consolidated statement of income.
At the time the hedged item affects consolidated statement of income, any gain or loss previously recognised in other comprehensive income is reclassified from equity to consolidated statement of income and presented as a reclassification adjustment within other comprehensive income. However, if a non-financial asset or liability is recognised as a result of the hedged transaction, the gains and losses previously recognised in other comprehensive income are included in the initial measurement of the hedged item.
5.11.4 Derivative financial instruments and hedge accounting (continued)
All derivative financial instruments are recognised in the consolidated statement of financial position as either assets (positive fair values) or liabilities (negative fair values).
Derivative financial instruments used by the group include foreign exchange forwards contracts and interest rate swaps.
- Hedge accounting
The group has designated its interest rate swaps as hedging instruments for cash flow hedges in order to mitigate interest rate risk arising from its bonds.
At the inception of the hedge relationship, the group documents the relationship between the hedging instrument and the hedged item, along with its risk management objectives and its strategy for undertaking various hedge transactions. Furthermore, at the inception of the hedge and on an ongoing basis, the group documents whether the hedging instrument is highly effective in offsetting changes in fair values or cash flows of the hedged item.
Note 35 sets out details of the fair values of the derivative instruments used for hedging purposes.
- Cash flow hedges
The effective portion of changes in the fair value of derivatives that are designated and qualify as cash flow hedges is recognised in other comprehensive income. The gain or loss relating to the ineffective portion is recognised immediately in the consolidated statement of income.
Amounts previously recognised in other comprehensive income and accumulated in equity are reclassified to the consolidated statement of income in the periods when the hedged item is recognised in the consolidated statement of income. However, when the forecast transaction that is hedged results in the recognition of a non-financial asset or a non-financial liability,

Annual Report 2012
31
the gains and losses previously accumulated in equity are transferred from equity and included in the initial cost of the non-financial asset or non-financial liability.
Hedge accounting is discontinued when the group revokes the hedging relationship, when the hedging instrument expires or is sold, terminated, or exercised, or when it no longer qualifies for hedge accounting. When a forecast transaction is expected to occur, any gain or loss accumulated in equity at that time remains separately in equity and is recognised in the consolidated statement of income when the forecast transaction is ultimately recognised in the consolidated statement of income. When a forecast transaction is no longer expected to occur, the gain or loss accumulated in equity is recognised immediately in the consolidated statement of income.
5.11.5 Amortised cost of financial instruments
This is computed using the effective interest method less any allowance for impairment. The calculation takes into account any premium or discount on acquisition and includes transaction costs and fees that are an integral part of the effective interest rate.
5.11.6 Trade and settlement date accounting
All ‘regular way’ purchases and sales of financial assets are recognised on the trade date i.e. the date that the entity commits to purchase or sell the asset. Regular way purchases or sales are purchases or sales of financial assets that require delivery of assets within the time frame generally established by regulation or convention in the market place.
5.11.7 Offsetting of financial instruments
Financial assets and financial liabilities are offset and the net amount reported in the consolidated statement of financial position if, and only if, there is a currently enforceable legal right to offset the recognised amounts and there is an intention to settle on a net basis, or to realise the assets and settle the liabilities simultaneously.
5.11.8 Fair value of financial instruments
The fair value of financial instruments that are traded in active markets at each reporting date is determined by reference to quoted market prices or dealer price quotations (bid price for long positions and ask price for short positions), without any deduction for transaction costs.
For financial instruments not traded in an active market, the fair value is determined using appropriate valuation techniques. Such techniques may include using recent arm’s length market transactions; reference to the current fair value of another instrument that is substantially the same; a discounted cash flow analysis or other valuation models.
An analysis of fair values of financial instruments and further details as to how they are measured are provided in Note 34.
5.12 Equity, reserves and dividend payments
Share capital represents the nominal value of shares that have been issued and paid up.
Share premium includes any premiums received on issue of share capital. Any transaction costs associated with the issuing of shares are deducted from share premium.
Legal and voluntary reserves comprise appropriations of current and prior period profits in accordance with the requirements of the Commercial Companies’ Law and the parent company’s articles of association.
Other components of equity include the following:
• Foreign currency translation reserve – comprises foreign currency translation differences arising from the translation of financial statements of the group’s foreign entities into Kuwaiti Dinars
• Fair value reserve – comprises gains and losses relating to available for sale financial assets
• Cash flow hedging reserve – comprises gain and losses relating to cash flow hedging.
• Treasury shares reserve – comprises gain and losses resulting from sale of treasury shares
Retained earnings includes all current and prior period retained profits and losses. All transactions with owners of the parent are recorded separately within equity.
Dividend distributions payable to equity shareholders are included in accounts payable and other liabilities when the dividends have been approved in a general meeting.
Kuwait Financial Centre - S.A.K. (Closed) and Subsidiaries
32
5. Significant accounting policies (continued)
5.13 Treasury shares
Treasury shares consist of the parent company’s own issued shares that have been reacquired by the group and not yet reissued or cancelled. The treasury shares are accounted for using the cost method. Under this method, the weighted average cost of the shares reacquired is charged to a contra account in equity.
When the treasury shares are reissued, gains are credited to a separate account in equity, (the “treasury shares reserve”), which is not distributable. Any realised losses are charged to the same account to the extent of the credit balance on that account. Any excess losses are charged to retained earnings then to the voluntary reserve and statutory reserve. No cash dividends are paid on these shares. The issue of stock dividend shares increases the number of treasury shares proportionately and reduces the average cost per share without affecting the total cost of treasury shares.
5.14 Provisions, contingent assets and contingent liabilities
Provisions are recognised when the group has a present legal or constructive obligation as a result of a past event, it is probable that an outflow of economic resources will be required from the group and amounts can be estimated reliably. Timing or amount of the outflow may still be uncertain.
Provisions are measured at the estimated expenditure required to settle the present obligation, based on the most reliable evidence available at the reporting date, including the risks and uncertainties associated with the present obligation. Where there are a number of similar obligations, the likelihood that an outflow will be required in settlement is determined by considering the class of obligations as a whole. Provisions are discounted to their present values, where the time value of money is material.
Contingent assets are not recognised in the consolidated financial statements, but are disclosed when an inflow of economic benefits is probable.
Contingent liabilities are not recognised in the consolidated statement of financial position, but are disclosed unless the possibility of an outflow of resources embodying economic benefits is remote.
5.15 Foreign currency translation
5.15.1 Functional and presentation currency
Each entity in the group determines its own functional currency and items included in the financial statements of each entity are measured using that functional currency.
5.15.2 Foreign currency transactions and balances
Foreign currency transactions are translated into the functional currency of the respective group entity, using the exchange rates prevailing at the dates of the transactions (spot exchange rate). Foreign exchange gains and losses resulting from the settlement of such transactions and from the remeasurement of monetary items denominated in foreign currency at year-end exchange rates are recognised in consolidated statement of income. Non-monetary items are not retranslated at year-end and are measured at historical cost (translated using the exchange rates at the transaction date), except for non-monetary items measured at fair value which are translated using the exchange rates at the date when fair value was determined.
5.15.3 Foreign operations
In the group’s financial statements, all assets, liabilities and transactions of group entities with a functional currency other than the KD are translated into KD upon consolidation. The functional currency of the entities in the group has remained unchanged during the reporting period.
On consolidation, assets and liabilities have been translated into KD at the closing rate at the reporting date. Income and expenses have been translated into KD at the average rate over the reporting period. Exchange differences are charged/credited to other comprehensive income and recognised in the foreign currency translation reserve in equity. On disposal of a foreign operation, the related cumulative translation differences recognised in equity are reclassified to consolidated statement of income and are recognised as part of the gain or loss on disposal.
5.16 Related party transactions
Related parties consist of directors, executive officers, their close family members and companies of which they are principal owners. All related party transactions are approved by management.
5.17 End of service indemnity
The group provides end of service benefits to its employees. The entitlement to these benefits is based upon the employees’ final salary and length of service, subject to the completion of a minimum service period in accordance with relevant labour law
Annual Report 2012
33
and the employees’ contracts. The expected costs of these benefits are accrued over the period of employment. This liability, which is unfunded, represents the amount payable to each employee as a result of termination on the reporting date
With respect to its Kuwaiti national employees, the group makes contributions to the Public Institution for Social Security calculated as a percentage of the employees’ salaries. The group’s obligations are limited to these contributions, which are expensed when due.
5.18 Fiduciary assets
Assets and related deposits held in trust or in a fiduciary capacity are not treated as assets or liabilities of the group and accordingly are not included in these consolidated financial statements.
6. Significant management judgments and estimation uncertainty The preparation of the group’s consolidated financial statements requires management to make judgments, estimates and assumptions that affect the reported amount of revenues, expenses, assets and liabilities and the disclosure of contingent liabilities, at the end of the reporting period. However uncertainty about these assumptions and estimates could result in outcomes that require a material adjustment to the carrying amount of the asset or liability affected in future periods.
6.1 Significant management judgments
In the process of applying the group’s accounting policies, management has made the following significant judgments, which have the most significant effect on the amounts recognised in the consolidated financial statements:
6.1.1 Classification of financial instruments
Judgements are made in the classification of financial instruments based on management’s intention at acquisition.
The group classifies financial assets as held for trading if they are acquired primarily for the purpose of short term profit making.
Classification of financial assets as fair value through statement of income depends on how management monitors the performance of these financial assets. When they are not classified as held for trading but have readily available fair values and the changes in fair values are reported as part of consolidated statement of income in the management accounts, they are classified as fair value through statement of income.
Classification of assets as loans and receivables depends on the nature of the asset. If the group is unable to trade these financial assets due to inactive market and the intention is to receive fixed or determinable payments the financial asset is classified as loans and receivables.
All other financial assets are classified as available for sale.
6.1.2 Classification of real estate
Management decides on acquisition of a real estate whether it should be classified as trading, property held for development or investment property.
The group classifies property as trading property if it is acquired principally for sale in the ordinary course of business.
The group classifies property as investment property under development if it is acquired with the intention of development.
The group classifies property as investment property if it is acquired to generate rental income or for capital appreciation, or for undetermined future use.
6.2 Estimates uncertainty
Information about estimates and assumptions that have the most significant effect on recognition and measurement of assets, liabilities, income and expenses is provided below. Actual results may be substantially different.
6.2.1 Impairment of available for sale equity investments
The group treats available for sale equity investments as impaired when there has been a significant or prolonged decline in the fair value below its cost or where other objective evidence of impairment exists. The determination of what is “significant” or “prolonged” requires considerable judgment.
6.2.2 Useful lives of depreciable assets
Management reviews its estimate of the useful lives of depreciable assets at each reporting date, based on the expected utility of the assets. Uncertainties in these estimates relate to technical obsolescence that may change the utility of certain software and equipment.
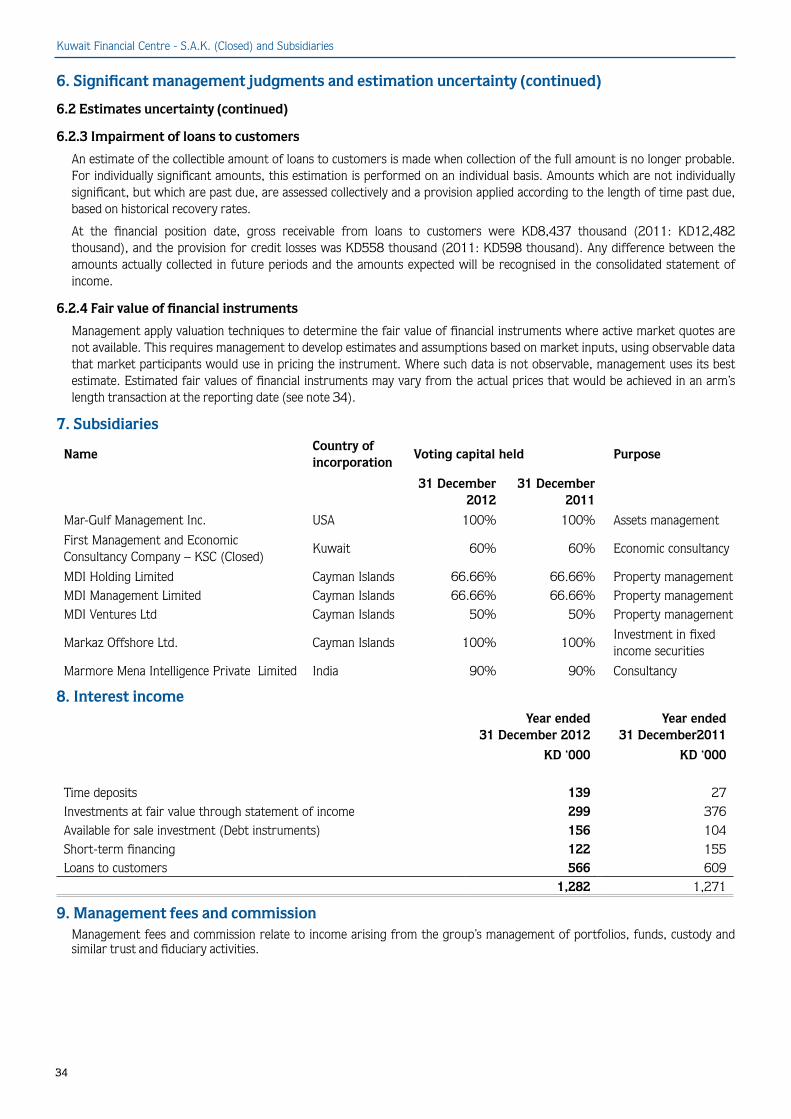
Kuwait Financial Centre - S.A.K. (Closed) and Subsidiaries
34
6. Significant management judgments and estimation uncertainty (continued)
6.2 Estimates uncertainty (continued)
6.2.3 Impairment of loans to customers
An estimate of the collectible amount of loans to customers is made when collection of the full amount is no longer probable. For individually significant amounts, this estimation is performed on an individual basis. Amounts which are not individually significant, but which are past due, are assessed collectively and a provision applied according to the length of time past due, based on historical recovery rates.
At the financial position date, gross receivable from loans to customers were KD8,437 thousand (2011: KD12,482 thousand), and the provision for credit losses was KD558 thousand (2011: KD598 thousand). Any difference between the amounts actually collected in future periods and the amounts expected will be recognised in the consolidated statement of income.
6.2.4 Fair value of financial instruments
Management apply valuation techniques to determine the fair value of financial instruments where active market quotes are not available. This requires management to develop estimates and assumptions based on market inputs, using observable data that market participants would use in pricing the instrument. Where such data is not observable, management uses its best estimate. Estimated fair values of financial instruments may vary from the actual prices that would be achieved in an arm’s length transaction at the reporting date (see note 34).
7. Subsidiaries
NameCountry of incorporation
Voting capital held Purpose
31 December 2012
31 December2011
Mar-Gulf Management Inc. USA 100% 100% Assets management
First Management and Economic Consultancy Company – KSC (Closed)
Kuwait 60% 60% Economic consultancy
MDI Holding Limited Cayman Islands 66.66% 66.66% Property managementMDI Management Limited Cayman Islands 66.66% 66.66% Property managementMDI Ventures Ltd Cayman Islands 50% 50% Property management
Markaz Offshore Ltd. Cayman Islands 100% 100%Investment in fixed income securities
Marmore Mena Intelligence Private Limited India 90% 90% Consultancy
8. Interest incomeYear ended
31 December 2012Year ended
31 December2011
KD ‘000 KD ‘000
Time deposits 139 27Investments at fair value through statement of income 299 376Available for sale investment (Debt instruments) 156 104Short-term financing 122 155Loans to customers 566 609
1,282 1,271
9. Management fees and commissionManagement fees and commission relate to income arising from the group’s management of portfolios, funds, custody and similar trust and fiduciary activities.
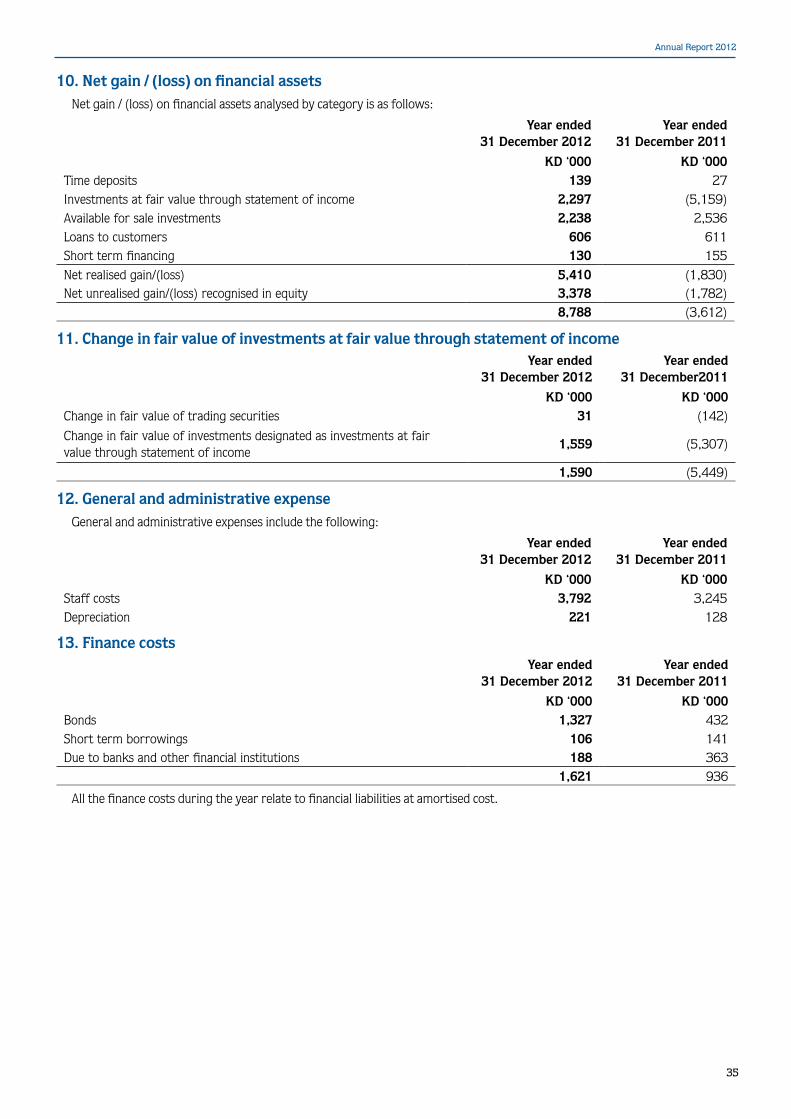
Annual Report 2012
35
10. Net gain / (loss) on financial assetsNet gain / (loss) on financial assets analysed by category is as follows:
Year ended 31 December 2012
Year ended 31 December 2011
KD ‘000 KD ‘000Time deposits 139 27Investments at fair value through statement of income 2,297 (5,159)Available for sale investments 2,238 2,536Loans to customers 606 611Short term financing 130 155
Net realised gain/(loss) 5,410 (1,830)Net unrealised gain/(loss) recognised in equity 3,378 (1,782)
8,788 (3,612)
11. Change in fair value of investments at fair value through statement of incomeYear ended
31 December 2012Year ended
31 December2011
KD ‘000 KD ‘000Change in fair value of trading securities 31 (142)
Change in fair value of investments designated as investments at fair value through statement of income
1,559 (5,307)
1,590 (5,449)
12. General and administrative expenseGeneral and administrative expenses include the following:
Year ended 31 December 2012
Year ended 31 December 2011
KD ‘000 KD ‘000Staff costs 3,792 3,245Depreciation 221 128
13. Finance costsYear ended
31 December 2012Year ended
31 December 2011
KD ‘000 KD ‘000Bonds 1,327 432Short term borrowings 106 141Due to banks and other financial institutions 188 363
1,621 936
All the finance costs during the year relate to financial liabilities at amortised cost.
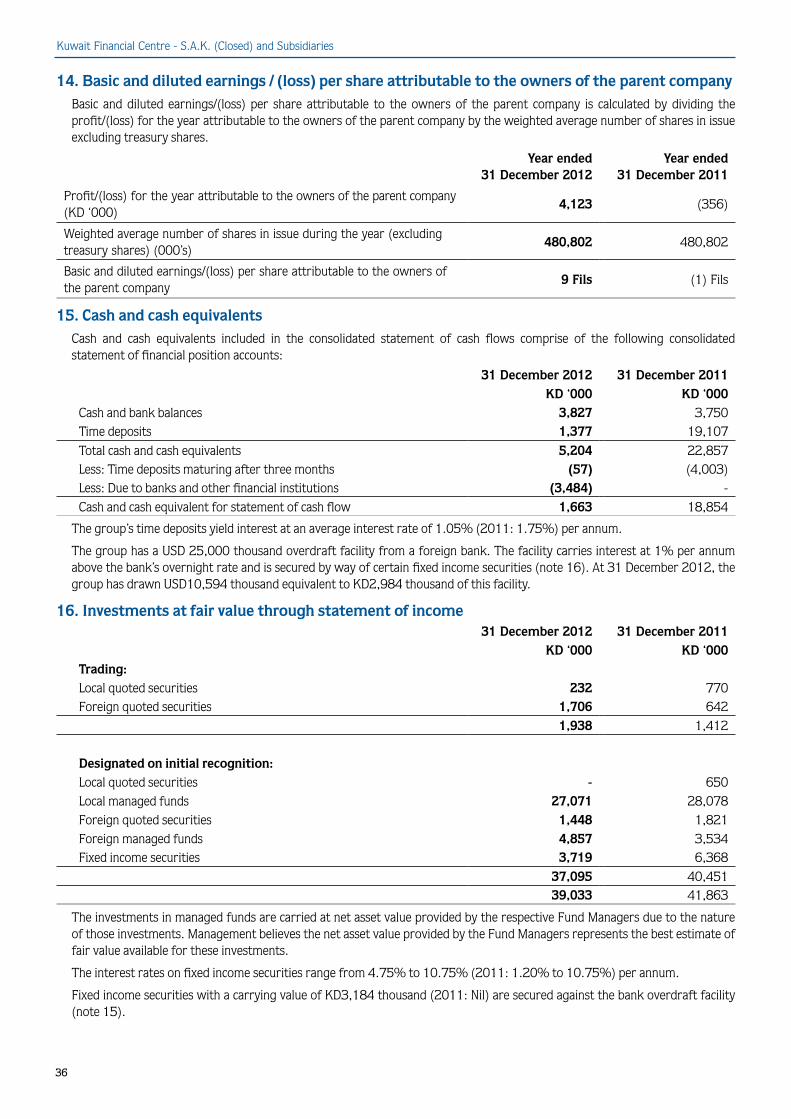
Kuwait Financial Centre - S.A.K. (Closed) and Subsidiaries
36
14. Basic and diluted earnings / (loss) per share attributable to the owners of the parent companyBasic and diluted earnings/(loss) per share attributable to the owners of the parent company is calculated by dividing the profit/(loss) for the year attributable to the owners of the parent company by the weighted average number of shares in issue excluding treasury shares.
Year ended 31 December 2012
Year ended 31 December 2011
Profit/(loss) for the year attributable to the owners of the parent company (KD ‘000)
4,123 (356)
Weighted average number of shares in issue during the year (excluding treasury shares) (000’s)
480,802 480,802
Basic and diluted earnings/(loss) per share attributable to the owners of the parent company
9 Fils (1) Fils
15. Cash and cash equivalentsCash and cash equivalents included in the consolidated statement of cash flows comprise of the following consolidated statement of financial position accounts:
31 December 2012 31 December 2011KD ‘000 KD ‘000
Cash and bank balances 3,827 3,750Time deposits 1,377 19,107
Total cash and cash equivalents 5,204 22,857Less: Time deposits maturing after three months (57) (4,003)Less: Due to banks and other financial institutions (3,484) -Cash and cash equivalent for statement of cash flow 1,663 18,854
The group’s time deposits yield interest at an average interest rate of 1.05% (2011: 1.75%) per annum.
The group has a USD 25,000 thousand overdraft facility from a foreign bank. The facility carries interest at 1% per annum above the bank’s overnight rate and is secured by way of certain fixed income securities (note 16). At 31 December 2012, the group has drawn USD10,594 thousand equivalent to KD2,984 thousand of this facility.
16. Investments at fair value through statement of income31 December 2012 31 December 2011
KD ‘000 KD ‘000Trading:Local quoted securities 232 770Foreign quoted securities 1,706 642
1,938 1,412
Designated on initial recognition:Local quoted securities - 650Local managed funds 27,071 28,078Foreign quoted securities 1,448 1,821Foreign managed funds 4,857 3,534Fixed income securities 3,719 6,368
37,095 40,45139,033 41,863
The investments in managed funds are carried at net asset value provided by the respective Fund Managers due to the nature of those investments. Management believes the net asset value provided by the Fund Managers represents the best estimate of fair value available for these investments.
The interest rates on fixed income securities range from 4.75% to 10.75% (2011: 1.20% to 10.75%) per annum.
Fixed income securities with a carrying value of KD3,184 thousand (2011: Nil) are secured against the bank overdraft facility (note 15).
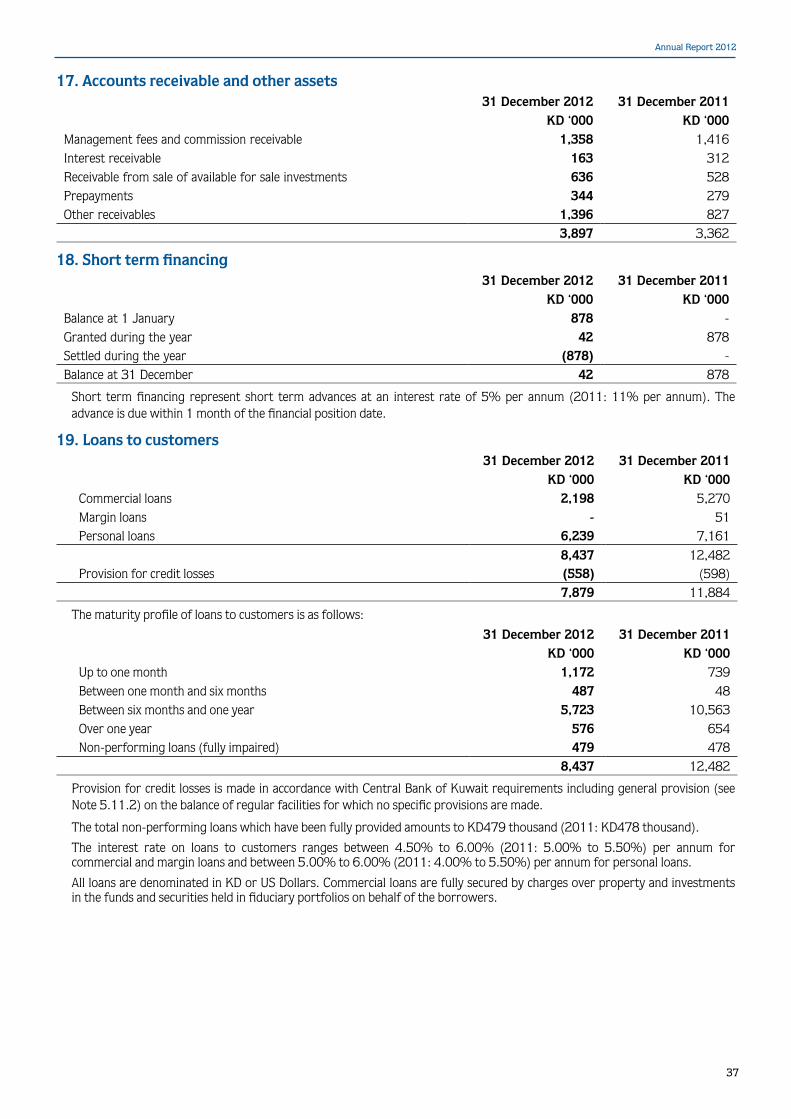
Annual Report 2012
37
17. Accounts receivable and other assets31 December 2012 31 December 2011
KD ‘000 KD ‘000Management fees and commission receivable 1,358 1,416Interest receivable 163 312Receivable from sale of available for sale investments 636 528Prepayments 344 279Other receivables 1,396 827
3,897 3,362
18. Short term financing 31 December 2012 31 December 2011
KD ‘000 KD ‘000Balance at 1 January 878 -Granted during the year 42 878Settled during the year (878) -Balance at 31 December 42 878
Short term financing represent short term advances at an interest rate of 5% per annum (2011: 11% per annum). The advance is due within 1 month of the financial position date.
19. Loans to customers31 December 2012 31 December 2011
KD ‘000 KD ‘000Commercial loans 2,198 5,270Margin loans - 51Personal loans 6,239 7,161
8,437 12,482Provision for credit losses (558) (598)
7,879 11,884
The maturity profile of loans to customers is as follows:
31 December 2012 31 December 2011KD ‘000 KD ‘000
Up to one month 1,172 739Between one month and six months 487 48Between six months and one year 5,723 10,563Over one year 576 654Non-performing loans (fully impaired) 479 478
8,437 12,482
Provision for credit losses is made in accordance with Central Bank of Kuwait requirements including general provision (see Note 5.11.2) on the balance of regular facilities for which no specific provisions are made.
The total non-performing loans which have been fully provided amounts to KD479 thousand (2011: KD478 thousand).
The interest rate on loans to customers ranges between 4.50% to 6.00% (2011: 5.00% to 5.50%) per annum for commercial and margin loans and between 5.00% to 6.00% (2011: 4.00% to 5.50%) per annum for personal loans.
All loans are denominated in KD or US Dollars. Commercial loans are fully secured by charges over property and investments in the funds and securities held in fiduciary portfolios on behalf of the borrowers.
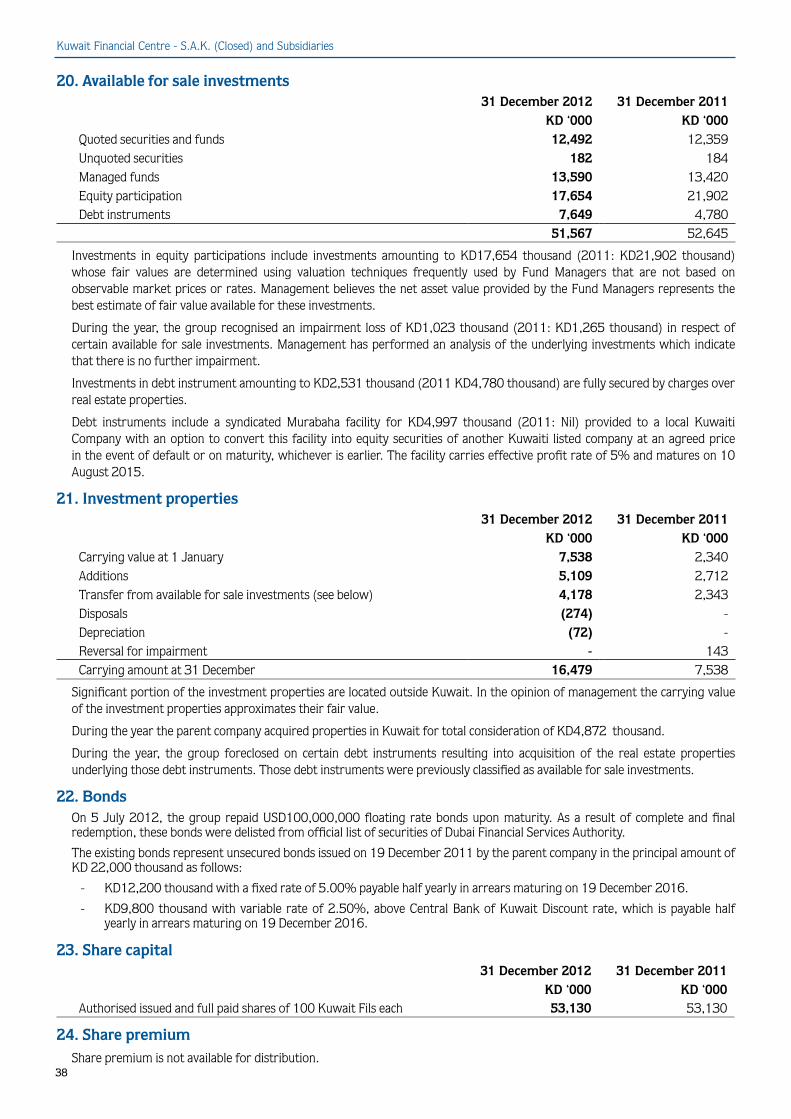
Kuwait Financial Centre - S.A.K. (Closed) and Subsidiaries
38
20. Available for sale investments31 December 2012 31 December 2011
KD ‘000 KD ‘000Quoted securities and funds 12,492 12,359Unquoted securities 182 184Managed funds 13,590 13,420Equity participation 17,654 21,902Debt instruments 7,649 4,780
51,567 52,645
Investments in equity participations include investments amounting to KD17,654 thousand (2011: KD21,902 thousand) whose fair values are determined using valuation techniques frequently used by Fund Managers that are not based on observable market prices or rates. Management believes the net asset value provided by the Fund Managers represents the best estimate of fair value available for these investments.
During the year, the group recognised an impairment loss of KD1,023 thousand (2011: KD1,265 thousand) in respect of certain available for sale investments. Management has performed an analysis of the underlying investments which indicate that there is no further impairment.
Investments in debt instrument amounting to KD2,531 thousand (2011 KD4,780 thousand) are fully secured by charges over real estate properties.
Debt instruments include a syndicated Murabaha facility for KD4,997 thousand (2011: Nil) provided to a local Kuwaiti Company with an option to convert this facility into equity securities of another Kuwaiti listed company at an agreed price in the event of default or on maturity, whichever is earlier. The facility carries effective profit rate of 5% and matures on 10 August 2015.
21. Investment properties31 December 2012 31 December 2011
KD ‘000 KD ‘000Carrying value at 1 January 7,538 2,340Additions 5,109 2,712Transfer from available for sale investments (see below) 4,178 2,343Disposals (274) -Depreciation (72) -Reversal for impairment - 143Carrying amount at 31 December 16,479 7,538
Significant portion of the investment properties are located outside Kuwait. In the opinion of management the carrying value of the investment properties approximates their fair value.
During the year the parent company acquired properties in Kuwait for total consideration of KD4,872 thousand.
During the year, the group foreclosed on certain debt instruments resulting into acquisition of the real estate properties underlying those debt instruments. Those debt instruments were previously classified as available for sale investments.
22. BondsOn 5 July 2012, the group repaid USD100,000,000 floating rate bonds upon maturity. As a result of complete and final redemption, these bonds were delisted from official list of securities of Dubai Financial Services Authority.
The existing bonds represent unsecured bonds issued on 19 December 2011 by the parent company in the principal amount of KD 22,000 thousand as follows:
- KD12,200 thousand with a fixed rate of 5.00% payable half yearly in arrears maturing on 19 December 2016.
- KD9,800 thousand with variable rate of 2.50%, above Central Bank of Kuwait Discount rate, which is payable half yearly in arrears maturing on 19 December 2016.
23. Share capital31 December 2012 31 December 2011
KD ‘000 KD ‘000Authorised issued and full paid shares of 100 Kuwait Fils each 53,130 53,130
24. Share premiumShare premium is not available for distribution.
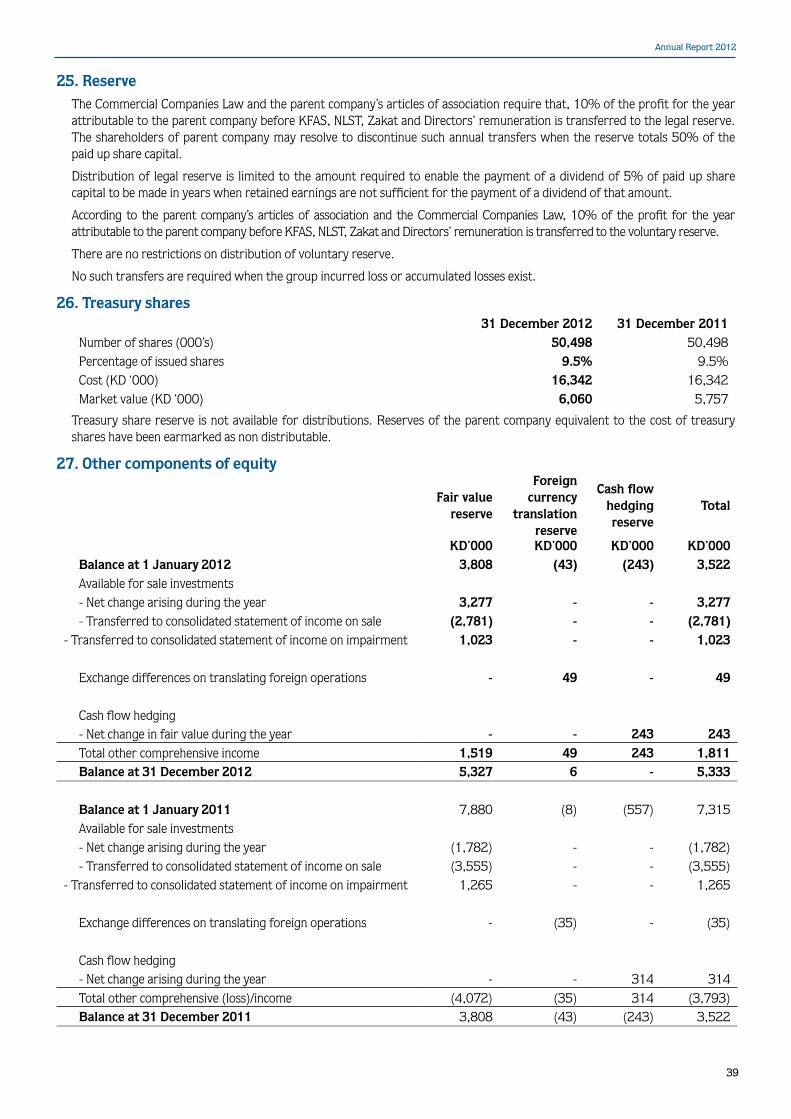
Annual Report 2012
39
25. ReserveThe Commercial Companies Law and the parent company’s articles of association require that, 10% of the profit for the year attributable to the parent company before KFAS, NLST, Zakat and Directors’ remuneration is transferred to the legal reserve. The shareholders of parent company may resolve to discontinue such annual transfers when the reserve totals 50% of the paid up share capital.
Distribution of legal reserve is limited to the amount required to enable the payment of a dividend of 5% of paid up share capital to be made in years when retained earnings are not sufficient for the payment of a dividend of that amount.
According to the parent company’s articles of association and the Commercial Companies Law, 10% of the profit for the year attributable to the parent company before KFAS, NLST, Zakat and Directors’ remuneration is transferred to the voluntary reserve.
There are no restrictions on distribution of voluntary reserve.
No such transfers are required when the group incurred loss or accumulated losses exist.
26. Treasury shares31 December 2012 31 December 2011
Number of shares (000’s) 50,498 50,498Percentage of issued shares 9.5% 9.5%Cost (KD ‘000) 16,342 16,342Market value (KD ‘000) 6,060 5,757
Treasury share reserve is not available for distributions. Reserves of the parent company equivalent to the cost of treasury shares have been earmarked as non distributable.
27. Other components of equity
Fair value reserve
Foreign currency
translation reserve
Cash flow hedging reserve
Total
KD’000 KD’000 KD’000 KD’000Balance at 1 January 2012 3,808 (43) (243) 3,522Available for sale investments - Net change arising during the year 3,277 - - 3,277- Transferred to consolidated statement of income on sale (2,781) - - (2,781)
- Transferred to consolidated statement of income on impairment 1,023 - - 1,023
Exchange differences on translating foreign operations - 49 - 49
Cash flow hedging- Net change in fair value during the year - - 243 243Total other comprehensive income 1,519 49 243 1,811Balance at 31 December 2012 5,327 6 - 5,333
Balance at 1 January 2011 7,880 (8) (557) 7,315Available for sale investments - Net change arising during the year (1,782) - - (1,782)- Transferred to consolidated statement of income on sale (3,555) - - (3,555)
- Transferred to consolidated statement of income on impairment 1,265 - - 1,265
Exchange differences on translating foreign operations - (35) - (35)
Cash flow hedging- Net change arising during the year - - 314 314Total other comprehensive (loss)/income (4,072) (35) 314 (3,793)Balance at 31 December 2011 3,808 (43) (243) 3,522
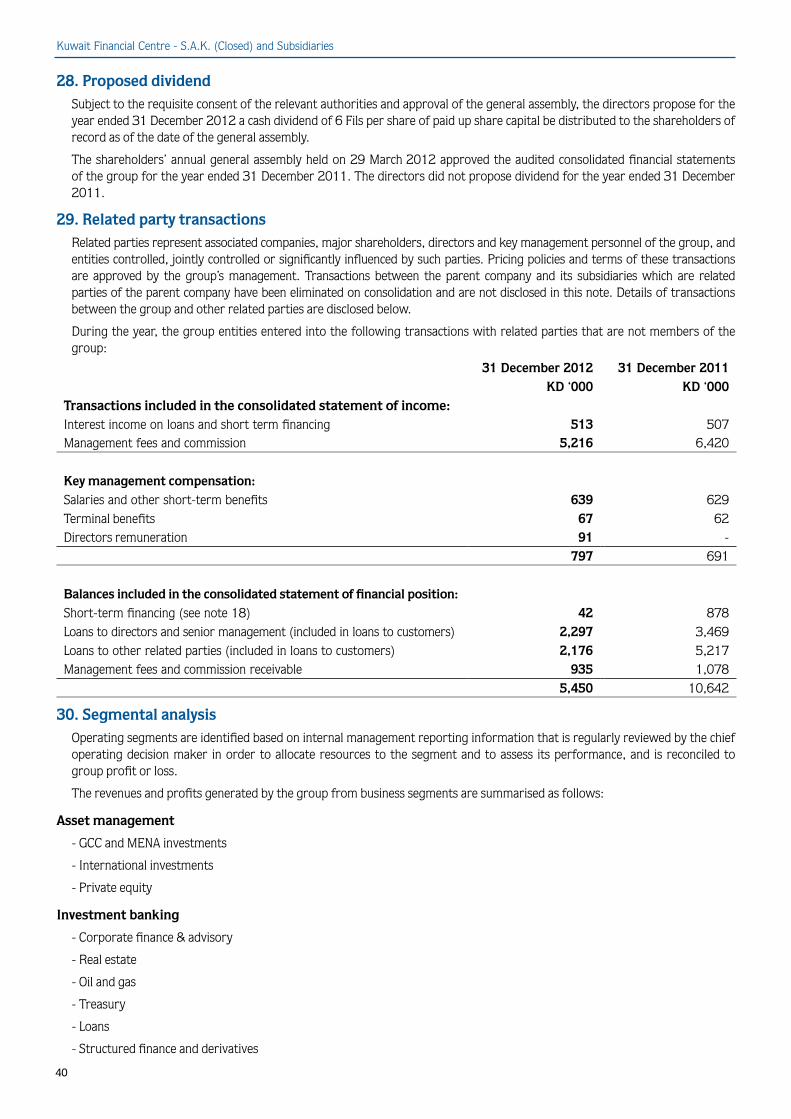
Kuwait Financial Centre - S.A.K. (Closed) and Subsidiaries
40
28. Proposed dividendSubject to the requisite consent of the relevant authorities and approval of the general assembly, the directors propose for the year ended 31 December 2012 a cash dividend of 6 Fils per share of paid up share capital be distributed to the shareholders of record as of the date of the general assembly.
The shareholders’ annual general assembly held on 29 March 2012 approved the audited consolidated financial statements of the group for the year ended 31 December 2011. The directors did not propose dividend for the year ended 31 December 2011.
29. Related party transactionsRelated parties represent associated companies, major shareholders, directors and key management personnel of the group, and entities controlled, jointly controlled or significantly influenced by such parties. Pricing policies and terms of these transactions are approved by the group’s management. Transactions between the parent company and its subsidiaries which are related parties of the parent company have been eliminated on consolidation and are not disclosed in this note. Details of transactions between the group and other related parties are disclosed below.
During the year, the group entities entered into the following transactions with related parties that are not members of the group:
31 December 2012 31 December 2011KD ‘000 KD ‘000
Transactions included in the consolidated statement of income:Interest income on loans and short term financing 513 507Management fees and commission 5,216 6,420
Key management compensation:Salaries and other short-term benefits 639 629Terminal benefits 67 62Directors remuneration 91 -
797 691
Balances included in the consolidated statement of financial position:Short-term financing (see note 18) 42 878Loans to directors and senior management (included in loans to customers) 2,297 3,469Loans to other related parties (included in loans to customers) 2,176 5,217Management fees and commission receivable 935 1,078
5,450 10,642
30. Segmental analysis Operating segments are identified based on internal management reporting information that is regularly reviewed by the chief operating decision maker in order to allocate resources to the segment and to assess its performance, and is reconciled to group profit or loss.
The revenues and profits generated by the group from business segments are summarised as follows:
Asset management
- GCC and MENA investments
- International investments
- Private equity
Investment banking
- Corporate finance & advisory
- Real estate
- Oil and gas
- Treasury
- Loans
- Structured finance and derivatives
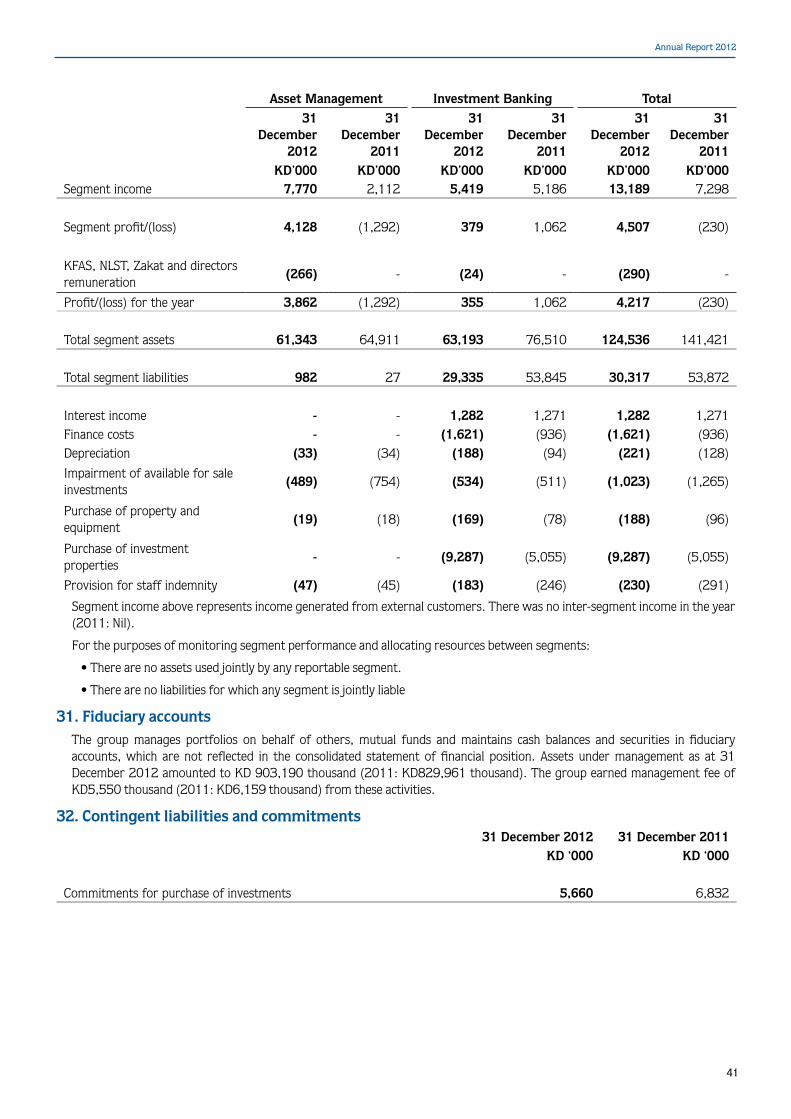
Annual Report 2012
41
Asset Management Investment Banking Total
31 December
2012
31 December
2011
31 December
2012
31 December
2011
31 December
2012
31 December
2011KD’000 KD’000 KD’000 KD’000 KD’000 KD’000
Segment income 7,770 2,112 5,419 5,186 13,189 7,298
Segment profit/(loss) 4,128 (1,292) 379 1,062 4,507 (230)
KFAS, NLST, Zakat and directors remuneration
(266) - (24) - (290) -
Profit/(loss) for the year 3,862 (1,292) 355 1,062 4,217 (230)
Total segment assets 61,343 64,911 63,193 76,510 124,536 141,421
Total segment liabilities 982 27 29,335 53,845 30,317 53,872
Interest income - - 1,282 1,271 1,282 1,271Finance costs - - (1,621) (936) (1,621) (936)Depreciation (33) (34) (188) (94) (221) (128)
Impairment of available for sale investments
(489) (754) (534) (511) (1,023) (1,265)
Purchase of property and equipment
(19) (18) (169) (78) (188) (96)
Purchase of investment properties
- - (9,287) (5,055) (9,287) (5,055)
Provision for staff indemnity (47) (45) (183) (246) (230) (291)
Segment income above represents income generated from external customers. There was no inter-segment income in the year (2011: Nil).
For the purposes of monitoring segment performance and allocating resources between segments:
• There are no assets used jointly by any reportable segment.
• There are no liabilities for which any segment is jointly liable
31. Fiduciary accountsThe group manages portfolios on behalf of others, mutual funds and maintains cash balances and securities in fiduciary accounts, which are not reflected in the consolidated statement of financial position. Assets under management as at 31 December 2012 amounted to KD 903,190 thousand (2011: KD829,961 thousand). The group earned management fee of KD5,550 thousand (2011: KD6,159 thousand) from these activities.
32. Contingent liabilities and commitments31 December 2012 31 December 2011
KD ‘000 KD ‘000
Commitments for purchase of investments 5,660 6,832
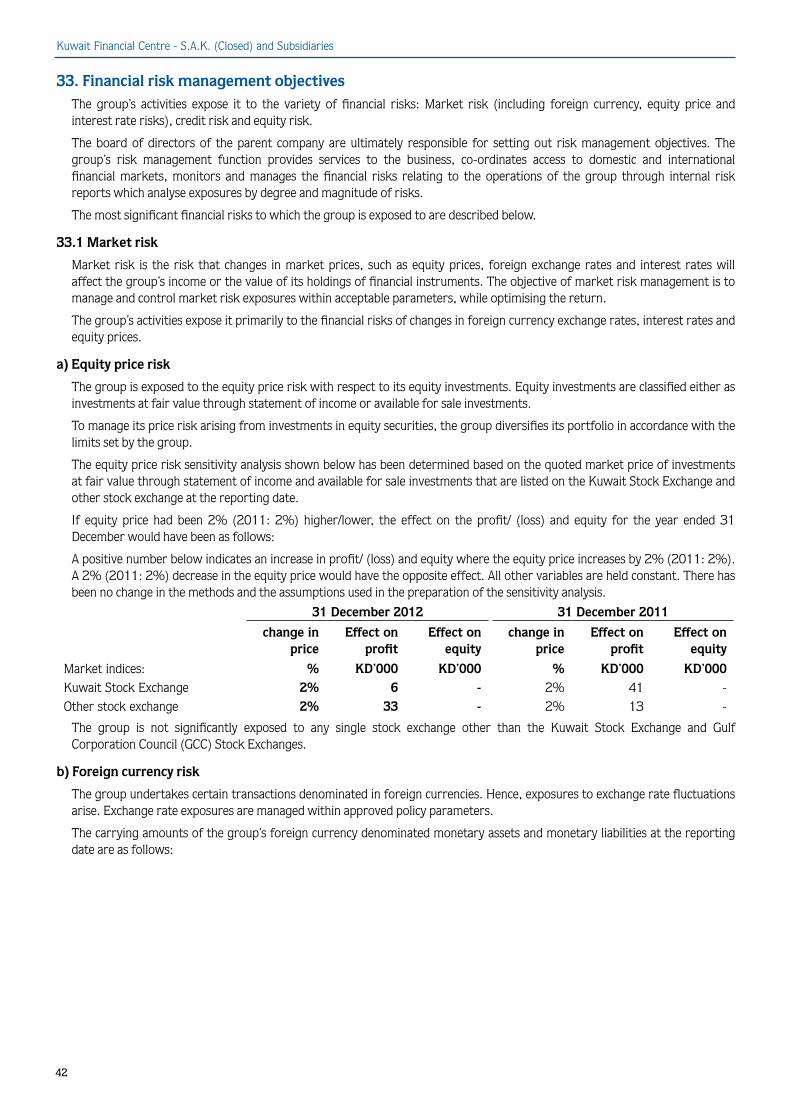
Kuwait Financial Centre - S.A.K. (Closed) and Subsidiaries
42
33. Financial risk management objectivesThe group’s activities expose it to the variety of financial risks: Market risk (including foreign currency, equity price and interest rate risks), credit risk and equity risk.
The board of directors of the parent company are ultimately responsible for setting out risk management objectives. The group’s risk management function provides services to the business, co-ordinates access to domestic and international financial markets, monitors and manages the financial risks relating to the operations of the group through internal risk reports which analyse exposures by degree and magnitude of risks.
The most significant financial risks to which the group is exposed to are described below.
33.1 Market risk
Market risk is the risk that changes in market prices, such as equity prices, foreign exchange rates and interest rates will affect the group’s income or the value of its holdings of financial instruments. The objective of market risk management is to manage and control market risk exposures within acceptable parameters, while optimising the return.
The group’s activities expose it primarily to the financial risks of changes in foreign currency exchange rates, interest rates and equity prices.
a) Equity price risk
The group is exposed to the equity price risk with respect to its equity investments. Equity investments are classified either as investments at fair value through statement of income or available for sale investments.
To manage its price risk arising from investments in equity securities, the group diversifies its portfolio in accordance with the limits set by the group.
The equity price risk sensitivity analysis shown below has been determined based on the quoted market price of investments at fair value through statement of income and available for sale investments that are listed on the Kuwait Stock Exchange and other stock exchange at the reporting date.
If equity price had been 2% (2011: 2%) higher/lower, the effect on the profit/ (loss) and equity for the year ended 31 December would have been as follows:
A positive number below indicates an increase in profit/ (loss) and equity where the equity price increases by 2% (2011: 2%). A 2% (2011: 2%) decrease in the equity price would have the opposite effect. All other variables are held constant. There has been no change in the methods and the assumptions used in the preparation of the sensitivity analysis.
31 December 2012 31 December 2011
change in price
Effect on profit
Effect on equity
change in price
Effect on profit
Effect on equity
Market indices: % KD’000 KD’000 % KD’000 KD’000Kuwait Stock Exchange 2% 6 - 2% 41 -Other stock exchange 2% 33 - 2% 13 -
The group is not significantly exposed to any single stock exchange other than the Kuwait Stock Exchange and Gulf Corporation Council (GCC) Stock Exchanges.
b) Foreign currency risk
The group undertakes certain transactions denominated in foreign currencies. Hence, exposures to exchange rate fluctuations arise. Exchange rate exposures are managed within approved policy parameters.
The carrying amounts of the group’s foreign currency denominated monetary assets and monetary liabilities at the reporting date are as follows:
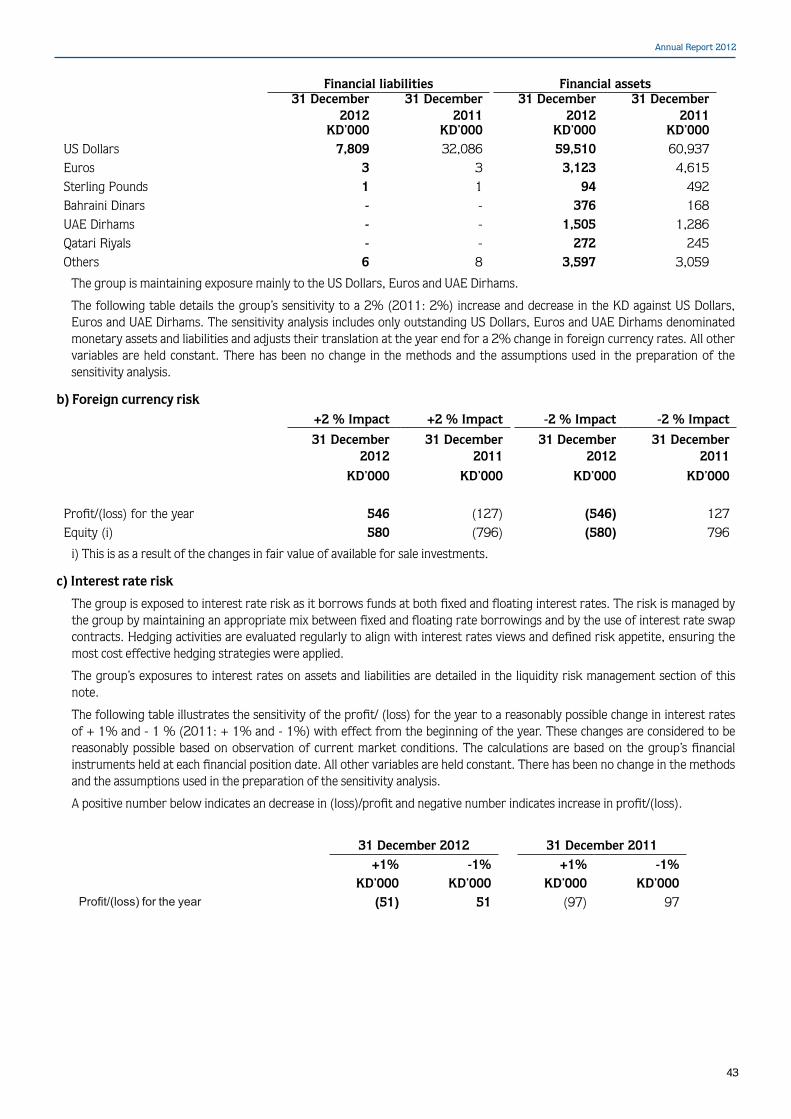
Annual Report 2012
43
Financial liabilities Financial assets31 December
201231 December
201131 December
201231 December
2011KD’000 KD’000 KD’000 KD’000
US Dollars 7,809 32,086 59,510 60,937Euros 3 3 3,123 4,615Sterling Pounds 1 1 94 492Bahraini Dinars - - 376 168UAE Dirhams - - 1,505 1,286Qatari Riyals - - 272 245Others 6 8 3,597 3,059
The group is maintaining exposure mainly to the US Dollars, Euros and UAE Dirhams.
The following table details the group’s sensitivity to a 2% (2011: 2%) increase and decrease in the KD against US Dollars, Euros and UAE Dirhams. The sensitivity analysis includes only outstanding US Dollars, Euros and UAE Dirhams denominated monetary assets and liabilities and adjusts their translation at the year end for a 2% change in foreign currency rates. All other variables are held constant. There has been no change in the methods and the assumptions used in the preparation of the sensitivity analysis.
b) Foreign currency risk+2 % Impact +2 % Impact -2 % Impact -2 % Impact
31 December 2012
31 December 2011
31 December 2012
31 December 2011
KD’000 KD’000 KD’000 KD’000
Profit/(loss) for the year 546 (127) (546) 127Equity (i) 580 (796) (580) 796
i) This is as a result of the changes in fair value of available for sale investments.
c) Interest rate risk
The group is exposed to interest rate risk as it borrows funds at both fixed and floating interest rates. The risk is managed by the group by maintaining an appropriate mix between fixed and floating rate borrowings and by the use of interest rate swap contracts. Hedging activities are evaluated regularly to align with interest rates views and defined risk appetite, ensuring the most cost effective hedging strategies were applied.
The group’s exposures to interest rates on assets and liabilities are detailed in the liquidity risk management section of this note.
The following table illustrates the sensitivity of the profit/ (loss) for the year to a reasonably possible change in interest rates of + 1% and - 1 % (2011: + 1% and - 1%) with effect from the beginning of the year. These changes are considered to be reasonably possible based on observation of current market conditions. The calculations are based on the group’s financial instruments held at each financial position date. All other variables are held constant. There has been no change in the methods and the assumptions used in the preparation of the sensitivity analysis.
A positive number below indicates an decrease in (loss)/profit and negative number indicates increase in profit/(loss).
31 December 2012 31 December 2011+1% -1% +1% -1%
KD’000 KD’000 KD’000 KD’000Profit/(loss) for the year (51) 51 (97) 97
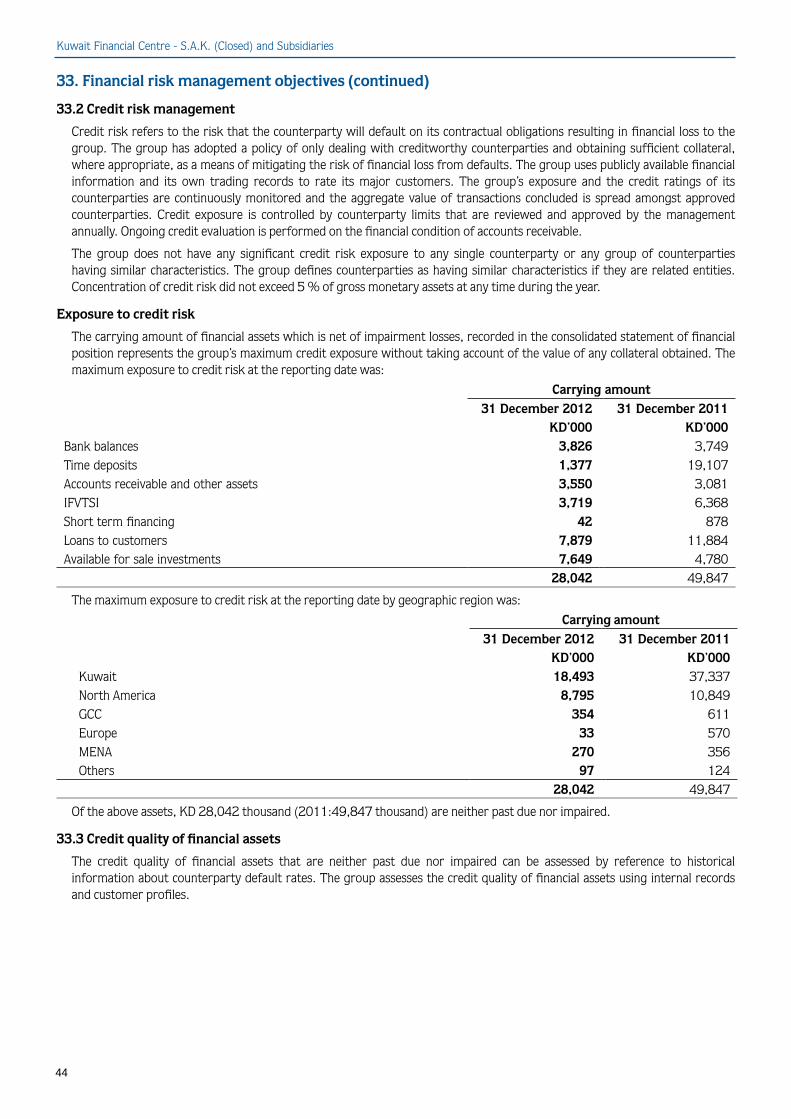
Kuwait Financial Centre - S.A.K. (Closed) and Subsidiaries
44
33. Financial risk management objectives (continued)
33.2 Credit risk management
Credit risk refers to the risk that the counterparty will default on its contractual obligations resulting in financial loss to the group. The group has adopted a policy of only dealing with creditworthy counterparties and obtaining sufficient collateral, where appropriate, as a means of mitigating the risk of financial loss from defaults. The group uses publicly available financial information and its own trading records to rate its major customers. The group’s exposure and the credit ratings of its counterparties are continuously monitored and the aggregate value of transactions concluded is spread amongst approved counterparties. Credit exposure is controlled by counterparty limits that are reviewed and approved by the management annually. Ongoing credit evaluation is performed on the financial condition of accounts receivable.
The group does not have any significant credit risk exposure to any single counterparty or any group of counterparties having similar characteristics. The group defines counterparties as having similar characteristics if they are related entities. Concentration of credit risk did not exceed 5 % of gross monetary assets at any time during the year.
Exposure to credit risk
The carrying amount of financial assets which is net of impairment losses, recorded in the consolidated statement of financial position represents the group’s maximum credit exposure without taking account of the value of any collateral obtained. The maximum exposure to credit risk at the reporting date was:
Carrying amount31 December 2012 31 December 2011
KD’000 KD’000Bank balances 3,826 3,749Time deposits 1,377 19,107Accounts receivable and other assets 3,550 3,081IFVTSI 3,719 6,368Short term financing 42 878Loans to customers 7,879 11,884Available for sale investments 7,649 4,780
28,042 49,847
The maximum exposure to credit risk at the reporting date by geographic region was:
Carrying amount31 December 2012 31 December 2011
KD’000 KD’000Kuwait 18,493 37,337North America 8,795 10,849GCC 354 611Europe 33 570MENA 270 356Others 97 124
28,042 49,847
Of the above assets, KD 28,042 thousand (2011:49,847 thousand) are neither past due nor impaired.
33.3 Credit quality of financial assets
The credit quality of financial assets that are neither past due nor impaired can be assessed by reference to historical information about counterparty default rates. The group assesses the credit quality of financial assets using internal records and customer profiles.
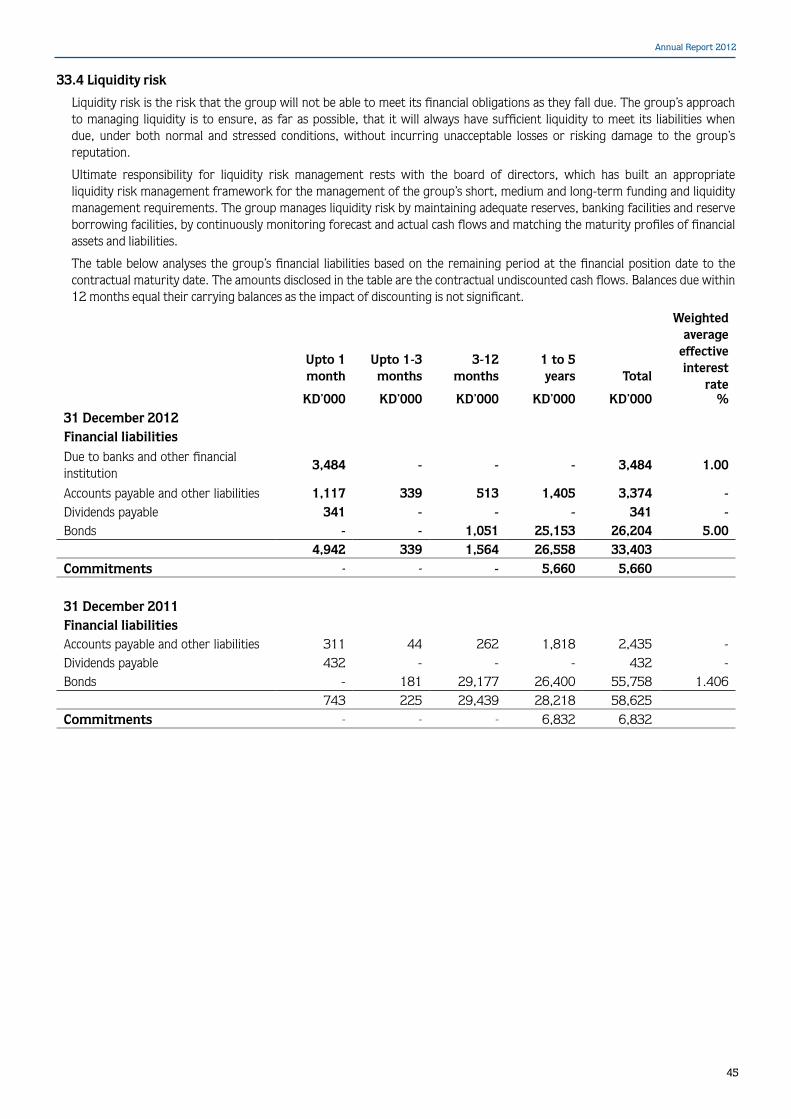
Annual Report 2012
45
33.4 Liquidity risk
Liquidity risk is the risk that the group will not be able to meet its financial obligations as they fall due. The group’s approach to managing liquidity is to ensure, as far as possible, that it will always have sufficient liquidity to meet its liabilities when due, under both normal and stressed conditions, without incurring unacceptable losses or risking damage to the group’s reputation.
Ultimate responsibility for liquidity risk management rests with the board of directors, which has built an appropriate liquidity risk management framework for the management of the group’s short, medium and long-term funding and liquidity management requirements. The group manages liquidity risk by maintaining adequate reserves, banking facilities and reserve borrowing facilities, by continuously monitoring forecast and actual cash flows and matching the maturity profiles of financial assets and liabilities.
The table below analyses the group’s financial liabilities based on the remaining period at the financial position date to the contractual maturity date. The amounts disclosed in the table are the contractual undiscounted cash flows. Balances due within 12 months equal their carrying balances as the impact of discounting is not significant.
Upto 1 month
Upto 1-3 months
3-12 months
1 to 5 years Total
Weighted average
effective interest
rateKD’000 KD’000 KD’000 KD’000 KD’000 %
31 December 2012Financial liabilitiesDue to banks and other financial institution
3,484 - - - 3,484 1.00
Accounts payable and other liabilities 1,117 339 513 1,405 3,374 -Dividends payable 341 - - - 341 -Bonds - - 1,051 25,153 26,204 5.00
4,942 339 1,564 26,558 33,403Commitments - - - 5,660 5,660
31 December 2011Financial liabilitiesAccounts payable and other liabilities 311 44 262 1,818 2,435 -Dividends payable 432 - - - 432 -Bonds - 181 29,177 26,400 55,758 1.406
743 225 29,439 28,218 58,625
Commitments - - - 6,832 6,832
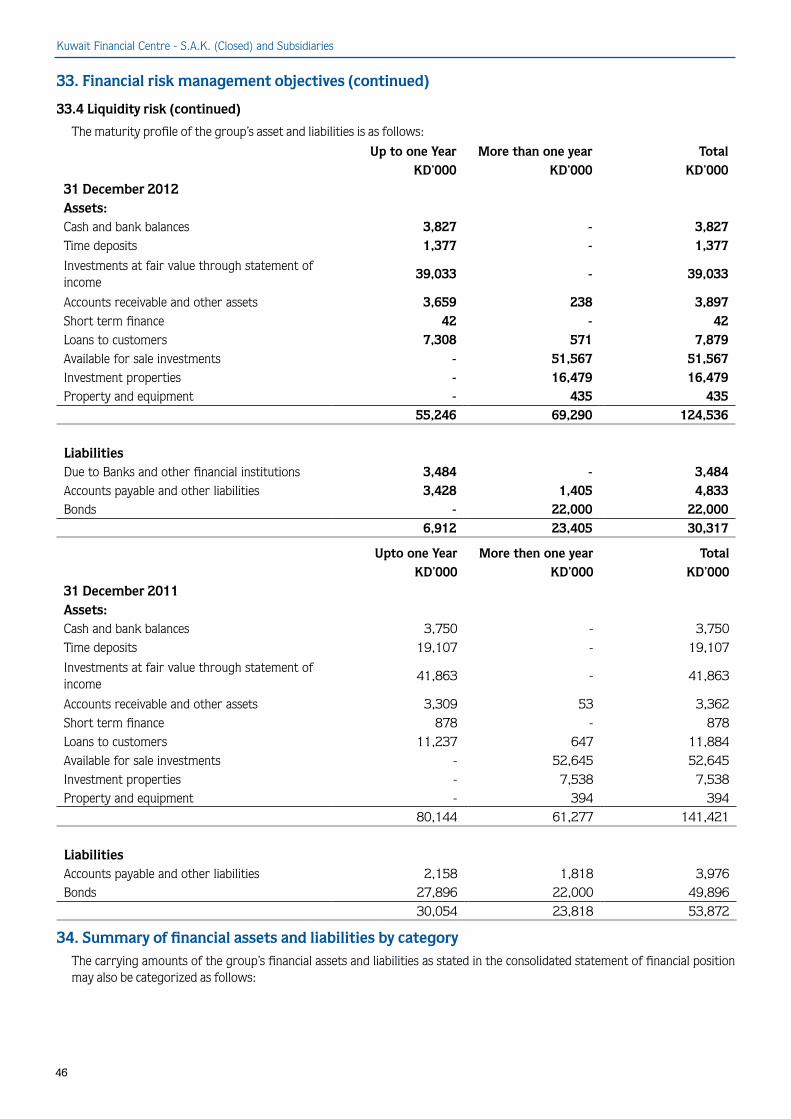
Kuwait Financial Centre - S.A.K. (Closed) and Subsidiaries
46
33. Financial risk management objectives (continued)
33.4 Liquidity risk (continued)
The maturity profile of the group’s asset and liabilities is as follows:
Up to one Year More than one year TotalKD’000 KD’000 KD’000
31 December 2012Assets:Cash and bank balances 3,827 - 3,827Time deposits 1,377 - 1,377
Investments at fair value through statement of income
39,033 - 39,033
Accounts receivable and other assets 3,659 238 3,897Short term finance 42 - 42Loans to customers 7,308 571 7,879Available for sale investments - 51,567 51,567Investment properties - 16,479 16,479Property and equipment - 435 435
55,246 69,290 124,536
LiabilitiesDue to Banks and other financial institutions 3,484 - 3,484Accounts payable and other liabilities 3,428 1,405 4,833Bonds - 22,000 22,000
6,912 23,405 30,317
Upto one Year More then one year TotalKD’000 KD’000 KD’000
31 December 2011Assets:Cash and bank balances 3,750 - 3,750Time deposits 19,107 - 19,107
Investments at fair value through statement of income
41,863 - 41,863
Accounts receivable and other assets 3,309 53 3,362Short term finance 878 - 878Loans to customers 11,237 647 11,884Available for sale investments - 52,645 52,645Investment properties - 7,538 7,538Property and equipment - 394 394
80,144 61,277 141,421
LiabilitiesAccounts payable and other liabilities 2,158 1,818 3,976Bonds 27,896 22,000 49,896
30,054 23,818 53,872
34. Summary of financial assets and liabilities by categoryThe carrying amounts of the group’s financial assets and liabilities as stated in the consolidated statement of financial position may also be categorized as follows:
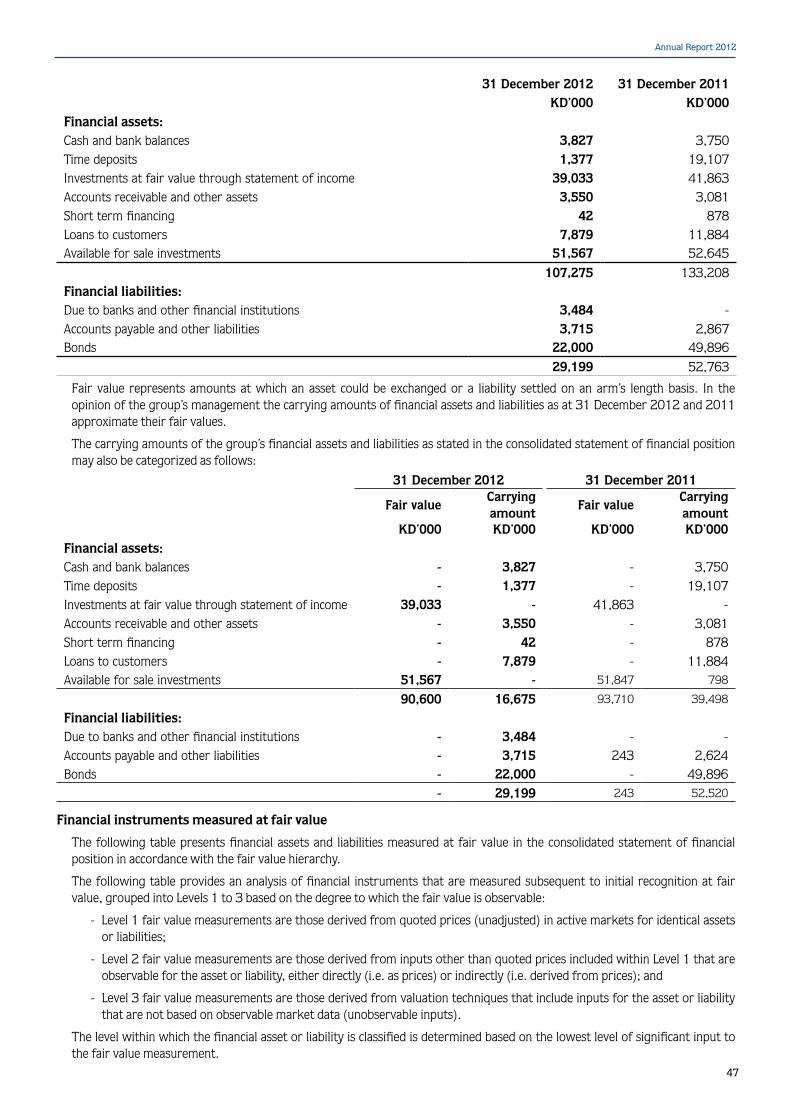
Annual Report 2012
47
31 December 2012 31 December 2011KD’000 KD’000
Financial assets:Cash and bank balances 3,827 3,750Time deposits 1,377 19,107Investments at fair value through statement of income 39,033 41,863Accounts receivable and other assets 3,550 3,081Short term financing 42 878Loans to customers 7,879 11,884Available for sale investments 51,567 52,645
107,275 133,208Financial liabilities:Due to banks and other financial institutions 3,484 -Accounts payable and other liabilities 3,715 2,867Bonds 22,000 49,896
29,199 52,763
Fair value represents amounts at which an asset could be exchanged or a liability settled on an arm’s length basis. In the opinion of the group’s management the carrying amounts of financial assets and liabilities as at 31 December 2012 and 2011 approximate their fair values.
The carrying amounts of the group’s financial assets and liabilities as stated in the consolidated statement of financial position may also be categorized as follows:
31 December 2012 31 December 2011
Fair valueCarrying amount
Fair valueCarrying amount
KD’000 KD’000 KD’000 KD’000Financial assets:Cash and bank balances - 3,827 - 3,750Time deposits - 1,377 - 19,107Investments at fair value through statement of income 39,033 - 41,863 -Accounts receivable and other assets - 3,550 - 3,081Short term financing - 42 - 878Loans to customers - 7,879 - 11,884Available for sale investments 51,567 - 51,847 798
90,600 16,675 93,710 39,498
Financial liabilities:Due to banks and other financial institutions - 3,484 - -Accounts payable and other liabilities - 3,715 243 2,624Bonds - 22,000 - 49,896
- 29,199 243 52,520
Financial instruments measured at fair value
The following table presents financial assets and liabilities measured at fair value in the consolidated statement of financial position in accordance with the fair value hierarchy.
The following table provides an analysis of financial instruments that are measured subsequent to initial recognition at fair value, grouped into Levels 1 to 3 based on the degree to which the fair value is observable:
- Level 1 fair value measurements are those derived from quoted prices (unadjusted) in active markets for identical assets or liabilities;
- Level 2 fair value measurements are those derived from inputs other than quoted prices included within Level 1 that are observable for the asset or liability, either directly (i.e. as prices) or indirectly (i.e. derived from prices); and
- Level 3 fair value measurements are those derived from valuation techniques that include inputs for the asset or liability that are not based on observable market data (unobservable inputs).
The level within which the financial asset or liability is classified is determined based on the lowest level of significant input to the fair value measurement.
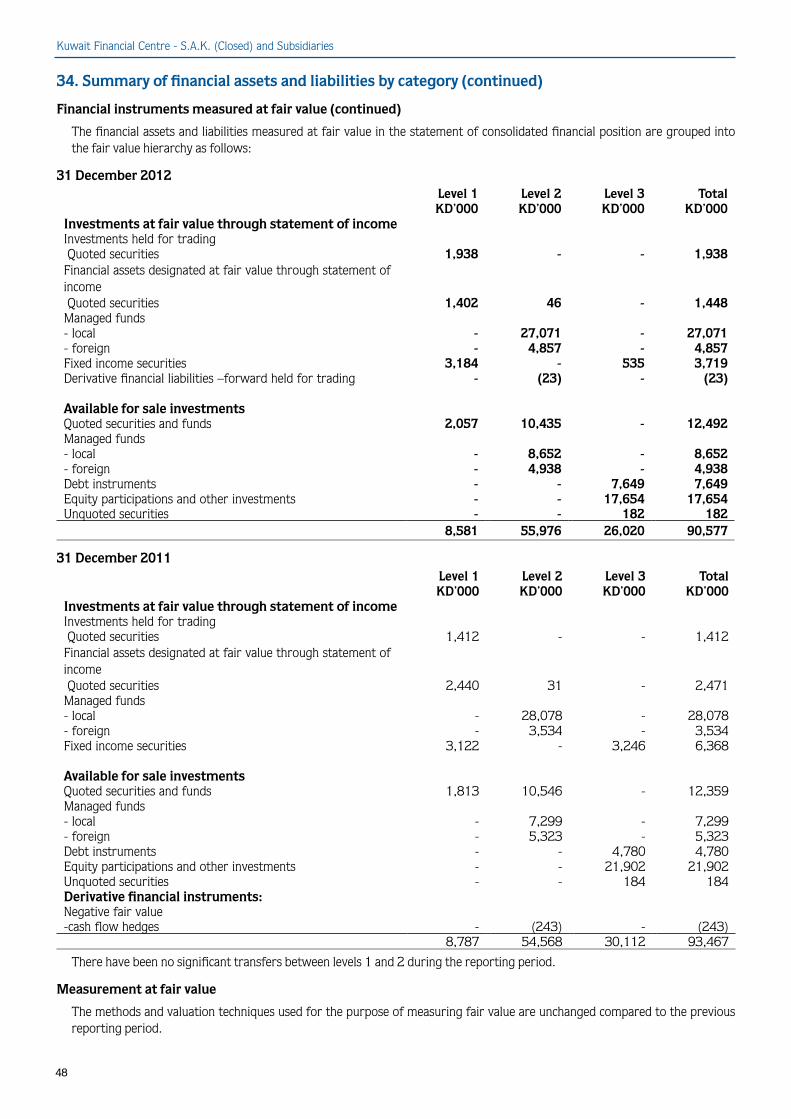
Kuwait Financial Centre - S.A.K. (Closed) and Subsidiaries
48
34. Summary of financial assets and liabilities by category (continued)
Financial instruments measured at fair value (continued)
The financial assets and liabilities measured at fair value in the statement of consolidated financial position are grouped into the fair value hierarchy as follows:
31 December 2012Level 1 Level 2 Level 3 TotalKD’000 KD’000 KD’000 KD’000
Investments at fair value through statement of incomeInvestments held for trading Quoted securities 1,938 - - 1,938Financial assets designated at fair value through statement of income Quoted securities 1,402 46 - 1,448Managed funds- local - 27,071 - 27,071- foreign - 4,857 - 4,857Fixed income securities 3,184 - 535 3,719Derivative financial liabilities –forward held for trading - (23) - (23)
Available for sale investmentsQuoted securities and funds 2,057 10,435 - 12,492Managed funds- local - 8,652 - 8,652- foreign - 4,938 - 4,938Debt instruments - - 7,649 7,649Equity participations and other investments - - 17,654 17,654Unquoted securities - - 182 182
8,581 55,976 26,020 90,577
31 December 2011Level 1 Level 2 Level 3 TotalKD’000 KD’000 KD’000 KD’000
Investments at fair value through statement of incomeInvestments held for trading Quoted securities 1,412 - - 1,412Financial assets designated at fair value through statement of income Quoted securities 2,440 31 - 2,471Managed funds- local - 28,078 - 28,078- foreign - 3,534 - 3,534Fixed income securities 3,122 - 3,246 6,368
Available for sale investmentsQuoted securities and funds 1,813 10,546 - 12,359Managed funds- local - 7,299 - 7,299- foreign - 5,323 - 5,323Debt instruments - - 4,780 4,780Equity participations and other investments - - 21,902 21,902Unquoted securities - - 184 184Derivative financial instruments:Negative fair value-cash flow hedges - (243) - (243)
8,787 54,568 30,112 93,467
There have been no significant transfers between levels 1 and 2 during the reporting period.
Measurement at fair value
The methods and valuation techniques used for the purpose of measuring fair value are unchanged compared to the previous reporting period.
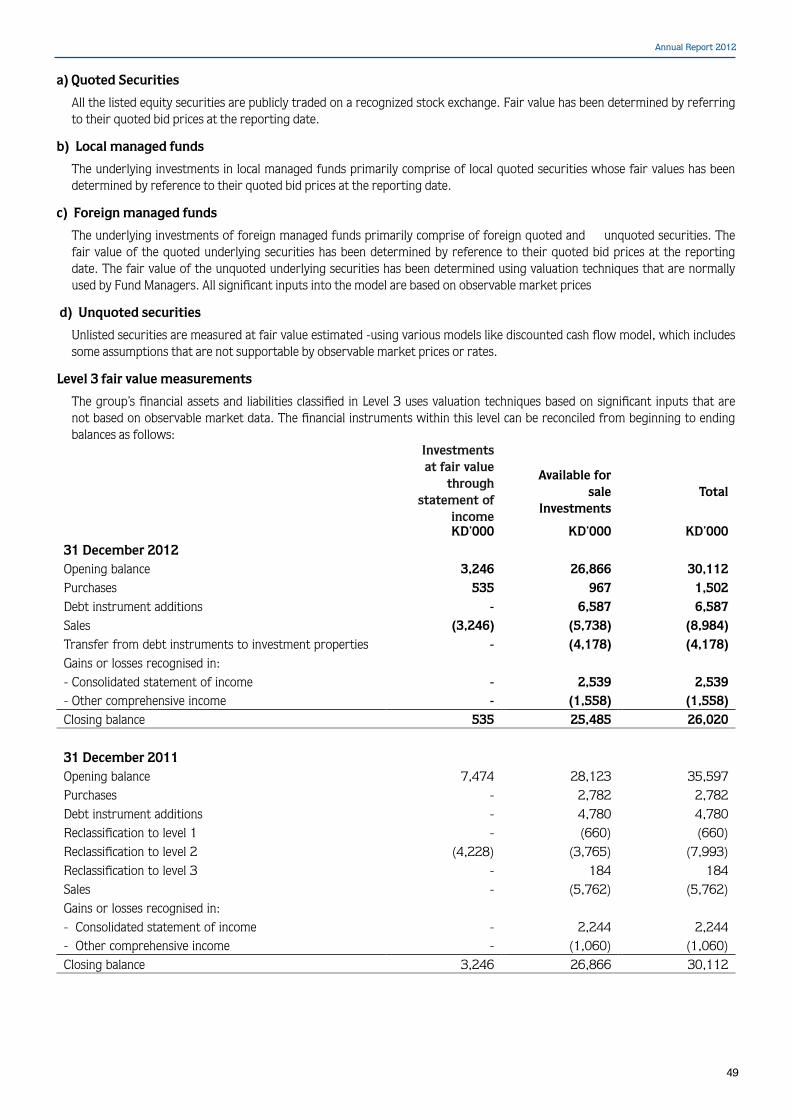
Annual Report 2012
49
a) Quoted Securities
All the listed equity securities are publicly traded on a recognized stock exchange. Fair value has been determined by referring to their quoted bid prices at the reporting date.
b) Local managed funds
The underlying investments in local managed funds primarily comprise of local quoted securities whose fair values has been determined by reference to their quoted bid prices at the reporting date.
c) Foreign managed funds
The underlying investments of foreign managed funds primarily comprise of foreign quoted and unquoted securities. The fair value of the quoted underlying securities has been determined by reference to their quoted bid prices at the reporting date. The fair value of the unquoted underlying securities has been determined using valuation techniques that are normally used by Fund Managers. All significant inputs into the model are based on observable market prices
d) Unquoted securities
Unlisted securities are measured at fair value estimated -using various models like discounted cash flow model, which includes some assumptions that are not supportable by observable market prices or rates.
Level 3 fair value measurements
The group’s financial assets and liabilities classified in Level 3 uses valuation techniques based on significant inputs that are not based on observable market data. The financial instruments within this level can be reconciled from beginning to ending balances as follows:
Investments at fair value
through statement of
income
Available for sale
InvestmentsTotal
KD’000 KD’000 KD’00031 December 2012Opening balance 3,246 26,866 30,112Purchases 535 967 1,502Debt instrument additions - 6,587 6,587Sales (3,246) (5,738) (8,984)Transfer from debt instruments to investment properties - (4,178) (4,178)Gains or losses recognised in:- Consolidated statement of income - 2,539 2,539- Other comprehensive income - (1,558) (1,558)Closing balance 535 25,485 26,020
31 December 2011Opening balance 7,474 28,123 35,597Purchases - 2,782 2,782Debt instrument additions - 4,780 4,780Reclassification to level 1 - (660) (660)Reclassification to level 2 (4,228) (3,765) (7,993)Reclassification to level 3 - 184 184Sales - (5,762) (5,762)Gains or losses recognised in:- Consolidated statement of income - 2,244 2,244- Other comprehensive income - (1,060) (1,060)Closing balance 3,246 26,866 30,112
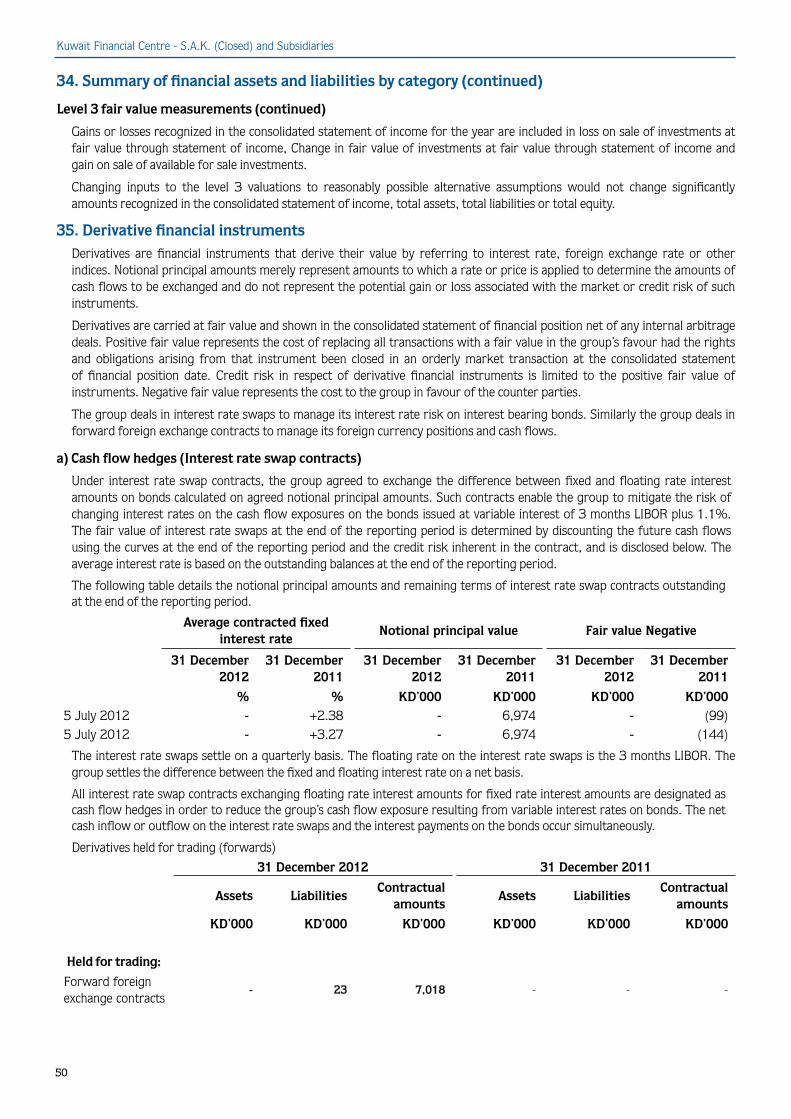
Kuwait Financial Centre - S.A.K. (Closed) and Subsidiaries
50
34. Summary of financial assets and liabilities by category (continued)
Level 3 fair value measurements (continued)
Gains or losses recognized in the consolidated statement of income for the year are included in loss on sale of investments at fair value through statement of income, Change in fair value of investments at fair value through statement of income and gain on sale of available for sale investments.
Changing inputs to the level 3 valuations to reasonably possible alternative assumptions would not change significantly amounts recognized in the consolidated statement of income, total assets, total liabilities or total equity.
35. Derivative financial instruments Derivatives are financial instruments that derive their value by referring to interest rate, foreign exchange rate or other indices. Notional principal amounts merely represent amounts to which a rate or price is applied to determine the amounts of cash flows to be exchanged and do not represent the potential gain or loss associated with the market or credit risk of such instruments.
Derivatives are carried at fair value and shown in the consolidated statement of financial position net of any internal arbitrage deals. Positive fair value represents the cost of replacing all transactions with a fair value in the group’s favour had the rights and obligations arising from that instrument been closed in an orderly market transaction at the consolidated statement of financial position date. Credit risk in respect of derivative financial instruments is limited to the positive fair value of instruments. Negative fair value represents the cost to the group in favour of the counter parties.
The group deals in interest rate swaps to manage its interest rate risk on interest bearing bonds. Similarly the group deals in forward foreign exchange contracts to manage its foreign currency positions and cash flows.
a) Cash flow hedges (Interest rate swap contracts)
Under interest rate swap contracts, the group agreed to exchange the difference between fixed and floating rate interest amounts on bonds calculated on agreed notional principal amounts. Such contracts enable the group to mitigate the risk of changing interest rates on the cash flow exposures on the bonds issued at variable interest of 3 months LIBOR plus 1.1%. The fair value of interest rate swaps at the end of the reporting period is determined by discounting the future cash flows using the curves at the end of the reporting period and the credit risk inherent in the contract, and is disclosed below. The average interest rate is based on the outstanding balances at the end of the reporting period.
The following table details the notional principal amounts and remaining terms of interest rate swap contracts outstanding at the end of the reporting period.
Average contracted fixed interest rate
Notional principal value Fair value Negative
31 December 2012
31 December 2011
31 December 2012
31 December 2011
31 December 2012
31 December 2011
% % KD’000 KD’000 KD’000 KD’0005 July 2012 - +2.38 - 6,974 - (99)5 July 2012 - +3.27 - 6,974 - (144)
The interest rate swaps settle on a quarterly basis. The floating rate on the interest rate swaps is the 3 months LIBOR. The group settles the difference between the fixed and floating interest rate on a net basis.
All interest rate swap contracts exchanging floating rate interest amounts for fixed rate interest amounts are designated as cash flow hedges in order to reduce the group’s cash flow exposure resulting from variable interest rates on bonds. The net cash inflow or outflow on the interest rate swaps and the interest payments on the bonds occur simultaneously.
Derivatives held for trading (forwards)
31 December 2012 31 December 2011
Assets LiabilitiesContractual
amountsAssets Liabilities
Contractual amounts
KD’000 KD’000 KD’000 KD’000 KD’000 KD’000
Held for trading:
Forward foreign exchange contracts
- 23 7,018 - - -
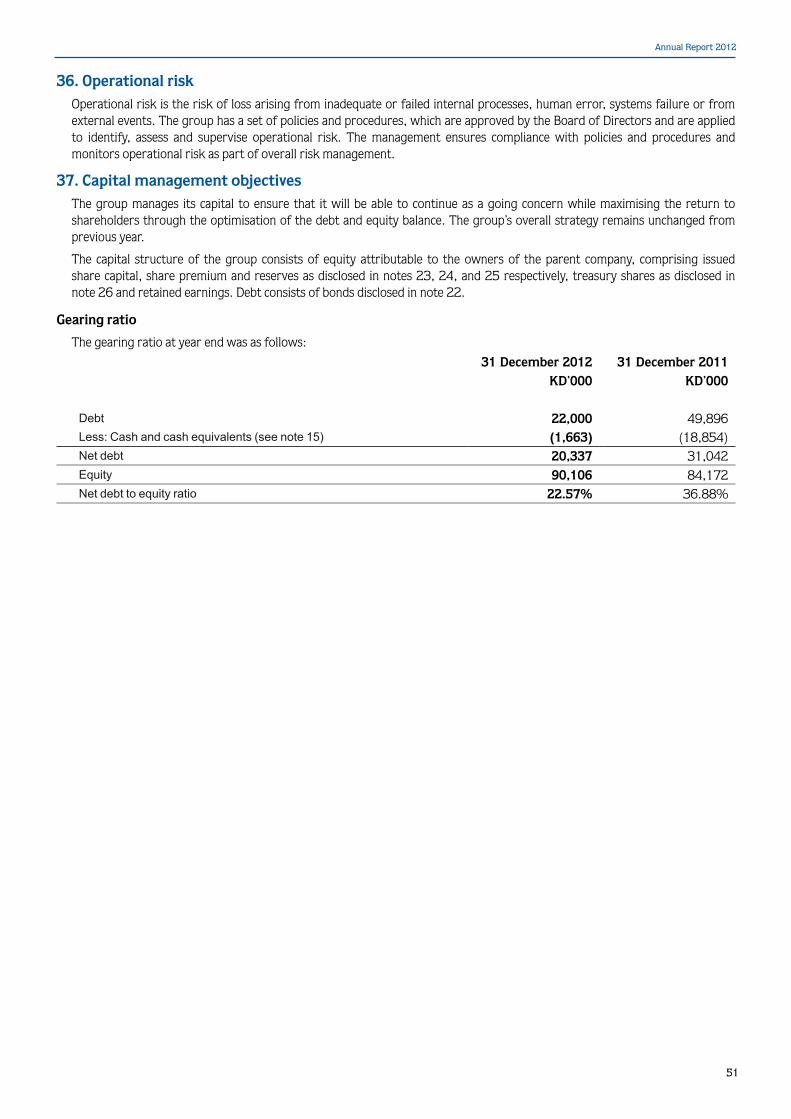
Annual Report 2012
51
36. Operational riskOperational risk is the risk of loss arising from inadequate or failed internal processes, human error, systems failure or from external events. The group has a set of policies and procedures, which are approved by the Board of Directors and are applied to identify, assess and supervise operational risk. The management ensures compliance with policies and procedures and monitors operational risk as part of overall risk management.
37. Capital management objectivesThe group manages its capital to ensure that it will be able to continue as a going concern while maximising the return to shareholders through the optimisation of the debt and equity balance. The group’s overall strategy remains unchanged from previous year.
The capital structure of the group consists of equity attributable to the owners of the parent company, comprising issued share capital, share premium and reserves as disclosed in notes 23, 24, and 25 respectively, treasury shares as disclosed in note 26 and retained earnings. Debt consists of bonds disclosed in note 22.
Gearing ratio
The gearing ratio at year end was as follows:
31 December 2012 31 December 2011KD’000 KD’000
Debt 22,000 49,896Less: Cash and cash equivalents (see note 15) (1,663) (18,854)Net debt 20,337 31,042Equity 90,106 84,172Net debt to equity ratio 22.57% 36.88%