NIOSH HEALTH HAZARD EVALUATION REPORT: HETA #2003-0039-2914 Hilton Head Elementary School Hilton Head Island, South Carolina September 2003 DEPARTMENT OF HEALTH AND HUMAN SERVICES Centers for Disease Control and Prevention National Institute for Occupational Safety and Health This Health Hazard Evaluation (HHE) report and any recommendations made herein are for the specific facility evaluated and may not be universally applicable. Any recommendations made are not to be considered as final statements of NIOSH policy or of any agency or individual involved. Additional HHE reports are available at http://www.cdc.gov/niosh/hhe/reports This Health Hazard Evaluation (HHE) report and any recommendations made herein are for the specific facility evaluated and may not be universally applicable. Any recommendations made are not to be considered as final statements of NIOSH policy or of any agency or individual involved. Additional HHE reports are available at http://www.cdc.gov/niosh/hhe/reports This Health Hazard Evaluation (HHE) report and any recommendations made herein are for the specific facility evaluated and may not be universally applicable. Any recommendations made are not to be considered as final statements of NIOSH policy or of any agency or individual involved. applicable. Any recommendations made are not to be considered as final statements of NIOSH policy or of any agency or individual involved. Additional HHE reports are available at http://www.cdc.gov/niosh/hhe/reports
Transcript
NIOSH HEALTH HAZARD EVALUATION REPORT: HETA #2003-0039-2914 Hilton Head Elementary School Hilton Head Island, South Carolina September 2003 DEPARTMENT OF HEALTH AND HUMAN SERVICES Centers for Disease Control and Prevention National Institute for Occupational Safety and Health
This Health Hazard Evaluation (HHE) report and any recommendations made herein are for the specific facility evaluated and may not be universally applicable. Any recommendations made are not to be considered as final statements of NIOSH policy or of any agency or individual involved. Additional HHE reports are available at http://www.cdc.gov/niosh/hhe/reports
This Health Hazard Evaluation (HHE) report and any recommendations made herein are for the specific facility evaluated and may not be universally applicable. Any recommendations made are not to be considered as final statements of NIOSH policy or of any agency or individual involved. Additional HHE reports are available at http://www.cdc.gov/niosh/hhe/reports
This Health Hazard Evaluation (HHE) report and any recommendations made herein are for the specific facility evaluated and may not be universally applicable. Any recommendations made are not to be considered as final statements of NIOSH policy or of any agency or individual involved. Additional HHE reports are available at http://www.cdc.gov/niosh/hhe/reports
This Health Hazard Evaluation (HHE) report and any recommendations made herein are for the specific facility evaluated and may not be universally applicable. Any recommendations made are not to be considered as final statements of NIOSH policy or of any agency or individual involved.
This Health Hazard Evaluation (HHE) report and any recommendations made herein are for the specific facility evaluated and may not be universally applicable. Any recommendations made are not to be considered as final statements of NIOSH policy or of any agency or individual involved. Additional HHE reports are available at http://www.cdc.gov/niosh/hhe/reports
applicable. Any recommendations made are not to be considered as final statements of NIOSH policy or of any agency or individual involved. Additional HHE reports are available at http://www.cdc.gov/niosh/hhe/reports
PREFACE The Respiratory Disease Hazard Evaluations and Technical Assistance Program (RDHETAP) of the National Institute for Occupational Safety and Health (NIOSH) conducts field investigations of possible health hazards in the workplace. These investigations are conducted under the authority of Section 20(a)(6) of the Occupational Safety and Health (OSH) Act of 1970, 29 U.S.C. 669(a)(6) which authorizes the Secretary of Health and Human Services, following a written request from any employer or authorized representative of employees, to determine whether any substance normally found in the place of employment has potentially toxic effects in such concentrations as used or found.
RDHETAP also provides, upon request, technical and consultative assistance to federal, state, and local agencies; labor; industry; and other groups or individuals to control occupational health hazards and to prevent related trauma and disease. Mention of company names or products does not constitute endorsement by NIOSH.
ACKNOWLEDGMENTS AND AVAILABILITY OF REPORT This report was prepared by Nancy Sahakian, Kyoo Choe, Sandra White, and Rebecca Jones of the RDHETAP, Division of Respiratory Disease Studies (DRDS). Field assistance was provided by Ju-Hyeong Park, Carol Rao, and Michelle Vingle. Desktop publishing was performed by Terry Rooney. Review and preparation for printing were performed by Penny Arthur. Copies of this report have been sent to management representatives, employee representatives, and the OSHA Regional Office. This report is not copyrighted and may be freely reproduced. Single copies of this report will be available for a period of three years from the date of this report. To expedite your request, include a self-addressed mailing label along with your written request to:
NIOSH Publications Office 4676 Columbia Parkway Cincinnati, Ohio 45226
800-356-4674
After this time, copies may be purchased from the National Technical Information Service (NTIS) at 5825 Port Royal Road, Springfield, Virginia 22161. Information regarding the NTIS stock number may be obtained from the NIOSH Publications Office at the Cincinnati address.
For the purpose of informing affected employees, copies of this report shall be
posted by the employer in a prominent place accessible to the employees for a period of 30 calendar days.
iii
Highlights of the NIOSH Health Hazard Evaluation
at The Hilton Head Elementary School In October 2002 the National Institute for Occupational Safety and Health (NIOSH) received a Health Hazard Evaluation (HHE) request from employees at Hilton Head Elementary School in Hilton Head Island, South Carolina. Concerns included possible microbial contamination and a number of health effects.
What NIOSH Did • Reviewed the report from an environmental
survey performed by a consultant contracted by the Beaufort County School District.
• Visually inspected the school buildings and heating, ventilating, and air-conditioning (HVAC) systems, looking for evidence of mold contamination and water incursion.
• Measured temperature, relative humidity, carbon dioxide level, and carpet water activity.
• Collected fungal spore count and endotoxin air samples and bulk samples of ductwork insulation and ceiling tile.
• Administered a health questionnaire to employees
What NIOSH Found
• Carbon dioxide levels were excessive in some rooms, particularly in the Yellow building.
• Carpet water activity level was high in one Yellow building room.
• Absolute airborne fungal spore counts were lower indoors than outdoors; however, the predominant fungal taxa in the Yellow and Blue buildings differed from the Red building and outdoors.
• Fungal contamination was identified in the bulk ductwork insulation sample.
• Work-related lower respiratory symptoms, which occurred at least once weekly for the last month, were 2 to 3 times more frequent in Yellow and Blue building employees than in office workers in a national study.
• Wheeze and work-related cough that occurred within the last year were 2 times more frequent in Yellow and Blue building employees than in Red building employees.
• Current asthma was 3 times more frequent in female middle-aged school employees who had never smoked than expected based on national rates.
• Watery/itchy eyes and sore/dry throat symptoms that were work-related and occurred within the last year were 2 times more frequent in Yellow and Blue building employees than in Red building employees.
What the School District Can Do • Promptly identify and repair all causes of water
leakage through roof and walls. • Modify HVAC systems to maintain acceptable
carbon dioxide and relative humidity levels throughout the year.
• Implement HVAC system routine maintenance schedules.
• Inspect ductwork insulation for mold contamination and, if found, remove contaminated insulation.
What Employees Can Do • Report water incursion to management promptly. • Seek medical evaluation for persistent
symptoms, especially those that are work-related.
•
What To Do For More Information: We encourage you to read the full report. If you
would like a copy, either ask your health and safety representative to make you a copy or call
1-513-841-4252 and ask for HETA Report #2003-0039-2914
iv
Health Hazard Evaluation Report 2003-0039 Hilton Head Elementary School
Hilton Head Island, South Carolina September 2003
Nancy Sahakian, M.D, M.P.H.
Kyoo Choe, Ph.D. Sandra White, M.S.
Rebecca Jones, M.P.H., R.R.T.
SUMMARY Hilton Head Elementary School in Hilton Head Island, South Carolina is a pre-kindergarten to 5th grade elementary school which consists of three interconnected buildings: the Yellow building was built in the 1970s, the Blue building in late 1980s, and the Red building in 1997. The school has a history of poorly controlled indoor relative humidity, water incursion, musty odor, and fungal contamination in ductwork.
In October 2002 the National Institute for Occupational Safety and Health (NIOSH) received a confidential health hazard evaluation (HHE) request from school employees to investigate complaints of chest tightness, shortness of breath, eye irritation, allergic rhinitis, and headache and indoor air quality. In February 2003 NIOSH conducted a walk-through survey of the school. We performed a visual inspection of the school buildings and the heating, ventilating, and air-conditioning (HVAC) systems, obtained limited air and bulk samples, and administered a health questionnaire to employees with a 73% participation rate.
We found that the total airborne fungal spore concentrations were lower than outdoor levels in 5-minute collection samples from 13 different locations. However, Cladosporium constituted the predominant fungal taxon in the Yellow and Blue buildings, whereas Penicillium/Aspergillus were the predominant fungal taxa in the Red building and outdoors. We identified fungal contamination, which was predominantly Cladosporium, in a bulk sample of internal ductwork insulation from the Blue building. There was a more than ten-fold increase in the airborne Cladosporium spore count in one room when a unit ventilator was turned on, suggesting fungal amplification in and dissemination from the unit ventilator.
In our February 2003 survey, relative humidity ranged from 30 to 39% compared to 31 to 76% in a survey conducted from September to December 2002 by an environmental consulting firm, which the school had contracted. We measured carbon dioxide (CO2) in 26 rooms and found it ranged from 480 to 1900 parts per million parts (ppm) air by volume. In six rooms (all located in the Yellow and Blue buildings) the CO2 level exceeded the recommended limit of 1000 ppm, suggesting that the outdoor air exchange rate in these six rooms may be lower than the recommended rate of 15 cubic feet per minute per occupant. In one Yellow and one Red building room, floor water activity exceeded the 0.65 level required for growth by most microbial species.
Compared to Red building employees who participated in our survey, Yellow and Blue building participants combined were:
- About 2 times more likely to report wheeze within the last year - About 4 times more likely to report sleep broken due to breathing difficulty within the last year - About 2 times more likely to report work-related cough within the last year
v
- About 2 times more likely to report work-related watery/itchy eyes and sore/dry throat within the last year
- About 2 times more likely to report hypersensitivity pneumonitis symptoms (fever/chills, flu-like achiness/muscle aches, or unusual tiredness)
Compared to a national study of office employees, Yellow and Blue building participants were:
About 3 times more likely to report frequent work-related wheeze which occurred over the last month
About 2 times more likely to report frequent work-related shortness of breath, chest tightness, and cough which occurred over the last month
Compared to national rates, Hilton Head Elementary School female participants 40 to 69 years of age who had never smoked were:
About 3 times more likely to report current asthma
About 2 times more likely to report watery/itchy eye symptoms and sinus problems within the last year
We recommend that: all sources of water incursion be identified and repaired; current HVAC systems be modified to maintain relative humidity within the 30%-60% range; routine HVAC system maintenance schedules be implemented and adhered to; and ductwork insulation be inspected and removed if fungal contamination is identified. Employees should promptly report water incursion to management and should seek medical evaluation if work-related respiratory symptoms persist despite water damage and mold remediation.
NIOSH documented that work-related respiratory symptoms were occurring in Hilton Head Elementary Yellow and Blue building employees more frequently than in Red building employees and participants in a national office worker study. Findings from a prior environmental survey, performed by a consultant contracted by the Beaufort County School District, suggest that the school buildings may be contaminated with microbial growth. Our environmental assessment was limited. However, we were able to demonstrate elevated carpet water activity levels in two rooms, fungal contamination in ductwork insulation, evidence of dissemination of fungi by a unit ventilator, and indoor airborne fungal spore samples in the Yellow and Blue buildings with a different predominant fungal species than outdoors. We recommend that all sources of water incursion be repaired, that contaminated ductwork insulation be removed, and that HVAC systems be modified to maintain relative humidity within acceptable limits.
Keywords: SIC 8211 (elementary and secondary schools), indoor air pollution, indoor air quality, fungi, work-related asthma.
iv
TABLE OF CONTENTS Preface ..........................................................................................................................................................ii Acknowledgments and Availability of Report..............................................................................................ii Highlights.....................................................................................................................................................iii Summary ...................................................................................................................................................... iv Introduction................................................................................................................................................... 1 Background................................................................................................................................................... 1 Methods ........................................................................................................................................................ 2 Results........................................................................................................................................................... 4 Discussion ..................................................................................................................................................... 7 Conclusions………………………………………………………………………………………..9 Recommendations....................................................................................................................................... 10 References................................................................................................................................................... 11 Tables and Figures ...................................................................................................................................... 12 Appendix A: Summary of AAA Environmental Findings and Recommendations ................................... 31 Appendix B: Floor Plans............................................................................................................................ 36 Appendix C: Questionnaire........................................................................................................................ 39 Appendix D: Diagram of Yellow Building Ventilation System ................................................................ 46 Appendix E: Diagram of Blue Building Ventilation System..................................................................... 49 Appendix F: Diagram of Red Building Ventilation System ...................................................................... 50 Appendix G: Evaluation Criteria…………………………………………………………………………51
Health Hazard Evaluation Report No. 2003-0039-2914 Page 1
INTRODUCTION On October 31, 2002, the National Institute for Occupational Safety and Health (NIOSH) received a confidential request for a health hazard evaluation from employees of Hilton Head Elementary School, located in Hilton Head Island, South Carolina. Employees reported symptoms of chest tightness, shortness of breath, eye irritation, allergic rhinitis, and headache, thought to be related to mold exposure in the school.
NIOSH conducted a walk-through survey from February 5 to 7, 2003 at the school. During our visit we inspected the heating, ventilating, and air-conditioning (HVAC) systems, collected environmental samples, and administered health questionnaires to employees.
BACKGROUND Hilton Head Elementary School is a pre-kindergarten to 5th grade school with 290 employees and 2,100 students. Teaching staff works from 8 a.m. to 4:00 p.m. The school is located on Hilton Head Island, an island off the coast of South Carolina, which is connected by a bridge to the mainland.
The school, a 270,000 square foot facility, is comprised of three interconnected school buildings and eight modules. The buildings, referred to as the Yellow, Blue, and Red buildings (built in the 1970s, late 1980s, and 1997, respectively) were connected when the Red building (which is positioned between the other two buildings) was constructed. The school is a single-story, concrete block structure with brick veneer. Floors are concrete, overlaid with carpet or vinyl floor tile. Interior walls are predominantly concrete block; however, some sections of the Yellow building have drywall construction. Dropped ceilings are constructed of acoustical ceiling tile.
There have been concerns by the community regarding mold growth in the school for the last 10 years. Employees reported to us that some carpets had been subjected to excessive, prolonged contact with water from water incursion, water dripping from unit ventilators, and the incomplete removal of water following
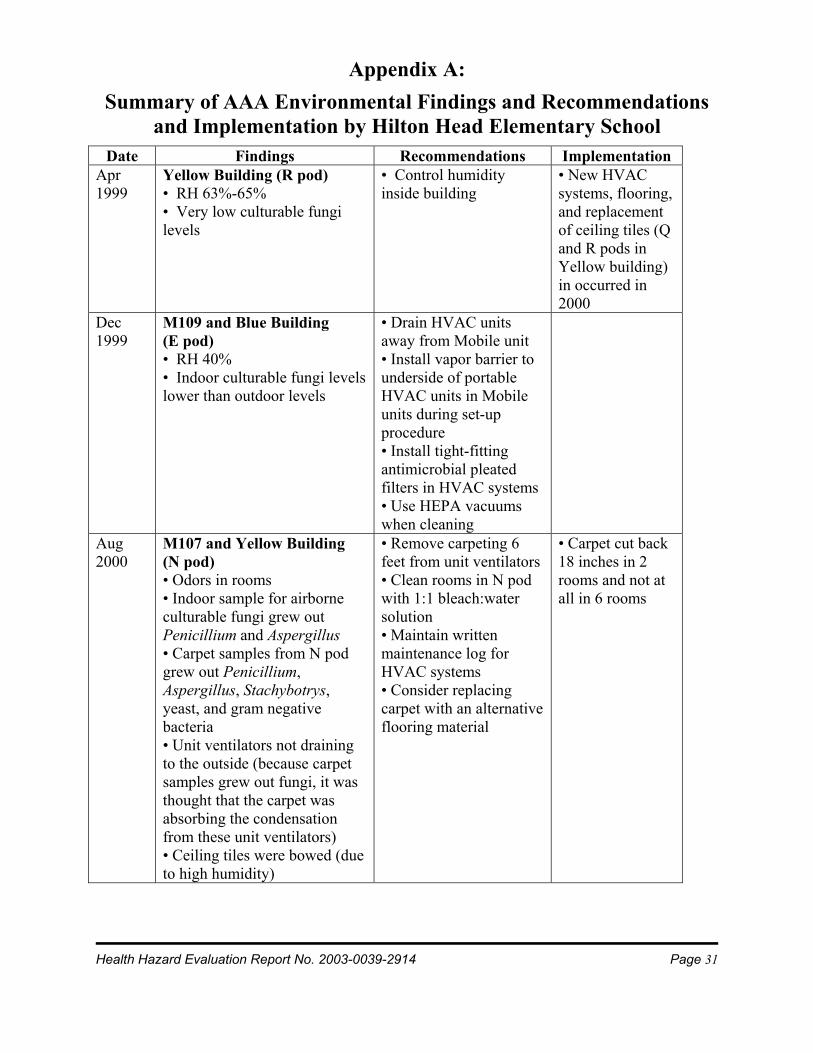
carpet cleaning. They also reported that water had dripped from the ceiling during several heavy rainstorms. The Beaufort County School District contracted AAA Environmental to perform a periodic environmental assessment of Hilton Head Elementary School from April 1999 to December 2002. A report of their investigations was made available to us shortly before our walk-through survey. An outline of their report is provided in Appendix A. In brief, the report documents: evidence of water incursion; growth of moisture-associated fungal species in carpet; poorly controlled indoor relative humidity; fungal contamination in ductwork and on supply diffusers and building materials; and a gradual increase in Penicillium and Aspergillus species over time from the initial survey in 1999 to the most recent survey in 2002.
A floor plan of the school is provided in Appendix B. Recent renovations in the Yellow building Q and R pods have included: construction of internal walls; resurfacing the floors (2/3 of floor area in classrooms is carpeted and 1/3 is tiled); replacement of ceiling tiles; and installation of a new HVAC system. Other recent Yellow building renovations have included: replacement of carpet with tile and the installation of a new HVAC system with a dehumidifying unit in the M (kindergarten) pod; and replacement of carpet with tile in two rooms in the N pod.
Recent renovations in the Blue building have included: replacement of carpet with tile; installation of new ventilation ductwork; replacement of ceiling tiles; and removal of wall corkboard and sinks in several rooms in the B, C, E, and D pods.
Renovations that were planned for the summer of 2003 included: installation of a new HVAC system (with a dehumidifier as part of the system); replacement of carpet with tile, and replacement of ceiling tiles in the L, N, and P pods in the Yellow building. Projected renovation in the Blue building included: installation of a new HVAC system (with new duct work) and replacement of carpet with tile.
The Blue building renovations were to begin in the Fall of 2003 and to continue until Spring 2005.
Page 2 Health Hazard Evaluation Report No. 2003-0039-2914
METHODS Industrial Hygiene HVAC System Evaluation We checked operational principles, cleanliness inside the ducts, and methods of humidity control of the HVAC systems.
Visual Inspection We visually inspected the school buildings and some HVAC systems. A boroscope is an optical fiberoptic scope which can be inserted into otherwise inaccessible areas to allow for indirect visualization. We used a boroscope (Model # PLA 500DA, Everest VIT, Flanders, NJ) to enter a pre-existing hole in a baseboard and then passed this scope up the internal surface of the wall to visualize the hidden space behind the wall. We also passed this scope through duct openings to visualize the internal surfaces of ductwork. The assessment included visual observations for mold contamination and water incursion.
Environmental Sampling We conducted a preliminary survey to investigate water damage, microbial contamination, and HVAC system problems in the school buildings. Limited sampling and environmental testing were performed during this walk-through visit.
Endotoxin is a component of the outer membrane of gram-negative bacteria, commonly found in indoor and outdoor environments. It is an environmental toxin known to induce airways inflammation. We obtained 4 time-integrated airborne endotoxin samples from 3 sampling locations (one site for each building, selected on the basis of a history of prior water damage) to assess whether endotoxin was present at high levels in these rooms. We sampled at 10 liters per minute (L/min) onto 37-millimeter (mm) polyvinyl chloride (PVC) filter cassettes for more than 24 hours, at each of the three indoor sampling locations. Two side-by-side samples were collected simultaneously in the Yellow building classroom to ensure valid sampling.
Endotoxin samples were analyzed at a NIOSH laboratory.
To measure general airborne fungi levels and to compare the three school building with the outdoors, we sampled rooms from all three school buildings and the outdoors. Thirteen indoor and 2 outdoor locations were sampled with Air-O-Cell cassettes (SKC Inc., Eighty Four, PA) at a flow rate of 15 L/min for 5 minutes. We obtained two bulk samples from the Blue building: a piece of ductwork insulation material (with visible dust accumulation); and a section of stained ceiling tile. Air-O-Cell cassettes were microscopically analyzed for fungal spore taxa identification and counts. Results are reported as number of fungal spores per cubic meter of air (spores/m3). We obtained bulk samples to determine whether specific building materials were contaminated with mold. These samples were washed in sterile water; the wash water was serially diluted and then inoculated onto malt extract agar, cellulose agar, and DG-18 agar culture plates. After incubation, fungal colonies on the culture plates were identified to species and counted. Results are reported as number of colony forming units per gram of bulk material (CFU/g). All fungal analyses were conducted by an American Industrial Hygiene Association-accredited commercial microbiology laboratory.
Limited work has been done to investigate the number of particles and associated health effects in the indoor environment. We monitored real-time particle count concentrations for 24 hours using Grimm Mini-aerosol Spectrometer optical particle counters (OPC) (Model 1.108, Grimm Technologies Inc., Douglasville, GA) at 3 locations, one in each of the 3 buildings, to compare these levels in the three school buildings. The instrument measured particles with a size range from 0.4 to 20 micrometers (µm) at a flow rate of 1.2 L/min. Particles measured by the OPCs were divided into respirable (0.4 to 4 µm) and coarse (4 to 20 µm) particles. Respirable particles are able to penetrate deep into the lungs; coarse particles are largely deposited in the upper respiratory tract.
Health Hazard Evaluation Report No. 2003-0039-2914 Page 3
Temperature, relative humidity (RH), and carbon dioxide (CO2) were measured with a Q-Trak (TSI Inc., St. Paul, MN) once at 7, 11, and 8 locations in the Yellow, Blue, and Red buildings, respectively. All measurements were taken in the afternoon.
Water activity is an estimate of the amount of water available for microbial growth within a material. We estimated the water activity of carpeted floors in 27 classrooms using a Microscanner infrared thermometer (Model D-501, Watertown, MA) to measure dry and wet bulb floor temperatures.
Epidemiological Survey We invited all employees at the school (teachers, teacher’s aides, administrative and clerical staff, custodians, and food service workers) to participate in a health survey. A written health questionnaire (Appendix C) was voluntarily self-administered to employees in each of the three buildings, with NIOSH staff present to clarify survey questions. Mail-in questionnaires with postage paid envelopes were left in the school mailboxes of non-participants. We performed double-keyed entry of completed questionnaire responses into a computerized database, to ensure data accuracy.
Responses from eight employees who listed more than one building as their current building were assigned to all listed buildings for all data analysis except for the calculation of prevalence rate ratios (where comparisons were made to Red building employees and to national data for employees in office buildings). We excluded questionnaires from two employees whose questionnaires were insufficiently complete. Denominators for prevalence rates vary because not all participants answered all questions. Seven employees who listed Modules as their only current worksite were included in total school calculations but their responses were not analyzed separately due to their small numbers.
We calculated prevalence rates for respiratory (lower and upper) and non-respiratory symptoms in Yellow, Blue, and Red building employees. Symptoms were further characterized as current (i.e., within the last month) and recent (i.e., within the last year); and whether work-related (i.e., improved at home or onset after hire).
Symptom prevalence rates for employees in the Yellow, Blue, and combined Yellow and Blue buildings were compared to prevalence rates for Red building employees (Red building employees were used for comparison because the Red building was the newest of the three buildings), as well as to national data generated by a study of workers in non-problem offices in the Building Assessment Survey and Evaluation (BASE) study.1 The BASE study analyzed health questionnaire data collected for the Environmental Protection Agency (EPA) from 1994 to 1996 on workers in 41 large U.S. office buildings without known indoor air quality problems.
We compared prevalence rates for a number of respiratory and non-respiratory symptoms as well as physician-diagnosed asthma to national rates using data derived from the Third National Health and Nutrition Examination Survey (NHANES III).2 Current asthma was defined as an affirmative response to both of the following questions: “Has a doctor ever told you that you have asthma?” and “Do you still have asthma?”. Because female employees predominated in the school, only females were used in the NHANES III comparison so as to increase comparability of the two groups.
Comparison was made between all Hilton Head Elementary School employees and current asthma rates obtained from Behavioral Risk Factor Surveillance System (BRFSS) data for South Carolina.3 The same questions “Has a doctor ever told you that you have asthma?” and “Do you still have asthma?” are used in the NHANES and BRFFS surveys. BRFSS reports state prevalence rates (for males and females who are 18 years of age and older) but does not provide age- or gender-specific rates.
Statistical analyses were performed using the Chi-Square test and the Poisson distribution. We used a level of statistical significance (p < 0.05) which allowed us to be at least 95% certain that a higher rate of symptom reporting was not due to chance alone. Statistical significance is difficult to achieve when there are small numbers in the groups being compared. The use of national data allowed us to increase the numbers in the comparison groups and increased our ability to identify statistically significant
Page 4 Health Hazard Evaluation Report No. 2003-0039-2914
relationships. When possible (as with the NHANES III comparisons), we controlled for age, gender, and smoking status. For the BASE comparisons, this was not possible due to lack of published information on participant demographics. When performing internal comparisons of Hilton Head Elementary School employees, we compared (but did not control for) demographic information.
RESULTS Environmental Survey HVAC System Evaluation System Description The Yellow building had three different types of ventilation systems (Appendix D). The recently renovated M pod had a new air-handling unit (AHU). Air inside the classrooms in this pod was exhausted through return air ducts, mixed with dehumidified outdoor air, and then supplied to each classroom through ceiling supply diffusers. This newer ventilation system was fully ducted, unlike ventilation systems used in other sections of the school that only had ducted supply air to rooms and, in the case of one system, ducted return air to the HVAC unit.
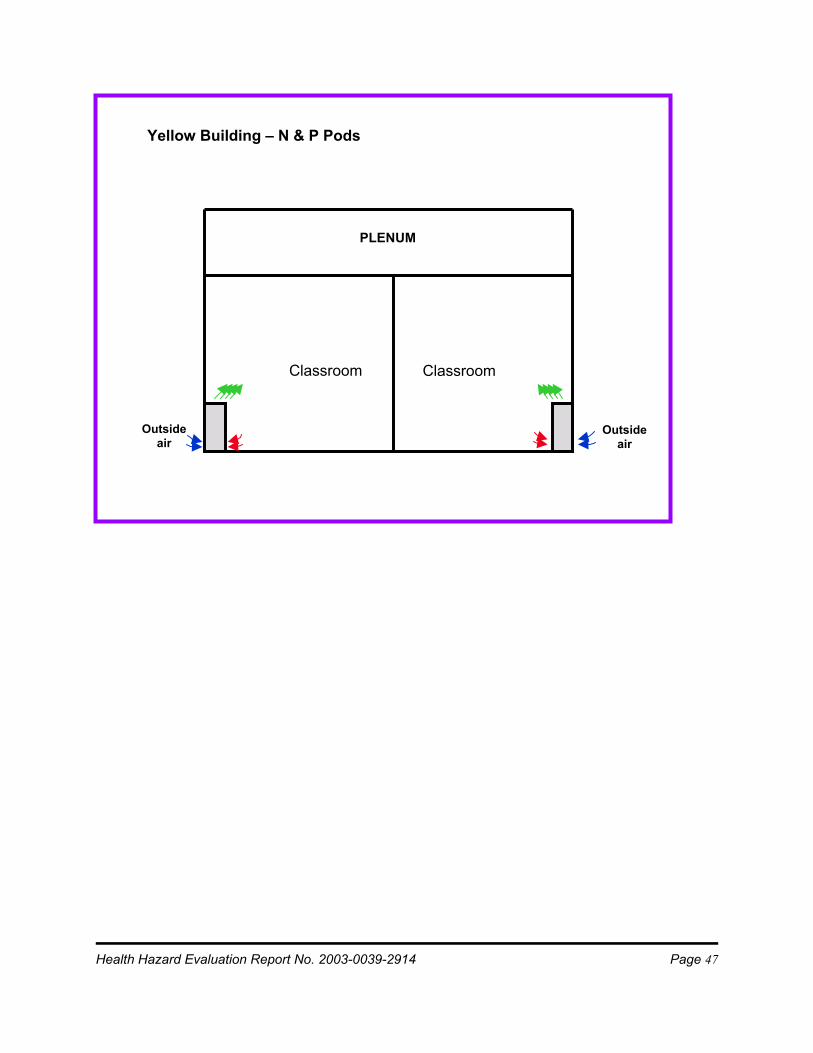
The N and P pods of the Yellow building had unit ventilators with air filters. Air was drawn from both indoors and outdoors through the unit ventilator and re-circulated to the classroom. The indoor humidity was controlled by adjusting the room temperature.
The Q and R pods of the Yellow building had SEMCO AHU (SEMCO Inc, Columbia, Missouri) systems that supplied fresh air to the classrooms and exhausted return air outdoors. A portion of the classroom air is exhausted through ducts to the SEMCO unit and then to outdoors and another portion is returned through the space above the ceiling (plenum) to a rooftop HVAC unit, where it is mixed with fresh outdoor air and then re-circulated to the classrooms through ceiling supply diffusers. The Blue building had SEMCO AHU systems that supplied fresh outdoor air and exhausted plenum-returned air from classrooms (Appendix E). Each room had its own HVAC unit that was
located in a hallway plenum. Classroom air was pulled into the HVAC unit, subsequently heated or cooled, and then re-circulated to classrooms. The SEMCO AHU drew outdoor air and supplied this to the classrooms through ducts and ceiling supply diffusers.
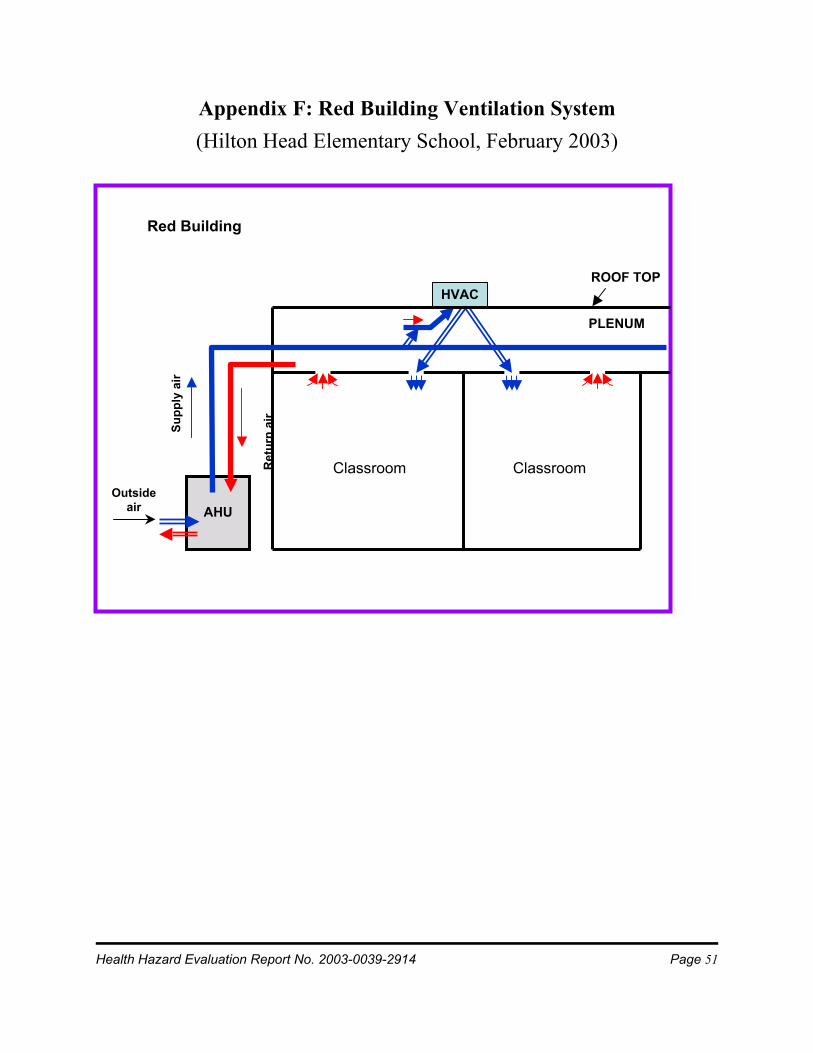
The Red building ventilation system was very similar to the Blue building system. Red building differences included: HVAC units on the roof-top instead of within the plenum; absence of ductwork for drawing classroom air directly into the HVAC unit; each HVAC unit served two classrooms; and no unconditioned outside air was ducted directly into classrooms (Appendix F). Visual Inspection We observed heavy accumulation of dust inside ductwork and accumulated debris on the supply diffusers in many of the rooms in the Blue building. The AAA Environmental report indicates that they found similar debris (on the supply diffusers in the Blue building) in which they identified fungal spores (testing tape samples) (Appendix A). Microbial Assessment All measured airborne endotoxin levels were low: 0.62 and 0.75 endotoxin units per cubic meter of air (EU/m3) in room P318 in the Yellow building; 0.20 EU/m3 in room D173 in the Blue building; and 0.24 EU/m3 in room K265 in the Red building. The average indoor airborne endotoxin level was 0.45 EU/m3.
Total airborne fungal spore concentrations were lower indoors than outdoors. Average total indoor fungal spore concentrations in the three buildings were very similar (Table 1). The percent distribution of fungal taxa differed among the buildings and between indoor and outdoor locations. Cladosporium constituted the predominant fungal taxon in the Yellow and Blue buildings; whereas, Penicillium/Aspergillus were the predominant fungal taxa in the Red building and outdoors. The airborne fungal spore concentration in the Yellow building room with the unit ventilator turned off was 454 spores/m3 compared to 1,908 spores/m3 when the unit ventilator was subsequently turned on.
Health Hazard Evaluation Report No. 2003-0039-2914 Page 5
Cladosporium spores accounted for most of this increase.
The concentration of total culturable fungi was 31,000 CFU/g for the bulk sample from the insulation material (from the corridor adjacent to D173 in the Blue building) and 930 CFU/g for the bulk sample from the ceiling tile (from C147 in the Blue building). Four fungal taxa (Aspergillus niger (2,800 CFU/g), Cladosporium (20,000 CFU/g), Mucor (400 CFU/g), and Penicillium (8,000 CFU/g)) and non-sporulating fungi (400 CFU/g) were identified from insulation material. Penicillium was the only fungal taxon identified from the ceiling tile sample.
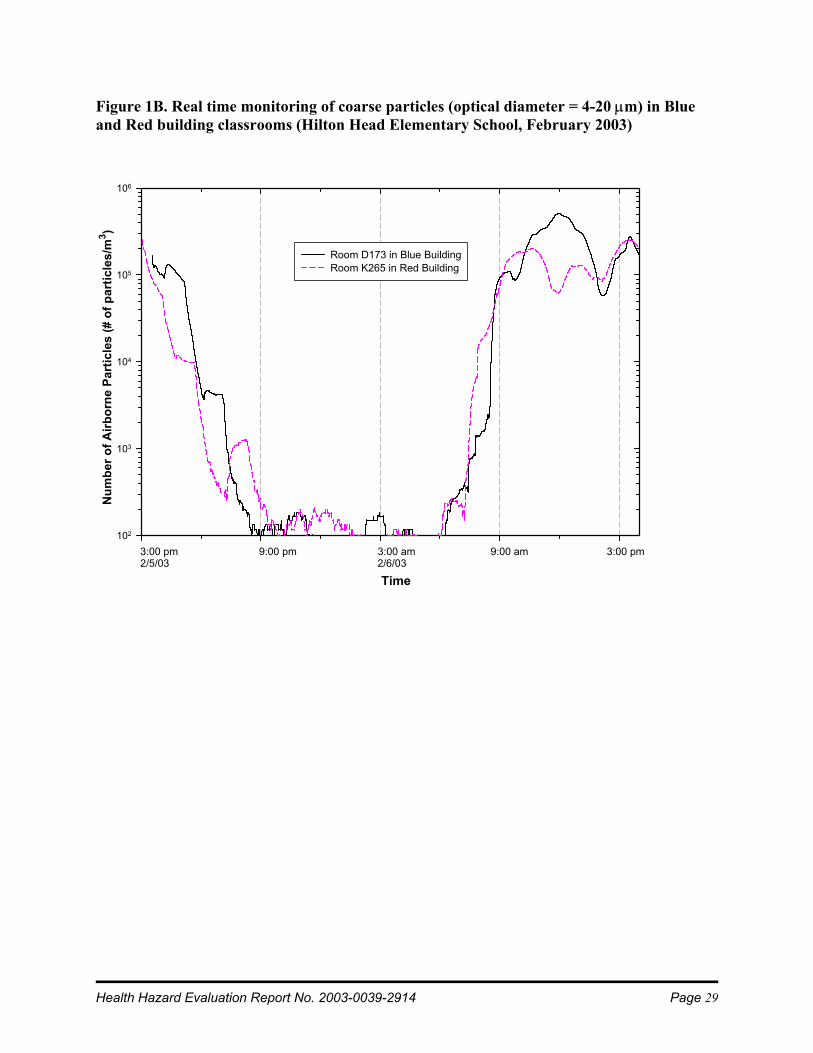
Particles Only particle measurements in the Blue and Red buildings are presented in the report because of a malfunction in the Yellow building sampling instrument. Both respirable and coarse particle concentrations were similar in the Blue and Red building rooms. Real-time concentrations of respirable particles did not change dramatically over the time that they were monitored (Figure 1A). The concentrations of coarse particles decreased sharply in the afternoon on the first day of investigation. These low levels persisted during the evening and sharply increased in the morning of the next day where they remained until 3:00 PM (Figure 1B), correlating with building occupancy by students and staff.
Temperature, RH, CO2, and Water Activity The temperature and RH in the rooms ranged between 70 and 74oF and 30 and 39%, respectively (Table 2). CO2 concentrations ranged from 478 to 1,899 ppm (Table 3). The CO2 concentrations in all the rooms tested in the N and P pods of the Yellow building and in some of the rooms tested in the A, C, and D pods of the Blue building exceeded 1,000 ppm. CO2 concentrations in other rooms tested in the Yellow and Blue buildings and in all the rooms tested in the Red building were less than 1,000 ppm. However, Red building CO2 measurements were obtained after the school day, when room occupancy would be lower. It is possible that elevated CO2 concentrations
might exist in some of these rooms during the school day. The average water activities were low and similar among the three buildings (0.61, 0.59, and 0.58 for Yellow, Blue, and Red buildings, respectively) (Table 4). The highest water activity level was 0.87 (in room N307 in the Yellow building), which is adequate to support fungal growth. Epidemiological Survey Participation and Demographics Of 290 Hilton Head Elementary School employees, 212 (73%) participated in the survey. When we calculated building-specific participation rates, we excluded all cafeteria workers (due to uncertain numbers of cafeteria workers in each of the three buildings) and two participants whose questionnaires were incomplete; and we included participants who listed more than one building in the participation rates for all the buildings that they had listed. Building participation rates were 77.4%, 76.2%, and 77.5% for the Yellow, Blue, and Red buildings, respectively.
Age, gender, and smoking status were similar among participants from all three buildings (Table 5). A larger proportion of Red building participants was administrative and clerical staff than in the other two buildings (13% versus 5% and 9%). Participants are referred to as employees in the remainder of this report.
Symptoms Current Lower Respiratory Symptoms Prevalence of lower respiratory symptoms present at least weekly for the last month were generally more frequent in the Yellow and Blue building employee groups compared to the Red building employee group. Rates for wheeze, chest tightness, and cough were highest in employees in the Yellow building. Rates for shortness of breath and sleep broken due to breathing difficulty were highest in Blue building employees (Table 6).
There was a 1.4 to 2.6 times greater likelihood of wheeze, chest tightness, shortness of breath, or sleep broken due to breathing difficulty being reported by Yellow and Blue building
Page 6 Health Hazard Evaluation Report No. 2003-0039-2914
employees combined compared to Red building employees (Table 7).
With one exception a higher percentage of employees in the Yellow and Blue buildings reported frequent, recent lower respiratory symptoms that improved away from work compared to Red building employees (Table 6). One or more frequent respiratory symptoms in the last month, which improved away from work was 1.8 times more likely in Yellow and Blue building employees combined compared to Red building employees, but this was not statistically significant (Table 8).
Prevalence of work-related lower respiratory symptoms among Yellow and Blue building employees combined was 2 to 3 times higher than expected, based on national rates from the BASE study1, for all four lower respiratory symptoms that could be compared (Table 8). With the larger size of the comparison group, we were able to demonstrate statistical significance for all four of these symptoms.
Recent Lower Respiratory Symptoms Lower respiratory symptoms which occurred within the last 12 months were consistently more frequent in the Yellow and Blue building employees compared to Red building employees, whether work-related or not (Table 9). Wheeze within the last 12 months was 1.9 times more frequent in Yellow and Blue building employees combined compared to Red building employees (Table 10). Cough within the last 12 months was 1.4 times more frequent in Blue building compared to Red building employees. Sleep broken due to breathing difficulty was 3.7 times more frequent in Yellow and Blue building employees combined compared to Red building employees. Cough which occurred within the last 12 months and which improved away from work was 1.9 times more frequent in Yellow and Blue building employees combined compared to Red building employees (Table 11). Having one or more work-related lower respiratory symptoms within the last 12 months was 2.2 times more likely in Yellow and Blue building employees compared to Red building employees. These prevalence rate ratios were all statistically significant.
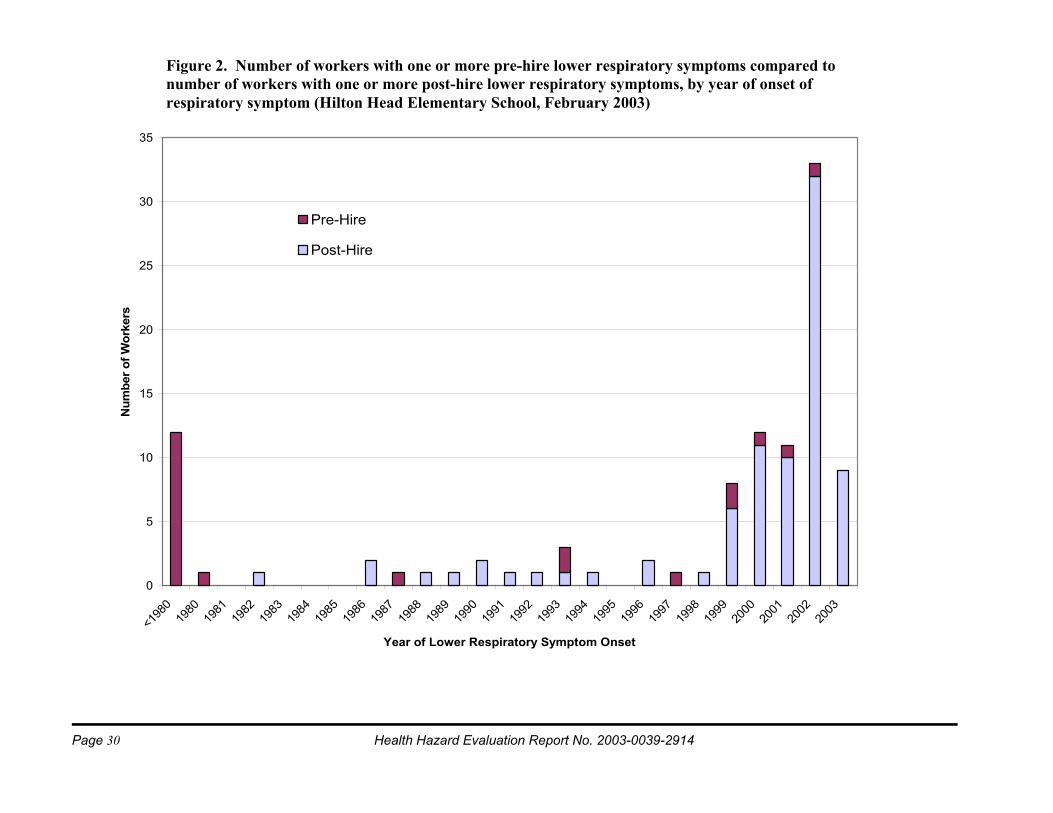
Symptoms with Onset after Hire The prevalence of one or more lower respiratory (wheeze, chest tightness, shortness of breath, cough, or sleep broken by breathing difficulty), upper respiratory (stuffy/itchy/runny nose, sneezing, watery/itchy eyes, or sore/dry throat), or hypersensitivity pneumonitis (HP)-like symptoms (fever/chills, flu-like achiness/muscle aches, or unusual tiredness) with an onset after hire were all higher in Yellow and Blue compared to Red building employees (Table 12A). The prevalence of any lower respiratory, upper respiratory, or HP-like symptom in Yellow and Blue building employees combined compared to Red building employees was 1.7, 1.4, and 2.2 times greater, respectively (Table 12B). Two of these prevalence rate ratios were statistically significant. The vast majority of employees who reported one or more lower respiratory symptoms within the last 12 months also indicated that the symptoms began after beginning work at the school (Figure 2).
Wheeze, Asthma Diagnosis, and Use of Asthma Medications Compared to national NHANES III rates2, female employees 40 to 69 years of age who had never smoked were 3.5 times more likely to have reported wheeze within the last year (Table 13). This was statistically significant.
Current asthma was more frequent in the Red building employees (Table 14A). Twelve of the 15 participants (80%) who reported that they had current asthma also reported that they had symptoms they felt were work-related. Of these 12 employees, 10 (83%), 1 (8%), and 1 (8%) indicated that work-related symptoms began in the Blue, Yellow, and modular buildings, respectively.
Use of asthma medication within the last 12 months was highest in Yellow building employees and also higher in Blue building employees than in Red building employees (Table 14A). The likelihood of an employee having taken asthma medication within the last 12 months was 1.6 times greater in the Yellow and Blue buildings combined than in the Red building (Table 14B). With small numbers in
Health Hazard Evaluation Report No. 2003-0039-2914 Page 7
the comparison group, we were not able to demonstrate statistical significance.
The proportion of female employees 40 to 69 years of age who had never smoked and who had a diagnosis of current asthma was 2.6 times higher than would be expected based on national averages derived from the NHANES III (Table 15). This was statistically significant.
The percentage of employees overall who currently had asthma was 7.3%, which was not significantly elevated compared to the South Carolina state rate of 6.5% (confidence interval: 5.5% -7.6%), based on BRFSS data. This state average includes all adults (male and female), all different smoking statuses (prior, former, and never smokers), and all ages from 18 years of age and older, which may make the reported prevalence rate less comparable to the Hilton Head Elementary School employee population than NHANES III current asthma prevalence rates which are specific for age, gender, and smoking status. Hypersensitivity Pneumonitis Diagnosis Three employees indicated that they had been diagnosed with hypersensitivity pneumonitis. When we contacted two of these employees it was determined that the question had been misinterpreted and that they had not been diagnosed with this condition. The third employee, who we were unable to contact, indicated on the questionnaire that the diagnosis had been made prior to the employee beginning to work at the school.
Current and Recent Work-Related Upper Respiratory and Non-Respiratory Symptoms The proportions of employees with current (within the last month) frequent watery or itchy eyes and sore or dry throat that improved away from work were higher in the Yellow and Blue buildings than in the Red building (Table 16A). Frequent work-related headache within the last month was more common in Yellow building employees compared to employees in the other two buildings. Yellow and Blue building employees combined were 2.9 times more likely to have work-related sore or dry throat than Red
building employees (Table 16B). This was statistically significant.
Work-related eye irritation, sore throat, and headache, present within the last 12 months, were all more frequent in Yellow and Blue building employees compared to Red building employees (Table 17A). Work-related eye irritation was 1.8 times and work-related sore throat was 2.5 times more frequent in Yellow and Blue building employees combined compared to Red building employees (Table 17B). We were able to demonstrate statistical significance for both of these symptoms.
Recent Upper Respiratory and Non-Respiratory Symptoms Female employees 40 to 69 years of age who had never smoked were 1.3 times more likely to have had stuffy, itchy, or runny nose, and 1.6 times more likely to have had watery or itchy eyes within the last 12 months than expected, based on national rates using NHANES III data (Table 18). They were also 1.6 times more likely than expected (based on NHANES III) to have had sinusitis or sinus problems. All these findings were statistically significant (Table 19).
DISCUSSION Environmental Survey The Hilton Head Elementary School buildings have several different types of HVAC systems designed to control indoor relative humidity in slightly different ways. If the supply air passing through ducts is humid enough and sufficient dust has accumulated in the internal insulation material, then the environment inside the ducts will support fungal growth. The finding that the internal insulation material from the Blue building ductwork contained high concentrations of culturable fungi (Cladosporium, Aspergillus, and Penicillium) suggests conditions conducive to fungal growth (high humidity in the supply air, high water activity (0.80-0.89)4, and a high accumulation of dust) have been present inside the ducts. This finding raises concern that this HVAC system may not properly control indoor air humidity during the wet season. During the summer, when humid air is supplied to the rooms and the rooms may be damp due to water
Page 8 Health Hazard Evaluation Report No. 2003-0039-2914
incursions, the environmental conditions would also be optimal for microbial growth on other indoor surfaces.
Prior to our visit there had been some remediation of the Yellow and Blue buildings as recommended by AAA Environmental (described in the Background section). The measured relative humidity during the NIOSH visit was below 60%, which would help control mold and bacterial growth,5 and average floor water activity levels measured were below the 0.65 level required for growth by most microbial species.6 Except for one room in the Yellow building and one room in the Red building (where the floor water activities were 0.87 and 0.66, respectively), environmental conditions were insufficient for microbial growth on building materials at the time of our visit. Our visit was, however, during one of the driest times of the year for that region. Our findings may have yielded different results had we conducted our survey during the rainy season when outdoor relative humidity in this region would be higher and there would be higher likelihood of water incursion into the building. The environmental assessment performed by AAA Environmental in September-December 2002 (Appendix A) documented elevated RH readings (range 31-76%).
Average airborne endotoxin concentration for three sampled rooms (0.45 EU/m3) was lower than what has been previously reported in randomly selected day care centers and air-conditioned offices (1.57 and 0.58 EU/m3, respectively).7
Fungal spore trap samples are a 5-minute “snapshot” that shows the concentration of viable and non-viable fungi in the air at that specific time. The limitations of air sampling must be taken into account when interpreting airborne fungi data. Fungi in air vary seasonally, diurnally, and with occupant activity level. In addition, there are no standards that relate health effects to a specific level of fungi in the air.8 Our airborne fungal measurements may not be representative of the microbial concentrations in the school due to our limited number of samples. Also our measurements may have been affected by the dry weather at the
time of our visit. Fungal spore counts measured by AAA Environmental during November-December 2002 were generally higher (range 73-42,350 spores/m3) than our measurements.
Our limited environmental sampling results are consistent with the possibility of an indoor source of Cladosporium in the Yellow and Blue buildings. Although absolute fungal spore counts were lower indoors than outdoors, the percent distributions of fungal taxa were different. The fungal taxa percent distributions indicate that the Yellow and Blue buildings may be different than the Red building. The Yellow and Blue buildings were similar, with Cladosporium constituting the predominant fungal taxon. The Red building distribution was similar to the outside distribution with Penicillium/Aspergillus constituting the predominant fungal taxa. Our bulk sample results indicated that insulation material inside one duct was contaminated with mold (e.g., Cladosporium). It is possible that fungal spores from the HVAC systems may contribute to the total indoor fungi level. The more than 10-fold increase in the Cladosporium spore count when the unit ventilator was turned on suggests fungal amplification in and dissemination from unit ventilators.
Maximum airborne respirable and coarse particle concentrations were about 10-fold lower and higher, respectively, compared to a problem office building studied by NIOSH.9 The health effect of these particle levels is currently not known. Because of their larger size, coarse particles have a shorter settling time so that their concentrations were much more variable, increasing and decreasing as a function of occupant activity (Figure 1B).
Temperature10 and relative humidity5 measurements were within American Society of Heating, Refrigerating, and Air-Conditioning Engineers (ASHRAE) recommendations. We observed that CO2 levels were elevated in some classrooms. The ASHRAE Standard recommends “an indoor to outdoor differential concentration not greater than about 700 ppm of CO2 ”.5 Assuming that the outdoor CO2 concentration is about 300 ppm, some of our indoor measurements (e.g., in N and P pods of
Health Hazard Evaluation Report No. 2003-0039-2914 Page 9
the Yellow building) would exceed this recommendation. This implies that the outdoor air supply may be insufficient for the number of occupants (teachers and students) in some classrooms. ASHRAE recommends an outdoor air supply rate of 15 cubic feet per minute per person for school classrooms, though even this ventilation rate may be inadequate to prevent complaints such as mucous membrane irritation and eye symptoms.11 Studies have documented a decreased prevalence of sick building syndrome symptoms with increases in building ventilation rates to approximately 40 cubic feet per minute per person.12
Epidemiological Survey Current (within the last month) and recent (within the last year) symptoms were not uniformly distributed in building participants. Symptom rates were higher in Yellow and Blue building employees combined compared to Red building employees. Yellow and Blue building rates for current work-related lower respiratory symptoms and for recent work-related cough were statistically higher when compared to national office and Red building employee rates, respectively. These findings imply that Yellow and Blue buildings may have worse environmental conditions compared to the Red building or to general office buildings in the EPA BASE study.1
The majority of Red building employees who reported having current asthma also reported having that their first work-related symptom began in non-Red building school locations. This suggests that the higher current asthma rate in the Red building employees may be due to symptomatic employees transferring to this building from other buildings at Hilton Head Elementary School.
The high frequency of asthma medication usage in Yellow and Blue building employees (19.4% and 16.1%, respectively) compared to the low reported prevalence of physician-diagnosed current asthma (3.2% and 7.5%, respectively) suggests that the self-reported rates of asthma in Yellow and Blue building employees under-represents the true prevalence of asthma in these two groups of employees.
In studies of other buildings, indoor microbial growth13 and poor building ventilation1 have been associated with respiratory symptoms and/or asthma. Building-related asthma cases indicate that other building occupants may be at risk. Prompt remediation of building problems will prevent as yet unaffected individuals from developing asthma. The sooner that cases of occupational asthma are recognized, the better the outcome is for individual case patients. With early removal from further exposure in the implicated building environment, building-related asthma may resolve completely in the affected individuals. With continued exposure, affected building occupants can develop chronic asthma that persists after removal from the building. Even after building renovation, some persons with work-related asthma are unable to return to the cleaned environment without having symptoms recur.
Hypersensitivity pneumonitis is a lung disease associated with exposure to pigeon droppings, moldy hay, mold in humidifiers, mold within buildings,14-16 and several chemicals. HP may present with symptoms of fever, chills, fatigue, shortness of breath, and chest tightness beginning 4 to 6 hours after an acute exposure. Rates for these same symptoms were elevated in Yellow and Blue building employees compared to Red building employees. With a continuous low-level exposure to bioaerosols such as mold spores, there may be an insidious progressive worsening of shortness of breath, cough, and fatigue which may then become irreversible. Chest X-rays may show a transient infiltrate (often mis-diagnosed as pneumonia) and lung examination may demonstrate findings also consistent with pneumonia.17 The rate for pneumonia in the school was higher than national rates which may represent (at least in part) undiagnosed HP. We were unable to confirm work-related HP reports in our survey, but the possibility of this disease remains, based on increases in respiratory and flu-like symptoms and pneumonia diagnoses among school employees.
CONCLUSIONS In summary, the NIOSH evaluation suggests that work-related lung, eye (watery/itchy eyes), and
Page 10 Health Hazard Evaluation Report No. 2003-0039-2914
upper airway (sore/dry throat) symptoms and asthma have occurred in Yellow and Blue building employees at Hilton Head Elementary School. These health observations are consistent with health effects noted in other studies in buildings with water-damaged environments (due to water leaks or inadequate control of humidity). The earlier environmental report and the NIOSH environmental survey findings are consistent with fungal contamination, amplification, and dissemination within the Yellow and Blue buildings. Both health and environmental findings dictate continued remediation efforts to improve the health of building occupants and to prevent additional health effects.
RECOMMENDATIONS 1. Maintain relative humidity within the range
of 30%-60% (ASHRAE standard). An HVAC specialist should assess whether the current HVAC systems effectively control indoor humidity during all seasons.
2. Investigate the source of the fungal spores on the supply diffusers (as identified by AAA Environmental) in the Blue building. These may be originating from a source upstream or may be due to condensation on the surface of the supply diffusers due to high relative humidity.
3. Identify and repair all causes of water leakage through the roof, walls, floors, and plumbing. Employees should report water incursion promptly to management. Fixing roof leaks is critical in preventing water damage and microbial growth. Simply replacing water-damaged ceiling tiles does not resolve the fundamental problem of water incursion.
4. Replace all carpet that has sustained water damage. Replacement should preferably be done during prolonged school recesses to avoid inadvertent occupant exposures. A containment strategy should be used during the remediation process to limit dispersal of fungi and microbial products throughout the building. It would be prudent to replace the carpet with tile.
5. Air handling units and ventilation duct systems need to be maintained and kept dry. The combination of soiled duct liners and presence of water inside air handling units is conducive to microbial growth. Consult heating, ventilation, and air-conditioning experts to check internal duct insulation for microbial contamination and dust accumulation. If these experts find that the internal insulation material is contaminated with mold, plan to remove the material in affected areas. (Little research has been conducted to demonstrate the effectiveness of most biocides when used inside ducts. The EPA has not registered any biocides for this use.18) Condition air sufficiently to prevent humid air from condensing in supply ducts and on internal surfaces.
6. Prepare a schedule for all building remediation and HVAC system replacement and share this with employees.
7. Plan and implement HVAC system routine maintenance schedules (e.g., system operating within proper specifications, filter inspection/change-out schedule, inspection for signs of water incursion/condensation and excess dust accumulation).
8. Once properly designed air handling units are in place, ensure that adequate outdoor air (15 cubic feet per minute per occupant) is being provided to the building occupants, particularly during periods of transient high occupant density. The first priority is to control the relative humidity of incoming air. To maximize outdoor air exchange at the expense of adequate conditioning of incoming air may be counterproductive.
9. Employees with continuing work-related lower respiratory symptoms should seek medical evaluation. We suggest that peak expiratory flow rates and/or spirometry measurements be recorded over a several week period while at work and at home to objectively document whether these employees are experiencing work-related asthma. Other medical evaluation is required for evaluation and documentation of work-related hypersensitivity pneumonitis.
Health Hazard Evaluation Report No. 2003-0039-2914 Page 11
REFERENCES 1. Apte MG, Fisk WJ, Daisey JM [2000]. Associations between indoor CO2 concentrations and sick building syndrome symptoms in U.S. office buildings: an analysis of the 1994-1996 BASE study data. Indoor Air 10(4):246-257.
2. CDC [1996]. Third National Health and Nutrition Examination Survey, 1988-1994, NHANES III Examination Data File [CD-ROM]. Hyattsville, Maryland: U.S. Department of Health and Human Services, Public Health Service, Centers for Disease Control and Prevention. (Public use data file documentations No. 76300).
3. Centers for Disease Control and Prevention [2003]. Self-reported asthma prevalence and control among adults – United States, 2001. MMWR 52:381-384.
4. Flannigan G, Miller JD [2001]. Microbial growth in indoor work environments. London and New York: Taylor and Francis; pp. 35-67.
5. American Society of Heating, Refrigerating, and Air-Conditioning Engineers [2001]. ASHRAE 62-2001: Ventilation for acceptable indoor air quality. Atlanta, GA: ASHRAE.
6. American Conference of Governmental Industrial Hygienists [1999]. Bioaerosols: assessment and control. Cincinnati, OH: ACGIH.
7. Wan GH, Li CS [1999]. Indoor endotoxin and glucan in association with airway inflammation and systemic symptoms. Arch of Environ Health 54(3):172-179.
8. Rao CY, Burge HA, Chang JCS [1996]. Review of quantitative standards and guidelines for fungi in indoor air. J Air Waste Manag Assoc 46(9):899-908.
9. NIOSH [2003]. Hazard evaluation and technical assistance report: Somerset County Assistance Office, Somerset, PA. Cincinnati, OH: U.S. Department of Health and Human Services, Public Health Service, Centers for Disease Control and Prevention, National Institute for Occupational Safety and Health, NIOSH HETA Report No. 2001 0067 2896.
10. American Society of Heating, Refrigerating, and Air-Conditioning Engineers [1992]. ASHRAE 55-1992: Thermal environmental conditions for human occupancy. Atlanta, GA: ASHRAE.
11. Jaakkola J, Miettinen P [1995]. Ventilation rate in office buildings and sick building syndrome. Occup Environ Med 52:709-714.
12. Seppanen O, Fisk W, Mendell M [1999]. Association of ventilation rates and CO2 concentrations with health and other responses in commercial and institutional buildings. Indoor Air 9:226-252.
13. Dales RE, Burnett R, Zwanenburg H [1991]. Adverse health effects among adults exposed to home dampness and molds. Am Rev Respir Dis 143(3):505-509.
14. Thorn A, Lewne M, Belin L [1996]. Allergic alveolitis in a school environment. Scand J Work Environ Health 22(4):311-314.
15. Apostolakos MJ, Rossmoore H, Beckett WS [2001]. Hypersensitivity pneumonitis from ordinary residential exposures. Environ Health Perspect 109(9):979-981.
16. Jacobs RL, Andrews CP [2003]. Hypersensitivity pneumonia-nonspecific interstitial pneumonia/fibrosis histopathologic presentation: a study in diagnosis and long-term management. Ann Allergy Asthma Immunol 90(2):265-270.
17. Cormier Y [1998]. Hypersensitivity pneumonitis. In: Rom WN, editor. Environmental and occupational medicine. Philadelphia, PA: Lippincott-Raven; pp. 457-465.
18. Environmental Protection Agency [1997]. Should you have the ducts in your home cleaned? [online]. [cited 2003 Jun 16]. Available from URL: http//www.epa.gov/iaq/ pubs/airduct.html.
Page 12 Health Hazard Evaluation Report No. 2003-0039-2914
Table 1. Total and class- or taxa-specific fungal spore concentrations, measured by Air-O-Cell cassettes over a 5-minute period, in fungal spores per cubic meter air (spores/m3) and relative percentages of total, by location (Hilton Head Elementary School, February 2003)
Basidiospores Cladosporium Penicillium/ Aspergillus Other Total
Average 32.7 73 Average 35.3 72.6 Average 36.6 71.7
Page 14 Health Hazard Evaluation Report No. 2003-0039-2914
Table 3. Carbon dioxide concentration in parts per million parts air by volume (ppm), by location and time (Hilton Head Elementary School, February 2003)
Smoking Status: Current smoker (%) Former smoker (%) Never smoker (%)
6/63 (9.5)
14/63 (22.2) 43/63 (68.2)
11/93 (11.8) 23/93 (24.7) 59/93 (63.4)
6/54 (11.1) 14/54 (25.9) 34/54 (63.0)
19/207(9.2)
54/207 (26.1) 134/207 (64.7)
Page 16 Health Hazard Evaluation Report No. 2003-0039-2914
Table 6. Prevalence rates of current lower respiratory symptoms, by building (Hilton Head Elementary School, February 2003)
Prevalence rates of symptoms
without regard to work-relatedness (%)
Prevalence rates of symptoms which improved away from work
(%)
Symptoms present at
least 1-3 times per week
within the last 4 weeks
Yellow Building
Blue Building
Red Building
Yellow Building
Blue Building
Red Building
Wheeze 6/62 (9.7)
6/92 (6.5)
3/52 (5.8)
5/62 (8.1)
4/92 (4.4)
0/52 (0)
Chest Tightness
5/59 (8.5)
7/90 (7.8)
3/53 (5.7)
5/59 (8.5)
3/90 (3.3)
2/53 (3.8)
Shortness of Breath
2/58 (3.4)
9/88 (10.2)
2/52 (3.8)
2/58 (3.4)
5/88 (5.7)
1/52 (1.9)
Cough 12/62 (19.4)
13/93 (14.0)
10/54 (18.5)
11/61 (18.0)
7/93 (7.5)
3/54 (5.6)
Broken sleep due to breathing difficulty
4/57 (7.0)
11/92 (12.0)
2/51 (3.9)
2/55 (3.6)
4/90 (4.4)
0/51 (0)
Wheeze, chest tightness, shortness of breath, or sleep broken due to breathing difficulty
13/65 (20.0)
23/93 (24.7)
14/55 (25.4)
13/65 (20.0)
12/93 (12.9)
5/55 (9.1)
Health Hazard Evaluation Report No. 2003-0039-2914 Page 17
Table 7. Prevalence rate ratios of current lower respiratory symptoms, Yellow and Blue buildings (individually and combined) compared to Red building (Hilton Head Elementary School, February 2003)
Prevalence Rate Ratios †
Symptoms present at least 1-3 times per week within the last 4 weeks
Yellow Building vs Red Building
Blue Building vs Red Building
Yellow and Blue Buildings
combined vs Red Building
Wheeze 1.8 1.1 1.4 Chest tightness 1.6 1.4 1.5 Shortness of breath 0.9 2.7 2.0 Cough 1.1 0.8 0.9 Broken sleep due to breathing difficulty 1.9 3.1 2.6
Wheeze, chest tightness, shortness of breath, or sleep broken due to breathing difficulty
0.8 1.0 0.9
No prevalence rate ratios were statistically significant (p<0.05). † 8 employees who reported working in more than one building or module were not included.
Page 18 Health Hazard Evaluation Report No. 2003-0039-2914
Table 8. Prevalence rate ratios of current work-related lower respiratory symptoms, Yellow and Blue buildings (individually and combined) compared to Red building and BASE (Hilton Head Elementary School, February 2003)
Prevalence Rate Ratios†
Symptoms present at least 1-3 times per week within the last 4 weeks and which improved away from work
Yellow Building vs
Red Building
Blue Building vs
Red Building
Yellow and Blue
Buildings Combined
vs Red Building
Yellow and Blue Buildings Combined vs BASE
Wheeze ID ID ID 2.6* Chest tightness 2.4 0.9 1.5 2.4* Shortness of breath 1.9 3.0 2.6 2.5* Cough 3.4* 1.4 2.1 2.4* Broken sleep due to breathing difficulty ID ID ID ---
Wheeze, chest tightness, shortness of breath, cough, or sleep broken due to breathing difficulty
2.3 1.4 1.8 ---
The BASE study analyzed health questionnaire data collected on workers in 41 large U.S. office buildings. * statistically significant (p < 0.05) † 8 employees who reported working in more than one building or module were not included. ID: prevalence rate ratios were indeterminate due to the absence of employees in the Red building reporting current wheeze or broken sleep due to breathing difficulty, resulting in a denominator of zero. No prevalence rate ratio was calculated for the BASE comparison for the last two symptom categories because the BASE survey did not include the last symptom (sleep broken due to breathing difficulty).
Health Hazard Evaluation Report No. 2003-0039-2914 Page 19
Table 9. Prevalence rates of recent lower respiratory symptoms, by building and work- relatedness (Hilton Head Elementary School, February 2003)
Prevalence rates of symptoms without regard to work-
relatedness (%)
Prevalence rates of symptoms, which improved away from work
(%)
Symptoms which
occurred within the
last 12 months
Yellow Building
Blue Building
Red Building
Yellow Building
Blue Building
Red Building
Wheeze 23/62 (37.1)
33/92 (35.9)
10/52 (19.2)
13/60 (21.7)
18/89 (20.2)
5/51 (9.8)
Chest Tightness
20/59 (33.9)
32/90 (35.6)
12/53 (22.6)
13/59 (22.0)
19/88 (21.6)
5/52 (9.6)
Shortness of Breath
14/58 (24.1)
26/88 (29.6)
10/52 (19.2)
7/55 (12.7)
16/85 (18.8)
4/51 (7.8)
Cough 33/62 (53.2)
57/93 (61.3)
23/54 (42.6)
19/55 (34.6)
29/91 (31.9)
9/54 (16.7)
Broken sleep due to breathing difficulty
11/57 (19.3)
31/92 (33.7)
4/51 (7.8)
3/49 (6.1)
15/85 (17.6)
0/50 (0)
Wheeze, chest tightness, shortness of breath, or sleep broken due to breathing difficulty
40/65 (61.5)
60/93 (64.5)
26/55 (47.3)
28/65 (43.1)
35/93 (37.6)
10/55 (18.2)
Page 20 Health Hazard Evaluation Report No. 2003-0039-2914
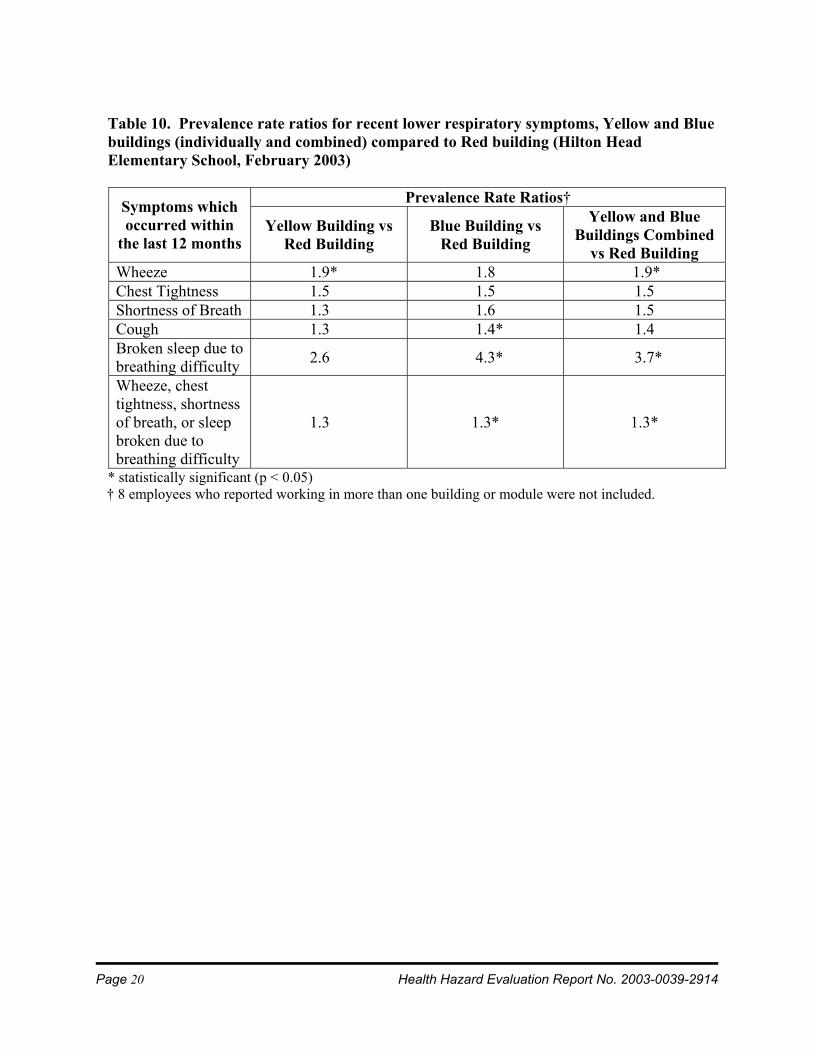
Table 10. Prevalence rate ratios for recent lower respiratory symptoms, Yellow and Blue buildings (individually and combined) compared to Red building (Hilton Head Elementary School, February 2003)
Prevalence Rate Ratios† Symptoms which occurred within
the last 12 months Yellow Building vs
Red Building Blue Building vs
Red Building
Yellow and Blue Buildings Combined
vs Red Building Wheeze 1.9* 1.8 1.9* Chest Tightness 1.5 1.5 1.5 Shortness of Breath 1.3 1.6 1.5 Cough 1.3 1.4* 1.4 Broken sleep due to breathing difficulty 2.6 4.3* 3.7*
Wheeze, chest tightness, shortness of breath, or sleep broken due to breathing difficulty
1.3 1.3* 1.3*
* statistically significant (p < 0.05) † 8 employees who reported working in more than one building or module were not included.
Health Hazard Evaluation Report No. 2003-0039-2914 Page 21
Table 11. Prevalence rate ratios for current work-related lower respiratory symptoms, Yellow and Blue buildings (individually and combined) compared to Red building (Hilton Head Elementary School, February 2003)
Prevalence Rate Ratios† Symptoms which
occurred within the last 12
months and which improved away
from work
Yellow Building vs Red Building
Blue Building vs Red Building
Yellow and Blue Buildings Combined
vs Red Building
Wheeze 2.3 2.1 2.2 Chest Tightness 2.4 2.3 2.3 Shortness of Breath 1.7 2.4 2.2 Cough 2.1* 1.8 1.9* Broken sleep due to breathing difficulty ID ID ID
Wheeze, chest tightness, shortness of breath, or sleep broken due to breathing difficulty
2.4* 2.0* 2.2*
* statistically significant (p < 0.05) † 8 employees who reported working in more than one building or module were not included. ID: prevalence rate ratios were indeterminate due to the absence of employees in the Red building reporting work-related broken sleep due to breathing difficulty within the last 12 months.
Page 22 Health Hazard Evaluation Report No. 2003-0039-2914
Table 12A. Prevalence rates for one or more post-hire lower respiratory, upper respiratory, or hypersensitivity pneumonitis-like symptoms, by building (Hilton Head Elementary School, February 2003)
Prevalence Rates Symptoms with post-hire onset Yellow
Building Blue
Building Red
Building Lower Respiratory Symptoms (wheeze, chest tightness, shortness of breath, cough, or broken sleep)
Hypersensitivity Pneumonitis-Like Symptoms (fever/chills, flu-like achiness/muscle aches, or unusual tiredness)
27/51 (52.9%)
44/82 (53.7%)
14/52 (26.9%)
Table 12B. Prevalence rate ratios for one or more post-hire lower respiratory, upper respiratory, or hypersensitivity pneumonitis-like symptoms, Yellow and Blue buildings (individually and combined) compared to Red building (Hilton Head Elementary School, February 2003)
Prevalence Rate Ratios†
Symptoms with post-hire onset Yellow Building vs
Red Building
Blue Building vs
Red Building
Yellow and Blue Buildings Combined vs Red Building
Lower Respiratory Symptoms (wheeze, chest tightness, shortness of breath, cough, or broken sleep)
Hypersensitivity Pneumonitis Symptoms (fever/chills, flu-like achiness/muscle aches, or unusual tiredness)
2.3* 2.2* 2.2*
* statistically significant (p < 0.05) † 8 employees who reported working in more than one building or module were not included.
Health Hazard Evaluation Report No. 2003-0039-2914 Page 23
Table 13. Comparison of observed and expected numbers of female employees with wheezing or whistling in chest within the last 12 months to NHANES III data, by age and smoking status (Hilton Head Elementary School, February 2003)
Wheezing within the last 12 months Ever Smokers Never Smokers Age
Number Observed/Expected Number Observed/Expected 17-39 16 1.7 33 2.3* 40-69 44 1.1 86 3.5*
Number: number of employees in category; Observed/Expected: number observed/number expected * statistically significant (p < 0.05) Table 14A. Prevalence rates of current asthma and use of asthma medication in the last year, by building (Hilton Head Elementary School, February 2003)
Prevalence Rates Diagnosis or Medication Use Yellow Building Blue Building Red Building Current Asthma 2/63
(3.2%) 7/93
(7.5%) 6/55
(10.9 %) Asthma medication taken within the last 12 months
12/62 (19.4%)
15/93 (16.1%)
6/55 (10.9 %)
Table 14B. Prevalence rate ratios of current asthma and use of asthma medication in the last year, Yellow and Blue buildings (individually and combined) compared to Red building (Hilton Head Elementary School, February 2003)
Prevalence Rate Ratios†
Diagnosis or Medication Use Yellow Building vs
Red Building
Blue Building vs Red Building
Yellow and Blue Buildings Combined vs Red Building
Current Asthma 0.3 0.7 0.6 Asthma medication taken within the last 12 months 1.8 1.5 1.6
No prevalence rate ratios were statistically significant (p < 0.05) † 8 employees who reported working in more than one building or module were not included.
Page 24 Health Hazard Evaluation Report No. 2003-0039-2914
Table 15. Comparison of observed and expected numbers of female employees with ever-diagnosed and current asthma, using NHANES III data, by age and smoking status (Hilton Head Elementary School, February 2003)
Ever-Diagnosed Asthma Ever Smokers Never Smokers
Age Number Observed/Expected Number Observed/Expected 17-39 16 1.3 33 1.4 40-69 45 0.6 88 2.1*
Current Asthma Ever Smokers Never Smokers
Age Number Observed/Expected Number Observed/Expected 17-39 16 1.8 33 0 40-69 44 0.3 87 2.6*
Number: number of employees in category; Observed/Expected: number observed/number expected * statistically significant (p < 0.05)
Health Hazard Evaluation Report No. 2003-0039-2914 Page 25
Table 16A. Prevalence rates of current work-related upper respiratory and non- respiratory symptoms, by building (Hilton Head Elementary School, February 2003)
Prevalence Rates Symptoms which occurred at least 1-3 times per week
within the last 4 weeks and which improved away
from work
Yellow Building Blue Building Red Building
Watery/Itchy Eyes 10/56 (17.9%)
18/81 (22.2%)
7/53 (13.2%)
Sore/Dry Throat 13/56 (23.2%)
17/87 (19.5%)
4/53 (7.6%)
Headache 13/58 (22.4%)
8/90 (8.9%)
8/53 (15.1%)
Table 16B. Prevalence rate ratios of current work-related upper respiratory and non- respiratory symptoms, Yellow and Blue buildings (individually and combined)
compared to Red building (Hilton Head Elementary School, February 2003)
Prevalence Rate Ratios† Symptoms which occurred at least 1-3 times per week
within the last 4 weeks and which improved away
from work
Yellow Building vs Red Building
Blue Building vs Red Building
Yellow and Blue Buildings Combined vs Red Building
* statistically significant (p < 0.05) † 8 employees who reported working in more than one building or module were not included.
Page 26 Health Hazard Evaluation Report No. 2003-0039-2914
Table 17A. Prevalence rates of recent work-related upper respiratory and non- respiratory symptoms, by building (Hilton Head Elementary School, February 2003)
Prevalence Rates Symptoms which occurred within the last
12 months and which improved away from
work
Yellow Building Blue Building Red Building
Watery/Itchy Eyes 21/50 (42.0%)
33/77 (42.9%)
12/52 (23.1%)
Sore/Dry Throat 25/50 (50.0%)
30/82 (36.6%)
8/50 (16.0%)
Headache 19/53 (35.8%)
22/85 (25.9%)
12/53 (22.6%)
Table 17B. Prevalence rate ratios of current work-related upper respiratory and non- respiratory symptoms, Yellow and Blue buildings (individually and combined) compared to Red building (Hilton Head Elementary School, February 2003)
Prevalence Rate Ratios† Symptoms which occurred within the last
12 months and which improved away from
work
Yellow Building vs Red Building
Blue Building vs Red Building
Yellow and Blue Buildings Combined vs Red Building
* statistically significant (p < 0.05) † 8 employees who reported working in more than one building or module were not included.
Health Hazard Evaluation Report No. 2003-0039-2914 Page 27
Table 18. Comparison of observed and expected numbers of female employees with nose and eye irritation symptoms within the past year, using NHANES III data, by age and smoking status (Hilton Head Elementary School, February 2003)
Stuffy, itchy, or runny nose Ever Smokers Never Smokers
Age Number Observed/Expected Number Observed/Expected 17-39 15 1.3 33 1.3 40-69 43 1.3 86 1.3*
Watery or itchy eyes Ever Smokers Never Smokers
Age Number Observed/Expected Number Observed/Expected 17-39 13 1.4 32 1.5 40-69 45 1.5* 77 1.6*
Number: number of employees in category; Observed/Expected: number observed/number expected * statistically significant (p < 0.05) Table 19. Comparison of observed and expected numbers of female employees with sinus problems or pneumonia within the past year, using NHANES III data, by age and smoking status (Hilton Head Elementary School, February 2003)
Sinusitis or Sinus Problem Ever Smokers Never Smokers
Age Number Observed/Expected Number Observed/Expected 17-39 16 1.6 31 1.5 40-69 44 1.6* 87 1.6*
Pneumonia Ever Smokers Never Smokers
Age Number Observed/Expected Number Observed/Expected 17-39 16 7.5* 30 2.0 40-69 42 2.2 79 2.0
Number: number of employees in category; Observed/Expected: number observed/number expected * statistically significant (p < 0.05)
Page 28 Health Hazard Evaluation Report No. 2003-0039-2914
Figure 1A. Real time monitoring of respirable particles (optical diameter = 0.4-4 µm) in Blue and Red building classrooms (Hilton Head Elementary School, February 2003)
Time
Num
ber o
f Airb
orne
Par
ticle
s (#
of p
artic
les/
m3 )
106
107
108
Room D173 in Blue BuildingRoom K265 in Red Building
3:00 pm 9:00 pm 3:00 am 9:00 am 3:00 pm2/5/03 2/6/03
Health Hazard Evaluation Report No. 2003-0039-2914 Page 29
Figure 1B. Real time monitoring of coarse particles (optical diameter = 4-20 µm) in Blue and Red building classrooms (Hilton Head Elementary School, February 2003)
Time
102
103
104
105
106
Room D173 in Blue BuildingRoom K265 in Red Building
Num
ber o
f Airb
orne
Par
ticle
s (#
of p
artic
les/
m3 )
3:00 pm 9:00 pm 3:00 am 9:00 am 3:00 pm2/5/03 2/6/03
Page 30 Health Hazard Evaluation Report No. 2003-0039-2914
0
5
10
15
20
25
30
35
<198
019
8019
8119
8219
8319
8419
8519
8619
8719
8819
8919
9019
9119
9219
9319
9419
9519
9619
9719
9819
9920
0020
0120
0220
03
Year of Lower Respiratory Symptom Onset
Num
ber o
f Wor
kers
Pre-Hire
Post-Hire
Figure 2. Number of workers with one or more pre-hire lower respiratory symptoms compared to number of workers with one or more post-hire lower respiratory symptoms, by year of onset of respiratory symptom (Hilton Head Elementary School, February 2003)
Health Hazard Evaluation Report No. 2003-0039-2914 Page 31
Appendix A: Summary of AAA Environmental Findings and Recommendations
and Implementation by Hilton Head Elementary School Date Findings Recommendations Implementation
Apr 1999
Yellow Building (R pod) • RH 63%-65% • Very low culturable fungi levels
• Control humidity inside building
• New HVAC systems, flooring, and replacement of ceiling tiles (Q and R pods in Yellow building) in occurred in 2000
Dec 1999
M109 and Blue Building (E pod) • RH 40% • Indoor culturable fungi levels lower than outdoor levels
• Drain HVAC units away from Mobile unit • Install vapor barrier to underside of portable HVAC units in Mobile units during set-up procedure • Install tight-fitting antimicrobial pleated filters in HVAC systems • Use HEPA vacuums when cleaning
Aug 2000
M107 and Yellow Building (N pod) • Odors in rooms • Indoor sample for airborne culturable fungi grew out Penicillium and Aspergillus • Carpet samples from N pod grew out Penicillium, Aspergillus, Stachybotrys, yeast, and gram negative bacteria • Unit ventilators not draining to the outside (because carpet samples grew out fungi, it was thought that the carpet was absorbing the condensation from these unit ventilators) • Ceiling tiles were bowed (due to high humidity)
• Remove carpeting 6 feet from unit ventilators • Clean rooms in N pod with 1:1 bleach:water solution • Maintain written maintenance log for HVAC systems • Consider replacing carpet with an alternative flooring material
• Carpet cut back 18 inches in 2 rooms and not at all in 6 rooms
Page 32 Health Hazard Evaluation Report No. 2003-0039-2914
Jan 2001
Blue Building (E pod) • Fungi species consistent with water intrusion in the carpets
• Use HEPA vacuums • Use water extraction when cleaning carpets • Treat carpets with a biocide
Apr 2002
Red building (G pod) • Bulk samples and bioaerosol samples with non-significant fungi levels and no fungi species specifically associated with water intrusion • Dust build-up in return-air grilles and on the top of ceiling tiles
• Use HEPA vacuums on carpets and HVAC diffusers and grilles • Install prefilters in the return grilles • Clean carpets and treat with biocide • Clean ductwork and then treat with an HVAC-approved biocide • Re-evaluate filtration for proper fit
• HVAC vents vacuumed in some, but not all, areas • Prefilters in some, but not all, return grilles • Only one HEPA vacuum cleaner purchased for the entire school
Sep-Dec 2002
General • October RH measurements high in some rooms (RH humidity levels higher in the early mornings) • Dirty and stained carpets • Dirty and stained HVAC diffuser and grilles • Rusty undersurface of metal ceiling grids in Blue and Yellow buildings (due to high RH) • Bowed ceiling tiles • Corkboard mounted on cement blocks contained fungi Yellow Building • Musty odor (N and P pods) • HVAC unit: poorly fitting filter, water leak, fungal growth on cooling coils • Dirty ductwork • Carpets water stains (due to water running in from under the door from the Secret Garden) • Roof debris on top of ceiling tiles
General • Repair SEMCO units • Prevent water incursion (roof leaks, HVAC leaks, wicking from the ground) • Set carpet lifetime at 5-7 years, and replace with vinyl flooring • Perform a moisture vapor emission test when carpet replaced • Clean all carpet over winter recess using proper cleaning techniques (Use water extractors or dryers so that carpets are dry to touch within 2 hours of cleaning) • Use HEPA vacuum to vacuum • Set humidity level controls at lower than 60% RH (to prevent humidity from reaching levels higher than that)
Yellow Building • Ceiling tiles, ductwork, HVAC units, corkboard, and contaminated drywall removed from Kindergarten area and Media center (using negative- pressure containment) • Carpets and floor tile removed in the Kindergarten area • Contaminated drywall and carpet removed from N300 and N301 • Rented negative-pressure HEPA units with prefilters and charcoal filters (change schedule every two weeks
Health Hazard Evaluation Report No. 2003-0039-2914 Page 33
• Return ducts: heavy dust accumulation (Penicillium/Aspergillus and Cladosporium) • Hallway drywall: Stachybotrys • Books on top of a unit ventilator: fungal growth • Unit ventilators: non-functioning water drain lines (presumably clogged with debris) • Bulk samples from N pod unit ventilators (Aspergillus/Penicillium) • Bioaerosol samples with elevated fungi levels in N and P pods. • Wall: crack near internal wall roof drain (N pod room) with Aspergillus/Penicillium in carpet swab and elevated level of gram negative bacilli in bulk sample from carpet • Carpet adhesive: slightly elevated endotoxin level (N pod) Blue Building • Strong odor (C and D pod) • RH 70% (A111) • Overlapped ductwork fiberglass lining (allows for degradation of exposed ends) • SEMCO units: ductwork dirty (1 unit), standing water inside (2 units), nonfunctioning condenser unit fan (1 unit) • HVAC unit: coils, supply diffusers, and return grilles with debris • HVAC filters: dirty • Supply diffuser: tape sample indicated Cladosporium and Aspergillus/Penicillium; visible fungal growth in supply diffuser in November
• Clean and properly install HVAC supply diffusers • Use HEPA vacuum and bleach and water solution to clean return grilles • Replace wet ceiling tiles (and repair water leak) within 24-48 hours • Waterproof outside surfaces of the building • Clear roof drains of debris • Inspect HVAC systems every 6 months • Repeat bioaerosol sampling following remediation Yellow Building • Replace N and P pod unit ventilators • Remediate carpets • Remediate ceiling tiles Blue Building • Replace HVAC system • Remediate HVAC ductwork • Remediate ceiling tiles, sinks, and carpets • Perform maintenance on SEMCO units • Use a negative air machine (HEPA filter) in Blue building media center and keep outside doors to the room locked
for prefilters and every month for the charcoal filters) Blue Building B133, C147, C148, E192, E193 (December 2002): • Replaced carpet with tile • New ventilation ductwork • Replaced ceiling tiles • Removed wall corkboard and sinks D171, D173, D174, D175, and D180 (December 2002): • Removed corkboards and sinks • Removed ceiling tiles in Room D175 • Negative- pressure HEPA machines in all 5 rooms
Page 34 Health Hazard Evaluation Report No. 2003-0039-2914
• Supply ductwork: Aspergillus and Cladosporium • Ceiling tile: debris on top • Block wall stain: tape lift samples (Aspergillus/ Penicillium) • Backsplash (E pod): fungal growth Red Building • HVAC units: fungal growth (1 unit), missing filter (1 unit), standing water adjacent to cooling coils (1 unit), dirty cooling coils (1 unit) • SEMCO unit: dirty filter • Building exit doors incompletely close • Skylight leak when raining (caused water to pool on the floor; Stachybotrys identified in nearby ceiling tile) • Wet ceiling tiles (different location) Sample Results: • Tape lift samples: identified Penicillium/Aspergillus, Stachybotrys, and Cladosporium • Bulk samples: identified Penicillium, Aspergillus versicolor, and Stachybotrys • Bioaerosol samples: 1) Spore counts (identified Penicillium/Aspergillus sp, Curvularia sp, Basidiospores and Amerospores) 2) Culturable samples (identified Penicillium sp, Aspergillus versicolor, Aspergillus fumigatus, Fusarium sp, Curvularia sp, and Basidiospores)
Health Hazard Evaluation Report No. 2003-0039-2914 Page 35
3) Majority of indoor samples with spore counts lower than outside samples • Polymerase chain reaction analysis for 10 rooms and 2 outside samples: identified Aspergillus fumigatus, Aspergillus niger, Aspergillus sydowii, Chaetomium globosum, Cladosporium cladosporiodes • Endotoxin: two samples with low levels.
Page 36 Health Hazard Evaluation Report No. 2003-0039-2914
Appendix B: Floor Plans
Yellow Building
Health Hazard Evaluation Report No. 2003-0039-2914 Page 37
Blue Building
Page 38 Health Hazard Evaluation Report No. 2003-0039-2914
Red Building
Health Hazard Evaluation Report No. 2003-0039-2914 Page 39
Appendix C: Questionnaire
U.S. DEPARTMENT OF HEALTH AND HUMAN SERVICES
CENTERS FOR DISEASE CONTROL AND PREVENTION
NATIONAL INSTITUTE FOR OCCUPATIONAL SAFETY AND HEALTH
Hilton Head Elementary School
HETA-2003-0039
The National Institute for Occupational Safety and Health (NIOSH) is a part of the United States Public Health Service and an institute within the Division of the Centers for Disease Control and Prevention (CDC) that is concerned with workplace health and safety. We have received a Health Hazard Evaluation request to evaluate health concerns that may be related to your workplace environment. The purpose of this evaluation is to determine if exposures at the school may be associated with health effects in employees. This is a questionnaire about your health history and work history. Although participation is entirely voluntary, NIOSH feels it is important for you to complete the questionnaire in order for the study to be successful. The overall study results (without names or other personal identifying information) will be provided to the requesters and the school; the school is required to post a copy of the final report in a place accessible to employees for a period of 30 days. In addition, if you so request, NIOSH will send you a copy of the final report. All medical and other personal information that you provide NIOSH is considered confidential in accordance with the Privacy Act of 1974 (Public Law 93-579). The information you provide NIOSH will be used for statistical and research purposes and will be summarized so that no individual is identified. All information is stored at NIOSH until destroyed. Management will not see your response. “BY COMPLETING THIS QUESTIONNAIRE, YOU INDICATE YOUR CONSENT TO PARTICIPATE IN THIS STUDY.”
Thank you for your participation.
Form Approved OMB No. 0920-0260 Expires June 3, 2004
Page 40 Health Hazard Evaluation Report No. 2003-0039-2914
1. Date: 02/__ __/2003 2. Name: _________________ ______ _______________________ First MI Last 3. Gender: Male Female 4. Date of Birth __ __ / __ __ / __ __ __ __ 5. During the past 12 months, have you had any of the following symptoms? If you answered YES to any of the above symptoms, then during your lifetime, when did the first symptom start? __ __/__ __ __ __ Month Year
SYMPTOMS
NOCheck one or both if applicable. When away from the school were
your symptoms (check only one):
Anytime in the past 12
months Same
At least 1 to 3 days per week
in the last 4 weeks
Wheezing or whistling in your chest
Chest Tightness
Shortness of breath
Cough
Sleep ever been broken by difficulty with breathing
Worse Better
Month Day Year
YES
Health Hazard Evaluation Report No. 2003-0039-2914 Page 41
6. During the past 12 months, have you had any of the following symptoms? If you answered YES to any of the above symptoms, then during your lifetime, when did the first symptom start? __ __/__ __ __ __ Month Year 7. During the past 12 months, have you had any of the following symptoms? If you answered YES to any of the above symptoms, then during your lifetime, when did the first symptom start? __ __/__ __ __ __ Month Year
SYMPTOMS
NOCheck one or both if applicable.
Anytime in the past 12
months
Episodes of fever or chills
Episodes of flu-like achiness or achy joints
Unusual tiredness or fatigue
SYMPTOMS
NO
Check one or both if applicable.
Stuffy, itchy or runny nose
Sneezing
Watery or itchy eyes
Sore or dry throat
Anytime in the past 12
months
When away from the school were your symptoms (check only one):
Same Worse Better
When away from the school were your symptoms (check only one):
Same Worse Better
At least 1 to 3 days per week
in the last 4 weeks
At least 1 to 3 days per week
in the last 4 weeks
YES
YES
Page 42 Health Hazard Evaluation Report No. 2003-0039-2914
8. During the past 12 months, have you had any of the following symptoms? If you answered YES to any of the above symptoms, then during your lifetime, when did the first symptom start? __ __/__ __ __ __ Month Year 9. During the past 12 months, have you had any of the following conditions?
SYMPTOMS
NOCheck one or both if applicable.
Anytime in the past 12
months
Drowsiness
Difficulty remembering things or concentrating
Headache
Dry or itchy skin
Skin rash
CONDITION NO YES IF YES, how many episodes have you had in the past 12 months?
Cold or flu ________ number of episodes
Sinusitis or sinus problems
________ number of episodes
Pneumonia ________ number of episodes
When away from the school were your symptoms (check only one):
Same Worse Better
At least 1 to 3 days per week
in the last 4 weeks
YES
Health Hazard Evaluation Report No. 2003-0039-2914 Page 43
10. Are you troubled by shortness of breath when hurrying on level ground or walking up a slight hill? 11. Do you get short of breath walking with other people of your own age on level ground? 12. Do you usually cough on most days for 3 consecutive months or more during the year? IF YES: 12a. For how many years have you had this cough? ________Yrs 13. Do you bring up phlegm on most days for 3 consecutive months or more during the year? IF YES: 13a. For how many years have you had trouble ________Yrs with phlegm? 14. Has a doctor ever told you that you had asthma?
IF YES: 14a. Date of diagnosis: 14b. Do you still have asthma?
15. Has a doctor ever told you that you have hypersensitivity pneumonitis?
IF YES: 15a. Date of diagnosis:
16. In the past 12 months, have you taken any medication for asthma or wheezing? 17. In the past 12 months, have you taken antihistamines for more than two weeks? 18. Have you smoked at least 100 cigarettes during your entire life? (approximately 5 packs) IF YES: 18a. Do you smoke cigarettes now?
__ __ /__ __ __ __ Month Year
__ __ /__ __ __ __ Month Year
Yes No
Yes No
Yes No
Yes No
Yes No
Yes No
Yes No
Yes No
Yes No
Yes No
Yes No
Page 44 Health Hazard Evaluation Report No. 2003-0039-2914
Work Information 19. When did you start working at Hilton Head Elementary School? __ __ / __ __ __ __ Month Year 20. What is your job category? (choose one)
21. Please indicate where you currently work. Building Room Number(s) (if applicable)
Teacher / Assistant
Media Specialist
Counselor
Administrative / Clerical
Nurse
Technology Staff
Custodial
Maintenance
Food Service
Other
If other, please specify___________________________
___________________________
Blue Red Yellow Module
Health Hazard Evaluation Report No. 2003-0039-2914 Page 45
22. Have you had symptoms that you think may be related to Hilton Head Elementary School? IF YES: 22a. When did those symptoms begin? __ __ / __ __ __ __ Month Year
22b. Please indicate where those symptoms began. Building Room Number(s) (if applicable)
23. Do you have any comments or concerns that might contribute to our evaluation?
Yes No
Blue Red Yellow Module
Page 46 Health Hazard Evaluation Report No. 2003-0039-2914
Appendix D: Yellow Building Ventilation Systems (Hilton Head Elementary School, February 2003)
Yellow Building – M Pod (Renovated in 2000)
Outside air
Dehumidifier
New AHU
PLENUM
Classroom
Ret
urn
air
Supp
ly a
ir
Health Hazard Evaluation Report No. 2003-0039-2914 Page 47
Yellow Building – N & P Pods
PLENUM
Classroom Classroom
Outside air
Outside air
Page 48 Health Hazard Evaluation Report No. 2003-0039-2914
Yellow Building – Q & R Pods
AHU
Supp
ly a
ir
Ret
urn
air
PLENUM
Classroom Classroom
HVAC HVAC
ROOF TOP
Outside air
Health Hazard Evaluation Report No. 2003-0039-2914 Page 49
Appendix E: Blue Building Ventilation System (Hilton Head Elementary School, February 2003)
Blue Building
Outside air
AHU
Supp
ly a
ir
Ret
urn
air
PLENUM
Classroom Classroom
HVAC HVAC
Page 50 Health Hazard Evaluation Report No. 2003-0039-2914
Blue Building
Outside air
AHU
Supp
ly a
ir
Ret
urn
air
PLENUM
Classroom Classroom
HVAC HVAC
Health Hazard Evaluation Report No. 2003-0039-2914 Page 51
Appendix F: Red Building Ventilation System (Hilton Head Elementary School, February 2003)
Red Building
AHU
Supp
ly a
ir
Ret
urn
air
PLENUM
Classroom Classroom
ROOF TOPHVAC
Outside air
Page 52 Health Hazard Evaluation Report No. 2003-0039-2914
Appendix G: Evaluation Criteria
As a guide to the evaluation of the hazards posed by workplace exposures, NIOSH field staff employ environmental evaluation criteria for the assessment of a number of chemical and physical agents. The primary sources of environmental evaluation criteria for the workplace are: (1) NIOSH Recommended Exposure Limits (RELs),1 (2) the American Conference of Governmental Industrial Hygienists’ (ACGIH®) Threshold Limit Values (TLVs®),2 and (3) the U.S. Department of Labor, Occupational Safety and Health Administration (OSHA) Permissible Exposure Limits (PELs).3 OSHA requires an employer to furnish employees a place of employment that is free from recognized hazards that are causing or are likely to cause death or serious physical harm [Occupational Safety and Health Act of 1970, Public Law 91–596, sec.5(a)(1)]. Thus, employers should understand that not all hazardous agents have specific OSHA exposure limits such as PELs and short-term exposure limits (STELs). An employer is still required by OSHA to protect their employees from hazards, even in the absence of a specific OSHA PEL. Microbiologicals Microorganisms are ubiquitous in the indoor environment. All microorganisms produce antigen–molecules (often proteins or polysaccharides) that stimulate the immune system. A single exposure to an antigen may result in sensitization. If the sensitized person is re-exposed to the same antigen, a hypersensitive or allergic response may occur to a level of antigen that would elicit little or no reaction from nonsensitized persons. Allergic reactions to inhaled antigens may be limited to the upper respiratory tract (e.g., allergic rhinitis), or they may affect the distal airways (e.g., allergic asthma) or the distal portions of the lung (e.g., hypersensitivity pneumonitis). No standards or guidelines have been set by NIOSH, OSHA, or ACGIH® for culturable or countable bioaerosols.4 The ACGIH policy5 is that a general TLV® for culturable or countable bioaerosol is currently not scientifically supportable because: 1. Culturable microorganisms and countable biological particles do not comprise a single entity. 2. Human responses to bioaerosols range from innocuous effects to serious, even fatal, diseases
depending on the specific material involved and employees’ susceptibility to it. 3. It is not possible to collect and evaluate all bioaerosol components using a single sampling
method (different methods of collection and analyses may result in different estimates of concentration).
4. At present, information relating culturable or countable bioaerosol concentrations to health effects is generally insufficient to describe exposure-response relationships.
“Specific TLVs® for individual culturable or countable bioaerosols have not been established to prevent hypersensitivity, irritant, or toxic responses. At present, information relating culturable or countable bioaerosol exposure to health effects consists largely of case reports and qualitative exposure assessments.”5 Therefore, results of airborne bacteria and fungi air sampling should not be used for compliance testing. Air sampling for microbials provides short-term “snapshot” which may not be representative of the fungal conditions over the whole work day or under different environmental conditions. Because of the limitations in air sampling for fungi and bacteria, air sampling results should not be used to prove a negative case. Microbes in air vary seasonally, diurnally, and with occupant
Health Hazard Evaluation Report No. 2003-0039-2914 Page 53
activity level. These data should be used to help characterize the microbial environment rather than to evaluate levels as safe or hazardous. Particle Concentration No standards or guidelines have been set by NIOSH, OSHA, or ACGIH® for particle concentrations. Therefore, results of indoor particle concentrations should not be used for compliance testing. These data should be used to help characterize the indoor environment rather than to evaluate levels as safe or hazardous. Carbon Dioxide Carbon dioxide (CO2) is a normal constituent of exhaled breath and a product of combustion. High concentrations of CO2, a colorless, odorless gas which displaces oxygen, can cause death. Lower concentrations can cause symptoms such as headache, sweating, rapid breathing, and increased heart rate. CO2 measurements can be used to assess adequacy of air supply to indoor environments. The American Society of Heating, Refrigerating, and Air-Conditioning Engineers (ASHRAE) Standard 6 recommends an indoor to outdoor differential concentration not greater than 700 ppm of CO2 . The average outdoor (ambient) CO2 concentration is assumed to be 300 ppm. When indoor CO2 concentrations exceed 1000 ppm, inadequate ventilation is suspected. Elevated CO2 concentrations suggest that other indoor contaminants may also be increased. It is important to note that CO2 is not an effective indicator of ventilation adequacy if the ventilated area is not occupied at its usual level. The OSHA PEL (8-hour time-weighted average (TWA)), ACGIH® TLV® (8-hour TWA), and NIOSH REL (10-hour TWA) is 5,000 ppm for carbon dioxide. These exposure limits apply to industrial, not indoor, work environments. Relative Humidity, Temperature, and Outdoor Air Exchange Rate The American Society of Heating, Refrigerating, and Air-Conditioning Engineers (ASHRAE) recommends that relative humidity in indoor environments be maintained between 30% and 60% RH.6
ASHRAE recommends that the indoor temperature range provide for occupant comfort.7 ASHRAE also recommends an outdoor air exchange rate for schools of 15 cubic feet per minute per person (this assumes that the occupancy rate does not exceed 50 persons per 1000 cubic feet).6 1. NIOSH [2003]. Pocket guide to chemical hazards. Cincinnati, OH: U.S. Department of Health and Human Services, Public Health Service, Centers for Disease Control and Prevention, National Institute for Occupational Safety and Health, DHHS (NIOSH) publication No.97-140. 2. ACGIH [2003]. 2003 TLVs® and BEIs®; threshold limit values for chemical substances and physical agents. Cincinnati, OH: American Conference of Governmental Industrial Hygienists. 3. CFR [1997]. 29 CFR 1910.1000 Code of Federal Regulations. Washington, DC: U.S. Government Printing Office, Office of the Federal Register. 4. Rao CY, Burge HA, Chang JCS [1996]. Review of quantitative standards and guidelines for fungi in indoor air. J Air Waste Manag Assoc 46(9):899-908.
Page 54 Health Hazard Evaluation Report No. 2003-0039-2914
5. American Conference of Governmental Industrial Hygienists [1999]. Bioaerosols: assessment and control. Cincinnati, OH: ACGIH. 6. American Society of Heating, Refrigerating, and Air-Conditioning Engineers [2001]. ASHRAE 62-2001: Ventilation for acceptable indoor air quality. Atlanta, GA: ASHRAE. 7. American Society of Heating, Refrigerating, and Air-Conditioning Engineers [1992]. ASHRAE 55-1992: Thermal environmental conditions for human occupancy. Atlanta, GA: ASHRAE.
Health Hazard Evaluation Report No. 2003-0039-2914 Page 55
DEPARTMENT OF HEALTH AND HUMAN SERVICES Centers for Disease Control and Prevention National Institute for Occupational Safety and Health 4676 Columbia Parkway Cincinnati, OH 45226-1998 OFFICIAL BUSINESS Penalty for private use $300
Delivering on the Nation's promise: Safety and Health at work for all people through research and prevention
To receive NIOSH documents or information about occupational Safety and Health topics