Characterization of goat colostrum oligosaccharides by nano- liquid chromatography on chip quadrupole time-of-flight mass spectrometry and hydrophilic interaction liquid chromatography-quadrupole mass spectrometry A. Martín-Ortiz a , J. Salcedo b , D. Barile b , A. Bunyatratchata b , F.J. Moreno c , I. Martin-García d , A. Clemente d , M.L. Sanz a,* , and A.I. Ruiz-Matute a a Instituto de Química Orgánica General (CSIC), Juan de la Cierva 3, 28006 Madrid, Spain b Department of Food Science and Technology, University of California Davis, One Shields Avenue, Davis, CA 95616, USA c Instituto de Investigación en Ciencias de la Alimentación, CIAL (CSIC-UAM), Universidad Autónoma de Madrid, C/Nicolás Cabrera 9, Campus de Cantoblanco, 28049 Madrid, Spain d Estación Experimental del Zaidín, Consejo Superior de Investigaciones Científicas (CSIC), Profesor Albareda 1, 18008 Granada, Spain Abstract A detailed qualitative and quantitative characterization of goat colostrum oligosaccharides (GCO) has been carried out for the first time. Defatted and deproteinized colostrum samples, previously treated by size exclusion chromatography (SEC) to remove lactose, were analyzed by nanoflow liquid chromatography-quadrupole-time of flight mass spectrometry (Nano-LC-Chip-Q-TOF MS). Up to 78 oligosaccharides containing hexose, hexosamine, fucose, N-acetylneuraminic acid or N- glycolylneuraminic acid monomeric units were identified in the samples, some of them detected for the first time in goat colostra. As a second step, a hydrophilic interaction liquid chromatography coupled to mass spectrometry (HILIC-MS) methodology was developed for the separation and quantitation of the main GCO, both acidic and neutral carbohydrates. Among other experimental chromatographic conditions, mobile phase additives and column temperature were evaluated in terms of retention time, resolution, peak width and symmetry of target carbohydrates. Narrow peaks (w h : 0.2–0.6 min) and good symmetry (A s : 0.8–1.4) were obtained for GCO using an acetonitrile:water gradient with 0.1% ammonium hydroxide at 40 °C. These conditions were selected to quantify the main oligosaccharides in goat colostrum samples. Values ranging from 140 to 315 mg L −1 for neutral oligosaccharides and from 83 to 251 mg L −1 for acidic oligosaccharides were found. The combination of both techniques resulted to be useful to achieve a comprehensive characterization of GCO. * Corresponding author. [email protected] (M.L. Sanz). Appendix A. Supplementary data Supplementary data associated with this article can be found, in the online version, at http://dx.doi.org/10.1016/j.chroma.2015.09.060. HHS Public Access Author manuscript J Chromatogr A. Author manuscript; available in PMC 2016 February 02. Published in final edited form as: J Chromatogr A. 2016 January 8; 1428: 143–153. doi:10.1016/j.chroma.2015.09.060. Author Manuscript Author Manuscript Author Manuscript Author Manuscript
Transcript
Characterization of goat colostrum oligosaccharides by nano-liquid chromatography on chip quadrupole time-of-flight mass spectrometry and hydrophilic interaction liquid chromatography-quadrupole mass spectrometry
A. Martín-Ortiza, J. Salcedob, D. Barileb, A. Bunyatratchatab, F.J. Morenoc, I. Martin-Garcíad, A. Clemented, M.L. Sanza,*, and A.I. Ruiz-Matutea
aInstituto de Química Orgánica General (CSIC), Juan de la Cierva 3, 28006 Madrid, Spain
bDepartment of Food Science and Technology, University of California Davis, One Shields Avenue, Davis, CA 95616, USA
cInstituto de Investigación en Ciencias de la Alimentación, CIAL (CSIC-UAM), Universidad Autónoma de Madrid, C/Nicolás Cabrera 9, Campus de Cantoblanco, 28049 Madrid, Spain
dEstación Experimental del Zaidín, Consejo Superior de Investigaciones Científicas (CSIC), Profesor Albareda 1, 18008 Granada, Spain
Abstract
A detailed qualitative and quantitative characterization of goat colostrum oligosaccharides (GCO)
has been carried out for the first time. Defatted and deproteinized colostrum samples, previously
treated by size exclusion chromatography (SEC) to remove lactose, were analyzed by nanoflow
liquid chromatography-quadrupole-time of flight mass spectrometry (Nano-LC-Chip-Q-TOF MS).
Up to 78 oligosaccharides containing hexose, hexosamine, fucose, N-acetylneuraminic acid or N-
glycolylneuraminic acid monomeric units were identified in the samples, some of them detected
for the first time in goat colostra. As a second step, a hydrophilic interaction liquid
chromatography coupled to mass spectrometry (HILIC-MS) methodology was developed for the
separation and quantitation of the main GCO, both acidic and neutral carbohydrates. Among other
experimental chromatographic conditions, mobile phase additives and column temperature were
evaluated in terms of retention time, resolution, peak width and symmetry of target carbohydrates.
Narrow peaks (wh: 0.2–0.6 min) and good symmetry (As: 0.8–1.4) were obtained for GCO using
an acetonitrile:water gradient with 0.1% ammonium hydroxide at 40 °C. These conditions were
selected to quantify the main oligosaccharides in goat colostrum samples. Values ranging from
140 to 315 mg L−1 for neutral oligosaccharides and from 83 to 251 mg L−1 for acidic
oligosaccharides were found. The combination of both techniques resulted to be useful to achieve
Appendix A. Supplementary dataSupplementary data associated with this article can be found, in the online version, at http://dx.doi.org/10.1016/j.chroma.2015.09.060.
HHS Public AccessAuthor manuscriptJ Chromatogr A. Author manuscript; available in PMC 2016 February 02.
Published in final edited form as:J Chromatogr A. 2016 January 8; 1428: 143–153. doi:10.1016/j.chroma.2015.09.060.
size, Waters (Hertfordshire, UK) at a flow rate of 0.4 mL min−1. Different binary gradients
consisting of acetonitrile (ACN):water with addition of different additives (0.1% ammonium
Martín-Ortiz et al. Page 5
J Chromatogr A. Author manuscript; available in PMC 2016 February 02.
Author M
anuscriptA
uthor Manuscript
Author M
anuscriptA
uthor Manuscript
hydroxide, 0.1% acetic acid or 5 mM ammonium acetate) and column temperatures (30–60
°C) were assayed. Injection volume was 5 µL.
The electrospray ionization source was operated under positive or negative polarity using
the following MS parameters: capillary voltage, 4kV; temperature, 300 °C; nitrogen drying
gas flow, 12 L min−1; nebulizer (N2, 99.5% purity) pressure, 276kPa; and fragmentor
voltage, 80–110 V. Adducts formed under optimal conditions were evaluated. In positive
mode, mono-sodiated adducts [M+Na]+ were primarily formed for the different samples and
only minor abundances of [M+K]+ and [M+H]+ were observed. Similarly, in negative mode,
[M−H]− were detected. Therefore, ions corresponding to [M+Na]+ in positive mode and [M
−H]− in negative mode of the oligosaccharides under analysis were monitored in SIM mode
using default variable fragmentor voltages. Data were processed using HPChem Station
software version 10.02 (Hewlett-Packard, Palo Alto, CA, USA).
Optimization of the method was carried out on the basis of RT, peak width at half height
(wh), peak tailing measured by the peak asymmetry factor (As): calculated as the ratio of the
back half to front half widths at 10% of the peak height, and resolution (Rs), calculated as
2(tR2 −tR1)/(wb1 +wb2), where 1 and 2 refer to two consecutive eluting carbohydrates and
wb is the peak width at base. Rs values should be higher than 1.0 to get an appropriate
separation and As close to 1 to get symmetric peaks.
Quantitative analysis was performed in triplicate by the external standard method, using
calibration curves within the range 0.25–100 mg L−1 for maltotriose, maltotetraose, 2′-FL,
3′-SL and 6′-SL. Prior to quantitation of OS in all colostrum samples, matrix effect was
evaluated by quantifying target analytes in solutions of CS5 before and after SEC treatment
diluted in water at different ratios (1:1–1:50, v/v). Reproducibility of the method was
estimated on the basis of the intra-day and inter-day precision, calculated as the relative
standard deviation (RSD) of retention times and concentrations of oligosaccharide standards
obtained in n = 5 independent measurements. Limit of detection (LOD) and limit of
quantitation (LOQ) were calculated as three and ten times, respectively, the signal to noise
ratio (S/N).
3. Results and discussion
3.1. Qualitative analysis of goat colostrum oligosaccharides
Several studies have pointed out the efficiency of MS related techniques to characterize OS
from different biological fluids [24,25,29].The Nano-LC-Chip-Q-TOF MS system is an
excellent tool for oligosaccharide characterization in different mammal milks, allowing the
identification of over 150 different OS in human milk and 55 in bovine milk [28–30]. In this
work, a great variety of GCO structures were identified (based on their RT and accurate
masses), showing a different profile than human or bovine milk.
Considering the high content of lactose in goat colostrum, qualitative structural analysis of
GCO required a previous purification step based on SEC, leading to a reduction of 99.9% in
lactose concentration (Fig. 1S in supplementary material). A partial loss of neutral OS
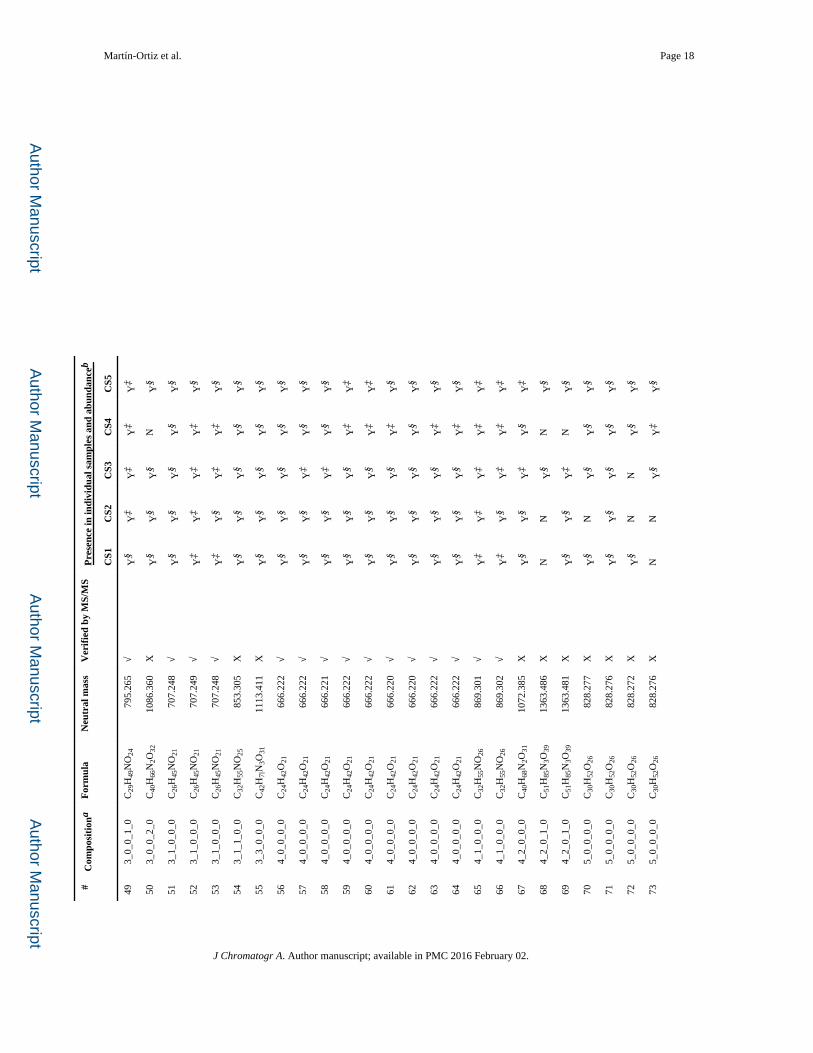
containing three monomeric units was also observed. Table 1 presents the list of OS
Martín-Ortiz et al. Page 6
J Chromatogr A. Author manuscript; available in PMC 2016 February 02.
Author M
anuscriptA
uthor Manuscript
Author M
anuscriptA
uthor Manuscript
identified by nano-LC-QTOF MS in the five goat colostrum samples previously purified by
SEC. A total of 78 compounds were identified as oligosaccharides, 59 of which have been
confirmed by their MS/MS spectrum. These results indicate that GCO show greater
complexity compared to those of other domestic animals [3,4,9,15,19,31]. Similar nano-LC
profiles were observed among the samples analyzed (see Fig. 1), although the whole set of
OS was not identified in all samples tested. Fig. 2 shows MS/MS spectrum of hexosyl-
lactose, 2′-FL, and 3′-SL as representative of each OS type (neutral, fucosylated and acidic).
The corresponding losses of the different monomeric units of these OS are indicated in the
figure. MS/MS spectra of all OS identified in the samples analyzed are also available in Fig.
2S of supplementary material.
From the 78 oligosaccharides identified, 40 (51.3%) are neutral non-fucosylated, 3 (3.8%)
neutral fucosylated and 35 (44.9%) corresponded to sialylated (Ne5Ac/Neu5Gc)
oligosaccharides. The predominant OS found in these colostrum fractions analyzed were
sialyl-lactoses (neutral mass 633.211) followed by Hex-HexNAc-Neu5Ac (neutral mass
674.238) and Hex-HexNAc-Neu5Gc (neutral mass 690.232) residues.
Regarding neutral OS, 7 isomers of the neutral oligosaccharide galactosyl-lactose (neutral
mass 504.169), 9 isomers of digalactosyl-lactose (neutral mass 666.222), 5 isomers of tri-
galactosyl-lactose (neutral mass 828.277) and 4 isomers of tetragalactosyl-lactose (neutral
mass 990.331) were also detected. Different isomers of N-acetylglucosaminyl-lactose
(neutral mass 545.195) and N-acetylglucosaminyl-hexosyl-lactose (neutral mass 707.249)
and N-acetylglucosaminyl-dihexosyl-lactose (neutral mass 869.301) were also found in all
the colostra. These results are in good agreement with those found by Meyrand et al. [4] in
goat milks, although a higher number of isomers of each oligosaccharide have been detected
in the present work. Additionally, three oligosaccharides containing fucose were found in
these samples (fucosyl-lactosamine, 2′-fucosyl-lactose and lacto-N-fuco-pentaose); some of
these OS were detected in low abundance which hindered our ability to achieve good
tandem spectra as further confirmation.
A total of 35 acidic OS, containing N-acetylneuraminic monomers (18), N-
glycolylneuraminic monomers (13) and 4 containing both (isomers of sialyl-N-glycolyl-
neuraminyl-lactose), were detected in goat colostrum (Table 1). To the best of our
knowledge, these results show the greatest number of acidic OS found in goat milk, also
including a higher Neu5Gc presence than that reported in previous studies (54.8% vs.
29.4%) [4,19,31].
Conventionally, a step of reduction of carbohydrate aldehydes into their alditols form is
performed using sodium borohydride. However, due to the low abundance of some
fucosylated OS, the reduction was not performed to avoid unwanted sample losses
associated with intense washing of residual borates (incompatible with the subsequent mass
spectrometry analysis). Therefore, in some cases, the oligosaccharide isomers separated by
nano-LC may include α and β anomers.
Martín-Ortiz et al. Page 7
J Chromatogr A. Author manuscript; available in PMC 2016 February 02.
Author M
anuscriptA
uthor Manuscript
Author M
anuscriptA
uthor Manuscript
3.2. Quantitative analysis of goat colostrum oligosaccharides
3.2.1. Optimization of HILIC-Q MS conditions—The pool goat colostrum CS5 sample
after SEC treatment was chosen as a representative sample for the optimization of the
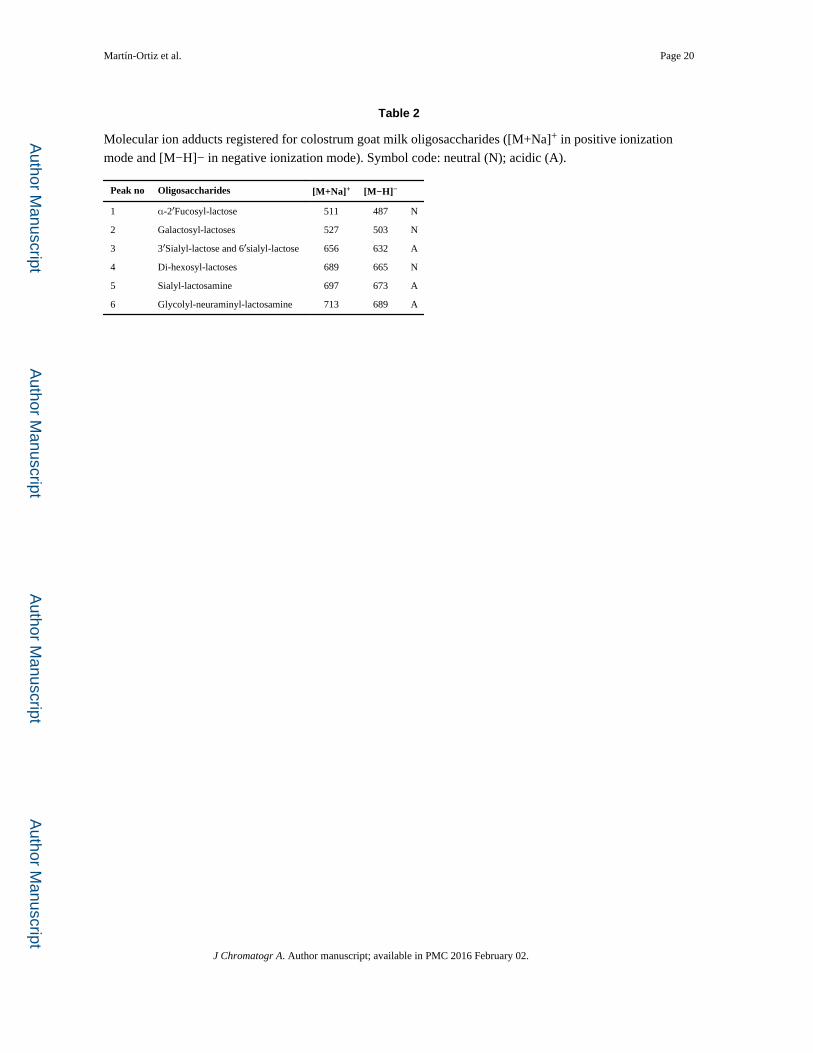
HILIC-Q MS method. Molecular ion adducts for fucosyl-lactose, galactosyl-lactoses, sialyl-
lactoses, digalactosyl-lactoses, sialyl-lactosamines and glycolyl-neuraminyl-lactosamines
were selected for the optimization of HILIC-QMS conditions at both positive and negative
mode (Table 2). According to results shown in Table 1, several peaks were detected for
selected m/z ions depending on the different conditions; however, only the main ones were
considered for the optimization of the method. Chromatographic peaks corresponding to [M
+Na]+ 656 and 511 m/z ions under positive polarity and [M−H]− 632 and 487 m/z ions under
negative polarity were assigned to 6′-SL and 3′-SL and 2′-FL, respectively, by comparison
of their retention times and MS data with those of commercial standards.
The use of BEH-amide stationary phase was evaluated for the analysis of GCO. Different
gradients of acetonitrile:water using 0.1% ammonium hydroxide as additive were assayed
for the analysis of CS5 oligosaccharides. First of all, initial gradient conditions were
evaluated, using different percentages of aqueous phase (10, 15 and 20%); 15% was selected
for following experiments considering the appropriate retention times (14–16 min) of the
first eluting compounds (acidic OS). Percentage of the aqueous phase was also increased up
to 50% and 80% in 50 min; 50% was enough for the elution of target carbohydrates. Finally,
gradient rate was also evaluated: aqueous phase was modified from 15% to 50% in 30, 40
and 50 min; whereas 30 and 40 min were too fast for the appropriate elution of all the
compounds, 50 min provided the best conditions. These elution results were slightly
improved reducing final time to 46 min, when all target carbohydrates had eluted. In all
cases, 10 min were required at 50% aqueous phase to clean de column. Then, initial
conditions were recovered in 1 min and finally equilibrated for 15 min. These conditions
were also applied to both 0.1% acetic acid and 5 mM ammonium acetate additives.
Table 3 shows the chromatographic parameters (RT, wh, As and Rs) considered for the
selected carbohydrates under positive polarity. In all cases, acidic OS eluted before the
neutral ones; this effect was more notable working under basic conditions (0.1% ammonium
acetate as additive) where two eluting zones were clearly distinguished in CS5 profiles: (i)
acidic oligosaccharides (14.6–16.5 min) and (ii) neutral oligosaccharides (32.6–42.5 min).
The main separation mechanism in HILIC seems to be based on the partitioning between a
water-enriched layer on the surface of the polar stationary phase and the relatively
hydrophobic eluent [32] which mainly affect neutral carbohydrates. However, although
BEH is considered a neutral stationary phase, ionization of residual surface silanol groups in
this stationary phase at pH above 4 could impart negative charges to the column [32]. Under
working conditions, negatively charged acidic oligosaccharides (pKa of sialic acid = 2.6)
would be electrostatically repelled by the stationary phase and elute at shorter retention
times.
No noticeable differences in the resolution values for the different conditions assayed were
observed. Although, as previously mentioned, a better separation between acidic and neutral
oligosaccharides was achieved using 0.1% ammonium hydroxide as additive, coelutions
Martín-Ortiz et al. Page 8
J Chromatogr A. Author manuscript; available in PMC 2016 February 02.
Author M
anuscriptA
uthor Manuscript
Author M
anuscriptA
uthor Manuscript
between 3′-SL, sialyl-lactosamine and a glycolyl-neuraminyl-lactosamine and 6′-SL and a
glycolyl-neuraminyl-lactosamine were observed. This behavior was also detected using 5
mM ammonium acetate as additive. A better separation was observed under acidic
conditions except for 3′-SL and a glycolyl-neuraminyl-lactosamine. Different isomers of [M
+Na]+ 527 and 689 m/z coeluted at the same retention time under all conditions, resulting in
broad peaks mainly for digalactosyl-lactoses (wh: 2.0–3.6 min). Regarding the other
oligosaccharides, in general, good peak width and symmetry values were obtained under
both 0.1% ammonium hydroxide and 5 mM ammonium acetate (wh: 0.2–0.6 min and As:
1.0–1.4 and wh: 0.2–0.4min and As: 0.6–1.1, respectively), whereas slightly broader peaks
with poor symmetry were observed using 0.1% acetic acid as additive (wh: 0.3–0.6 min and
As: 0.7–2.8). Fig. 3a shows the HILIC-MS profile of registered CS5 oligosaccharides eluted
under basic conditions and positive polarity.
Under negative polarity, [M−H]− ions (632, 673 and 689 m/z) corresponding to acidic
carbohydrates (6′-SL and 3′-SL, sialyl-lactosamine and glycolyl-neuraminyl-lactosamine,
respectively) of CS5 were clearly detected using acetonitrile:water with 0.1% acetic acid,
0.1% ammonium hydroxide and 5 mM ammonium acetate as additives. However, in all
cases neutral carbohydrates could not be determined or were only slightly detected under
these conditions (Fig. 3b). Therefore, further works were carried out under positive polarity.
The effect of temperature was also evaluated using BEH amide column with
acetonitrile:water and 0.1% ammonium hydroxide as mobile phase. Three different
temperatures (30, 40, 60°C) were assayed (Table 3 and Table 4). As expected, as
temperature increased a higher decrease in RT of all the carbohydrates was observed (e.g.
differences in RT values of 3.6 min for 3′-SL and 2.3 min for 2′-FL between 30 and 60 °C
were observed). In general, narrower peaks with good symmetry were obtained at 40 and 60
°C (e.g. wh = 0.2–0.4 min; AS =0.7–1.3), compared to elutions at 30 °C (e.g. wh =0.2–0.6
min; AS = 0.7–1.4), whereas resolution was only slightly affected by temperature.
Considering these results and in order to avoid high temperatures which could affect the
stability of the stationary phase, 40 °C was selected for the analysis of the oligosaccharides
under study.
3.2.2. Analytical parameters—Once the chromatographic conditions were selected,
different analytical parameters were considered for the validation of the method before
quantitative analysis.
External standard method was used for the quantitative analysis using calibration curves
within the range 100–0.25 mg L−1 for 2′-FL, maltotriose, maltotetraose, 3′- and 6′-SL. These
compounds were selected as representative of neutral fucosylated trisaccharides, neutral
non-fucosylated trisaccharides, neutral tetrasaccharides and acidic OS, respectively. The
obtained correlation coefficients from these calibration curves ranged from 0.92 to 0.99.
Considering that GCO are present at low levels, limit of detection (LOD), limit of
quantitation (LOQ) and precision (RSD, %) data for a standard mixture including 6′-SL, 2′-
FL and maltotriose, as representative standards of target compounds, were calculated. As
shown in Table 5, the lowest LOD and LOQ values were obtained for 6′-SL(3.28 and
Martín-Ortiz et al. Page 9
J Chromatogr A. Author manuscript; available in PMC 2016 February 02.
Author M
anuscriptA
uthor Manuscript
Author M
anuscriptA
uthor Manuscript
10.94ngmL−1, respectively), whereas the highest were found for 2′-FL (160.62 and 535.41
ngmL−1, respectively). Good precision values were obtained for all standards analyzed
(RSD ranging 6.0–8.1%).
The potential effect on the quantitative determination of GCO of the sample matrix was also
considered by analyzing different dilutions (1:1–1:50, v/v) of CS5 before and after SEC
treatment. No differences in carbohydrates concentrations associated to a possible matrix
effect were found for the different dilutions.
3.2.3. Quantitation of oligosaccharides in colostrum samples—Table 6 shows the
quantitative data (mg L−1 goat colostrum) of the most abundant GCO for the five samples.
Considering the potential loss of OS with three monomer units during SEC treatment,
oligosaccharides marked with an asterisk in the table (2′-FL, 3′-SL, 6′-SL, sialyl-
lactosamine, galactosyl-lactoses, fucosyl-lactosamine, glycolyl-neuraminyl-lactosamine and
glycolyl-neuraminyl-lactose) were quantified in the original samples only after fat and
protein removal (before performing SEC).
A high variability in quantified OS concentrations was observed among the different
colostrum samples. CS4 showed the highest concentrations of OS (572.24 mg L−1) whereas
CS2 and CS3 showed the lowest values (251.22 and 293.16 mg L−1, respectively). Values
ranging from 140 to 315 mg L−1 for neutral oligosaccharides and from 83 to 251 mg L−1 for
acidic oligosaccharides were found. The most abundant OS were galactosyl-lactoses
(separation of all the isomers was not possible and these compounds were quantified
together: 124.92–265.77 mg L−1). Concentration of these neutral carbohydrates in colostrum
samples are higher than those reported in the literature for goat milks [4]. Regarding
fucosyl-oligosaccharides, 2′-FL showed higher concentrations (2.21–31.59 mg L−1) than
fucosyl-lactosamine (3.08–6.15 mg L−1). As indicated before, concentration of 6′-SL
(28.85–123.76 mg L−1) was higher than that of 3′-SL (3.05–11.99 mg L−1) in all the
colostrum samples. These results could suggest an OS profile closer to human milk than
bovine milk, where 3′-SL is the predominant form in the latter. Relatively high amounts of
sialyl-lactosamine isomers were also found in colostrum samples (5.17–8.56 and 5.66–65.12
mg L−1), whereas lower concentrations of other acidic OS were observed (Table 6).
Although some of these oligosaccharides have been detected in previous works in mature
goat milks [4,10,15], to the best of our knowledge, this is the first time that such a large
number of oligosaccharides have been quantified in goat colostrum.
4. Conclusions
A high number of both neutral and acidic OS has been detected for the first time in different
goat colostrum samples by Nano-LC-Chip-Q-TOF MS. Moreover, a HILIC-QMS method
has successfully been developed for the first time for the quantitative analysis of these OS.
Regarding mobile phase, acetonitrile:water with 0.1% ammonium hydroxide as additive has
proven to be the most appropriate eluent to achieve good results in terms of peak width,
peak symmetry and resolution. This method has proven to be successful for the quantitation
of several OS in colostrum samples. Up to 0.57 g L−1 of total OS could be estimated,
galactosyl-lactoses being the predominant carbohydrates followed by sialyl- and fucosyl-
Martín-Ortiz et al. Page 10
J Chromatogr A. Author manuscript; available in PMC 2016 February 02.
Author M
anuscriptA
uthor Manuscript
Author M
anuscriptA
uthor Manuscript
oligosaccharides, respectively. Overall, findings contained in this work strengthen the
potential of goat colostrum as an efficient source of naturally-occurring bioactive OS.
Supplementary Material
Refer to Web version on PubMed Central for supplementary material.
Acknowledgments
This work has been funded by Junta de Andalucía (project AGR2011-7626), CSIC (project i-link0827), Comunidad Autónoma de Madrid (Spain) and European funding from FEDER program (AVANSECAL-CM S2013/ABI-3028) and Fundación Ramón Areces. This work was also supported by the UC Davis RISE program and the National Institutes of Health awards R21AT006180, R01AT007079, R01AT008759-02. Authors also thank I. Calvillo for her technical assistance.
References
1. Casado B, Affolter M, Kussmann M. OMICS-rooted studies of milk proteins oligosaccharides and lipids. J. Proteomics. 2009; 73:196–208. [PubMed: 19793547]
2. Martinez-Ferez A, Zapata JE, Guadixa A, Almecija MC, Gomez M, Guadix EM. Obtention ofgoat milk permeates enriched in lactose-derived oligosaccharides. Desalination. 2009; 245:730–736.
3. Urashima T, Saito T, Nakamura T, Messer M. Oligosaccharides of milk and colostrums in non-human mammals. Glycoconj. J. 2001; 18:357–371. [PubMed: 11925504]
4. Meyrand M, Dallas DC, Caillat H, Bouvier F, Martin P, Barile D. Comparison of milk oligosaccharides between goats with and without the genetic ability to synthesize αs1 -casein. Small Rumin. Res. 2013; 113:411–420. [PubMed: 24587592]
5. Wang B, Brand-Miller J, McVeagh P, Petocz P. Concentration and distribution of sialic acid in human milk and infant formulas. Am. J. Clin. Nutr. 2001; 74:510–515. [PubMed: 11566650]
6. Park, YW. Bioactive components in goat milk. In: Park, YW., editor. Bioactive Components in Milk and Dairy Products. UK: Wiley-Blackwell; 2009. p. 43-82.
7. Kunz C, Rudloff S. Health promoting aspects of milk oligosaccharides. Int. Dairy J. 2006; 16:1341–1346.
8. Yu Z-T, Chen C, Kling DE, Liu B, McCoy JM, Merighi M, Heidtman M, Newburg DS. The principal fucosylated oligosaccharides of human milk exhibit prebiotic properties on cultured infant microbiota. Glycobiology. 2013; 23:169–177. [PubMed: 23028202]
9. Viverge D, Grimmonprez L, Solere M. Chemical characterization of sialyl oligosaccharides isolated from goat (Capra hircus) milk. Biochim. Biophys. Acta. 1997; 1336:157–164. [PubMed: 9305785]
10. Mehra R, Kelly P. Milk oligosaccharides: structural and technological aspects. Int. Dairy J. 2006; 16:1334–1340.
11. Charlwood J, Tolson D, Dwek M, Camilleri P. A detailed analysis of neutral and acidic carbohydrates in human milk. Anal. Biochem. 1999; 273:261–277. [PubMed: 10469497]
12. Warren C, Chaturvedi P, Newburg A, Oftedal O, Tilden C, Newburg D. Comparison of oligosaccharides in milk specimens from humans and twelve other species. Adv. Exp. Med. Biol. 2001; 501:325–332. [PubMed: 11787698]
13. Asakuma S, Akahori M, Kimura K, Watanabe Y, Nakamura T, Tsunemi M, Arai I, Sanai Y, Urashima T. Sialyl oligosaccharides of human colostrum: changes in concentration during the first three days of lactation. Biosci. Biotechnol. Biochem. 2007; 71:1447–1451. [PubMed: 17587674]
14. Hernández-Hernández O, Calvillo I, Lebrón-Aguilar R, Moreno FJ, L Sanz M. Hydrophilic interaction liquid chromatography coupled to mass spectrometry for the characterization of prebiotic galactooligosaccharides. J. Chromatogr. 2012; A1220:57–67.
15. Martinez-Ferez A, Rudloff S, Guadix A, Henkel CA, Pohlentz G, Boza JJ, Guadix EM, Kunz C. Goats’ milk as a natural source of lactose-derived oligosaccharides: isolation by membrane technology. Int. Dairy J. 2006; 16:173–181.
Martín-Ortiz et al. Page 11
J Chromatogr A. Author manuscript; available in PMC 2016 February 02.
Author M
anuscriptA
uthor Manuscript
Author M
anuscriptA
uthor Manuscript
16. Martinez-Ferez A, Guadix A, Zapata-Montoya JE, Guadix EM. Influence of transmembrane pressure on the separation of caprine milk oligosaccharides from protein by cross-flow ultrafiltration. Int. J. Dairy Technol. 2008; 61:333–339.
17. Lara-Villoslada F, Debras E, Nieto A, Concha A, Galvez J, Lopez-Huertas E, Boza J, Obled C, Xaus J. Oligosaccharides isolated from goat milk reduce intestinal inflammation in a rat model of dextran sodium sulfate-induced colitis. Clin. Nutr. 2006; 25:477–488. [PubMed: 16375993]
18. Oliveira DL, Wilbey RA, Grandison AS, Duarte LC, Roseiro LB, Separation of oligosaccharides from caprine milk whey. prior to prebiotic evaluation. Int. Dairy J. 2012; 24:102–106.
19. Claps S, Di Napoli MA, Sepe L, Caputo AR, Rufrano D, Di Trana A, Annic-chiarico G, Fedele V. Sialyloligosaccharides content in colostrum and milk of two goat breeds. Small Rumin. Res. 2014; 121:116–119.
20. Brokl M, Hernández-Hernández O, CSoria A, L Sanz M. Evaluation of different operation modes of high performance liquid chromatography for the analysis of complex mixtures of neutral oligosaccharides. J. Chromatogr. 2011; A1218:7697–7703.
21. Wuhrer M, de Boer AR, Deelder AM. Structural glycomics using hydrophilic interaction liquid chromatography (HILIC) with mass spectrometry. Mass Spec-trom. Rev. 2009; 28:192–206.
22. Marino K, Lane JA, Abrahams JL, Struwe WB, Harvey DJ, Marotta M, Hickey RM, Rudd PM. Method for milk oligosaccharide profiling by 2-aminobenzamide labeling and hydrophilic interaction chromatography. Glycobiology. 2011; 21:1317–1330. [PubMed: 21566017]
23. Fong B, Ma K, McJarrow P. Quantification of bovine milk oligosaccharides using liquid chromatography-selected reaction monitoring-mass spectrometry. J. Agric. Food Chem. 2011; 59:9788–9795. [PubMed: 21790206]
24. Ninonuevo MR, Perkins PD, Francis J, Lamotte LM, LoCascio RG, Freeman SL, Mills DA, German JB, Grimm R, Lebrilla CB. Daily variations in oligosaccharides of human milk determined by microfluidic chips and mass spectrometry. J. Agric. Food Chem. 2008; 56:618–626. [PubMed: 18088092]
25. Tao N, Ochonicky KL, German JB, Donovan SM, Lebrilla CB. Structural determination and daily variations of porcine milk oligosaccharides. J. Agric. Food Chem. 2010; 58:4653–4659. [PubMed: 20369835]
26. Tao N, DePeters EJ, Freeman S, German JB, Grimm R. Bovine milkglycome. J. Dairy Sci. 2008; 91:3768–3778. [PubMed: 18832198]
27. Barile D, Marotta M, Chu C, Mehra R, Grimm R, Lebrilla CB, German JB. Neutral and acidic oligosaccharides in Holstein-Friesian colostrum during the first 3 days of lactation measured by high performance liquid chromatography on a microfluidic chip and time-of-flight mass spectrometry. J. Dairy Sci. 2010; 93:3940–3949. [PubMed: 20723667]
28. Wu S, Grimm R, German JB, Lebrilla CB. Annotation and structural analysis ofsialylated human milk oligosaccharides. J. Proteome Res. 2011; 10:856–868. [PubMed: 21133381]
29. Aldredge DL, Geronimo MR, Hua S, Nwosu CC, Lebrilla CB, Barile D. Annotation and structural elucidation of bovine milk oligosaccharides and determination of novel fucosylated structures. Glycobiology. 2013; 23:664–676. [PubMed: 23436288]
30. Wu S, Tao N, German JB, Grimm R, Lebrilla CB. Development of an annotated library of neutral human milk oligosaccharides. J. Proteome Res. 2010; 9:4138–4151. [PubMed: 20578730]
31. Albretch S, Lane JA, Marino K, Al-Bushada KA, Carrington SD, Hickey RM, Rudd PM. A comparative study of free oligosaccharides in the milk of domestic animals. Br.J. Nutr. 2014; 111:1313–1328. [PubMed: 24635885]


![Journal of Chromatography A - faculty.ksu.edu.safaculty.ksu.edu.sa/.../24_journal_of_chromatography... · 90 M.S. Obbed et al. / J. Chromatogr. A 1555 (2018) 89–99 tive fieldwhichhasattractedmanyfruitfulresearchactivities[4,5].](https://static.documents.pub/doc/80x56/5ecbe7bd7abb7525a74ea9ef/journal-of-chromatography-a-90-ms-obbed-et-al-j-chromatogr-a-1555-2018.jpg)
