1. Introduction This paper is a sequel to the previous contribution (Sekiguchi et al., 2004) from the Research Center for Disaster Environment and represents an outcome obtained through Research Project 3: “Atmosphere-Hydrosphere Modeling for Water/Mass Movement in River Basins and Community-based Hazard Mapping” that has been progressing in the framework of the 21st Century DPRI-COE Program, Kyoto University. The research strategy was designed with consideration of (a) global trend of intensifying meteorological fluctuations, (b) ever increasing rate of urbanization in developed countries and (c) importance of promoting preparedness for water-related hazards on a basin- or sub-basin scale. The research emphasis has proven really relevant up to the time of the writing. Indeed, the year 2004 witnessed serious consequences of extreme natural forcing across the country, as evidenced by the July 2004 Hokuriku Torrential-Rain Disasters (Tamai, 2004) and by the record-breaking ten typhoons that hit the Japan’s archipelago (NII, 2005). The disasters were brought about in great many forms (Information Service Center for Disaster Prevention, 2005), through slope failures, debris flows, extreme flooding, inundation, rapid morphological changes and others. One of the most bitterly learnt lessons points to the severity of the consequences of levee breaching that occurred at high flood stage. They include the levee breaching cases with the Asuwa, Igarashi, Kariyata, Maruyama and Izushi Rivers. The extent of the damage in these and other case histories would have been minimal if the levees could eventually stand, even though they suffered degradation and allowed some overbank flow. 京 都 大 学 防 災 研 究 所 年 報 第48号 C 平成17年4月 Annuals of Disas. Prev. Res. Inst., Kyoto Univ., No. 48 C, 2005 Complex Fluid-Sediment Interactions in Fluvial and Coastal Environments – Part 2 Hideo SEKIGUCHI, Hajime NAKAGAWA, Toyoaki SAWADA, Taisuke ISHIGAKI, Taiichi HAYASHI, Takao YAMASHITA, Tetsuo UENO, Yasunori MUTO, Yasuyuki BABA and Shigeatsu SERIZAWA Synopsis This paper focuses on complex fluid-sediment interactions that may characterize the dynamical nature of sediment routing systems. Particular attention goes to storm-scale phenomena, and trends of mesoscale modelling are briefly reviewed first. Discussions are then directed on specific topics, which include: long-term observations of surface erosion on a hillslope; basin-scale analysis for predicting the development of shallow landslides in a heavy rainfall event; Numerical and physical modelling of the three-dimensional flow field and bed deformation around spur dykes, with implications in river stabilization; flow-out modelling for assessing the impact of levee breaching; and remarkable onshore transport of beach sand in a typhoon event. Collectively, the coverage emphasizes the importance of integrated analysis procedure for treating the three-dimensional nature of fluid-sediment interactions. Keywords: erosion; levee breaching; local scouring; rainfall-induced slope failure; sediment routing system; spur dyke; swash-zone sand transport
Transcript
1. Introduction
This paper is a sequel to the previous contribution (Sekiguchi et al., 2004) from the Research Center for Disaster Environment and represents an outcome obtained through Research Project 3: “Atmosphere-Hydrosphere Modeling for Water/Mass Movement in River Basins and Community-based Hazard Mapping” that has been progressing in the framework of the 21st Century DPRI-COE Program, Kyoto University.
The research strategy was designed with consideration of (a) global trend of intensifying meteorological fluctuations, (b) ever increasing rate of urbanization in developed countries and (c) importance of promoting preparedness for water-related hazards on a basin- or sub-basin scale. The research emphasis has proven really relevant up to the time of the writing.
Indeed, the year 2004 witnessed serious consequences of extreme natural forcing across the country, as evidenced by the July 2004 Hokuriku Torrential-Rain Disasters (Tamai, 2004) and by the record-breaking ten typhoons that hit the Japan’s archipelago (NII, 2005). The disasters were brought about in great many forms (Information Service Center for Disaster Prevention, 2005), through slope failures, debris flows, extreme flooding, inundation, rapid morphological changes and others. One of the most bitterly learnt lessons points to the severity of the consequences of levee breaching that occurred at high flood stage. They include the levee breaching cases with the Asuwa, Igarashi, Kariyata, Maruyama and Izushi Rivers. The extent of the damage in these and other case histories would have been minimal if the levees could eventually stand, even though they suffered degradation and allowed some overbank flow.
Synopsis This paper focuses on complex fluid-sediment interactions that may characterize the
dynamical nature of sediment routing systems. Particular attention goes to storm-scale phenomena, and trends of mesoscale modelling are briefly reviewed first. Discussions are then directed on specific topics, which include: long-term observations of surface erosion on a hillslope; basin-scale analysis for predicting the development of shallow landslides in a heavy rainfall event; Numerical and physical modelling of the three-dimensional flow field and bed deformation around spur dykes, with implications in river stabilization; flow-out modelling for assessing the impact of levee breaching; and remarkable onshore transport of beach sand in a typhoon event. Collectively, the coverage emphasizes the importance of integrated analysis procedure for treating the three-dimensional nature of fluid-sediment interactions. Keywords: erosion; levee breaching; local scouring; rainfall-induced slope failure; sediment routing system; spur dyke; swash-zone sand transport
With the above-mentioned in mind, the following sections will describe some of the recent developments in modelling fluid-sediment interactions that may characterize sediment routing systems. It is noteworthy herein that the fluid-sediment interaction may be accentuated by the occurrence of three-dimensional configuration, moving boundary and phase change.
2. Sediment Routing System
Sediments in the Earth’s surface system exhibit a variety of facets through liberation, transfer, storage, consolidation or diagenesis. As far as the physics of sediment transport is concerned, erosion and sedimentation may be the two most fundamental processes. They operate with fluid motion in most cases, under the influence of gravitational forces. An idea of the extent of sediment transport is illustrated in Fig. 1. As implied in this figure, the sediment routing system emphasizes that a river basin is by no means a closed system in terms of the transfer of water, dissolved matter and sediment (Allen, 1997). In fact, the supply of particulate sediments from rivers to coastal oceans plays an important role in the budget of littoral sediment as well as in the quality of water bodies concerned.
2.1 Addressing natural forcing over basin scale or smaller
The atmospheric circulation drives comprehensive spectra of hydrological, marine and ocean processes. Recent fluid-related disasters have emphasized the importance of storm-scale phenomena (Kim and Yamashita, 2005; Yamashita et al., 2005; Yamane and Hayashi, 2005 among many others). Mesoscale modelling is of particular relevance in this regard. Indeed, the progress has come to a stage where practical atmospheric forecasting may be a reality, through
powerful computational resources (MM5, ARPS, RAMS among others). Yamashita et al. (2004), for instance, examined the predictive capability of a mesoscale model (MM5) regarding the wind and precipitation fields associated with a typhoon and obtained favourable conclusions.
Coupled air-sea-land prediction systems with high resolution may now be foreseeable (Fig. 2). Physically sound insights prove to be increasingly important as one aims at higher resolution in terms of both temporal and spatial dimension (Surgi et al., 2004). The art of data assimilation will also benefit from ever enhancing computational facilities. In a way, all of these and other developments may move toward increased appreciation of the locality or regional character that should remain to challenge the stakeholders who concern themselves in community-based hazard mapping.
With this sentiment in mind, the subsequent discussions attempt to underline characteristics of fluid-sediment interactions.
2.2 Liberation of sediment
The weathering and erosion commonly occur in hillslopes, making them a source zone for sediment transport in river basins. The liberation of the sediment from hillslopes takes a variety of forms, including slope failure, debris flow and surface erosion. In this sub-section we will take up two topics that refer to long-term observations of surface erosion on a hillslope and predicting rainfall-induced slope failures on a basin scale. (1) Long-term observations of surface erosion on a
hillslope The denudation of hillslopes in the form of surface
erosion is of considerable interest to the management of aquatic environments in river basins and beyond,
Continental shelf
Mountain Headland
Offshore transport
Turbidity current
Wave Offshore current
Fig.1 Schematic of sediment routing system (adaptedfrom Seibold and Berger, 1993)
Fig. 2 Schematic of a coupled air-sea-land prediction system under calibration by Takao Yamashita
Longshore transport
Submarine
canyon
River
MM5
WW3
POMHSPF
MM5
WW3
POMHSPF
because of the potential transfer of a great deal of wash load. In order to look at sediment liberation from sloping bareland on mountainous terrains, Sawada (2005; unpublished report) established a pilot study area, named Fukaya test area, in the west flank of Mt. Yake in 1985 and has taken observations up to now. The test section is 3m by 10m in plan and is underlain by pyroclastic-flow deposits. The amount of the sediment liberation was measured on a weekly basis by weighing the sediment that flew into a sediment trap placed downslope. The specific sediment yield in the Fukaya test site is plotted in Fig. 3 on a yearly basis from 1985 to 2004, together with the measured evolution of precipitation. It is seen that the specific sediment yield was highest in 1988 and then exhibited much smaller rates, even though the area had significantly high precipitations in the years 1989, 1995 and 2004. The observed performance clearly indicates that the yearly rate of sediment liberation from a bareland is not a function of the annual precipitation alone.
Indeed, a time history of natural forcing may come into a play. Supposing that an event was strong enough to erode the surface soil to a considerable depth, then the liberation of sediment in the following years may be small in amount until the action of weathering or the like produces “loose material” on slopes. Then a triggering event will readily mobilize such a loose layer of soil. These statements are, however, speculative in nature and await a precise scientific modelling. Dedicated long-term field observations, like the one carried out by Toyoaki Sawada, could offer ground truth by which to test any such modelling.
(2) Predicting rainfall-induced slope failures on a basin scale
Sharma and Nakagawa (2005) developed a computational procedure for predicting the occurrence of rainfall-induced slope failures or shallow landslides. The computational procedure basically combines the analysis
of rainwater infiltration with the infinite-slope stability analysis in terms of effective stress.
Let h be the pressure head of the groundwater and let θ be the volumetric water content of the soil. Then the storage equation for saturated/unsaturated groundwater flow regime reads
⎥⎦
⎤⎢⎣
⎡⎟⎠⎞
⎜⎝⎛ −∂∂
∂∂
+⎥⎦
⎤⎢⎣
⎡∂∂
∂∂
+
⎥⎦
⎤⎢⎣
⎡⎟⎠⎞
⎜⎝⎛ −∂∂
∂∂
=∂∂
∂∂
α
αθ
cos)()(
sin)(
zhhK
zyhhK
y
xhhK
xth
h (1)
where t is the time, α is the slope angle and K(h) stands for the hydraulic conductivity that depends on the pressure head h. In order to solve Eq. (1) for h, one needs to specify two constitutive relations: )(hθ and ))(( hK θ . The former is a representation for water-retention potential of unsaturated soil that commonly has a negative pressure head at a given volumetric water content. The latter allows for the variation in hydraulic conductivity of unsaturated soil with volumetric water content.
Specifically, Sharma and Nakagawa (2005) incorporated van Genuchten’s (1980) constitutive models into Eq. (1) and validated the analysis procedure against results of laboratory infiltration testing on sloping sandy soil (Fig. 4). The measured profile of pressure heads in the soil at an early stage of rainwater infiltration (at an elapsed time of 30 minutes) featured marked negative values, except at the toe of the slope where the pressure head was practically zero. In the course of continued rainfall and rainwater infiltration, the pressure heads in the soil were observed to increase gradually and to take positive values, indicating unfavourable effects on slope stability. It is evident that the predicted performance well captures the observed evolution of the pressure heads in the soil undergoing rainwater infiltration.
Sharma and Nakagawa (2005) then went on looking at the response of Takora basin 0.85 km2 in area (located upstream of the Kizu River basin) to the 26 October 1973 rainfall event. The rainfall lasted a period of 10 hrs, giving rise to a total rainfall of 282mm (Fig. 5). The rainfall event was strong enough to induce a number of shallow landslides in that area, with the averaged depth of sliding equal to 0.82 m. The extent of the slope failures can be clearly seen from Fig. 6 which plots the areas of “land scars” or failure zones that were identified from aerial photographs taken in 1975.
Fig. 3 Measured evolution of specific sediment yield inFukaya test area (Sawada, 2005; unpublished report)
Sedi
men
t yie
ld (g
/m2 /w
eek)
2500
2000
1500
1000
500
0
1400
1200
1000
800
600
0
400
200
1985
1986
1987
1988
1989
1990
1991
1992
1993
1994
1995
1996
2000
2001
2002
2003
2004
Sediment yieldPrecipitation
Yea
rly p
reci
pita
tion
(mm
)
The question now arises as to how a sophisticated analysis procedure can provide insight into the evolution of rain-induced instability on a basin scale. Refer to Fig. 5 again in this context. The solid points in this figure represent the results from combined infiltration/slope- stability analysis by Sharma and Nakagawa (2005). It is evident that the extent of the slope instability became pronounced after an elapsed time of 7 hours from the start of the rainfall event, yielding an unstable area of 0.2 km2 in total. The calculated distribution of levels of stability at the end of the rainfall are shown in Fig. 6 on a computational-cell basis. Here a computational cell with the factor of safety equal to or less than unity represents an unstable zone. Although the calculated extent of the unstable zones appears to overestimate the extent of the observed land scars, the comparison will surely facilitate a stimulus for further development.
3. Dynamics of Fluid-Sediment System 3.1 Channel-levee-spur dyke systems in river
stabilization The protection of stream channels against erosion
has been and continues to be an important issue regarding engineered alluvial rivers. Strengthening the banks, where appropriate, may be a practical solution, particularly for reducing the risk of levee breaching at extreme floods. Reducing the hydrodynamic forcing against stream banks may also be a conceivable solution, facilitating great many types of flow-control structures such as spur dykes (Fig. 7). However, their exact
Fig. 6 Calculated distribution of unstable areas inTakora basin at the end of rainfall, together withlandslide scars identified using aerial photography(Sharma and Nakagawa, 2005)
0
0.1
0.2
0.3
0.4
1 2 3 4 5 6 7 8 9 10Time (hr)
Uns
tabl
e ar
ea (
km2 )
0
50
100
150
200
250
300
350
Rai
nfal
l(m
m/h
our)
,C
um. R
ainf
all (
mm
)
Raifallunstable areaCum. Rain
Fig. 5 Calculated development of unstable areas inTakora basin, along with time history of rainfall on 26October 1973 (Sharma and Nakagawa, 2005)
y
x
z
20O
rainfall
(a)
-0.6
-0.5
-0.4
-0.3
-0.2
-0.1
0
0.1
1 2 3 4 5
Distance from upstream face(m)
Pressure head (m)
Exp-30min
Sim-30min
(b)
-0.6
-0.4
-0.2
0
0.2
0.4
1 2 3 4 5
Distance from upstream face (m)
Pressure head (m)
Exp-70min
Sim-70min
(c)
Fig. 4 Validation of saturated/unsaturated groundwater flow analysis in light of laboratory infiltration testing on a sandyslope (Sharma and Nakagawa, 2005)
hydrodynamic functions are still difficult to evaluate, because of inherent three-dimensional nature of the stream flow and sediment behaviour involved.
(1) Development of three-dimensional analysis
procedure In order to break though the situation mentioned
above, Zhang et al. (2005a) have recently developed a computational procedure which is capable of predicting the three-dimensional flow field and bedform changes that may occur around a series of spur dykes in a stream channel. The theoretical framework may be featured by the following:
- Description of a flow domain in terms of three-dimensional Navier-Stokes/continuity equations, with a κ -ε turbulence model
- Treating the riverbed as a moving boundary with consideration of sediment transport there
- A cell-centered Finite Volume Method for numerical analysis.
The second item described above may be worked out through
( )⎥⎥⎦
⎤
⎢⎢⎣
⎡
∂
∂+
∂∂
−=∂∂
−y
q
xq
tz bybxbλ1 (2)
where zb is the riverbed elevation that undergoes modifications under stream flow due to sediment transport, λ is the porosity of the sediment, and qbx and qby denote the sediment transport rates in x and y directions. Only the bedload transport is considered along with the Ashida and Michiue (1972) formula, which reads
( )[ ]( )
⎥⎥⎦
⎤
⎢⎢⎣
⎡⎟⎟⎠
⎞⎜⎜⎝
⎛−×
⎥⎥
⎦
⎤
⎢⎢
⎣
⎡
⎟⎟⎠
⎞⎜⎜⎝
⎛−=
−
∗
∗
∗
∗∗
ττ
ττ
τ
c
ce
b
gds
q
1
1171
2123
213 (3)
Here qb is the bedload discharge per unit width, s the specific gravity of the sediment, g the gravitational acceleration, d the diameter of the sediment. The three physical quantities e*τ , c*τ and *τ denote the effective shear, critical shear and operational shear stresses, all in dimensionless form.
In order to allow for the effect of local bed-slope changes on the resistance to transport of bedload, Zhang et al. (2005a) introduced a bed slope factor K such that
coc Kττ = (4)
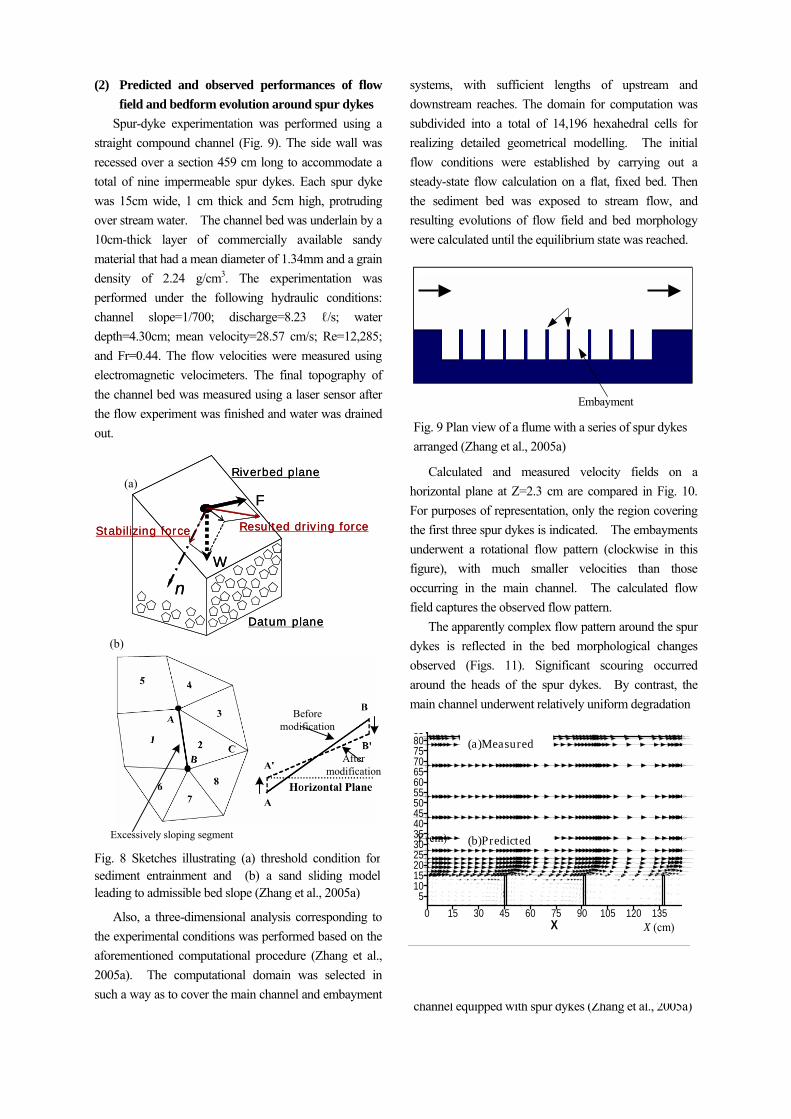
Here cτ represents the critical shear stress for a sloping bed and coτ stands for the critical shear stress for a horizontal bed. The concrete form of the bed slope factor may be derived as follows (refer to Fig. 8). Consider a particle that rests on a local bed surface with direction angles γβα ,, in a Cartesian coordinate system. The particle may be set in motion if the vectorial sum of the fluid force F and submerged weight W’ exceeds the magnitude of the available stabilizing force
φγ tancos'W where φ denotes the angle of frictional resistance. After some algebraic manipulation, there follows
[ ]φ
φγγtan
tancossin212222 mmK −+−
= (5)
where γβγαγ 2sincoscoscoscos zyx fffm −+=in which zyx fff ,, denote the direction cosines of the fluid force vector F.
The computational procedure of bedform evolution goes with a “sand slide model”, ensuring that finally calculated bed slopes do not exceed the angle of repose (Zhang et al., 2005a). The essential idea of the algorithm is briefly described as follows. Suppose that segment AB in Fig. 8 takes an excessively steep angle, requiring remedy. The local slope angle may be reduced to the angle of repose, as illustrated with segment A’B’. The position of segment A’B’ can then be determined by imposing the constancy of the total volume of the computational cells involved.
Fig. 7 A series of spur dikes normal to levee between theKiso and Nagara rivers (adapted from a brochure of theKiso River Office, MLIT)
(2) Predicted and observed performances of flow field and bedform evolution around spur dykes
Spur-dyke experimentation was performed using a straight compound channel (Fig. 9). The side wall was recessed over a section 459 cm long to accommodate a total of nine impermeable spur dykes. Each spur dyke was 15cm wide, 1 cm thick and 5cm high, protruding over stream water. The channel bed was underlain by a 10cm-thick layer of commercially available sandy material that had a mean diameter of 1.34mm and a grain density of 2.24 g/cm3. The experimentation was performed under the following hydraulic conditions: channel slope=1/700; discharge=8.23 ℓ/s; water depth=4.30cm; mean velocity=28.57 cm/s; Re=12,285; and Fr=0.44. The flow velocities were measured using electromagnetic velocimeters. The final topography of the channel bed was measured using a laser sensor after the flow experiment was finished and water was drained out.
Also, a three-dimensional analysis corresponding to
the experimental conditions was performed based on the aforementioned computational procedure (Zhang et al., 2005a). The computational domain was selected in such a way as to cover the main channel and embayment
systems, with sufficient lengths of upstream and downstream reaches. The domain for computation was subdivided into a total of 14,196 hexahedral cells for realizing detailed geometrical modelling. The initial flow conditions were established by carrying out a steady-state flow calculation on a flat, fixed bed. Then the sediment bed was exposed to stream flow, and resulting evolutions of flow field and bed morphology were calculated until the equilibrium state was reached.
Calculated and measured velocity fields on a
horizontal plane at Z=2.3 cm are compared in Fig. 10. For purposes of representation, only the region covering the first three spur dykes is indicated. The embayments underwent a rotational flow pattern (clockwise in this figure), with much smaller velocities than those occurring in the main channel. The calculated flow field captures the observed flow pattern.
The apparently complex flow pattern around the spur dykes is reflected in the bed morphological changes observed (Figs. 11). Significant scouring occurred around the heads of the spur dykes. By contrast, the main channel underwent relatively uniform degradation
Fig. 9 Plan view of a flume with a series of spur dykes arranged (Zhang et al., 2005a)
Inflow Outflow
Main channel Spur dykes
Embayment
Fig. 8 Sketches illustrating (a) threshold condition forsediment entrainment and (b) a sand sliding modelleading to admissible bed slope (Zhang et al., 2005a)
n
W
F
Resulted driving forceStabilizing force
Riverbed plane
Datum plane
n
W
F
Resulted driving forceStabilizing force
Riverbed plane
Datum plane
(a)
Excessively sloping segment
Aftermodification
Beforemodification
(b)
Fig.10 Measured and predicted velocity profiles in thechannel equipped with spur dykes (Zhang et al., 2005a)
X0 15 30 45 60 75 90 105 120 135
510152025303540
20 cm/s Y (cm)
X (cm)
X0 15 30 45 60 75 90 105 120 135
510152025303540455055606570758085
X (cm)
Y (cm)
(a)Measured
(b)Predicted
due to flow deflection that was effected by the presence of the spur dykes. The occurrence of depositional zones in the embayments between the spur dykes is also worth noting. As such, it may lead to beneficial effects in terms of bank protection or habitat creation. A cross-stream profile through x=45cm and a longitudinal profile through y=15cm, are shown in Figs. 12. These figures demonstrate the extent of scouring and
deposition, as effected by the presence of the spur dykes. Note again that the deposition on the bank side (y=0) is generally beneficial for bank protection purposes. Excessive scouring around spur dykes needs attention regarding the stability of spur-dyke foundations. These and other aspects of the performance of the spur dykes should be assessed in an integrated fashion, with the aid of advance analysis procedure, such as proposed by Zhang et al. (2005a). (3) Measured performances of permeable and
impermeable spur dykes: a comparison Permeable spur dykes may be realized in real
channels with grouped (wooden) piles or naturally grown trees. As such, they may trap sediments and yield beneficial effects where appropriate, especially in terms of riverine aquatic habitats.
With this and other considerations, Zhang et al. (2005b) performed two comparable experiments on either permeable or impermeable spur dykes. The flume used was 20m long, 0.99m wide and 0.3m deep. Ten rows of spur dykes were installed on either side of the channel, at a spacing of 60cm, with their axes normal to the channel. Each row of the spur dykes was 14.6 cm long. In the permeable case, each row of the spur
Fig.12 Cross-stream and longitudinal profiles showingscouring and deposition patterns (Zhang et al., 2005a)
-1-0.8-0.6-0.4-0.200.20.4
0 0.5 1 1.5 2 2.5 3
-1
-0.5
0
1.00 1.49 2.00 2.27 2.93 3.20
Experiment Computation
δz b
/Hm
aδ
z b/H
max
Y/b
X/L
(a) Cross-stream profile
(b) Longitudinal profile
Fig. 11 (a)Measured and (b)predicted changes in final bed topography (Zhang et al., 2005a); Gray levels encode thechange of vertical coordinate
X0 15 30 45 60 75 90 105 120 135 150 165 180 195
05
101520253035404550556065707580859095
100
Y (cm) (b) X (cm
(unit: cm) Y (cm) (a)
X0 15 30 45 60 75 90 105 120 135 150 165 180 195
05
101520253035404550
X (cm)
dykes consisted of twelve vertical piles 0.6 cm in diameter, with a center-to-center spacing of 1.2cm. Velocity field The flow fields around the impermeable and permeable spur dykes are compared in Figs. 13. Here the horizontal velocity vectors on a horizontal plane (z=3.25cm) are plotted with arrows, together with gray levels representing the intensity of the vertical velocities, w . Only the right-hand portion of the velocity field was plotted herein, with consideration of the geometrical symmetry of the channel. Let us first look at the impermeable case (Fig. 13(a)). The flow separated at the heads of the spur dykes, with the strongest flow separation occurring at the first spur dyke (x=150cm). In the embayments between the spur dykes, the flow velocities were significantly reduced. In contrast, in the permeable case the flow directions did not change appreciably even in the embayment areas(Fig. 13(b)). The reduction in flow velocity immediately downstream of the first spur dyke was moderate (only 25%) In further downstream areas, however, significant reduction of velocity (about 60%) took place beyond the second spur dyke (x=210cm).
.
Fig.13 Comparison of measured velocity profiles in (a) impermeable and (b) permeable spur-dyke cases (Zhang et al., 2005b)
Fig.14 Comparison of measured bed topographies in (a) impermeable and (b) permeable spur-dyke cases (Zhang et al., 2005b)
x (cm)
x (cm) (b) y (cm)
unit: cm (a) y (cm)
X100 150 200 250 300 350 4000
15
30
45
60
75
90
X
Y
100 150 200 250 300 350 4000
15
30
45
60
75
90
105
120
135
150
165
180
195
unit: cm/s (a)
y (cm)
(b) y (cm)
x (cm)
x (cm)
Bed morphological changes The measured changes in final bed elevation are plotted in Figs. 14 for both of the impermeable and permeable spur-dyke cases. In the impermeable case, severe local scouring occurred around the heads of all the spur dykes (Fig. 14(a)). The scouring at the first spur dyke was particularly severe. The degradation in the main channel due to flow deflection was apparent beyond the first spur dyke
The changes in bed morphology in the permeable case may be featured by reduced extent of scouring around the spur dykes (Fig. 14(b)). In fact, the scour
holes around the heads of the spur dykes were generally shallow if any. Deposition occurred in a localized, dispersed fashion immediately behind each of the spur dykes. The degradation in the main channel was somewhat moderate, compared with the impermeable case. Overall, the comparison of the two cases of experimentation demonstrated a few intriguing aspects of permeable spur dykes. It is hoped that advanced analysis, such as proposed by Zhang et al. (2005a), may explore the physics of permeable spur dykes under a comprehensive range of stream conditions.
3.2 Levee breaching and resulting outbursts
Levee systems in river basins undoubtedly play a
pivotal role for safeguarding the people and property against flooding. Recent levee breaching cases, however, revealed the limitations in current understanding of the levee behaviour under extreme floods. In what follows, an attempt will be made of analyzing the flow-out pattern through a breached section (Amiruddin et al., 2005).
The particular analysis was motivated by the levee
breaching case at Tachino, on the right-hand bank of the Maruyama river (Toyooka River Office, 2005). One may readily note the savage power of outbursts and associated distinct erosion (refer to Fig. 15). From a sedimentological viewpoint, the formation of two long sandy stretches on the paddy field is also of interest, because it may relate to the process of the levee breaching. For immediate practical purposes, such a flow-out analysis will be useful in anticipating the extent and speed of outbursts, thereby assisting in the design of
Fig. 15 Breaching-induced morphological changes in an area adjacent to the Maruyama River
lead time for evacuation or emergency levee-raising work. The definition of the problem taken up here is
illustrated in Fig. 16 (Amiruddin et al., 2005). It is assumed that a flood-control levee, 5 m high, has undergone overflow for a certain period at extremely high flood stage. The body of the levee has thinned by erosion and has eventually given way, causing outbursts. For purposes of computation, the width of the breached section was taken equal to 50m. In order to keep the problem tractable, they neglected the effect of continued supply of flood water after breaching. A rectangular computational domain of 300m x 250m x 5.2m was subdivided into a non-uniform mesh that consisted of 152 x 127 x 8 grids in x, y and z directions. The calculation started with instantaneous removal of the breached section, and the flood water was allowed to flow out over a level ground, which was assumed to be rigid, smooth and impermeable. The computational code used is a three-dimensional version of LIQSEDFLOW (Sassa et al., 2003) that basically combines Navier-Stokes/continuity equations for a liquefied (or
fluidized) soil domain with a consolidation equation for a solidifying soil domain (Miyamoto et al., 2004). The free surface and solidification interface may be traced as part of the solution procedure by using a volume-of-fluid (VOF) technique.
An idea about the flow-out pattern following abrupt breaching may be obtainable from Fig. 17 (Amiruddin et al., 2005). Here calculated contours of equal elevations in the free surface are shown for an elapsed time of 50 s. The flow head reached a location as far as 130 m from the levee and was still moving forward at a speed of 3 m/s or so. These observations alone are indicative of the potentially destructive power of outbursts following levee breaching.
Related, detailed analyses are ongoing as a part of the 21st COE research project for the year 2005.
3.3 Remarkable onshore transport of beach sand in a typhoon event This sub-section briefly reports an extreme event that occurred in the Kataonami sand beach, Wakayama in association with typhoon 0423 (Sekiguchi et al., 2005; unpublished report). The event involved significant retreat of the shoreline. However, a great deal of beach sand was transported landward in contrast to common understanding (refer, for example, to Komar, 1998).
The Kataonami sand beach is a nourished and constructed one (Wakayama Prefectural Government, 2004; personal communication). It extends over a section 1200m long on the west side of the Kataonami
spit, with a total of six detached breakwaters (Fig. 18a). Snapshots of the Kataonami Beach House before and after the event are presented in Figs. 18b and 18c, demonstrating the extent of the sand transfer.
The Kataonami Beach House is situated in the middle of the northern section (600m long) of the beach. Before- and after-event profiles though points in proximity with the facilities are shown in Fig. 19. It is evident that the shoreline retreated by over 40m, and that a great amount of sand was transported landward, accreting on the backshore as thick as 2.8 m. What factors contributed to such a remarkable sand transfer event ? The tide level should be an important
Fig. 16 Definition sketch for a three-dimensional levee breaching problem (Amiruddin et al., 2005)
0.12 =ρ 0.01 =ρ (water) (air)
2.0 m
250 m
100 m 198 m
Flow direction
5.0
m
Reservoir
50.0 m
0.2m
Breached section
Levee
4.73
4.54
0.804.304.30
4.73
4.54
0.30
0.80
0.80
0.80
0.30
3.80
2.801.80
1.08
-100 -50 0 50 100 150 200
250
200
150
100
50
0
x-direction: m
y-di
rect
ion:
m
Fig. 17 Predicted flow-out pattern following levee breaching (Amiruddin et al., 2005)
Levee Units:in meter
factor (Fig. 20). The tide records (Wakayama Meteorological Office, 2004) suggest that on 20 October 2004 when typhoon 0423 hit the Wakayama area, the tide level rose to nearly 2.5 m above DL (tidal datum level), with a definitive storm-surge effect (0.9 m high or so). It is thus believed that the high tide level occurred when the sea was most violent in association with the passage of the typhoon.
Certainly, further collaborative research is needed
focusing on the event-induced sand transport. Advanced mesoscale modelling (e.g., Mase et al., 2005) may facilitate a realistic estimate of the storm-induced offshore wave field. Shallow-water effects on wave transformation may then be evaluated. Then the swash-zone dynamics involving the rapid sediment transfer and morphological changes will become a really challenging issue.
2003
(a) (b) (c)
Fig. 18 (a) Kataonami spit area in 2003 (adapted from an aerial photograph, Nakanippon Co. Ltd); (b) efore-event imagery on a brochure of Kataonami sand beach and (c) after-event snapshot of Kataonami Beach
The foregoing discussions have emphasized the importance of advanced modelling for the fluid-sediment interactions that characterize sediment routing systems. Such modelling constitutes an integral part for addressing the regional diversity in hazard mapping. As such, it should be coupled into the framework of mesoscale modelling that aims at ever higher resolution.
The research strategy along this line may also contribute to designing a real-time operational, hazard-risk forecasting system on a basin or sub-basin scale. In this context, the art and sciences of data assimilation will be increasingly important, inspiring synergy between cutting-edge numerical analysis, exploratory physical modelling and strategic observational studies.
Acknowledgements
The authors benefited from discussions with many colleagues and researchers in the course of studies leading to this paper. Special thanks go to professionals in governmental and public sectors who provided the authors with invaluable field data. The first author would like to extend his thanks for the assistance in drafting the paper to: Amiruddin, Kriyo Sambodho, Raj H. Sharma and Hao Zhang.
Surface Processes, Blackwell Science, pp. 114-128. Amiruddin, Sassa, S., Miyamoto, J. and Sekiguchi, H.
(2005): Fluidized sediment gravity flows: modeling and validation, Proc. Int. Conf. Monitoring, Prediction and Mitigation of Water-related Disasters, Kyoto, pp. 545-550.
Ashida, K. and Michiue, M. (1972): Study on hydraulic resistance and bed-load transport rate in alluvial streams, J. Japan Soc. Civil Engrs, No. 206, pp. 59-69 (in Japanese).
Information Service Center for Disaster Prevention (2005): Natural Disasters in 2004 (in Japanese); http://www.bosaijoho.go.jp/saigai2004.html/.
Kim, K. and Yamashita, T. (2005): Wind-wave-surge
interaction in shallow water: simulation of the storm surge in the Yatsushiro sea by T9918, Int. Conf. Monitoring, Prediction and Mitigation of Water-related Disasters, Kyoto, pp. 731-736.
Komar, P. D. (1998): The budget of littoral sediments. In: Beach Processes and Sedimentation, Second edition. Prentice-Hall, Inc., pp. 66-72.
Mase, H., Oki, K., Hedges, T. S., and Hua Jun Li (2005): Extended energy-balance-equation wave model for multidirectional random wave transformation, Ocean Engineering (in press).
Miyamoto, J., Sassa, S. and Sekiguchi, H. (2004): Progressive solidification of a liquefied sand layer during continued wave loading, Geotechnique, Vol. 54, Issue 10, pp. 617-629.
NII (2005): List of the ten typhoons that hit Japan in 2004 (in Japanese); http://agora.ex.nii.ac.jp/digital-typhoon/news/.
Sassa, S., Miyamoto, J. and Sekiguchi, H. (2003): The dynamics of liquefied sediment flow undergoing progressive solidification. In: Submarine Mass Movements and their Consequences (Locat, J. and Mienert, J. eds), Kluwer Academic Publishers, pp. 95-102.
Seibold, E. and Berger, W. H. (1993): Effects of waves and currents. In: The Sea Floor, Springer Verlag, pp. 97-98.
Sekiguchi, H., Nakagawa, H., Sawada, T., Ishigaki, T., Hayashi, T., Yamashita, T., Ueno, T., Muto, Y., Baba, Y., Kato, S. and Serizawa, S. (2004): Complex fluid-sediment interactions in fluvial and coastal environments, Annuals of Disas. Prev. Res. Inst., Kyoto University, No. 47C, pp. 55-70.
Sharma, R. H. and Nakagawa, H. (2005): Shallow landslides induced by transient rainfall, Proc. Int. Conf. Monitoring, Prediction and Mitigation of Water-related Disasters, Kyoto, pp. 507-512.
Surgi, N., Tuleya, R., Qingfu-Liu, Gopalkrishnan, S., Shen, W., Jovic, D., Falkovich, A., Bender, M., Marchok, T., Ginis, I. and Thomas, B. (2004): Hurricane modeling at EMC. http://www.emc.ncep.noaa.gov/research/NCEP-EMCModel Review 2004/EMC-HWRF.pdf.
Tamai, N. (2004): Report on the 2004 Hokuriku Torrential-Rain Disasters (in Japanese), JSCE Reconnaissance Group; a PDF file is available on http://jsce.nagaokaut.ac.jp/.
Toyooka River Office (2005): Final Technical Report, the ad hoc Committee on the Maruyama River Levee System, 57pp. (in Japanese) .
Van Genuchten, M. Th. (1980): A closed-form equation
for predicting the hydraulic conductivity of unsaturated soils, Soil Sci. Soc. Am. J., Vol. 44, pp. 892-898.
Wakayama Meteorological Office (2004): Tide records in October 2004 (in Japanese).
Yamane, Y. and Hayashi, T. (2005): On the environment of tornado in the Indian subcontinent, Int. Conf. Monitoring, Prediction and Mitigation of Water-related Disasters, Kyoto, pp. 365-368.
Yamashita, T., Kato, S. and Baba, Y. (2005): Wind and wave-induced coastal current system, Proc. Int. Conf. Monitoring, Prediction and Mitigation of Water-related Disasters, Kyoto, pp. 743-748.
Yamashita, T., Nishiguchi, H., Kim, K. and Tamada, T. (2004): Numerical simulation of wind and
precipitation fields of typhoon, Annual Journal of Coastal Engineering, JSCE, Vol. 51, pp. 1241-1245 (in Japanese).
Zhang, H., Nakagawa, H., Ishigaki, T. and Muto, Y. (2005a): Prediction of 3D flow field and local scouring around spur dykes, Annual Journal of Hydraulic Engineering, JSCE, Vol. 49, pp. 1003-1008.
Zhang, H., Nakagawa, H., Ishigaki, T., Muto, Y. and Khaleduzzaman, A.T.M. (2005b): Flow and bed deformation around a series of impermeable and permeable spur dykes, Proc. Int. Conf. Monitoring, Prediction and Mitigation of Water-related Disasters, Kyoto, pp. 197-202


![[INNOVATUBE] How Do An Investor Makes An Investment Decision? - Hajime Hotta](https://static.documents.pub/doc/80x56/58ae20821a28ab7e4a8b59bb/innovatube-how-do-an-investor-makes-an-investment-decision-hajime-hotta.jpg)


