The contribution of the third-generation Fourier spectrometer, built at the Laboratoire Aim6 Cotton andcurrently at the Laboratoire d'Infrarouge, to meteorological and high resolution Doppler-limited measure-ments is reported citing typical examples and the latest instrumental improvements. A tilt-compensatedtriple-pass system for use with previously built Fourier spectrometers to increase the resolution by 3 is de-scribed. The resulting width of the apparatus function of the triple-pass third-generation interferometeris better than 0-3 cm-' and can be meaningfully expressed in frequency units. Its actual value is 27 MHz.For the first time a spectrometer is able to give very wide spectral range information with a resolving powersufficient to analyze sub-Doppler spectra.
I. Introduction
Eight years ago at the Aspen meeting the first resultson the 106 samples Fourier spectroscopy were given.Together with the computing problems, the main dif-ficulties in obtaining interferograms were overcome.The first third-generation Connes-type interferometerdescribed then was able to record in a few hours onemillion samples, which were Fourier transformed withina few minutes. The medieval period of this techniquewas losing ground to the modern one. The Columbiameeting clearly demonstrated that, even if in itself it isstill a wide field of research, Fourier transform spec-troscopy has nevertheless become a powerful tool in agreat number of areas. I have personally noted thisgradual shift in my own work. During the past eightyears my attention has gradually turned from the spe-cific FTS problems to the specific FTS results, partic-ularly those concerned with high resolution molecularspectroscopy. As it has for many others this field hasfully taken advantage of the high-information abilityof the FTS.
My purpose in this brief paper is to give short illus-trations of this high-information ability through ex-amples of molecular spectra. High information doesnot mean here only the possibility of obtaining a greatnumber of spectral elements in a relatively short time,but also that the information be both accurately mea-
The author is with Universit6 de Paris-Sud, Laboratoire d'Infrar-ouge, associ6 au CNRS, 91405 Orsay Cedex, France.
sured and fully resolved. As suggested by its title, thepaper is divided in three parts in which a few commentsand illustrations of the three aspects of the high-infor-mation power of FTS will be given. Neither the methodnor the instrument will be described.
II. High Efficiency in the Collection of Data
High efficiency in the collection of data is due to themultiplex advantage.
This high efficiency could be illustrated by comparingFourier and other classical techniques. This has al-ready been widely done. Such comparisons can befound in Ref. 1, which also contains a list of Fouriermolecular spectroscopy papers. We prefer instead tocomment briefly on the material shown in Fig. 1. Letus first recall that the apparatus records interferogramswith a frequency of about 50 samples/sec. Since thenumber of samples in the interferogram is equivalentto the number of the computed spectral elements, 5 hare necessary to obtain a 106 spectral elements spec-trum. Generally the experiment is automatically per-formed during the night, which is the usual recordingtime of the interferograms whatever the number ofsamples may be. Figure 1 represents a small portionof absorption spectra which are still under study. Thesame spectral range around 2100 cm-' is presented forfive different pressures and shows the evolution of theCO line profiles. This work on CO (and OCS, CO2 )comprises eighteen different spectra, the interferogramsof which have been recorded during eighteen nights.They correspond to 6.5 X 10⁶ spectral elements, whichare plotted for the convenience for their study, on paperwith a rather contracted scale of 0.2 cm-'/cm. With
1322 APPLIED OPTICS / Vol. 17, No. 9 / 1 May 1978
such a scale, the halfwidth of the profile of each line isspread on only 0.5 mm on the paper; however, the actualtotal length of the drawings of the eighteen spectra is2300 m. On these drawings, the uncertainty of theposition of the individual lines should be representedby bars of 5-gm length. Expansion of the wavenumberscale is then necessary if one wants to illustrate the ac-curacy of the measurements. This is done in Fig. 3 toillustrate this feature through the same eighteen spectra(see Sec. III). A slide of this figure was shown at theColumbia meeting. Let us just say that the screenneeded to show entirely the eighteen spectra with thesame wavenumber scale would have to have two coin-cident sides since it should go around the world.
Let us conclude with the last sentence of the Aspenpaper of Fellgett2: "In recent laboratory work, theConnes have multiplexed one million spectral elements.This means that observations can be secured in a yearwhich without the multiplex advantage, in an otherwisecomparable spectrometer exploiting the Fourier andinterferometric advantages, would take longer than manhas been on the earth."
III. Accuracy of the Wavenumbers Measurement
Wavenumber accuracy is not due to the multiplexadvantage, but proceeds directly from the Michelsoninterferometer.
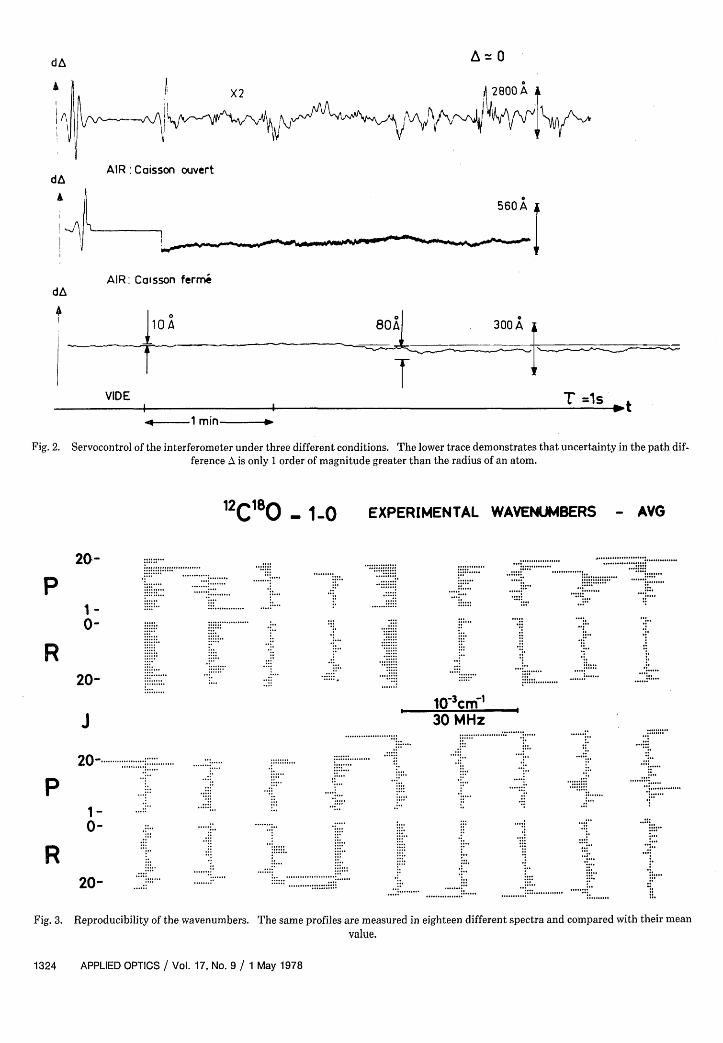
The wavenumbers a- in the spectrum and the pathdifference A in the interferogram are related by theFourier transform. Consequently, in order to get ac-curate wavenumbers, A must be accurately determined.This is why the apparatus is in a vacuum tank where thedisturbing effects of turbulence and uncertainties in therefractive index can be avoided. In addition no par-asitic blending absorption of the atmospheric molecules(H2 0, C0 2) occurs. Figure 2 illustrates the servocontrolof A under three different conditions through the signalof a white source interferogram at the zero-path dif-ference. Open air recording is given above. The mid-dle trace corresponds also to atmospheric conditions,but the tank is closed. The amplitude of the fluctua-tions is reduced by 15. The same factor of reduction isagain obtained when the tank is evacuated as shown onthe lower trace. The peak-to-peak amplitude fluctu-ations are then equal to 10 A, which is only an order of
P(TORR) L=82m
-. 05 - i
.2
- v _~W
I1115 e1
1-0 27 2-1 260
I
I 1
r
37036 e
28A 38 v
6cr=54 10-3 cm-1
I 11 1 1
3 ]i
I
A
--I- --- I
AR2
2.8 - -
11.8
0 0 0~~~~~2096cm-1
r1.0m~~~~~~~~~~~~~~~~~~~~~~~~~1
R10
I , 'l .
. 2105cm-1
Fig. 1. Five absorption spectra of six isotopic species of CO with different pressures. The figure shows only 16,000 among the 6.5 X 10⁶ spectralelements under study.
1 May 1978 / Vol. 17, No. 9 / APPLIED OPTICS 1323
0 P3
w r
n 'a i 11_- NI ' I I rmr --- r - 1 ha --
l
.
o- ��� l ior �
at1
dA
4
i l
AIR: Caisson ouvert
A
AIR: Caisson fermi
4
VIDE .- 1 min -
Fig. 2. Servocontrol of the interferometer under three different conditions. The lower trace demonstrates that uncertainty in the path dif-ference A is only 1 order of magnitude greater than the radius of an atom.
1 2 c 1 8 0_ 1-0 EXPERIMENTAL WAVENUMBERS - AVG
20-
P
R
1-*::-
::::::.:::::...: .....
,0 _ .........:......
J
P
R
10-3cm 1-30 MHz
20-. ...........:::::..........:......
...V2 0 - .~~~~~~~~~~~
1 ..:::0- %
...2
1: _....20- ...
Fig. 3. Reproducibility of the wavenumbers. The same profiles are measured in eighteen different spectra and compared with their meanvalue.
Fig. 4. The X doubling of the R(15/2)3 /2 line is about 1O-3 cm-1 Because of the Doppler effect, neither the laser nor the interferometer isable to revolve the structure.
magnitude greater than the radius of the atoms coatingthe mirrors. The right part of the lower trace is de-graded because of the researcher carefully walkingaround the interferometer.
Figure 3 contains the equivalent information as Fig.2. It uses wavenumbers instead of path difference.The positions of the lines belonging to the 1-0 band of12 C180 at 5 gm are measured in the eighteen spectrapartly shown on Fig. 1. The mean value of each wave-number is obtained from the eighteen individual mea-surements. The difference between the position of thelines in each spectrum and its mean value is given in Fig.3 for all the spectra on a rather expanded scale. Onlythe first and fourth distributions show a small system-atic shift. The peak-to-peak fluctuations in each setare of the order of 8 MHz. The discrepancy is greaterfor the weak lines corresponding to high J values of theP and R branches. This illustration of the reproduc-ibility of the wavenumbers on a very long period of time(the first spectrum has been recorded one month beforethe last one) suggests that their absolute positions canbe accurately measured. Published work3 has estab-lished that taking into account the systematic errors,the uncertainty of the standard used in the experiment,and the noise, absolute wavenumbers around 5 gm aredetermined within 2 MHz, that is, 70 X 10-6cm-1.
IV. Doppler-Limited Resolution
This feature is also due to the Michelson interfer-ometer and not to the multiplex advantage.
As for all the classical spectrometers, the resolutiondepends on the maximum path difference between theinterfering beams. It is not fundamentally limited inthe Michelson apparatus. On the other hand, amongall the different types of optical transitions (emission,absorption from various sources) the linear absorption
by low pressure molecular gas gives in the ir the nar-rowest profiles. Their broadening is essentially due tothe Doppler effect. Roughly speaking the halfwidth ofsuch lines at 1 Am is equal to about 20 X 10-3 cm-1 (10X 10-3 cm-1 is already a small value). Because of thelack of resolution of classical spectrometers, the Dopplerwidth of the transitions was not, up to recently, thedetermining factor in the sharpness of the recordedprofiles. With the progress in resolution allowed byrecent techniques, it becomes now the fundamentallimitation in linear absorption spectroscopy. Withouttaking any risks one can say that Doppler-limitedspectra recorded today or in a century, whatever thetype of spectrometer, will be as alike as two peas in apod. Figure 4 gives a comparison between two spectra,
gw,~~~~~~~~~~~~~~~~~~~~~~~~~~~~~,
gA=~~~~~~~~~~~0m~~~~
'Step 53A 039
-7MHZirg~~~~~~~~~g6 AM = O ma e II .
Fig 5 Unapodized apparatus function over its own interferogram
1 May 1978 / Vol. 17, No. 9 / APPLIED OPTICS 1325
� In- 1 .1
respectively, recorded with a diode laser4 and the 106
samples interferometer. 5 Although the laser resolution(10-4 cm- 1 ) is 25 times better, the Doppler effect (4.4X 10⁻³ cm- 1) is entirely responsible for the shape of therecorded profiles which are similar to each other in bothtechniques. Other examples of this type can be foundin Refs. 1 and 5.
By multipassing the cat's eyes of the interferometerthe maximum path difference has recently been broughtto about 6 m. The first results have already been de-scribed in Applied Optics.6 Figure 5 shows the appa-ratus function in which the theoretical and actualhalfwidth is 27 MHz. At the time the interferogram isrecorded, the interferometer acts like an engine rulinga grating 6 m long. Originally this improvement inresolution was intended to remain Doppler-limited inthe 20-,um region where the interferometer will soon beoperational. Since the resolution (in MHz) is constantover all the recorded spectral range, the 106 samplesapparatus has now at 1 ,4m a resolution 20 times nar-rower than the Doppler width of the absorption lines of
interest. Consequently sub-Doppler recordings on widespectral ranges from adequate sources become possi-ble.
The author thanks C. Chackerian, Jr., for correctionof awkward English expressions.
References
1. C. Amiot, P. Connes, and G. Guelachvili, in Proceedings of the 12th
European Congress on Molecular Spectroscopy, M. Grosmann,S. G. Elkomoss, and J. Ringeissen, Eds. (Elsevier, Amsterdam,1976), p. 743.
2. P. Fellgett, in Proceedings of Aspen International Conference on
Fourier Spectroscopy, G. Vanasse, A. T. Stair, and D. J. Baker,Eds. (Air Force Geophysics Laboratory, Cambridge, Mass., 1970),p. 139.
3. G. Guelachvili, in Proceedings of AMCO V, J. H. Sanders and A.
H. Wapstra, Eds. (Plenum, New York, 1976), p. 424.4. K. W. Will, F. A. Blum, A. R. Calawa, and T. C. Harman, Chem.
Phys. Lett. 14, 234 (1972).5. C. Amiot, R. Bacis, and G. Guelachvili, Can. J. Phys. (in press).
6. G. Guelachvili, Appl. Opt. 16, 2097 (1977).
1326 APPLIED OPTICS / Vol. 17, No. 9 / 1 May 1978
OPTICAL SOCIETY OF AMERICAAnnual Dues and Publications
The Optical Society of America was organized in 1916 to increase and diffuse theknowledge of optics in all its branches, pure and applied, to promote the mutualinterests of investigators of optical problems, of designers, manufacturers, andusers of optical instruments and apparatus of all kinds and to encourage coop-eration among them. The Society cordially invites to membership all who areinterested in any branch of optics, either in research, in instruction, in optical orilluminating engineering, in the manufacture and distribution of optical goodsof all kinds, or in physiological and medical optics. Further information can beobtained from the Executive Office, Optical Society of America, 2000 L StreetN. W., Washington D. C. 20036. Regular Members and Fellows, $35.00:These dues include subscriptions to the Journal of the Optical Society ofAmerica, Applied Optics, and Physics Today. Students, $7.00: Dues includesubscriptions to the Journal-of the Optical Society of America or Applied Optics,and Physics Today. Members may also subscribe at reduced rates to Optics andSpectroscopy and the Soviet Journal of Optical Technology. These monthlyperiodicals are translations of the Russian journals, Optika i Spectroskopiya andOptiko-Mekhanicheskaya Promyshlennost. An annual member subscriptionto each is $20.00. Corporation Members dues are $300.00 and include sub-
scriptions to all of the above journals.Circle No. 62 on Reader Service Card