24
High availability and analysis of PostgreSQL Sergey Kalinin 18-19 of April 2012, dCache Workshop, Zeuthen Tuesday, April 17, 12

High availability and analysis of PostgreSQL
Sergey Kalinin
18-19 of April 2012,dCache Workshop, Zeuthen
Tuesday, April 17, 12

Content
• There is a lot you can do with PG. This talk concentrates on backup, high availability and how to analyze the usage of your DBs.
• Mainly software part will be discussed. The analysis can also tell you how to improve your setups in terms of hardware.
• There is no hands-on session but there will be some commands and examples of settings.
Tuesday, April 17, 12
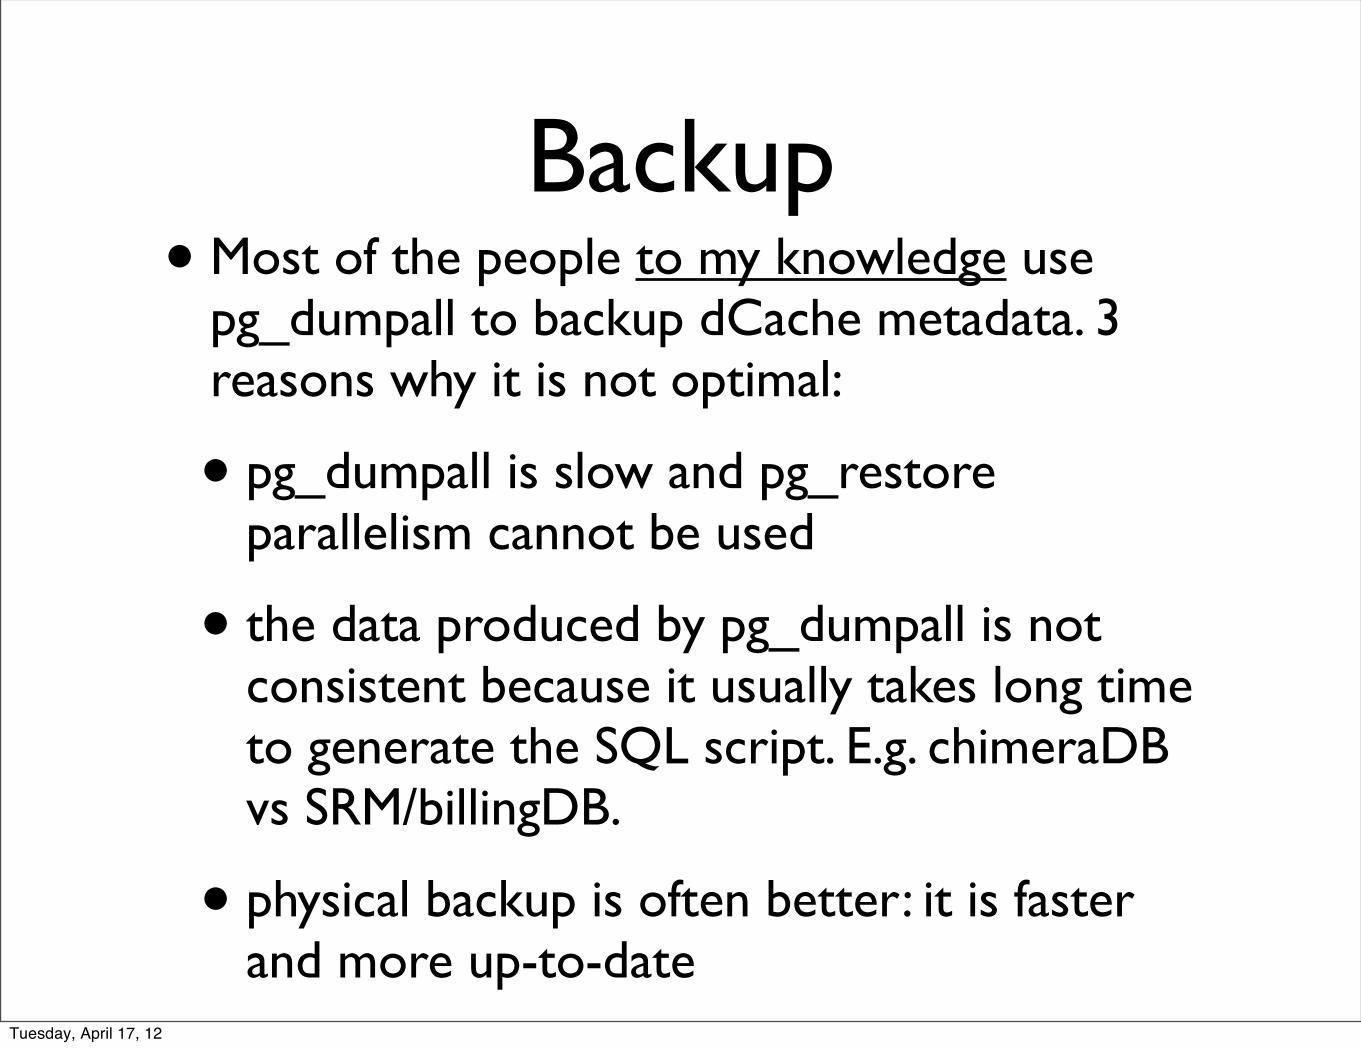
Backup• Most of the people to my knowledge use
pg_dumpall to backup dCache metadata. 3 reasons why it is not optimal:
• pg_dumpall is slow and pg_restore parallelism cannot be used
• the data produced by pg_dumpall is not consistent because it usually takes long time to generate the SQL script. E.g. chimeraDB vs SRM/billingDB.
• physical backup is often better: it is faster and more up-to-date
Tuesday, April 17, 12
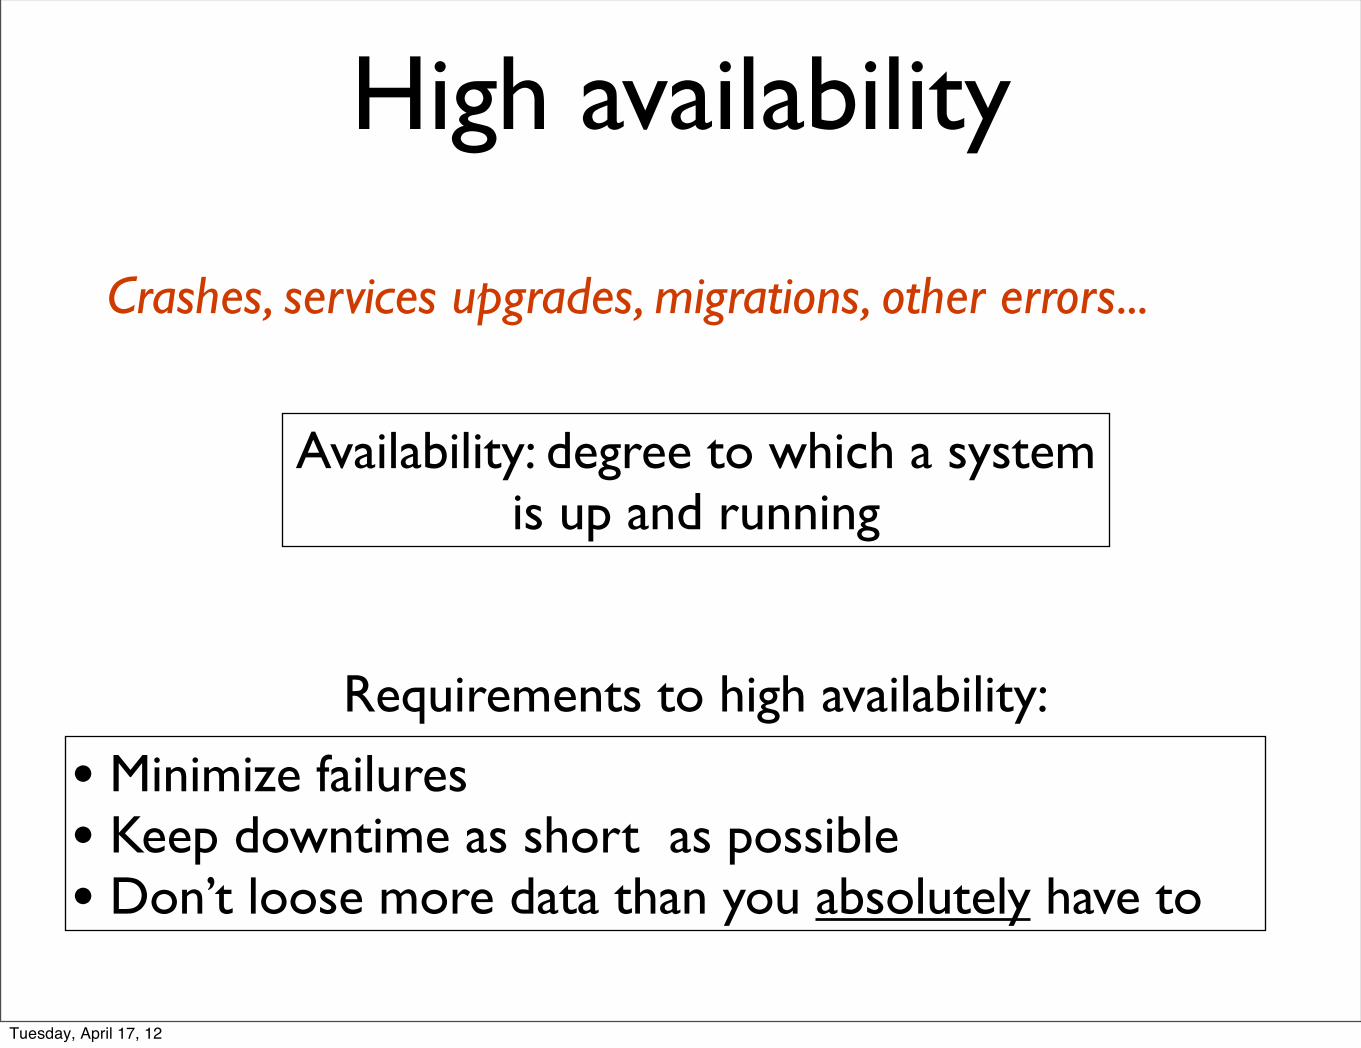
High availability
Availability: degree to which a system is up and running
Requirements to high availability:
• Minimize failures• Keep downtime as short as possible• Don’t loose more data than you absolutely have to
Crashes, services upgrades, migrations, other errors...
Tuesday, April 17, 12

Redundant vs shared
Client
MasterServer
SlaveServer Server
Client ClientClientClient
Redundant Shared
Single point of failureSlaveServer
SQL
Tuesday, April 17, 12

PostgreSQL databases replication
Physical replication:• Transparent• Network bandwidth and HDD read/writes are the time determining factors• The two systems should be identical in terms of OS, binaries, PostgreSQL• One command for everything
Logical replication(SQL, Slony):• Flexible and scalable• Lower network transfers• Allows schema differences
WAL streaming:• Is very much like Logical but requires the same system/PG binaries
Tuesday, April 17, 12
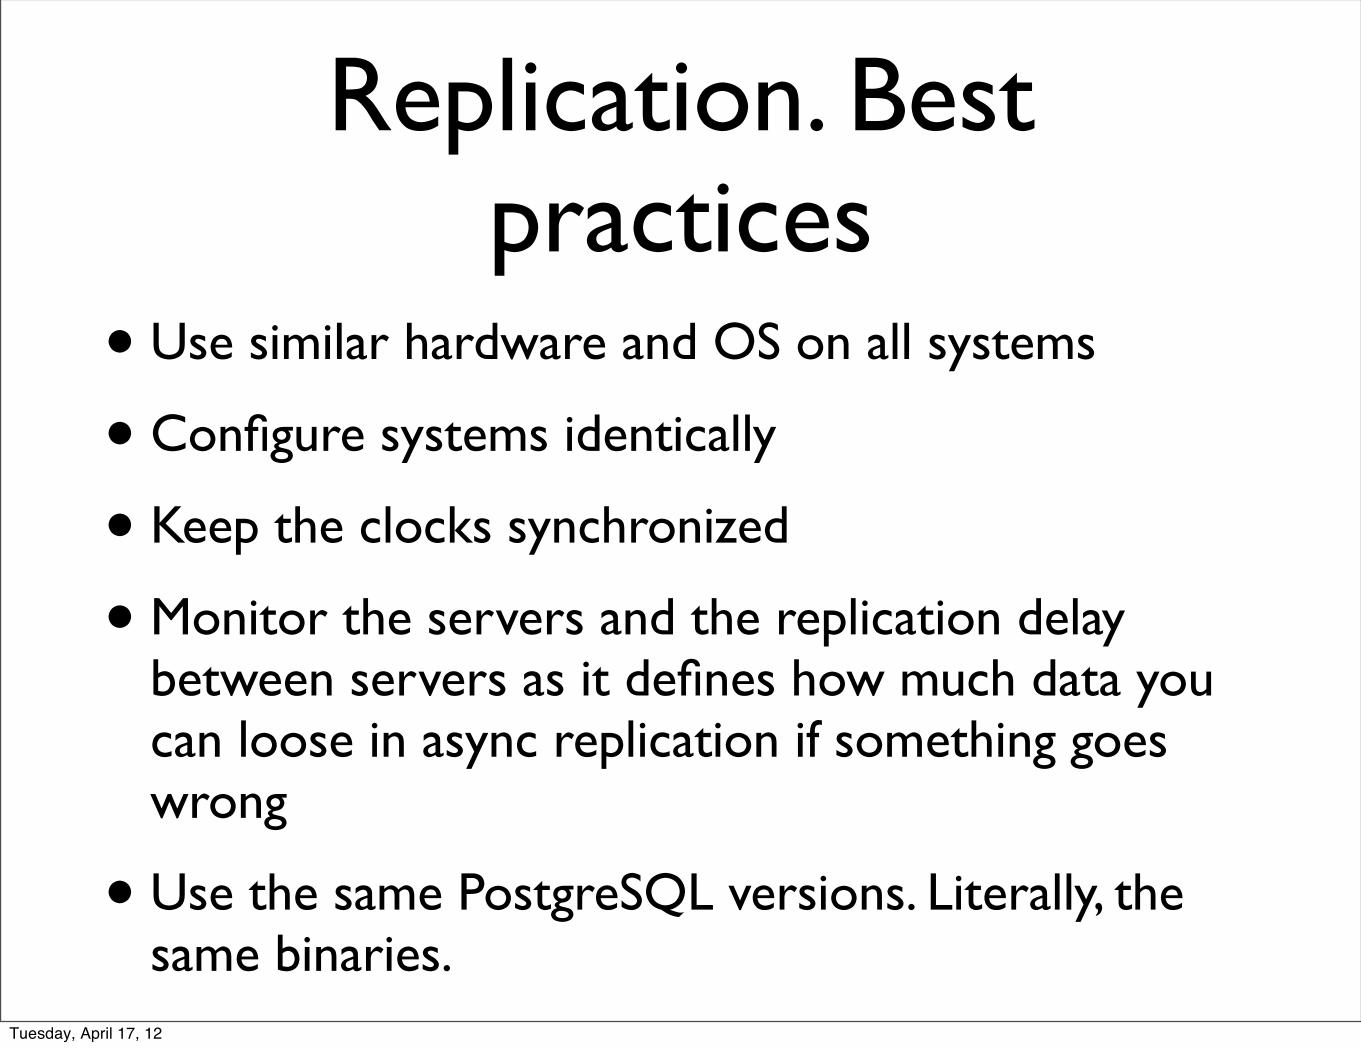
Replication. Best practices
• Use similar hardware and OS on all systems
• Configure systems identically
• Keep the clocks synchronized
• Monitor the servers and the replication delay between servers as it defines how much data you can loose in async replication if something goes wrong
• Use the same PostgreSQL versions. Literally, the same binaries.
Tuesday, April 17, 12
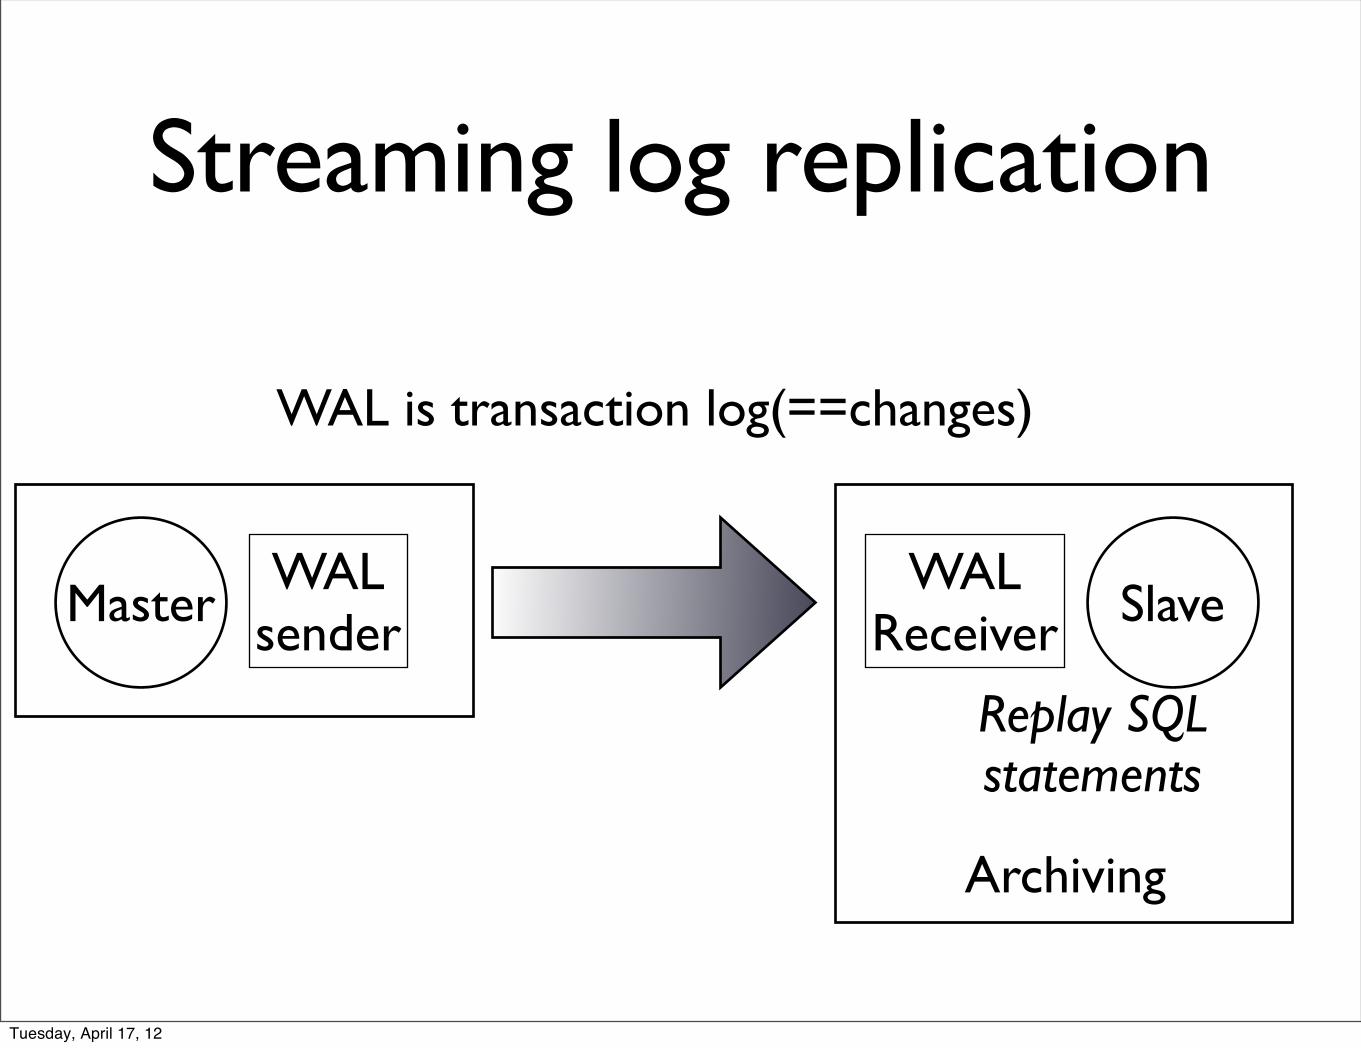
Streaming log replication
MasterWAL
senderWAL
Receiver Slave
Archiving
WAL is transaction log(==changes)
Replay SQLstatements
Tuesday, April 17, 12
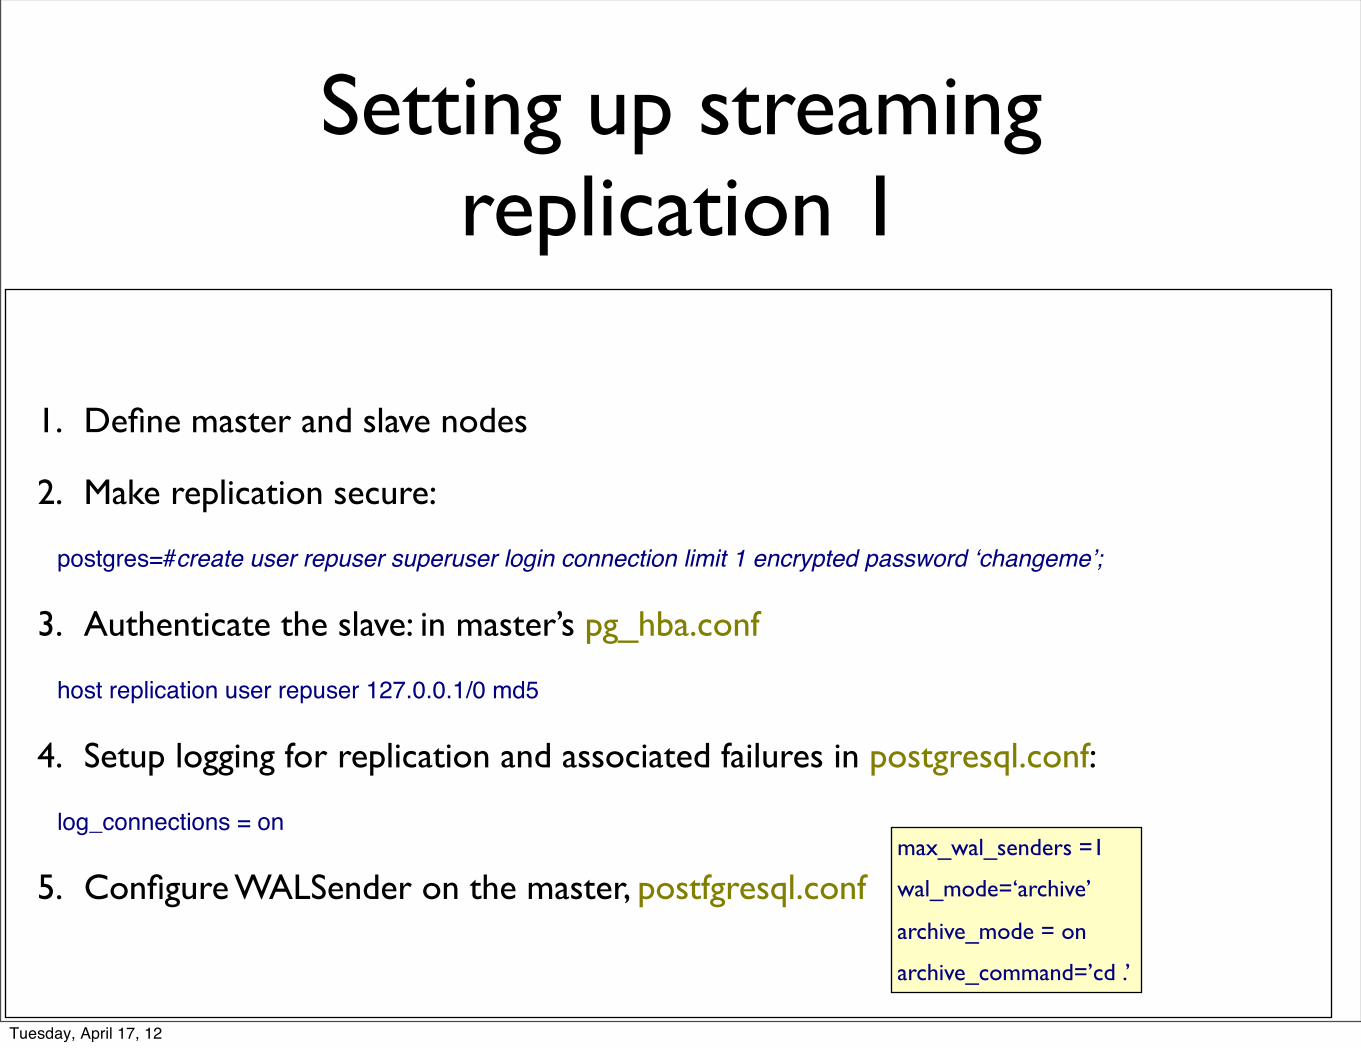
Setting up streaming replication 1
1. Define master and slave nodes
2. Make replication secure:
postgres=#create user repuser superuser login connection limit 1 encrypted password ‘changeme’;
3. Authenticate the slave: in master’s pg_hba.conf
host replication user repuser 127.0.0.1/0 md5
4. Setup logging for replication and associated failures in postgresql.conf:
log_connections = on
5. Configure WALSender on the master, postfgresql.confmax_wal_senders =1
wal_mode=‘archive’
archive_mode = on
archive_command=’cd .’
Tuesday, April 17, 12

Setting up streaming replication 2
1. Setup playback history size in postgresql.conf . E.g. 16 GB and it should not be more space than you have:
2. $psql -c "select pg_start_backup('base backup for streamingrep')"
3. $rsync -cva --inplace --exclude=*pg_xlog* ${PGDATA}/ $STANDBYNODE:$PGDATA
4. $psql -c "select pg_stop_backup(), current_timestamp"
5. Configure standby(slave) in recovery.conf . If PG sees this file, it is automatically recognizes the standby mode.
Standby_mode = 'on' primary_conninfo = 'host=192.168.0.1 user=repuser'trigger_file = '/tmp/postgresql.trigger.5432'
wal_keep_segments=10000
Tuesday, April 17, 12
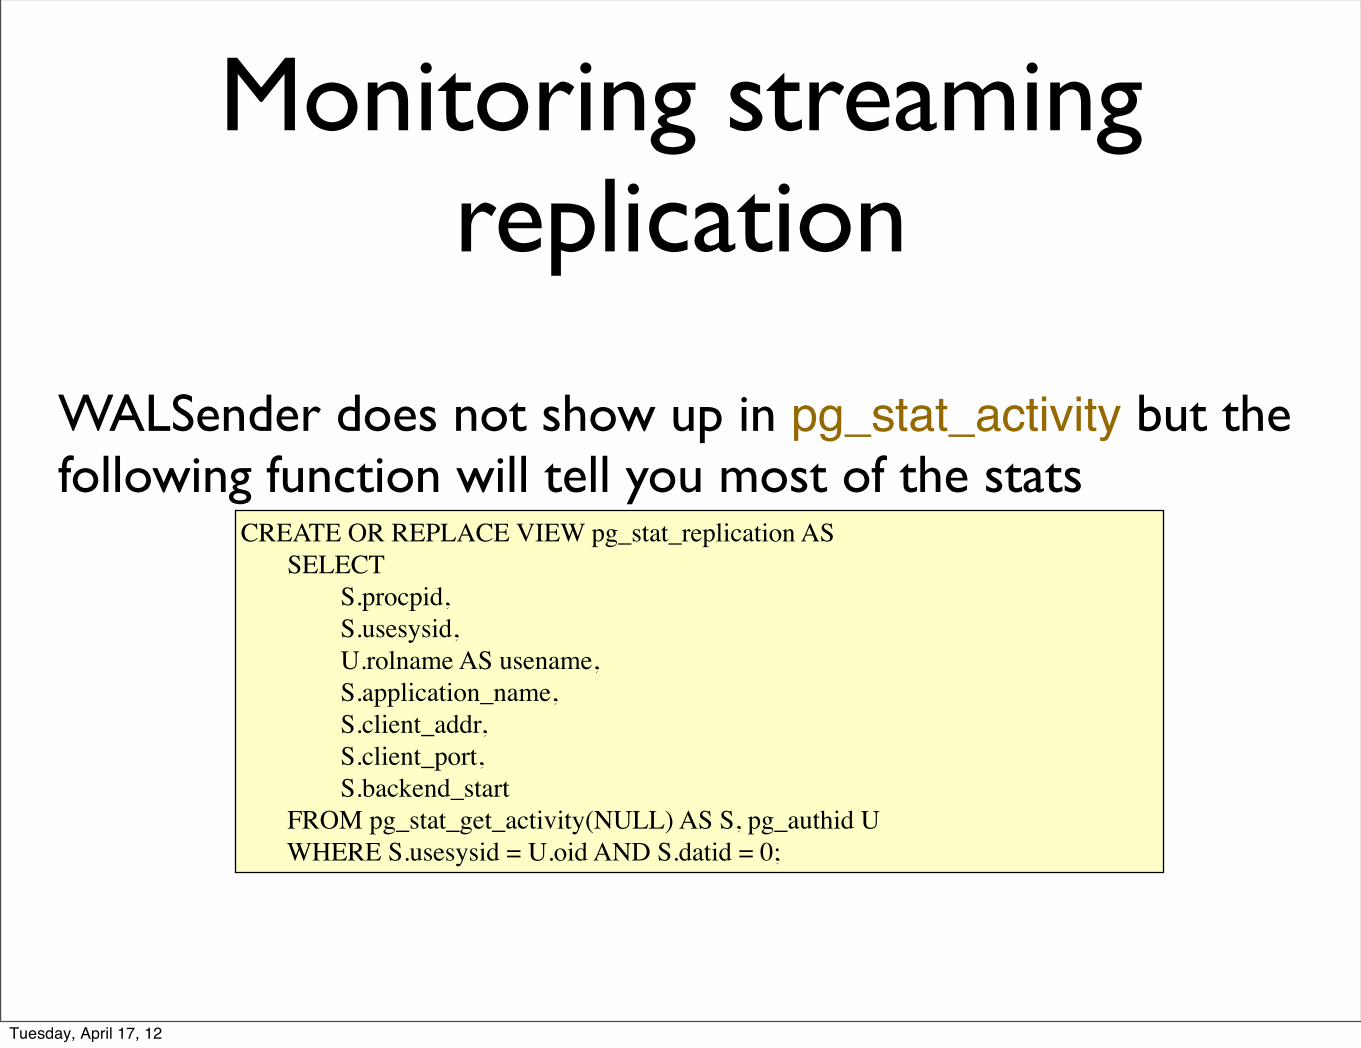
Monitoring streaming replication
CREATE OR REPLACE VIEW pg_stat_replication AS SELECT S.procpid, S.usesysid, U.rolname AS usename, S.application_name, S.client_addr, S.client_port, S.backend_start FROM pg_stat_get_activity(NULL) AS S, pg_authid U WHERE S.usesysid = U.oid AND S.datid = 0;
WALSender does not show up in pg_stat_activity but the following function will tell you most of the stats
Tuesday, April 17, 12
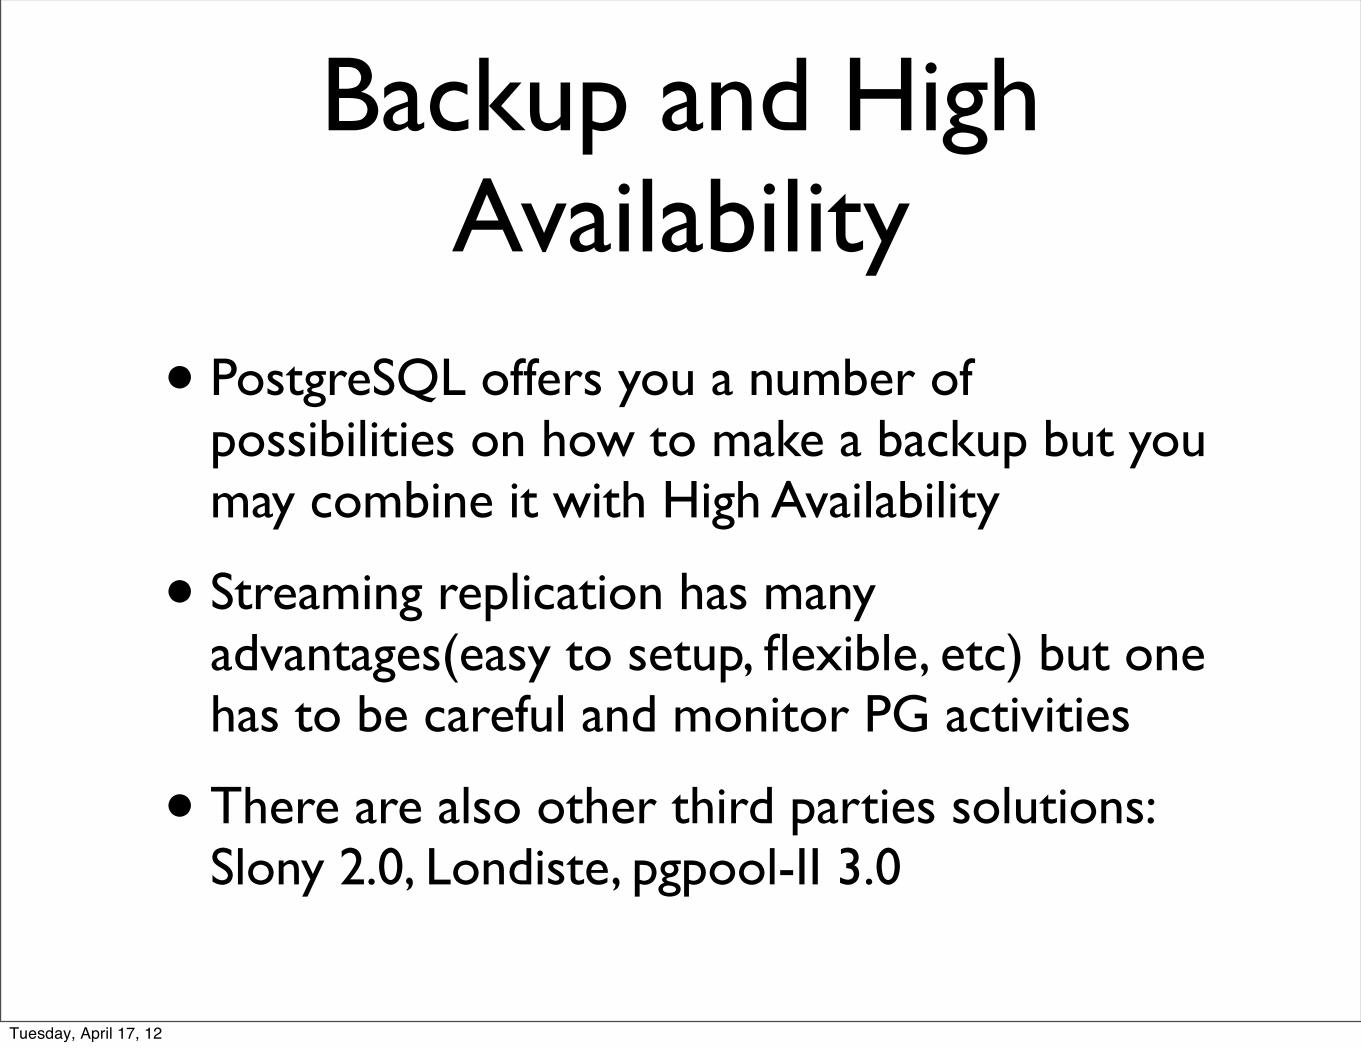
Backup and High Availability
• PostgreSQL offers you a number of possibilities on how to make a backup but you may combine it with High Availability
• Streaming replication has many advantages(easy to setup, flexible, etc) but one has to be careful and monitor PG activities
• There are also other third parties solutions: Slony 2.0, Londiste, pgpool-II 3.0
Tuesday, April 17, 12

Part 2. PostgreSQL Performance
• If you see a significant load on your dCache PostgreSQL databases, most probably, you have problems with indexes. Plot for Wuppertal head node, 3.5 millions of PNFSIDs, all dCache services except pools. 40 GB DB.
Tuesday, April 17, 12
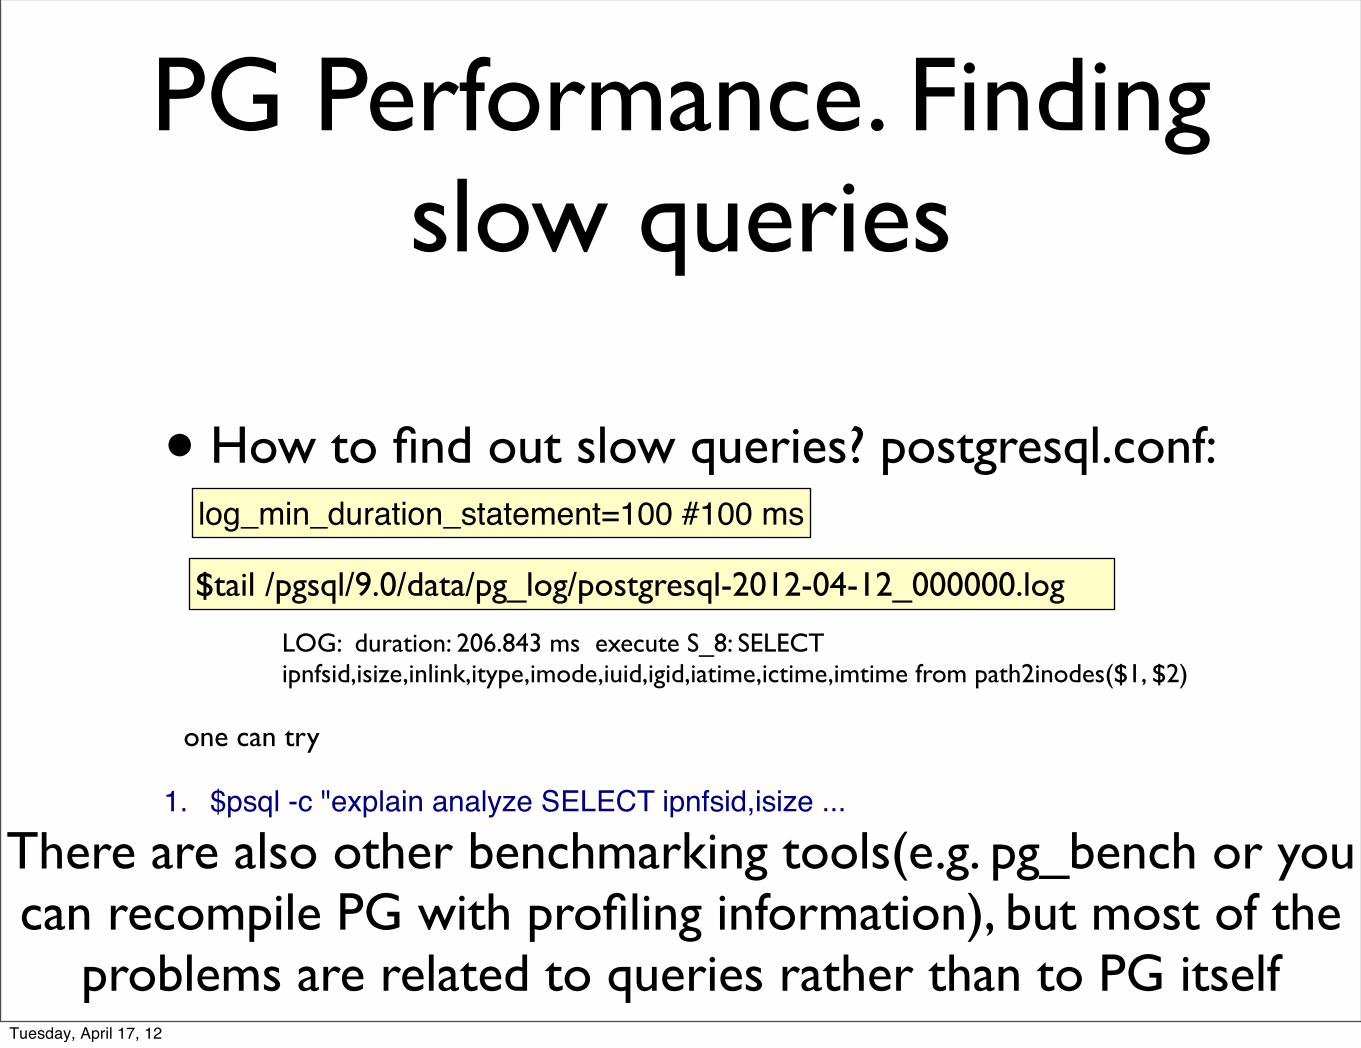
PG Performance. Finding slow queries
• How to find out slow queries? postgresql.conf:
LOG: duration: 206.843 ms execute S_8: SELECT ipnfsid,isize,inlink,itype,imode,iuid,igid,iatime,ictime,imtime from path2inodes($1, $2)
one can try
1. $psql -c "explain analyze SELECT ipnfsid,isize ...
log_min_duration_statement=100 #100 ms
$tail /pgsql/9.0/data/pg_log/postgresql-2012-04-12_000000.log
There are also other benchmarking tools(e.g. pg_bench or you can recompile PG with profiling information), but most of the
problems are related to queries rather than to PG itselfTuesday, April 17, 12

Indexing• You can create your own indices but dCache provides by default a number of
them /usr/share/dcache/chimera/sql/create.sql:
• CREATE INDEX i_dirs_iparent ON t_dirs(iparent);
• CREATE INDEX i_dirs_ipnfsid ON t_dirs(ipnfsid);
How to find which indices are used?
Tuesday, April 17, 12
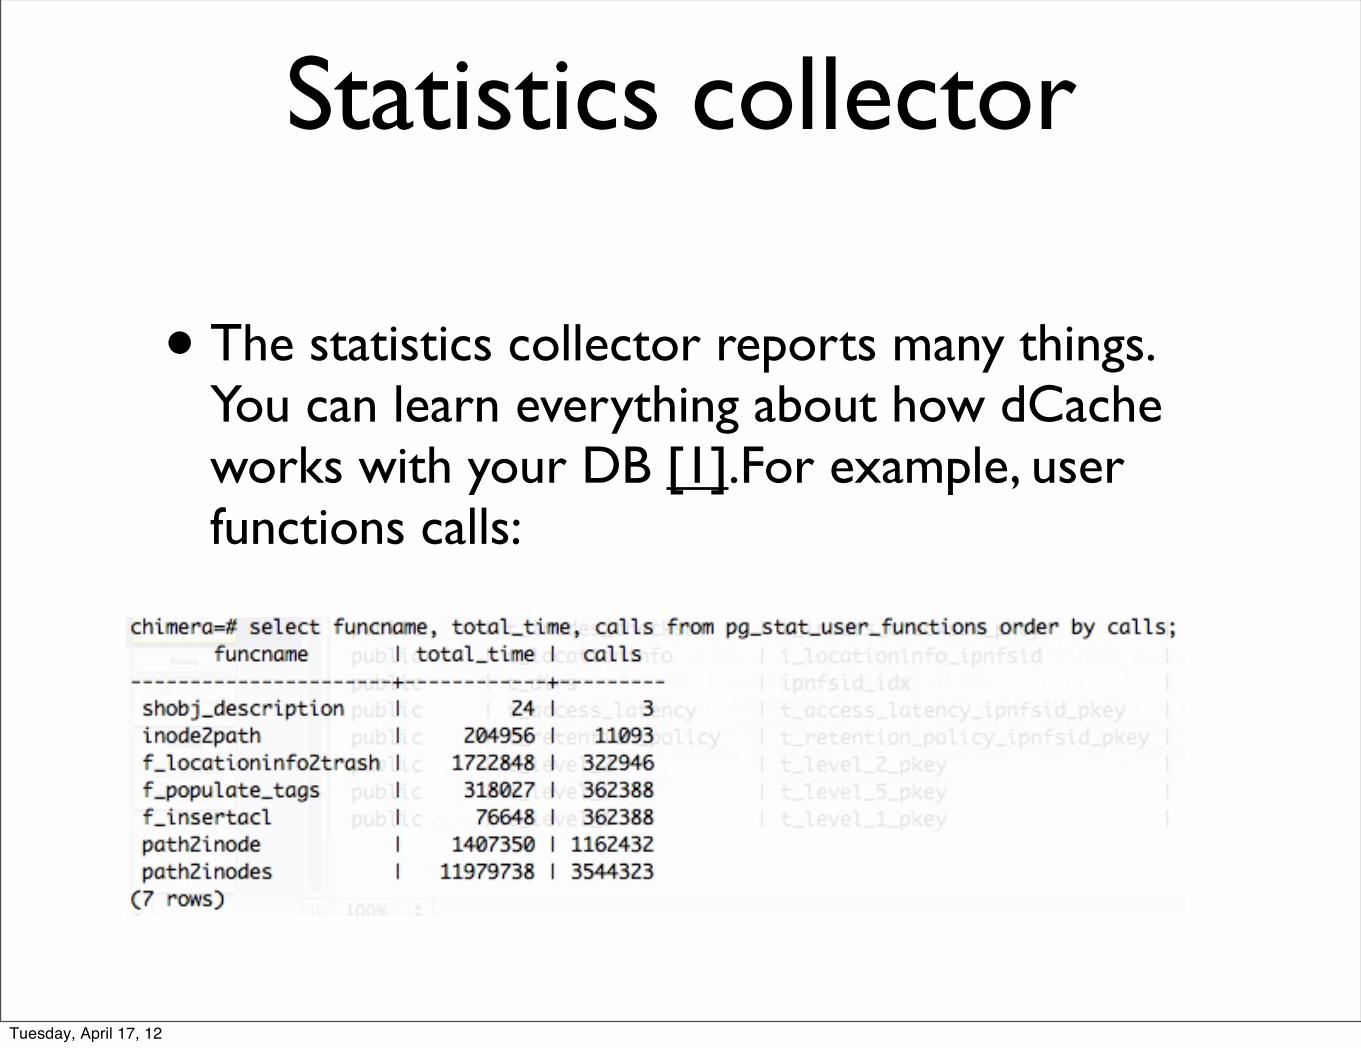
Statistics collector
• The statistics collector reports many things. You can learn everything about how dCache works with your DB [1].For example, user functions calls:
Tuesday, April 17, 12
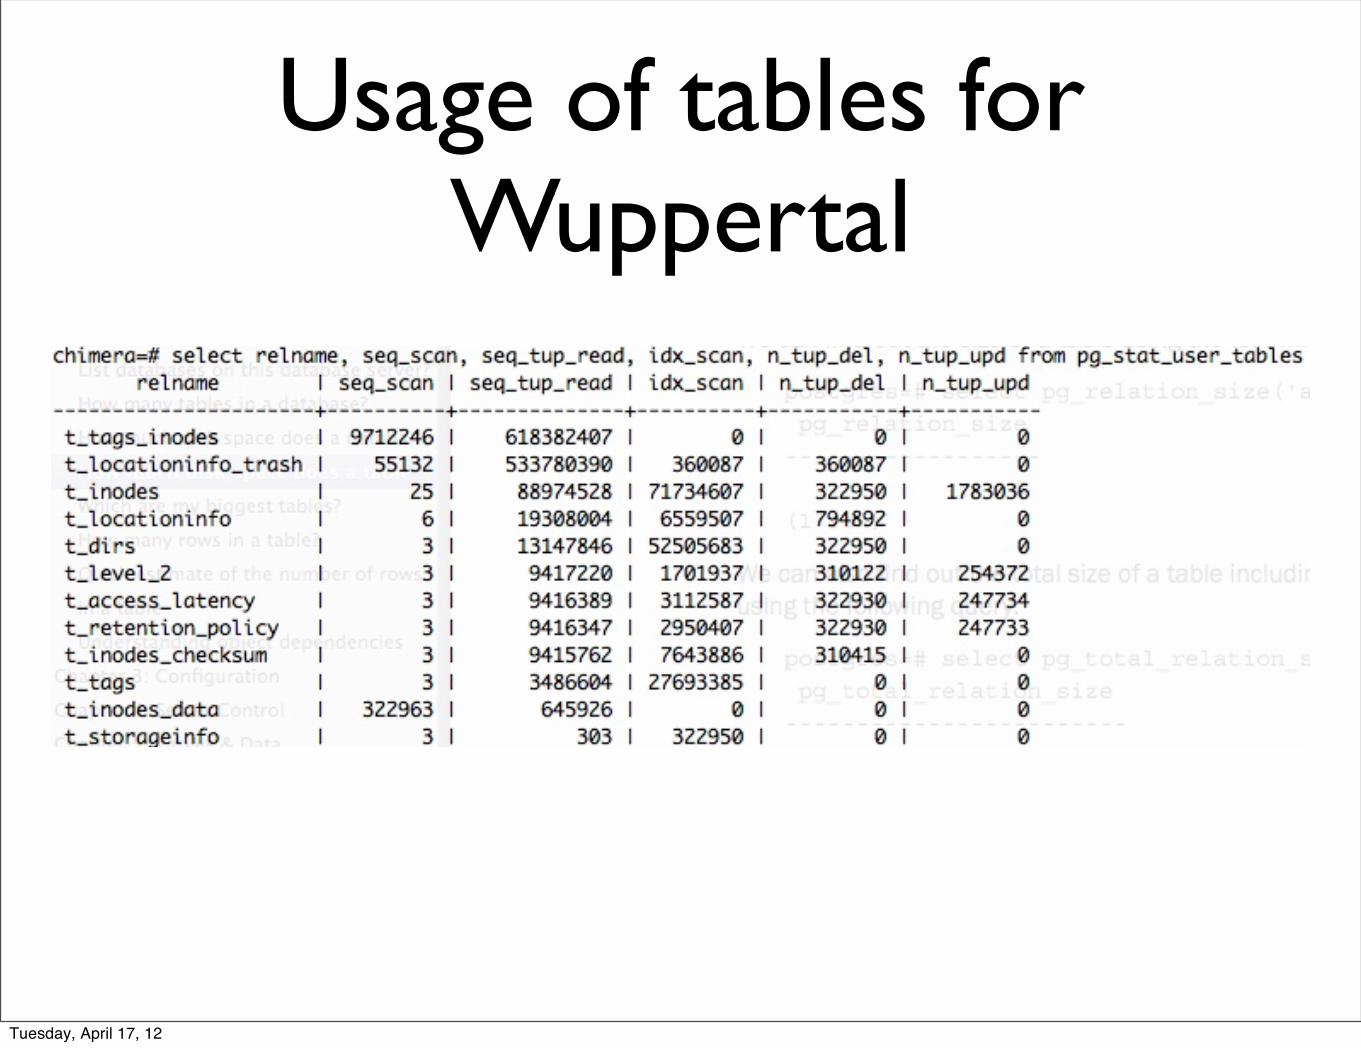
Usage of tables for Wuppertal
Tuesday, April 17, 12
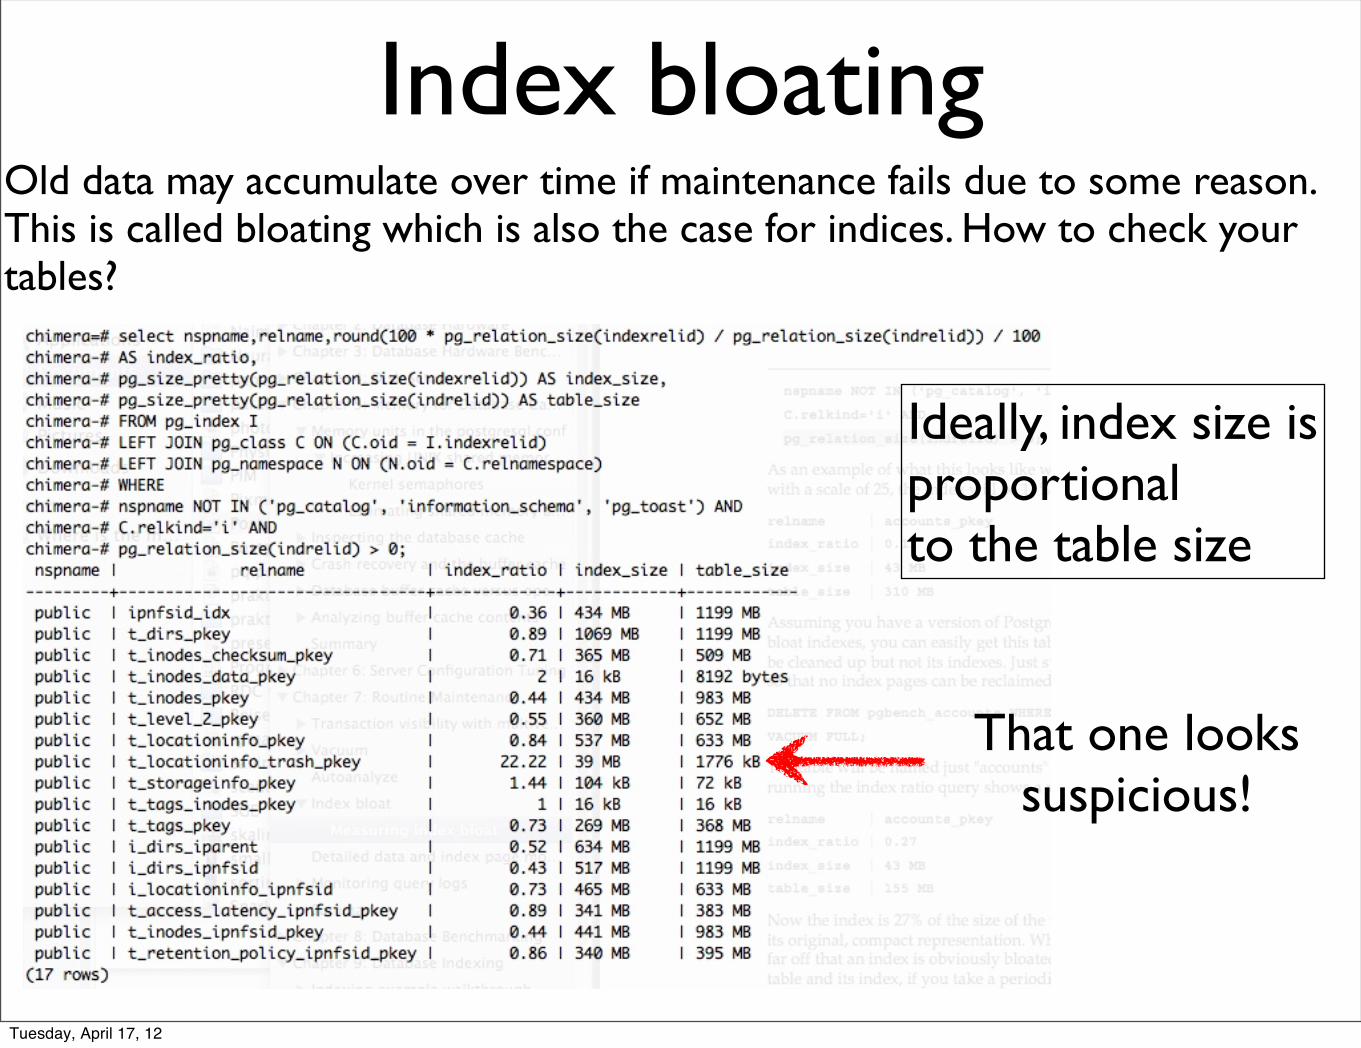
Index bloatingOld data may accumulate over time if maintenance fails due to some reason. This is called bloating which is also the case for indices. How to check your tables?
That one lookssuspicious!
Ideally, index size isproportionalto the table size
Tuesday, April 17, 12
Reindexing
• If you suspect that some of your indices are bloated due to MVCC(Multi-Version Concurrency Control) then you can simply re-index all the databases with
1. $reindex -a
• Also note here that autovacuum does not fix bloating. This is a relatively fast(~hours) procedure but speeds up sql queries
Tuesday, April 17, 12
A bit on memory management
• Many persons have a ‘natural’ intention to pin certain things in memory: tables, indexes, etc. It may sounds reasonable from the first look but in 99% it is less smarter than LRU caching. For example, if you read an index, you also read information from the table.
• All the databases and tables share the same caching memory. Note, the default PG settings ARE NOT OPTIMIZED. They are just enough to start the server.
Tuesday, April 17, 12
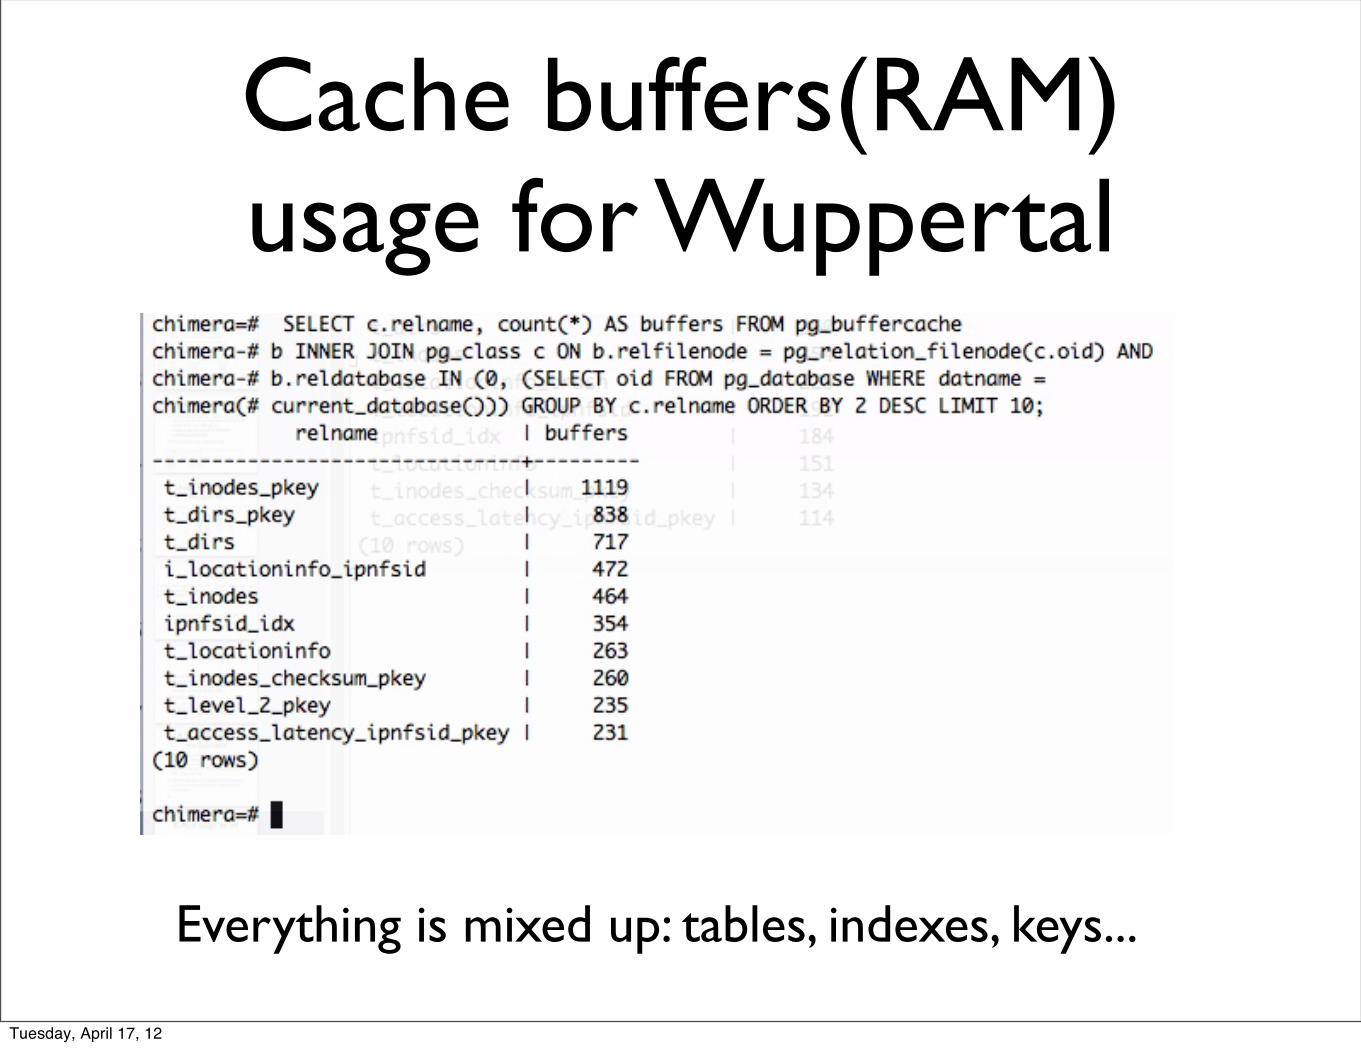
Cache buffers(RAM) usage for Wuppertal
Everything is mixed up: tables, indexes, keys...
Tuesday, April 17, 12
SSDs
• Most of the time we read data from dCache which is also true for actual data from data servers. And we read data randomly(e.g. previous slide).
• Typical size of dCache tables and indexes fits very well to those provided by currently available SSDs.
• It is worth considering as they get cheaper and cheaper. Not fast enough though...
Tuesday, April 17, 12

References
1. http://www.postgresql.org/docs/9.0/static/monitoring-stats.html
2. http://pgfouine.projects.postgresql.org/ PG logs analyzer
3. http://www.kennygorman.com/wordpress/?p=250 Python script showing PostgreSQL objects in Linux memory.
4. http://www.postgresql.org/docs/current/static/pgbench.html
5. “PostGRESQL 9.0 High Performance”, Gregory Smith, ISBN 978-1-849510-30-1
6. “PostGRESQL 9.0 Administration Cookbook”, Simon Riggs, Hannu Krosing, ISBN 978-1-849510-28-8
Tuesday, April 17, 12

Linux sys tools
• IO: iostat
• Process util: mpstat, pidstat
• System activities: sar
• HDD benchmarking: bonnie++
•
Tuesday, April 17, 12


