High Compression Ratio Turbo Gasoline Engine Operation Using Alcohol Enhancement PI: John B. Heywood Sloan Automotive Laboratory Massachusetts Institute of Technology June 19, 2014 Project ID FT016 This presentation does not contain any proprietary, confidential, or otherwise restricted information
Transcript
High Compression Ratio Turbo Gasoline Engine Operation Using
Alcohol Enhancement
PI: John B. Heywood Sloan Automotive Laboratory
Massachusetts Institute of Technology June 19, 2014
Project ID FT016
This presentation does not contain any proprietary, confidential, or otherwise restricted information
• Project start date: 9/01/2011 • Project end date: 1/15/2015
improvement (LDV) > 25% – Emission control fuel penalty
< 1% • Total project
funding:$1,203,122 – DOE share: $962,497 – Contractor share: $240,625
• Funding received in FY13: $168,748
• Funding for FY14: $167,337
Timeline
Budget
Barriers
• Cummins Inc • Project lead: MIT
Partners
Overview
2
• Objectives: – To explore and assess the potential for higher efficiency gasoline
engines through use of non-petroleum fuel components that remove existing constraints on such engines while meeting future emissions standards
– Investigate the benefits of knock-free SI engines through the use of alcohol blending with gasoline
– Substantially improve efficiency through raising the compression ratio, increasing boost (in turbocharged engines), and engine downsizing, enabled by knock-resisting properties of alcohols
• FY13-14 goals – Experiments and simulations to demonstrate thermal efficiency
improvement of > 25% over drive cycle for LDV – Determine means of decreasing use of high octane fuel
Relevance/Objectives
3
• Approach: Ethanol’s unique properties as a SI fuel: – High octane of ethanol can be used to avoid knock at high load
• Evaporative and chemical octane components important – At part loads, lower octane gasoline used, minimizing the
amount of high octane fuel used through a driving cycle
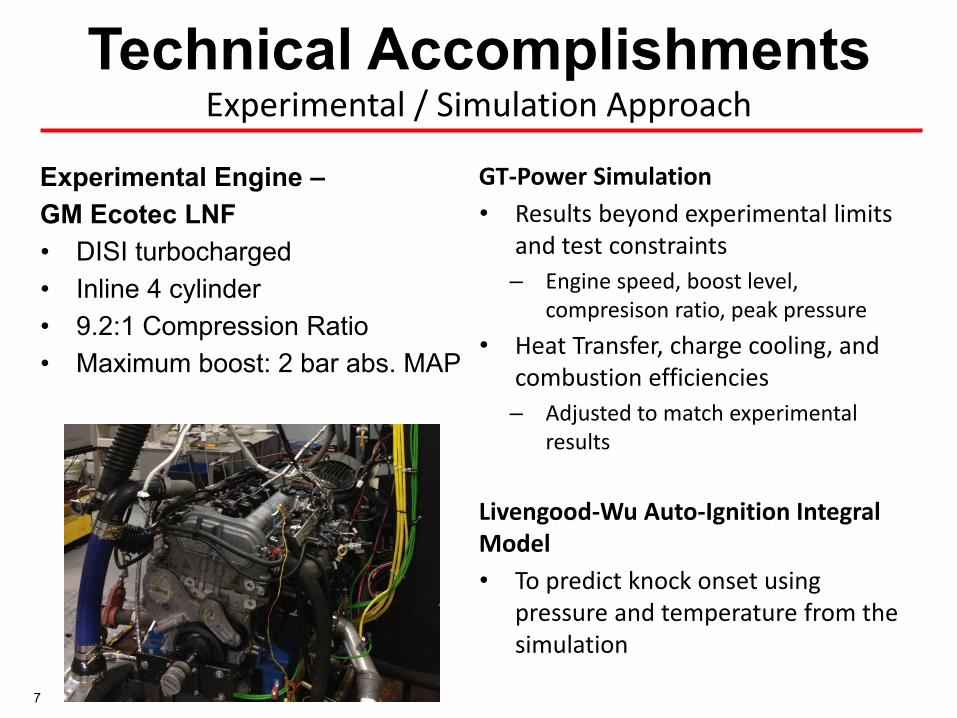
• Strategy: Combination of engine tests, engine and vehicle simulations, to quantify potential of approach – Dyno-engine testing with gasoline and alcohol fuels – Tests carried out in TC engine at MIT, and in a stronger MDV
engine at Cummins using different fuel compositions – Simulations using combustion (Chemkin), engine (GT-Power)
Engine in Vehicle Simulation Approach Technical Accomplishments
E0
E20 E10
Speed (RPM)
Torq
ue (N
m)
• Effect of downsizing is large in this this urban driving cycle: improvement in thermal efficiency ~ 40% with downsizing from 2.4 to 1 liter engine
• Impact of increased compression ratio is small – little efficiency difference between 11.5 and 13.5
0.8 1 1.2 1.4 1.6 1.8 2 2.2 2.4 2.60.2
0.22
0.24
0.26
0.28
0.3
0.32
Engine Displaced Volume (Liters)
Eng
ine
Bra
ke E
ffici
ency
UDDS Cycle
9.211.513.5
0.8 1 1.2 1.4 1.6 1.8 2 2.2 2.4 2.60
0.02
0.04
0.06
0.08
0.1
0.12
Engine Displaced Volume (Liters)E
than
ol F
ract
ion
UDDS Cycle
9.211.513.5
Engine in Vehicle Simulation Results Technical Accomplishments
13
• 3200 lb. vehicle with 2.5 liter NA engine downsized to 1.25 liter boosted TC engine), CR of 11.5, using up to 10 deg. spark retard when needed:
1. Average engine efficiency and MPG improve 33, 27, and 14% for Urban, Highway, and US06 cycles, respectively, relative to NA engine (average 24%), at constant performance.
2. Ethanol use is 1.5, 0.5, and 8% of gasoline use (on an energy basis): average 3.3%.
3. Use of spark retard important; with MBT spark timing, average efficiency and MPG improves about 4%, but average ethanol use is 15%.
4. Increasing compression ratio from 11.5 to 13.5 has modest effect on efficiency and MPG, but doubles the ethanol consumption.
5. Increasing boost (to 3000 kPa BMEP) and further downsizing to 1 liter engine (at CR of 11.5) increases average efficiency by an additional 15%, but increases average ethanol use to 7.5%.
Illustrative LDV Examples and Results Technical Accomplishments
14
• MIT leading the effort – Experiments with lower pressure capability engine – Simulations (chemical/knock, TC engine, vehicle) – MIT team: John Heywood, Leslie Bromberg, Daniel Cohn, Young Suk Jo,
Raymond Lewis
• Cummins Inc – High pressure capability boosted engine tests – Providing co-share for the project – Leader: Samuel Geckler
Collaboration and Coordination with Other Institutions
15
• Efficiency – Met project objective (improvement in efficiency by >25%) in
lightly loaded cycles (Urban, Highway), but not US06 – We have not reached target best thermal efficiency of 45% for
LDV
• Ethanol Consumption – Relatively high rate-of-consumption of high octane fuel in
aggressive cycles – Lack of widespread availability of high octane fuel (i.e., E85)
could be an issue
Remaining Challenges/Barriers
16
• FY14: – Evaluation of alcohol enhancement in medium duty vehicles
using Autonomie models for multiple drive cycles – Evaluation of hydrous ethanol for light duty vehicles – Explore engine’s octane requirement over full load range
• FY15 (No-cost extension): – Determination of cost of implementing technology onboard
vehicles • Cost of technology • Cost of engine and vehicle calibration • Cost of ownership
Proposed Future Work
17
1. Developed broader understanding of turbocharged gasoline engine performance maps, incorporating maximum pressure limits, fuel octane and knock onset constraints, effects of spark retard, higher boost/downsizing trade-off.
2. Demonstrated that ethanol’s knock suppressing potential is substantial, and will achieve project’s goals: combination of chemical octane and evaporative cooling impact.
3. Quantified effects of higher compression ratios and higher boost on performance and efficiency of knock-suppressed engine: raising boost with engine downsizing has much larger impact.
4. Engine-in-vehicle simulations, with high compression ratio, high boost, and major engine downsizing indicate up to some 40 percent improved average engine efficiency and miles per gallon (urban driving) at essentially the same vehicle acceleration performance, relative to a naturally-aspirated gasoline engine.
Project Accomplishments to date Summary
18
Technical Backup Slides
25
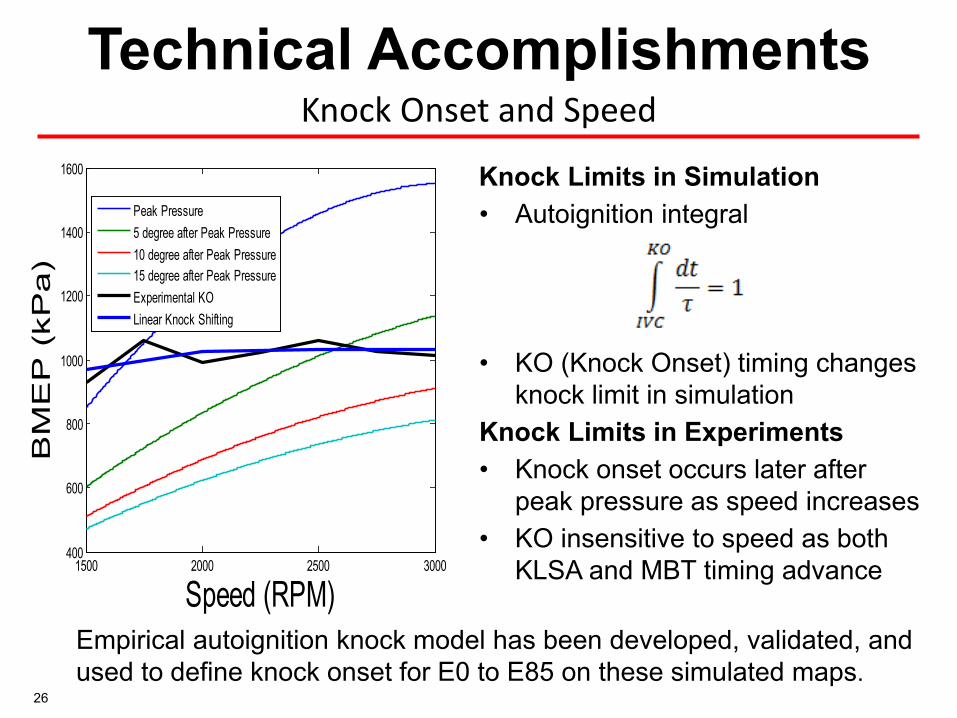
1500 2000 2500 3000400
600
800
1000
1200
1400
1600
Speed (RPM)
BM
EP
(kP
a)
Peak Pressure5 degree after Peak Pressure10 degree after Peak Pressure15 degree after Peak PressureExperimental KOLinear Knock Shifting
Empirical autoignition knock model has been developed, validated, and used to define knock onset for E0 to E85 on these simulated maps.
Knock Limits in Simulation • Autoignition integral • KO (Knock Onset) timing changes
knock limit in simulation Knock Limits in Experiments • Knock onset occurs later after
peak pressure as speed increases • KO insensitive to speed as both


![The Next Generation of Gasoline Turbo Technology Die …€¦ · · 2018-01-19The progress in downsizing of gasoline engines in recent years has ... [Nm] [s] [s] [Nm/s] [Nm] Baseline](https://static.documents.pub/doc/80x56/5ae185937f8b9ab4688ecd6d/the-next-generation-of-gasoline-turbo-technology-die-2018-01-19the-progress.jpg)


