HIGH-DIMENSIONAL ISING MODEL SELECTION USING�1-REGULARIZED LOGISTIC REGRESSION
BY PRADEEP RAVIKUMAR1,2,3, MARTIN J. WAINWRIGHT3
AND JOHN D. LAFFERTY1
University of California, Berkeley, University of California, Berkeley andCarnegie Mellon University
We consider the problem of estimating the graph associated with a binaryIsing Markov random field. We describe a method based on �1-regularized lo-gistic regression, in which the neighborhood of any given node is estimatedby performing logistic regression subject to an �1-constraint. The method isanalyzed under high-dimensional scaling in which both the number of nodesp and maximum neighborhood size d are allowed to grow as a function ofthe number of observations n. Our main results provide sufficient conditionson the triple (n,p, d) and the model parameters for the method to succeedin consistently estimating the neighborhood of every node in the graph si-multaneously. With coherence conditions imposed on the population Fisherinformation matrix, we prove that consistent neighborhood selection can beobtained for sample sizes n = �(d3 logp) with exponentially decaying error.When these same conditions are imposed directly on the sample matrices, weshow that a reduced sample size of n = �(d2 logp) suffices for the methodto estimate neighborhoods consistently. Although this paper focuses on thebinary graphical models, we indicate how a generalization of the method ofthe paper would apply to general discrete Markov random fields.
1. Introduction. Undirected graphical models, also known as Markov ran-dom fields, are used in a variety of domains, including statistical physics [17], nat-ural language processing [21], image analysis [8, 14, 37] and spatial statistics [26],among others. A Markov random field (MRF) is specified by an undirected graphG = (V ,E) with vertex set V = {1,2, . . . , p} and edge set E ⊂ V × V . The struc-ture of this graph encodes certain conditional independence assumptions amongsubsets of the p-dimensional discrete random variable X = (X1,X2, . . . ,Xp)
where variable Xi is associated with vertex i ∈ V . One important problem forsuch models is to estimate the underlying graph from n independent and identicallydistributed samples {x(1), x(2), . . . , x(n)} drawn from the distribution specified by
Received October 2008; revised January 2009.1Supported in part by NSF Grants IIS-0427206 and CCF-0625879.2Supported in part by a Siebel Scholarship.3Supported in part by NSF Grants DMS-06-05165 and CCF-0545862.AMS 2000 subject classifications. Primary 62F12; secondary 68T99.Key words and phrases. Graphical models, Markov random fields, structure learning, �1-regular-
ization, model selection, convex risk minimization, high-dimensional asymptotics.
1288 P. RAVIKUMAR, M. J. WAINWRIGHT AND J. D. LAFFERTY
some Markov random field. As a concrete illustration, for binary random variables,each vector-valued sample x(i) ∈ {0,1}p might correspond to the votes of a set ofp politicians on a particular bill, and estimating the graph structure amounts todetecting statistical dependencies in these voting patterns (see Banerjee, Ghaouiand d’Asprémont [2] for further discussion of this example).
Due to both its importance and difficulty, the problem of structure learningfor discrete graphical models has attracted considerable attention. The absenceof an edge in a graphical model encodes a conditional independence assumption.Constraint-based approaches [30] estimate these conditional independencies fromthe data using hypothesis testing and then determine a graph that most closelyrepresents those independencies. Each graph represents a model class of graphi-cal models; learning a graph then is a model class selection problem. Score-basedapproaches combine a metric for the complexity of the graph with a measure ofthe goodness of fit of the graph to the data; for instance, log-likelihood of themaximum likelihood parameters given the graph, to obtain a score for each graph.The score is used together with a search procedure that generates candidate graphstructures to be scored. The number of graph structures grows super-exponentially,however, and Chickering [6] shows that this problem is in general NP-hard.
A complication for undirected graphical models involving discrete random vari-ables is that typical score metrics involve the partition function or cumulant func-tion associated with the Markov random field. For general undirected MRFs, cal-culation of this partition function is computationally intractable [36]. The spaceof candidate structures in scoring based approaches is thus typically restricted toeither directed graphical models [10] or to simple sub-classes of undirected graph-ical models such as those based on trees [7] and hypertrees [31]. Abbeel, Kollerand Ng [1] propose a method for learning factor graphs based on local conditionalentropies and thresholding and analyze its behavior in terms of Kullback–Leiblerdivergence between the fitted and true models. They obtain a sample complex-ity that grows logarithmically in the number of vertices p, but the computationalcomplexity grows at least as quickly as O(pd+1) where d is the maximum neigh-borhood size in the graphical model. This order of complexity arises from the factthat for each node, there are
(pd
) = O(pd) possible neighborhoods of size d for agraph with p vertices. Csiszár and Talata [9] show consistency of a method thatuses pseudo-likelihood and a modification of the BIC criterion, but this also in-volves a prohibitively expensive search.
The main contribution of this paper is a careful analysis of the computationaland statistical efficiency of a simple method for graphical model selection. Thebasic approach is straightforward: it involves performing �1-regularized logisticregression of each variable on the remaining variables, and then using the sparsitypattern of the regression vector to infer the underlying neighborhood structure. Ouranalysis is high-dimensional in nature, meaning that both the model dimension p
as well as the maximum neighborhood size d may tend to infinity as a function
HIGH-DIMENSIONAL ISING MODEL SELECTION 1289
of the size n. Our main result shows that under mild assumptions on the popula-tion Fisher information matrix, consistent neighborhood selection is possible usingn = �(d3 logp) samples and computational complexity O(max{n,p}p3). We alsoshow that when the same assumptions are imposed directly on the sample matri-ces, n = �(d2 logp) samples suffice for consistent neighborhood selection withthe same computational complexity. We focus in this paper on binary Ising mod-els, but indicate in Section 7 a generalization of the method applicable to generaldiscrete Markov random fields.
The technique of �1-regularization for estimation of sparse models or signalshas a long history in many fields (for instance, see [32] for one survey). A surgeof recent work has shown that �1-regularization can lead to practical algorithmswith strong theoretical guarantees (e.g., [5, 12, 23, 24, 32, 33, 39]). Despite thewell-known computational intractability of computing marginals and likelihoodsfor discrete MRFs [36], our method is computationally efficient; it involves nei-ther computing the normalization constant (or partition function) associated withthe Markov random field nor a combinatorial search through the space of graphstructures. Rather, it requires only the solution of standard convex programs withan overall computational complexity of order O(max{p,n}p3) and is thus wellsuited to high-dimensional problems [20]. Conceptually, like the work of Mein-shausen and Bühlmann [23] on covariance selection in Gaussian graphical models,our approach can be understood as using a type of pseudo-likelihood based on thelocal conditional likelihood at each node. In contrast to the Gaussian case, wherethe exact maximum likelihood estimate can be computed exactly in polynomialtime, this use of a surrogate loss function is essential for discrete Markov randomfields given the intractability of computing the exact likelihood [36].
Portions of this work were initially reported in a conference publication [35],with the weaker result that n = �(d6 logd + d5 logp) samples suffice for consis-tent Ising model selection. Since the appearance of that paper, other researchershave also studied the problem of model selection in discrete Markov randomfields. For the special case of bounded degree models, Bresler, Mossel and Sly[4] describe a simple search-based method, and prove under relatively mild as-sumptions that it can recover the graph structure with �(logp) samples. How-ever, in the absence of additional restrictions, the computational complexity of themethod is O(pd+1). In other work, Santhanam and Wainwright [29] analyze theinformation-theoretic limits of graphical model selection, providing both upperand lower bounds on various model selection procedures, but these methods alsohave prohibitive computational costs.
The remainder of this paper is organized as follows. We begin in Section 2with background on discrete graphical models, the model selection problem andlogistic regression. In Section 3, we state our main result, develop some of itsconsequences and provide a high-level outline of the proof. Section 4 is devotedto proving a result under stronger assumptions on the sample Fisher information
1290 P. RAVIKUMAR, M. J. WAINWRIGHT AND J. D. LAFFERTY
matrix whereas Section 5 provides concentration results linking the population ma-trices to the sample versions. In Section 6, we provide some experimental resultsthat illustrate the practical performance of our method and the close agreementbetween theory and practice. Section 7 discusses an extension to more generalMarkov random fields, and we conclude in Section 8.
Notation. For the convenience of the reader, we summarize here notation tobe used throughout the paper. We use the following standard notation for asymp-totics: we write f (n) = O(g(n)) if f (n) ≤ Kg(n) for some constant K < ∞,and f (n) = �(g(n)) if f (n) ≥ K ′g(n) for some constant K ′ > 0. The notationf (n) = �(g(n)) means that f (n) = O(g(n)) and f (n) = �(g(n)). Given a vec-tor v ∈ R
d and parameter q ∈ [1,∞], we use ‖v‖q to denote the usual �q norm.Given a matrix A ∈ R
a×b and parameter q ∈ [1,∞], we use |||A|||q to denote theinduced matrix-operator norm with A viewed as a mapping from �b
q → �aq (see
Horn and Johnson [16]). Two examples of particular importance in this paper arethe spectral norm |||A|||2, corresponding to the maximal singular value of A, andthe �∞ matrix norm, given by |||A|||∞ = maxj=1,...,a
∑bk=1|Ajk|. We make use of
the bound |||A|||∞ ≤ √a|||A|||2 for any symmetric matrix A ∈ R
a×a .
2. Background and problem formulation. We begin by providing somebackground on Markov random fields, defining the problem of graphical modelselection and describing our method based on neighborhood logistic regression.
2.1. Pairwise Markov random fields. Let X = (X1,X2, . . . ,Xp) denote a ran-dom vector with each variable Xs taking values in a corresponding set Xs . Say weare given an undirected graph G with vertex set V = {1, . . . , p} and edge set E,so that each random variable Xs is associated with a vertex s ∈ V . The pairwiseMarkov random field associated with the graph G over the random vector X is thefamily of distributions of X which factorize as P(x) ∝ exp{∑(s,t)∈E φst (xs, xt )}where for each edge (s, t) ∈ E, φst is a mapping from pairs (xs, xt ) ∈ Xs × Xt tothe real line. For models involving discrete random variables, the pairwise assump-tion involves no loss of generality since any Markov random field with higher-order interactions can be converted (by introducing additional variables) to anequivalent Markov random field with purely pairwise interactions (see Wainwrightand Jordan [34] for details of this procedure).
Ising model. In this paper, we focus on the special case of the Ising modelin which Xs ∈ {−1,1} for each vertex s ∈ V , and φst (xs, xt ) = θ∗
stxsxt for someparameter θ∗
st ∈ R, so that the distribution takes the form
Pθ∗(x) = 1
Z(θ∗)exp
{ ∑(s,t)∈E
θ∗stxsxt
}.(1)
HIGH-DIMENSIONAL ISING MODEL SELECTION 1291
The partition function Z(θ∗) ensures that the distribution sums to one. This modelis used in many applications of spatial statistics such as modeling the behavior ofgases or magnets in statistical physics [17], building statistical models in computervision [13] and social network analysis.
2.2. Graphical model selection. Suppose that we are given a collection Xn1 :=
{x(1), . . . , x(n)} of n samples where each p-dimensional vector x(i) ∈ {−1,+1}pis drawn in an i.i.d. manner from a distribution Pθ∗ of the form (1) for parametervector θ∗ and graph G = (V ,E) over the p variables. It is convenient to viewthe parameter vector θ∗ as a
(p2
)-dimensional vector, indexed by pairs of distinct
vertices but nonzero if and only if the vertex pair (s, t) belongs to the unknownedge set E of the underlying graph G. The goal of graphical model selection is toinfer the edge set E. In this paper, we study the slightly stronger criterion of signededge recovery; in particular, given a graphical model with parameter θ∗, we definethe edge sign vector
E∗ :={
sign(θ∗st ), if (s, t) ∈ E,
0, otherwise.(2)
Here the sign function takes value +1 if θ∗st > 0, value −1 if θ∗
st < 0 and 0, other-wise. Note that the weaker graphical model selection problem amounts to recover-ing the vector |E∗| of absolute values.
The classical notion of statistical consistency applies to the limiting behavior ofan estimation procedure as the sample size n goes to infinity with the model size p
itself remaining fixed. In many contemporary applications of graphical models—among them gene microarray data and social network analysis—the model dimen-sion p is comparable to or larger than the sample size n, so that the relevance ofsuch “fixed p” asymptotics is limited. With this motivation, our analysis in thispaper is of the high-dimensional nature, in which both the model dimension andthe sample size are allowed to increase, and we study the scalings under whichconsistent model selection is achievable.
More precisely, we consider sequences of graphical model selection problems,indexed by the sample size n, number of vertices p and maximum node degree d .We assume that the sample size n goes to infinity, and both the problem dimensionp = p(n) and d = d(n) may also scale as a function of n. The setting of fixed p
or d is covered as a special case. Let En be an estimator of the signed edge patternE∗ based on the n samples. Our goal is to establish sufficient conditions on thescaling of the triple (n,p, d) such that our proposed estimator is consistent in thesense that
P[En = E∗] → 1 as n → +∞.
We sometimes call this property sparsistency, as a shorthand for consistency of thesparsity pattern of the parameter θ∗.
2.3. Neighborhood-based logistic regression. Recovering the signed edgevector E∗ of an undirected graph G is equivalent to recovering, for each vertex
1292 P. RAVIKUMAR, M. J. WAINWRIGHT AND J. D. LAFFERTY
r ∈ V , its neighborhood set N (r) := {t ∈ V | (r, t) ∈ E} along with the correctsigns sign(θ∗
rt ) for all t ∈ N (r). To capture both the neighborhood structure andsign pattern, we define the product set of “signed vertices” as {−1,1}×V . We usethe shorthand “ιr” for elements (ι, r) ∈ {−1,1} × V . We then define the signedneighborhood set as
N±(r) := {sign(θ∗rt )t | t ∈ N (r)}.(3)
Here the sign function has an unambiguous definition, since θ∗rt = 0 for all t ∈
N (r). Observe that this signed neighborhood set N±(r) can be recovered from thesign-sparsity pattern of the (p − 1)-dimensional subvector of parameters
θ∗\r := {θ∗ru, u ∈ V \ r},
associated with vertex r . In order to estimate this vector θ∗\r , we consider the struc-ture of the conditional distribution of Xr given the other variables X\r = {Xt | t ∈V \ {r}}. A simple calculation shows that under the model (1), this conditionaldistribution takes the form
Pθ∗(xr | x\r ) = exp(2xr
∑t∈V \r θ∗
rt xt )
exp(2xr
∑t∈V \r θ∗
rt xt ) + 1.(4)
Thus the variable Xr can be viewed as the response variable in a logistic regressionin which all of the other variables X\r play the role of the covariates.
With this set-up, our method for estimating the sign-sparsity pattern of the re-gression vector θ∗\r and hence the neighborhood structure N±(r) is based on com-puting an �1-regularized logistic regression of Xr on the other variables X\r . Ex-plicitly, given Xn
1 = {x(1), x(2), . . . , x(n)}, a set of n i.i.d. samples, this regularizedregression problem is a convex program of the form
minθ\r∈Rp−1
{�(θ;Xn
1) + λ(n,p,d)‖θ\r‖1},(5)
where
�(θ;Xn1) := −1
n
n∑i=1
log Pθ
(x(i)r | x(i)
\r)
(6)
is the rescaled negative log likelihood (the rescaling factor 1/n in this definitionis for later theoretical convenience) and λ(n,p,d) > 0 is a regularization parameter,to be specified by the user. For notational convenience, we will also use λn asnotation for this regularization parameter suppressing the potential dependence onp and d .
Following some algebraic manipulation, the regularized negative log likelihoodcan be written as
minθ\r∈Rp−1
{1
n
n∑i=1
f(θ;x(i)) − ∑
u∈V \rθruμru + λn‖θ\r‖1
},(7)
HIGH-DIMENSIONAL ISING MODEL SELECTION 1293
where
f (θ;x) := log{
exp( ∑
t∈V \rθrtxt
)+ exp
(− ∑
t∈V \rθrtxt
)}(8)
is a rescaled logistic loss, and μru := 1n
∑ni=1 x
(i)r x
(i)u are empirical moments. Note
the objective function (7) is convex but not differentiable, due to the presence ofthe �1-regularizer. By Lagrangian duality, the problem (7) can be re-cast as a con-strained problem over the ball ‖θ\r‖1 ≤ C(λn). Consequently, by the Weierstrasstheorem, the minimum over θ\s is always achieved.
Accordingly, let θ n\r be an element of the minimizing set of problem (7). Al-though θ n\r need not be unique in general since the problem (7) need not be strictlyconvex, our analysis shows that in the regime of interest, this minimizer θ n\r is in-deed unique. We use θ n\r to estimate the signed neighborhood N±(r) accordingto
N±(r) := {sign(θru)u | u ∈ V \ r, θsu = 0}.(9)
We say that the full graph G is estimated consistently, written as the event {En =E∗}, if every signed neighborhood is recovered—that is, N±(r) = N±(r) for allr ∈ V .
3. Method and theoretical guarantees. Our main result concerns conditionson the sample size n relative to the parameters of the graphical model—morespecifically, the number of nodes p and maximum node degree d—that ensurethat the collection of signed neighborhood estimates (9), one for each node r ofthe graph, agree with the true neighborhoods so that the full graph is estimatedconsistently. In this section, we begin by stating the assumptions that underlie ouranalysis, and then give a precise statement of the main result. We then provide ahigh-level overview of the key steps involved in its proof, deferring details to latersections. Our analysis proceeds by first establishing sufficient conditions for cor-rect signed neighborhood recovery—that is, {N±(r) = N±(r)}—for some fixednode r ∈ V . By showing that this neighborhood consistency is achieved at suffi-ciently fast rates, we can then use a union bound over all p nodes of the graph toconclude that consistent graph selection is also achieved.
3.1. Assumptions. Success of our method requires certain assumptions on thestructure of the logistic regression problem. These assumptions are stated in termsof the Hessian of the likelihood function E{log Pθ [Xr | X\r ]} as evaluated at thetrue model parameter θ∗\r ∈ R
p−1. More specifically, for any fixed node r ∈ V , thisHessian is a (p − 1) × (p − 1) matrix of the form
Q∗r := Eθ∗{∇2 log Pθ∗[Xr | X\r ]}.(10)
1294 P. RAVIKUMAR, M. J. WAINWRIGHT AND J. D. LAFFERTY
For future reference, this is given as the explicit expression
Q∗r = Eθ∗[η(X; θ∗)X\rXT\r ],(11)
where
η(u; θ) := 4 exp(2ur
∑t∈V \r θrtut )
(exp(2ur
∑t∈V \r θrtut ) + 1)2(12)
is the variance function. Note that the matrix Q∗r is the Fisher information matrix
associated with the local conditional probability distribution. Intuitively, it servesas the counterpart for discrete graphical models of the covariance matrix E[XXT ]of Gaussian graphical models, and indeed our assumptions are analogous to thoseimposed in previous work on the Lasso for Gaussian linear regression [23, 32, 39].
In the following we write simply Q∗ for the matrix Q∗r where the reference
node r should be understood implicitly. Moreover, we use S := {(r, t) | t ∈ N (r)}to denote the subset of indices associated with edges of r , and Sc to denote itscomplement. We use Q∗
SS to denote the d × d sub-matrix of Q∗ indexed by S.With this notation, we state our assumptions:
(A1) Dependency condition. The subset of the Fisher information matrix cor-responding to the relevant covariates has bounded eigenvalues; that is, there existsa constant Cmin > 0 such that
min(Q∗SS) ≥ Cmin.(13)
Moreover, we require that max(Eθ∗[X\rXT\r ]) ≤ Dmax. These conditions ensurethat the relevant covariates do not become overly dependent. (As stated earlier, wehave suppressed notational dependence on r ; thus these conditions are assumed tohold for each r ∈ V .)
(A2) Incoherence condition. Our next assumption captures the intuition thatthe large number of irrelevant covariates (i.e., nonneighbors of node r) cannotexert an overly strong effect on the subset of relevant covariates (i.e., neighbors ofnode r). To formalize this intuition, we require the existence of an α ∈ (0,1] suchthat
|||Q∗ScS(Q∗
SS)−1|||∞ ≤ 1 − α.(14)
3.2. Statement of main result. We are now ready to state our main result onthe performance of neighborhood logistic regression for graphical model selection.Naturally, the limits of model selection are determined by the minimum valueover the parameters θ∗
rt for pairs (r, t) included in the edge set of the true graph.Accordingly, we define the parameter
θ∗min = min
(r,t)∈E|θ∗
rt |.(15)
With this definition, we have the following:
HIGH-DIMENSIONAL ISING MODEL SELECTION 1295
THEOREM 1. Consider an Ising graphical model with parameter vector θ∗and associated edge set E∗ such that conditions (A1) and (A2) are satisfied by thepopulation Fisher information matrix Q∗, and let Xn
1 be a set of n i.i.d. samplesfrom the model specified by θ∗. Suppose that the regularization parameter λn isselected to satisfy
λn ≥ 16(2 − α)
α
√logp
n.(16)
Then there exist positive constants L and K , independent of (n,p, d), such that if
n > Ld3 logp,(17)
then the following properties hold with probability at least 1 − 2 exp(−Kλ2nn).
(a) For each node r ∈ V , the �1-regularized logistic regression (5), given data Xn1,
has a unique solution, and so uniquely specifies a signed neighborhood N±(r).(b) For each r ∈ V , the estimated signed neighborhood N±(r) correctly excludes
all edges not in the true neighborhood. Moreover, it correctly includes alledges (r, t) for which |θ∗
rt | ≥ 10Cmin
√dλn.
The theorem not only specifies sufficient conditions but also the probability withwhich the method recovers the true signed edge-set. This probability decays expo-nentially as a function of λ2
nn which leads naturally to the following corollary onmodel selection consistency of the method for a sequence of Ising models specifiedby (n,p(n), d(n)).
COROLLARY 1. Consider a sequence of Ising models with graph edgesets {E∗
p(n)} and parameters {θ∗(n,p,d)}; each of which satisfies conditions (A1)
and (A2). For each n, let Xn1 be a set of n i.i.d. samples from the model specified
by θ∗(n,p,d), and suppose that (n,p(n), d(n)) satisfies the scaling condition (17) of
Theorem 1. Suppose further that the sequence {λn} of regularization parameterssatisfies condition (16) and
λ2nn → ∞(18)
and the minimum parameter weights satisfy
min(r,t)∈E∗
n
∣∣θ∗(n,p,d)(r, t)
∣∣ ≥ 10
Cmin
√dλn(19)
for sufficiently large n. Then the method is model selection consistent so thatif Ep(n) is the graph structure estimated by the method given data Xn
1, thenP[Ep(n) = E∗
p(n)] → 1 as n → ∞.
1296 P. RAVIKUMAR, M. J. WAINWRIGHT AND J. D. LAFFERTY
Remarks. (a) It is worth noting that the scaling condition (17) on (n,p, d)
allows for graphs and sample sizes in the “large p, small n” regime (meaningp � n), as long as the degrees are bounded, or grow at a sufficiently slow rate. Inparticular, one set of sufficient conditions are the scalings
d = O(nc1) and p = O(enc2), 3c1 + c2 < 1,
for some constants c1, c2 > 0. Under these scalings, note that we have d3 log(p) =O(n3c1+c2) = o(n), so that condition (17) holds.
A bit more generally, note that in the regime p � n, the growth condition (17)requires that that d = o(p). However, in many practical applications of graphicalmodels (e.g., image analysis, social networks), one is interested in node degrees d
that remain bounded or grow sub-linearly in the graph size so that this condition isnot unreasonable.
(b) Loosely stated, the theorem requires that the edge weights are not too closeto zero (in absolute value) for the method to estimate the true graph. In particular,conditions (16) and (19) imply that the minimum edge weight θ∗
min is required toscale as
θ∗min = �
(√d logp
n
).
Note that in the classical fixed (p, d) case, this reduces to the familiar scalingrequirement of θ∗
min = �(n−1/2).(c) In the high-dimensional setting (for p → +∞), a choice of the regulariza-
tion parameter satisfying both conditions (16) and (18) is, for example,
λn = 16(2 − α)
α
√logp
n
for which the probability of incorrect model selection decays at rateO(exp(−K ′ logp)) for some constant K ′ > 0. In the classical setting (fixed p),
this choice can be modified to λn = 16(2−α)α
√log(pn)
n.
The analysis required to prove Theorem 1 can be divided naturally into twoparts. First, in Section 4, we prove a result (stated as Proposition 1) for “fixeddesign” matrices. More precisely, we show that if the dependence condition (A1)and the mutual incoherence condition (A2) hold for the sample Fisher informationmatrix
Qn := E[η(X; θ∗)X\rXT\r ] = 1
n
n∑i=1
η(x(i); θ∗)x(i)
\r(x
(i)\r
)T,(20)
then the growth condition (17) and choice of λn from Theorem 1 are sufficient toensure that the graph is recovered with high probability.
HIGH-DIMENSIONAL ISING MODEL SELECTION 1297
The second part of the analysis, provided in Section 5, is devoted to showingthat under the specified growth condition (17), imposing incoherence and depen-dence assumptions on the population version of the Fisher information Q∗ guar-antees (with high probability) that analogous conditions hold for the sample quan-tities Qn. On one hand, it follows immediately from the law of large numbers thatthe empirical Fisher information Qn
AA converges to the population version Q∗AA
for any fixed subset A. However, in the current setting, the added delicacy is thatwe are required to control this convergence over subsets of increasing size. Ourproof therefore requires some large-deviation analysis for random matrices withdependent elements so as to provide exponential control on the rates of conver-gence.
3.3. Primal-dual witness for graph recovery. At the core of our proof lies thenotion of a primal-dual witness used in previous work on the Lasso [33]. In partic-ular, our proof involves the explicit construction of an optimal primal-dual pair—namely, a primal solution θ ∈ R
p−1 along with an associated subgradient vectorz ∈ R
p−1 (which can be interpreted as a dual solution), such that the sub-gradientoptimality conditions associated with the convex program (7) are satisfied. More-over, we show that under the stated assumptions on (n,p, d), the primal-dual pair(θ , z) can be constructed such that they act as a witness—that is, a certificate guar-anteeing that the method correctly recovers the graph structure.
For the convex program (7), the zero sub-gradient optimality conditions [27]take the form
∇�(θ) + λnz = 0,(21)
where the dual or subgradient vector z ∈ Rp−1 must satisfy the properties
zrt = sign(θrt ) if θi = 0 and |zrt | ≤ 1 otherwise.(22)
By convexity, a pair (θ , z) ∈ Rp−1 × R
p−1 is a primal-dual optimal solution tothe convex program and its dual if and only if the two conditions (21) and (22)are satisfied. Of primary interest to us is the property that such an optimal primal-dual pair correctly specifies the signed neighborhood of node r ; the necessary andsufficient conditions for such correctness are
The �1-regularized logistic regression problem (7) is convex; however, forp � n, it need not be strictly convex, so that there may be multiple optimal solu-tions. The following lemma, proved in Appendix A, provides sufficient conditionsfor shared sparsity among optimal solutions, as well as uniqueness of the optimalsolution:
1298 P. RAVIKUMAR, M. J. WAINWRIGHT AND J. D. LAFFERTY
LEMMA 1. Suppose that there exists an optimal primal solution θ with as-sociated optimal dual vector z such that ‖zSc‖∞ < 1. Then any optimal primalsolution θ must have θSc = 0. Moreover, if the Hessian sub-matrix [∇2�(θ)]SS isstrictly positive definite, then θ is the unique optimal solution.
Based on this lemma, we construct a primal-dual witness (θ , z) with the follow-ing steps.
(a) First, we set θS as the minimizer of the partial penalized likelihood
θS = arg min(θS,0)∈Rp−1
{�(θ;Xn1) + λn‖θS‖1}(24)
and set zS = sign(θS).(b) Second, we set θSc = 0 so that condition (23b) holds.(c) In the third step, we obtain zSc from (21) by substituting in the values of θ and
zS . Thus our construction satisfies conditions (23b) and (21).(d) The final and most challenging step consists of showing that the stated scalings
of (n,p, d) imply that, with high-probability, the remaining conditions (23a)and (22) are satisfied.
Our analysis in step (d) guarantees that ‖zSc‖∞ < 1 with high probability. More-over, under the conditions of Theorem 1, we prove that the sub-matrix of the sam-ple Fisher information matrix is strictly positive definite with high probability sothat by Lemma 1, the primal solution θ is guaranteed to be unique.
It should be noted that, since S is unknown, the primal-dual witness method isnot a practical algorithm that could ever be implemented to solve �1-regularizedlogistic regression. Rather, it is a proof technique that allows us to establish signcorrectness of the unique optimal solution.
4. Analysis under sample Fisher matrix assumptions. We begin by estab-lishing model selection consistency when assumptions are imposed directly on thesample Fisher matrix Qn, as opposed to on the population matrix Q∗, as in Theo-rem 1. In particular, recalling the definition (20) of the sample Fisher informationmatrix Qn = E[∇2�(θ∗)], we define the “good event,”
M(Xn1) := {
Xn1 ∈ {−1,+1}n×p | Qn satisfies (A1) and (A2)
}.(25)
As in the statement of Theorem 1, the quantities L and K refer to constants inde-pendent of (n,p, d). With this notation, we have the following:
PROPOSITION 1 (Fixed design). If the event M(Xn1) holds, the sample size
satisfies n > Ld2 log(p), and the regularization parameter is chosen such that
λn ≥ 16(2−α)α
√logp
n, then with probability at least 1 − 2 exp(−Kλ2
nn) → 1, thefollowing properties hold.
HIGH-DIMENSIONAL ISING MODEL SELECTION 1299
(a) For each node r ∈ V , the �1-regularized logistic regression has a uniquesolution, and so uniquely specifies a signed neighborhood N±(r).
(b) For each r ∈ V , the estimated signed neighborhood vector N±(r) correctlyexcludes all edges not in the true neighborhood. Moreover, it correctly includes alledges with |θrt | ≥ 10
Cmin
√dλn.
Loosely stated, this result guarantees that if the sample Fisher information ma-trix is “good,” then the conditional probability of successful graph recovery con-verges to zero at the specified rate. The remainder of this section is devoted to theproof of Proposition 1.
4.1. Key technical results. We begin with statements of some key technicallemmas that are central to our main argument with their proofs deferred to Ap-pendix B. The central object is the following expansion obtained by re-writing thezero-subgradient condition as
∇�(θ;Xn1) − ∇�(θ∗;Xn
1) = Wn − λnz,(26)
where we have introduced the short-hand notation Wn = −∇�(θ∗;Xn1) for the
(p − 1)-dimensional score function,
Wn := −1
n
n∑i=1
x(i)\r
{x(i)r − exp(
∑t∈V \r θ∗
rt x(i)t ) − exp(−∑
t∈V \r θ∗rt x
(i)t )
exp(∑
t∈V \r θ∗rt x
(i)t ) + exp(−∑
t∈V \r θ∗rt x
(i)t )
}.
For future reference, note that Eθ∗[Wn] = 0. Next, applying the mean-value theo-rem coordinate-wise to the expansion (26) yields
∇2�(θ∗;Xn1)[θ − θ∗] = Wn − λnz + Rn,(27)
where the remainder term takes the form
Rnj = [∇2�
(−θ(j);Xn
1) − ∇2�(θ∗;Xn
1)]Tj (θ − θ∗)(28)
with−θ(j) a parameter vector on the line between θ∗ and θ , and with [·]Tj denoting
the j th row of the matrix. The following lemma addresses the behavior of the termWn in this expansion:
LEMMA 2. For the specified mutual incoherence parameter α ∈ (0,1], wehave
P
(2 − α
λn
‖Wn‖∞ ≥ α
4
)≤ 2 exp
(− α2λ2
n
128(2 − α)2 n + log(p)
),(29)
which converges to zero at rate exp(−cλ2nn) as long as λn ≥ 16(2−α)
α
√logp
n.
See Appendix B.1 for the proof of this claim.The following lemma establishes that the sub-vector θS is an �2-consistent esti-
mate of the true sub-vector θ∗S :
1300 P. RAVIKUMAR, M. J. WAINWRIGHT AND J. D. LAFFERTY
LEMMA 3 (�2-consistency of primal subvector). If λnd ≤ C2min
10Dmaxand
‖Wn‖∞ ≤ λn/4, then
‖θS − θS‖2 ≤ 5
Cmin
√dλn.(30)
See Appendix B.2 for the proof of this claim.Our final technical lemma provides control on the remainder term (28).
LEMMA 4. If λnd ≤ C2min
100Dmax
α2−α
and ‖Wn‖∞ ≤ λn/4, then
‖Rn‖∞λn
≤ 25Dmax
C2min
λnd ≤ α
4(2 − α).
See Appendix B.3 for the proof of this claim.
4.2. Proof of Proposition 1. Using these lemmas, the proof of Proposition 1is straightforward. Consider the choice of the regularization parameter, λn =162−α
α
√logp
n. This choice satisfies the condition of Lemma 2, so that we may con-
clude that with probability greater than 1 − 2 exp(−cλ2nn) → 1, we have
‖Wn‖∞ ≤ α
2 − α
λ
4≤ λ
4
using the fact that α ≤ 1. The remaining two conditions that we need to apply thetechnical lemmas concern upper bounds on the quantity λnd . In particular, for a
sample size satisfying n >1002D2
maxC4
min
(2−α)4
α4 d2 logp, we have
λnd = 16(2 − α)
α
√logp
nd
≤ 16C2min
100Dmax
α
(2 − α)
<C2
min
10Dmax
so that the conditions of both Lemmas 3 and 4 are satisfied.We can now proceed to the proof of Proposition 1. Recalling our shorthand
Qn = ∇2θ �(θ∗;Xn
1) and the fact that we have set θSc = 0 in our primal-dual con-struction, we can re-write condition (27) in block form as
QnScS[θS − θ∗
S ] = WnSc − λnzSc + Rn
Sc,(31a)
QnSS[θS − θ∗
S ] = WnS − λnzS + Rn
S.(31b)
HIGH-DIMENSIONAL ISING MODEL SELECTION 1301
Since the matrix QnSS is invertible by assumption, the conditions (31) can be re-
written as
QnScS(Qn
SS)−1[WnS − λnzS + Rn
S] = WnSc − λnzSc + Rn
Sc .(32)
Rearranging yields the condition,
[WnSc − Rn
Sc ] − QnScS(Qn
SS)−1[WnS − Rn
S] + λnQnScS(Qn
SS)−1zS = λnzSc .(33)
Strict dual feasibility. We now demonstrate that for the dual sub-vector zSc
defined by (33), we have ‖zSc‖∞ < 1. Using the triangle inequality and the mutualincoherence bound (14), we have that
‖zSc‖∞ ≤ |||QnScS(Qn
SS)−1|||∞[‖Wn
S ‖∞λn
+ ‖RnS‖∞λn
+ 1]
(34)
+ ‖RnSc‖∞λn
+ ‖WnSc‖∞λn
≤ (1 − α) + (2 − α)
[‖Rn‖∞λn
+ ‖Wn‖∞λn
].(35)
Next, applying Lemmas 2 and 4, we have
‖zSc‖∞ ≤ (1 − α) + α
4+ α
4= 1 − α
2
with probability converging to one.
Correct sign recovery. We next show that our primal sub-vector θS defined by(24) satisfies sign consistency, meaning that sgn(θS) = sgn(θ∗
S ). In order to do so,it suffices to show that
‖θS − θ∗S‖∞ ≤ θ∗
min
2
recalling the notation θ∗min := min(r,t)∈E |θ∗
rt |. From Lemma 3, we have ‖θS −θ∗S‖2 ≤ 5
Cmin
√dλn so that
2
θ∗min
‖θS − θ∗S‖∞ ≤ 2
θ∗min
‖θS − θ∗S‖2
≤ 2
θ∗min
5
Cmin
√dλn,
which is less than one as long as θ∗min ≥ 10
Cmin
√dλn.
1302 P. RAVIKUMAR, M. J. WAINWRIGHT AND J. D. LAFFERTY
5. Uniform convergence of sample information matrices. In this sectionwe complete the proof of Theorem 1 by showing that if the dependency (A1) andincoherence (A2) assumptions are imposed on the population Fisher informationmatrix then under the specified scaling of (n,p, d), analogous bounds hold forthe sample Fisher information matrices with probability converging to one. Theseresults are not immediate consequences of classical random matrix theory (e.g.,[11]) since the elements of Qn are highly dependent. Recall the definitions
where Eθ∗ denotes the population expectation, and E denotes the empirical expec-tation, and the variance function η was defined previously in (12). The followinglemma asserts that the eigenvalue bounds in assumption (A1) hold with high prob-ability for sample covariance matrices:
LEMMA 5. Suppose that assumption (A1) holds for the population matrix Q∗and Eθ∗[XXT ]. For any δ > 0 and some fixed constants A and B , we have
P
[max
[1
n
n∑i=1
x(i)\r
(x
(i)\r
)T ]≥ Dmax + δ
]≤ 2 exp
(−A
δ2n
d2 + B log(d)
),(37a)
P[min(QnSS) ≤ Cmin − δ] ≤ 2 exp
(−A
δ2n
d2 + B log(d)
).(37b)
The following result is the analog for the incoherence assumption (A2) show-ing that the scaling of (n,p, d) given in Theorem 1 guarantees that populationincoherence implies sample incoherence.
LEMMA 6. If the population covariance satisfies a mutual incoherence condi-tion (14) with parameter α ∈ (0,1] as in assumption (A2), then the sample matrixsatisfies an analogous version, with high probability in the sense that
P
[|||Qn
ScS(QnSS)−1|||∞ ≥ 1 − α
2
]≤ exp
(−K
n
d3 + log(p)
).(38)
Proofs of these two lemmas are provided in the following sections. Before pro-ceeding, we take note of a simple bound to be used repeatedly throughout ourarguments. By definition of the matrices Qn(θ) and Q(θ) [see (20) and (11)], the(j, k)th element of the difference matrix Qn(θ) − Q(θ) can be written as an i.i.d.sum of the form Zjk = 1
n
∑ni=1 Z
(i)jk where each Z
(i)jk is zero-mean and bounded
(in particular, |Z(i)jk | ≤ 4). By the Azuma–Hoeffding bound [15], for any indices
j, k = 1, . . . , d and for any ε > 0, we have
P[(Zjk)2 ≥ ε2] = P
[∣∣∣∣∣1
n
n∑i=1
Z(i)jk
∣∣∣∣∣ ≥ ε
]≤ 2 exp
(−ε2n
32
).(39)
HIGH-DIMENSIONAL ISING MODEL SELECTION 1303
So as to simplify notation, throughout this section, we use K to denote a universalpositive constant, independent of (n,p, d). Note that the precise value and mean-ing of K may differ from line to line.
5.1. Proof of Lemma 5. By the Courant–Fischer variational representa-tion [16], we have
min(QSS) = min‖x‖2=1xT QSSx
= min‖x‖2=1{xT Qn
SSx + xT (QSS − QnSS)x}
≤ yT QnSSy + yT (QSS − Qn
SS)y,
where y ∈ Rd is a unit-norm minimal eigenvector of Qn
SS . Therefore, we have
min(QnSS) ≥ min(QSS) − |||QSS − Qn
SS |||2 ≥ Cmin − |||QSS − QnSS |||2.
Hence it suffices to obtain a bound on the spectral norm |||QSS − QnSS |||2. Observe
that
|||QnSS − QSS |||2 ≤
(d∑
j=1
d∑k=1
(Zjk)2
)1/2
.
Setting ε2 = δ2/d2 in (39) and applying the union bound over the d2 index pairs(j, k) then yields
P[|||QnSS − QSS |||2 ≥ δ] ≤ 2 exp
(−K
δ2n
d2 + 2 log(d)
).(40)
Similarly, we have
P
[max
(1
n
n∑i=1
x(i)\r
(x
(i)\r
)T )≥ Dmax
]
≤ P
[∥∥∥∥∥∣∣∣∣∣(
1
n
n∑i=1
x(i)\r
(x
(i)\r
)T )− Eθ∗[X\rXT\r ]
∥∥∥∥∥∣∣∣∣∣2
≥ δ
],
which obeys the same upper bound (40) by following the analogous argument.
5.2. Proof of Lemma 6. We begin by decomposing the sample matrix as thesum Qn
ScS(QnSS)−1 = T1 + T2 + T3 + T4 where we define
T1 := Q∗ScS[(Qn
SS)−1 − (Q∗SS)−1],(41a)
T2 := [QnScS − Q∗
ScS](Q∗SS)−1,(41b)
T3 := [QnScS − Q∗
ScS][(QnSS)−1 − (Q∗
SS)−1],(41c)
T4 := Q∗ScS(Q∗
SS)−1.(41d)
1304 P. RAVIKUMAR, M. J. WAINWRIGHT AND J. D. LAFFERTY
The fourth term is easily controlled; indeed, we have
|||T4|||∞ = |||Q∗ScS(Q∗
SS)−1|||∞ ≤ 1 − α
by the incoherence assumption (A2). If we can show that |||Ti |||∞ ≤ α6 for the re-
maining indices i = 1,2,3, then by our four term decomposition and the triangleinequality, the sample version satisfies the bound (38), as claimed. We deal withthese remaining terms using the following lemmas:
LEMMA 7. For any δ > 0 and constants K,K ′, the following bounds hold:
P[|||QnScS − Q∗
ScS |||∞ ≥ δ](42a)
≤ 2 exp(−K
nδ2
d2 + log(d) + log(p − d)
);
P[|||QnSS − Q∗
SS |||∞ ≥ δ](42b)
≤ 2 exp(−K
nδ2
d2 + 2 log(d)
);
P[|||(QnSS)−1 − (Q∗
SS)−1|||∞ ≥ δ](42c)
≤ 4 exp(−K
nδ2
d3 + K ′ log(d)
).
See Appendix C for the proof of these claims.
Control of first term. Turning to the first term, we re-factorize it as
T1 = Q∗ScS(Q∗
SS)−1[QnSS − Q∗
SS](QnSS)−1
and then bound it (using the sub-multiplicative property |||AB|||∞ ≤ |||A|||∞|||B|||∞)as follows:
|||T1|||∞ ≤ |||Q∗ScS(Q∗
SS)−1|||∞|||QnSS − Q∗
SS |||∞|||(QnSS)−1|||∞
≤ (1 − α)|||QnSS − Q∗
SS |||∞{√d|||(Qn
SS)−1|||2},where we have used the incoherence assumption (A2). Using the bound (37b)from Lemma 5 with δ = Cmin/2, we have |||(Qn
SS)−1|||2 = [min(QnSS)]−1 ≤ 2
Cmin
with probability greater than 1 − exp(−Kn/d2 + 2 log(d)). Next, applying thebound (42b) with δ = c/
√d , we conclude that with probability greater than
1 − 2 exp(−Knc2/d3 + log(d)), we have
|||QnSS − Q∗
SS |||∞ ≤ c/√
d.
By choosing the constant c > 0 sufficiently small, we are guaranteed that
P[|||T1|||∞ ≥ α/6] ≤ 2 exp(−K
nc2
d3 + log(d)
).(43)
HIGH-DIMENSIONAL ISING MODEL SELECTION 1305
Control of second term. To bound T2, we first write
|||T2|||∞ ≤ √d|||(Q∗
SS)−1|||2|||QnScS − Q∗
ScS |||∞
≤√
d
Cmin|||Qn
ScS − Q∗ScS |||∞.
We then apply bound (42a) with δ = α3
Cmin√d
to conclude that
P[|||T2|||∞ ≥ α/3] ≤ 2 exp(−K
n
d3 + log(p − d)
).(44)
Control of third term. Finally, in order to bound the third term T3, we applythe bounds (42a) and (42b), both with δ = √
α/3, and use the fact that log(d) ≤log(p − d) to conclude that
P[|||T3|||∞ ≥ α/3] ≤ 4 exp(−K
n
d3 + log(p − d)
).(45)
Putting together all of the pieces, we conclude that
P[|||QnScS(Qn
SS)−1|||∞ ≥ 1 − α/2] = O(
exp(−K
n
d3 + log(p)
))as claimed.
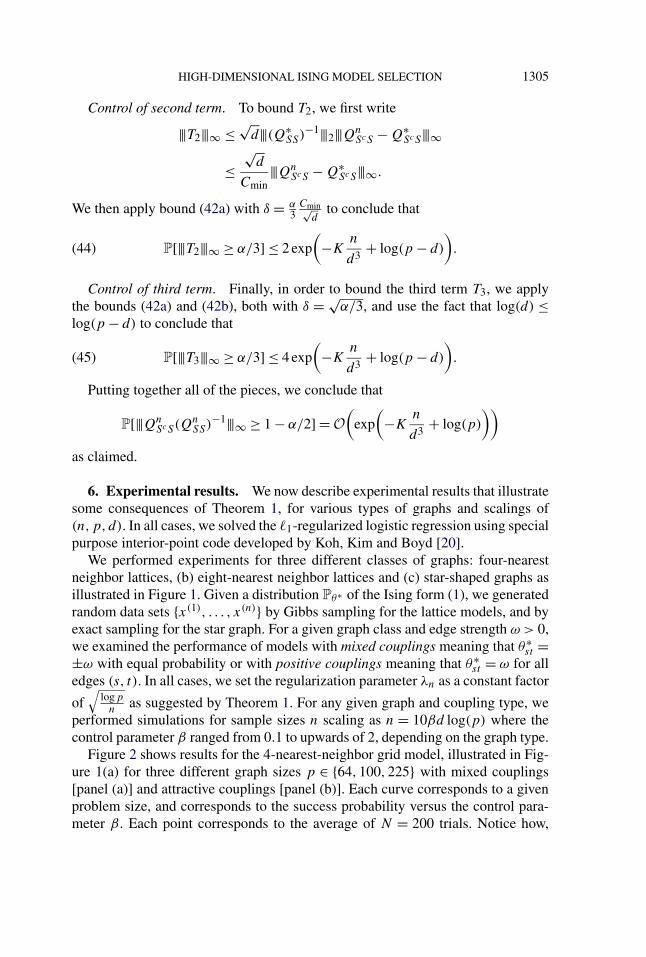
6. Experimental results. We now describe experimental results that illustratesome consequences of Theorem 1, for various types of graphs and scalings of(n,p, d). In all cases, we solved the �1-regularized logistic regression using specialpurpose interior-point code developed by Koh, Kim and Boyd [20].
We performed experiments for three different classes of graphs: four-nearestneighbor lattices, (b) eight-nearest neighbor lattices and (c) star-shaped graphs asillustrated in Figure 1. Given a distribution Pθ∗ of the Ising form (1), we generatedrandom data sets {x(1), . . . , x(n)} by Gibbs sampling for the lattice models, and byexact sampling for the star graph. For a given graph class and edge strength ω > 0,we examined the performance of models with mixed couplings meaning that θ∗
st =±ω with equal probability or with positive couplings meaning that θ∗
st = ω for alledges (s, t). In all cases, we set the regularization parameter λn as a constant factor
of√
logpn
as suggested by Theorem 1. For any given graph and coupling type, weperformed simulations for sample sizes n scaling as n = 10βd log(p) where thecontrol parameter β ranged from 0.1 to upwards of 2, depending on the graph type.
Figure 2 shows results for the 4-nearest-neighbor grid model, illustrated in Fig-ure 1(a) for three different graph sizes p ∈ {64,100,225} with mixed couplings[panel (a)] and attractive couplings [panel (b)]. Each curve corresponds to a givenproblem size, and corresponds to the success probability versus the control para-meter β . Each point corresponds to the average of N = 200 trials. Notice how,
1306 P. RAVIKUMAR, M. J. WAINWRIGHT AND J. D. LAFFERTY
FIG. 1. Illustrations of different graph classes used in simulations. (a) Four-nearest neighborgrid (d = 4). (b) Eight-nearest neighbor grid (d = 8). (c) Star-shaped graph [d = �(p), ord = �(log(p))].
despite the very different regimes of (n,p) that underlie each curve, the differentcurves all line up with one another quite well. This fact shows that for a fixed de-gree graph (in this case deg = 4), the ratio n/ log(p) controls the success/failureof our model selection procedure which is consistent with the prediction of Theo-rem 1. Figure 3 shows analogous results for the 8-nearest-neighbor lattice model(d = 8), for the same range of problem size p ∈ {64,100,225} and for both mixedand attractive couplings. Notice how once again the curves for different problemsizes are all well aligned which is consistent with the prediction of Theorem 1.
FIG. 2. Plots of success probability P[N±(r) = N (r),∀r] versus the control parameterβ(n,p,d) = n/[10d log(p)] for Ising models on 2-D grids with four nearest-neighbor interac-tions (d = 4). (a) Randomly chosen mixed sign couplings θ∗
st = ±0.50. (b) All positive couplingsθ∗st = 0.50.
HIGH-DIMENSIONAL ISING MODEL SELECTION 1307
FIG. 3. Plots of success probability P[N±(r) = N (r),∀r] versus the control parameterβ(n,p,d) = n/[10d log(p)] for Ising models on 2-D grids with eight nearest-neighbor interac-tions (d = 8). (a) Randomly chosen mixed sign couplings θ∗
st = ±0.25. (b) All positive couplingsθ∗st = 0.25.
For our next set of experiments, we investigate the performance of our methodfor a class of graphs with unbounded maximum degree d . In particular, we con-struct star-shaped graphs with p vertices by designating one node as the huband connecting it to d < (p − 1) of its neighbors. For linear sparsity, we choosed = �0.1p�, whereas for logarithmic sparsity we choose d = �log(p)�. We againstudy a triple of graph sizes p ∈ {64,100,225}, and Figure 4 shows the resulting
FIG. 4. Plots of success probability P[N±(r) = N (r),∀r] versus the control parameterβ(n,p,d) = n/[10d log(p)] for star-shaped graphs for attractive couplings with (a) logarithmicgrowth in degrees, (b) linear growth in degrees.
1308 P. RAVIKUMAR, M. J. WAINWRIGHT AND J. D. LAFFERTY
curves of success probability versus control parameter β = n/[10d log(p)]. Panels(a) and (b) correspond, respectively, to the cases of logarithmic and linear degrees.As with the bounded degree models in Figure 2 and 3, these curves align with oneanother showing a transition from failure to success with probability one.
Although the purpose of our experiments is mainly to illustrate the conse-quences of Theorem 1, we also include a comparison of our nodewise �1-penalizedlogistic regression-based method to two other graph estimation procedures. For thecomparison, we use a star-shaped graph as in the previous plot, with one node des-ignated as the hub connected to d = �0.1p� of its neighbors. It should be notedthat among all graphs with a fixed total number of edges, this class of graphs isamong the most difficult for our method to estimate. Indeed, the sufficient con-ditions of Theorem 1 scale logarithmically in the graph size p but polynomiallyin the maximum degree d; consequently, for a fixed total number of edges, ourmethod requires the most samples when all the edges are connected to the samenode, as in a star-shaped graph.
For comparative purposes, we also illustrate the performance of the PC algo-rithm of Spirtes, Glymour and Scheines [30] as well as the maximum weight treemethod of Chow and Liu [7]. Since the star graph is a tree (cycle-free), both ofthese methods are applicable in this case. The PC algorithm is targeted to learn-ing (equivalence classes of) directed acyclic graphs, and consists of two stages. Inthe first stage it starts from a completely connected undirected graph, and itera-tively removes edges based on conditional independence tests so that at the endof this stage it is left with an undirected graph which is called a skeleton. In thesecond stage, it partially directs some of the edges in the skeleton so as to obtaina completed partially directed acyclic graph which corresponds to an equivalenceclass of directed acyclic graphs. As pointed out by Kalisch and Bühlmann [18],for high-dimensional problems, the output of the first stage, which is the undi-rected skeleton graph, could provide a useful characterization of the dependenciesin the data. Following this suggestion, we use the skeleton graph determined bythe first stage of the PC algorithm as an estimate of the graph structure. We usethe pcalg R-package [18] as an implementation of the PC algorithm which usespartial correlations to test conditional independencies.
The Chow–Liu algorithm [7] is a method for exact maximum likelihood struc-ture selection which is applicable to the case of trees. More specifically, it chooses,from among all trees with a specified number of edges, the tree that minimizes theKullback–Leibler divergence to the empirical distribution defined by the samples.From an implementational point of view, it starts with a completely connectedweighted graph with edge weights equal to the empirical mutual information be-tween the incident node variables of the edge and then computes its maximumweight spanning tree. Since our underlying model is a star-shaped graph with fewerthan (p − 1) edges, a spanning tree would necessarily include false positives. Wethus estimate the maximum weight forest with d edges instead where we suppliedthe number of edges d in the true graph to the algorithm.
HIGH-DIMENSIONAL ISING MODEL SELECTION 1309
FIG. 5. Plots of edge disagreement E[|{(s, t) | Est = E∗st }|] versus the control parameter β(n,
p,d) = n/[10d log(p)] for star-shaped graphs where the hub node has degree d = �(p). The resultshere are shown for attractive couplings with θ∗
st = 0.25 for all edges (s, t) belonging to the edge set.The �1-penalized logistic regression method (L1), the PC method (PC) and the maximum weightforest method of Chow and Liu (CL) are compared for p = 64.
Figure 5 plots, for the three methods, the total number of edge disagreementsbetween the estimated graphs and the true graph versus the control parameter β =n/[10d log(p)]. Even though this class of graphs is especially challenging for aneighborhood-based method, the �1-penalized logistic-regression based method iscompetitive with the Chow–Liu algorithm, and except at very small sample sizes,it performs better than the PC algorithm for this problem.
7. Extensions to general discrete Markov random fields. Our method andanalysis thus far has been specialized to the case of the binary pairwise Markovrandom fields. In this section, we briefly outline the extension to the case of gen-eral discrete pairwise Markov random fields. (Recall that for discrete Markov ran-dom fields, there is no loss of generality in assuming only pairwise interactionssince by introducing auxiliary variables, higher-order interactions can be refor-mulated in a pairwise manner [34].) Let X = (X1, . . . ,Xp) be a random vector,each variable Xi taking values in a set X of cardinality m, say X = {1,2, . . . ,m}.Let G = (V ,E) denote a graph with p nodes corresponding to the p variables{X1, . . . ,Xp}, and let {φs : X → R, s ∈ V } and {φst : X × X → R, (s, t) ∈ E}, re-spectively, denote collections of potential functions associated with the nodes andedges of the graph. These functions can be used to define a pairwise Markov ran-dom field over (X1, . . . ,Xp), with density
P(x) ∝ exp{∑
s∈V
φs(xs) + ∑(s,t)∈E
φst (xs, xt )
}.(46)
1310 P. RAVIKUMAR, M. J. WAINWRIGHT AND J. D. LAFFERTY
Since X is discrete, each potential function φst can be parameterized as linearcombinations of {0,1}-valued indicator functions. In particular, for each s ∈ V andj ∈ {1, . . . ,m − 1}, we define
I[xs = j ] ={
1, if xs = j ,0, otherwise.
Note we omit an indicator for xs = m from the list, since it is redundant giventhe indicators for j = 1, . . . ,m − 1. In a similar fashion, we define the pairwiseindicator functions I[xs = j, xt = k], for (j, k) ∈ {1,2, . . . ,m − 1}2.
Any set of potential functions can then be written as
φs(xs) = ∑j∈{1,...,m−1}
θ∗s;j I[xs = j ] for s ∈ V ,
and
φst (xs, xt ) = ∑(j,k)∈{1,...,m−1}2
θ∗st;jkI[xs = j, xt = k] for (s, t) ∈ E.
Overall, the Markov random field can be parameterized in terms of the vectorθ∗s ∈ R
m−1 for each s ∈ V , and the vector θ∗st ∈ R
(m−1)2associated with each edge.
In discussing graphical model selection, it is convenient to associate a vector θ∗uv ∈
R(m−1)2
to every pair of distinct vertices (u, v) with the understanding that θ∗uv = 0
if (u, v) /∈ E.With this set-up, we now describe a graph selection procedure that is the nat-
ural generalization of our procedure for the Ising model. As before we focus onrecovering for each vertex r ∈ V its neighborhood set and then combine the neigh-borhood sets across vertices to form the graph estimate.
For a binary Markov random field (1), there is a unique parameter θ∗rt associ-
ated with each edge (r, t) ∈ E. For m-ary models, in contrast, there is a vectorθ∗rt ∈ R
(m−1)2of parameters associated with any edge (r, t). In order to describe
a recovery procedure for the edges, let us define a matrix �∗\r ∈ R(m−1)2×(p−1)
where column u is given by the vector θ∗ru. Note that unless vertex r is connected
to all of its neighbors, many of the matrix columns are zero. In particular, the prob-lem of neighborhood estimation for vertex r corresponds to estimating the columnsupport of the matrix �∗\r—that is,
N (r) = {u ∈ V \ {r} | ‖θ∗
ru‖2 = 0}.
In order to estimate this column support, we consider the conditional distribu-tion of Xr given the other variables X\{r} = {Xt |t ∈ V \ {r}}. For a binary model,this distribution is of the logistic form while for a general pairwise MRF, it takesthe form
P�[Xr = j | X\r = x\r ] = exp(θ∗r;j + ∑
t∈V \{r}∑
k θ∗rt;jkI[xt = k])∑
� exp(θ∗r;� + ∑
t∈V \{r}∑
k θ∗rt;�kI[xt = k]) .(47)
HIGH-DIMENSIONAL ISING MODEL SELECTION 1311
Thus, Xr can be viewed as the response variable in a multiclass logistic regressionin which the indicator functions associated with the other variables,{
I[xt = k], t ∈ V \ {r}, k ∈ {1,2, . . . ,m − 1}},play the role of the covariates.
Accordingly, one method of recovering the row support of �∗\r is by performingmulticlass logistic regression of Xr on the rest of the variables X\r using a block�2/�1 penalty of the form
|||�\r |||2,1 := ∑u∈V \{r}
‖θru‖2.
More specifically, let Xn1 = {x(1), . . . , x(n)} denote an i.i.d. set of n samples, drawn
from the discrete MRF (46). In order to estimate the neighborhood of node r , wesolve the following convex program:
min�\r∈R(m−1)2×(p−1)
{�(�\r;Xn1) + λn|||�\r |||2,1},(48)
where �(�\r;Xn1) := 1
n
∑ni=1 log P�[x(i)
r | x(i)\r ] is the rescaled multiclass logistic
likelihood defined by the conditional distribution (47), and λn > 0 is a regulariza-tion parameter.
The convex program (48) is the multiclass logistic analog of the group Lasso,a type of relaxation that has been studied in previous and on-going work on linearand logistic regression (e.g., [19, 22, 25, 38]). It should be possible to extend ouranalysis from the preceding sections so as to obtain similar high-dimensional con-sistency rates for this multiclass setting; the main difference is the slightly differentsub-differential associated with the block �2/�1 norm. See Obozinski, Wainwrightand Jordan [25] for some related work on support recovery using �2/�1 block-regularization for multivariate linear regression.
8. Conclusion. We have shown that a technique based on �1-regularized lo-gistic regression can be used to perform consistent model selection in binary Isinggraphical models, with polynomial computational complexity and sample com-plexity logarithmic in the graph size. Our analysis applies to the high-dimensionalsetting, in which both the number of nodes p and maximum neighborhood sizesd are allowed to grow as a function of the number of observations n. Simula-tion results show the accuracy of these theoretical predictions. For bounded degreegraphs, our results show that the structure can be recovered with high probabil-ity once n/ log(p) is sufficiently large. Up to constant factors, this result matchesknown information-theoretic lower bounds [29]. Overall, our experimental resultsare consistent with the conjecture that logistic regression procedure fails with highprobability for sample sizes n that are smaller than O(d logp). It would be interest-ing to prove such a converse result, to parallel the known upper and lower thresh-olds for success/failure of �1-regularized linear regression, or the Lasso (see [33]).
1312 P. RAVIKUMAR, M. J. WAINWRIGHT AND J. D. LAFFERTY
As discussed in Section 7, although the current analysis is applied to binaryMarkov random fields, the methods of this paper can be extended to general dis-crete graphical models with a higher number of states using a multinomial likeli-hood and some form of block regularization. It should also be possible and wouldbe interesting to obtain high-dimensional rates in this setting. A final interestingdirection for future work is the case of samples drawn in a non-i.i.d. manner fromsome unknown Markov random field; we suspect that similar results would holdfor weakly dependent sampling schemes.
APPENDIX A: PROOF OF UNIQUENESS LEMMA
In this appendix, we prove Lemma 1. By Lagrangian duality, the penalized prob-lem (7) can be written as an equivalent constrained optimization problem over theball ‖θ‖1 ≤ C(λn), for some constant C(λn) < +∞. Since the Lagrange multiplierassociated with this constraint—namely, λn—is strictly positive, the constraint isactive at any optimal solution so that ‖θ‖1 is constant across all optimal solutions.
By the definition of the �1-subdifferential, the subgradient vector z can be ex-pressed as a convex combination of sign vectors of the form
z = ∑v∈{−1,+1}p−1
αvv,(49)
where the weights αv are nonnegative and sum to one. In fact, these weights cor-respond to an optimal vector of Lagrange multipliers for an alternative formu-lation of the problem in which αv is the Lagrange multiplier for the constraint〈v, θ〉 ≤ C(λn). From standard Lagrangian theory [3], it follows that any otheroptimal primal solution θ must minimize the associated Lagrangian—or equiva-lently, satisfy (21)—and moreover must satisfy the complementary slackness con-ditions αv{〈v, θ〉 − C} = 0 for all sign vectors v. But these conditions imply that〈z, θ〉 = C = ‖θ‖1 which cannot occur if θj = 0 for some index j for which|zj | < 1. We thus conclude that θSc = 0 for all optimal primal solutions.
Finally, given that all optimal solutions satisfy θSc = 0, we may consider therestricted optimization problem subject to this set of constraints. If the principalsubmatrix of the Hessian is positive definite, then this sub-problem is strictly con-vex so that the optimal solution must be unique.
APPENDIX B: PROOFS FOR TECHNICAL LEMMAS
In this section, we provide proofs of Lemmas 2, 3 and 4, previously stated inSection 4.
B.1. Proof of Lemma 2. Note that any entry of Wn has the form Wnu =
1n
∑ni=1 Z
(i)u where for i = 1,2, . . . , n, the variables
Z(i)u := x
(i)\r
{x(i)r − Pθ∗
[xr = 1 | x(i)
\r] + Pθ∗
[xr = −1 | x(i)
\r]}
HIGH-DIMENSIONAL ISING MODEL SELECTION 1313
are zero-mean under Pθ∗ , i.i.d. and bounded (|Z(i)u | ≤ 2). Therefore, by the Azuma-
Hoeffding inequality [15], we have, for any δ > 0, P[|Wnu | > δ] ≤ 2 exp(−nδ2
8 ).Setting δ = αλn
4(2−α), we obtain
P
[2 − α
λn
|Wnu | > α
4
]≤ 2 exp
(− α2λ2
n
128(2 − α)2 n
).
Finally, applying a union bound over the indices u of Wn yields
P
[2 − α
λn
‖Wn‖∞ >α
4
]≤ 2 exp
(− α2λ2
n
128(2 − α)2 n + log(p)
)as claimed.
B.2. Proof of Lemma 3. Following a method used in a different context byRothman et al. [28], we define the function G : Rd → R by
G(uS) := �(θ∗S + uS;Xn
1) − �(θ∗S ;Xn
1) + λn(‖θ∗S + uS‖ − ‖θ∗
S‖).(50)
It can be seen from (24) that u = θS − θ∗S minimizes G. Moreover, G(0) = 0 by
construction; therefore, we must have G(u) ≤ 0. Note also that G is convex. Sup-pose that we show that for some radius B > 0, and for u ∈ R
d with ‖u‖2 = B , wehave G(u) > 0. We then claim that ‖u‖2 ≤ B . Indeed, if u lay outside the ball ofradius B , then the convex combination t u + (1 − t)(0) would lie on the boundaryof the ball, for an appropriately chosen t ∈ (0,1). By convexity,
G(t u + (1 − t)(0)
) ≤ tG(u) + (1 − t)G(0) ≤ 0,
contradicting the assumed strict positivity of G on the boundary.It thus suffices to establish strict positivity of G on the boundary of the ball
with radius B = Mλn
√d where M > 0 is a parameter to be chosen later in the
proof. Let u ∈ Rd be an arbitrary vector with ‖u‖2 = B . Recalling the notation
W = ∇�(θ∗;Xn1), by a Taylor series expansion of the log likelihood component
of G, we have
G(u) = WTS u + uT [∇2�(θ∗
S + αu)]u + λn(‖θ∗S + uS‖ − ‖θ∗
S‖)(51)
for some α ∈ [0,1]. For the first term, we have the bound
|WTS u| ≤ ‖WS‖∞‖u‖1 ≤ ‖WS‖∞
√d‖u‖2 ≤ (
λn
√d)2 M
4,(52)
since ‖WS‖∞ ≤ λn
4 by assumption.Applying the triangle inequality to the last term in the expansion (51) yields
λn‖θ∗S + uS‖1 − ‖θ∗
S‖1 ≥ −λn‖uS‖1.
Since ‖uS‖1 ≤ √d‖uS‖2, we have
λn‖θ∗S + uS‖1 − ‖θ∗
S‖1 ≥ −λn
√d‖uS‖2 = −M
(√dλn
)2.(53)
1314 P. RAVIKUMAR, M. J. WAINWRIGHT AND J. D. LAFFERTY
Finally, turning to the middle Hessian term, we have
q∗ := min(∇2�(θ∗
S + αu;Xn1)
)≥ min
α∈[0,1]min(∇2�(θ∗
S + αuS;Xn1)
)= min
α∈[0,1]min
[1
n
n∑i=1
η(x(i); θ∗
S + αuS
)x
(i)S
(x
(i)S
)T ].
By a Taylor series expansion of η(x(i); ·), we have
q∗ ≥ min
[1
n
n∑i=1
η(x(i); θ∗
S
)x
(i)S
(x
(i)S
)T ]
− maxα∈[0,1]
∥∥∥∥∥∣∣∣∣∣1
n
n∑i=1
η′(x(i); θ∗S + αuS
)(uT
S x(i)S
)x
(i)S
(x
(i)S
)T ∥∥∥∥∥∣∣∣∣∣2
= min(Q∗SS) − max
α∈[0,1]
∥∥∥∥∥∣∣∣∣∣1
n
n∑i=1
η′(x(i); θ∗S + αuS
)(⟨uS, x
(i)S
⟩)x
(i)S
(x
(i)S
)T ∥∥∥∥∥∣∣∣∣∣2
≥ Cmin − maxα∈[0,1]
∥∥∥∥∥∣∣∣∣∣1
n
n∑i=1
η′(x(i); θ∗S + αuS
)(⟨uS, x
(i)S
⟩)x
(i)S
(x
(i)S
)T︸ ︷︷ ︸
∥∥∥∥∥∣∣∣∣∣2
A(α)
.
It remains to control the spectral norm of the matrices A(α), for α ∈ [0,1]. Forany fixed α ∈ [0,1] and y ∈ R
d with ‖y‖2 = 1, we have
〈y,A(α)y〉 = 1
n
n∑i=1
η′(x(i); θ∗S + αuS
)[⟨uS, x
(i)S
⟩][⟨x
(i)S , y
⟩]2
≤ 1
n
n∑i=1
∣∣η′(x(i); θ∗S + αuS
)∣∣∣∣⟨uS, x(i)S
⟩∣∣[⟨x(i)S , y
⟩]2.
Now note that |η′(x(i); θ∗S + αuS)| ≤ 1, and∣∣⟨uS, x
(i)S
⟩∣∣ ≤ √d‖uS‖2 = Mλnd.
Moreover, we have
1
n
n∑i=1
(⟨x
(i)S , y
⟩)2 ≤∥∥∥∥∥∣∣∣∣∣1
n
n∑i=1
x(i)S
(x
(i)S
)T ∥∥∥∥∥∣∣∣∣∣2
≤ Dmax
by assumption. Combining these pieces, we obtain
maxα∈[0,1]|||A(α)|||2 ≤ DmaxMλnd ≤ Cmin/2,
HIGH-DIMENSIONAL ISING MODEL SELECTION 1315
assuming that λn ≤ Cmin2MDmaxd
. We verify this condition momentarily, after we havespecified the constant M .
Under this condition, we have shown that
q∗ := min(∇2�(θ∗
S + αu;Xn1)
) ≥ Cmin/2.(54)
Finally, combining the bounds (52), (53), and (54) in the expression (51), we con-clude that
G(uS) ≥ (λn
√d)2{−1
4M + Cmin
2M2 − M
}.
This expression is strictly positive for M = 5/Cmin. Consequently, as long as
λn ≤ Cmin
2MDmaxd= C2
min
10Dmaxd
as assumed in the statement of the lemma, we are guaranteed that
‖uS‖2 ≤ Mλn
√d = 5
Cminλn
√d
as claimed.
B.3. Proof of Lemma 4. We first show that the remainder term Rn satisfiesthe bound ‖Rn‖∞ ≤ Dmax‖θS − θ∗
S‖22. Then the result of Lemma 3—namely, that
‖θS − θ∗S‖2 ≤ 5
Cminλn
√d—can be used to conclude that
‖Rn‖∞λn
≤ 25Dmax
C2min
λnd
as claimed in Lemma 4.Focusing on element Rn
j for some index j ∈ {1, . . . , p}, we have
Rnj = [∇2�
(−θ(j);x) − ∇2�(θ∗;x)
]Tj [θ − θ∗]
= 1
n
n∑i=1
[η(x(i); −
θ(j)) − η(x(i); θ∗)][x(i)(x(i))T ]T
j [θ − θ∗]
for some point−θ(j) = tj θ + (1 − tj )θ
∗. Setting g(t) = 4 exp(2t)
[1+exp(2t)]2 , note that
η(x; θ) = g(xr
∑t∈V \r θrtxt ). By the chain rule and another application of the
mean value theorem, we then have
Rnj = 1
n
n∑i=1
g′(=θ(j)T x(i))(x(i))T [−
θ(j) − θ∗]{x(i)j
(x(i))T [θ − θ∗]}
= 1
n
n∑i=1
{g′(=
θ(j)T x(i))x(i)j
}{[−θ(j) − θ∗]T x(i)(x(i))T [θ − θ∗]},
1316 P. RAVIKUMAR, M. J. WAINWRIGHT AND J. D. LAFFERTY
where=θ(j) is another point on the line joining θ and θ∗. Setting ai := {g′(=
θ(j)T ×x(i))x
(i)j } and bi := {[−
θ(j) − θ∗]T x(i)(x(i))T [θ − θ∗]}, we have
|Rnj | = 1
n
∣∣∣∣∣n∑
i=1
aibi
∣∣∣∣∣ ≤ 1
n‖a‖∞‖b‖1.
A calculation shows that ‖a‖∞ ≤ 1, and
1
n‖b‖1 = tj [θ − θ∗]T
{1
n
n∑i=1
x(i)(x(i))T }[θ − θ∗]
= tj [θS − θ∗S ]T
{1
n
n∑i=1
x(i)S
(x
(i)S
)T }[θS − θ∗
S ]
≤ Dmax‖θS − θ∗S‖2
2,
where the second line uses the fact that θSc = θ∗Sc = 0. This concludes the proof.
APPENDIX C: PROOF OF LEMMA 7
Recall from the discussion leading up to the bound (39) that element (j, k) ofthe matrix difference Qn − Q∗, denoted by Zjk , satisfies a sharp tail bound. Bydefinition of the �∞-matrix norm, we have
P[|||QnScS − Q∗
ScS |||∞ ≥ δ] = P
[maxj∈Sc
∑k∈S
|Zjk| ≥ δ
]
≤ (p − d)P
[∑k∈S
|Zjk| ≥ δ
],
where the final inequality uses a union bound, and the fact that |Sc| ≤ p − d . Viaanother union bound over the row elements
P
[∑k∈S
|Zjk| ≥ δ
]≤ P[∃k ∈ S||Zjk| ≥ δ/d]
≤ dP[|Zjk| ≥ δ/d];we then obtain
P[|||QnScS − Q∗
ScS |||∞ ≥ δ] ≤ (p − d)dP[|Zjk| ≥ δ/d]from which the claim (42a) follows by setting ε = δ/d in the Hoeffdingbound (39). The proof of bound (42b) is analogous with the pre-factor (p − d)
replaced by d .
HIGH-DIMENSIONAL ISING MODEL SELECTION 1317
To prove the last claim (42c), we write
|||(QnSS)−1 − (Q∗
SS)−1|||∞ = |||(Q∗SS)−1[Q∗
SS − QnSS](Qn
SS)−1|||∞≤ √
d|||(Q∗SS)−1[Q∗
SS − QnSS](Qn
SS)−1|||2≤ √
d|||(Q∗SS)−1|||2|||Q∗
SS − QnSS |||2|||(Qn
SS)−1|||2
≤√
d
Cmin|||Q∗
SS − QnSS |||2|||(Qn
SS)−1|||2.From the proof of Lemma 5, in particular equation (40), we have
P
[|||(Qn
SS)−1|||2 ≥ 2
Cmin
]≤ 2 exp
(−K
δ2n
d2 + B log(d)
)for a constant B . Moreover, from (40), we have
P[|||Qn
SS − QSS |||2 ≥ δ/√
d] ≤ 2 exp
(−K
δ2n
d3 + 2 log(d)
)so that the bound (42c) follows.
REFERENCES
[1] ABBEEL, P., KOLLER, D. and NG, A. Y. (2006). Learning factor graphs in polynomial timeand sample complexity. J. Mach. Learn. Res. 7 1743–1788. MR2274423
[2] BANERJEE, O., GHAOUI, L. E. and D’ASPRÉMONT, A. (2008). Model selection throughsparse maximum likelihood estimation for multivariate Gaussian or binary data. J. Mach.Learn. Res. 9 485–516. MR2417243
[3] BERTSEKAS, D. (1995). Nonlinear Programming. Athena Scientific, Belmont, MA.[4] BRESLER, G., MOSSEL, E. and SLY, A. (2009). Reconstruction of Markov random fields from
samples: Some easy observations and algorithms. Available at http://front.math.ucdavis.edu/0712.1402.
[5] CANDES, E. and TAO, T. (2007). The Dantzig selector: Statistical estimation when p is muchlarger than n (with discussion). Ann. Statist. 35 2313–2351. MR2382644
[6] CHICKERING, D. (1995). Learning Bayesian networks is NP-complete. In Learning from Data:Artificial Intelligence and Statistics V (D. Fisher and H. Lenz, eds.). Lecture Notes inStatistics 112 121–130. Springer, New York.
[7] CHOW, C. and LIU, C. (1968). Approximating discrete probability distributions with depen-dence trees. IEEE Trans. Inform. Theory 14 462–467.
[8] CROSS, G. and JAIN, A. (1983). Markov random field texture models. IEEE Trans. PAMI 525–39.
[9] CSISZÁR, I. and TALATA, Z. (2006). Consistent estimation of the basic neighborhood structureof Markov random fields. Ann. Statist. 34 123–145. MR2275237
[10] DASGUPTA, S. (1999). Learning polytrees. In Proceedings of the Fifteenth Conference on Un-certainty in Artificial Intelligence (UAI-99). Morgan Kaufmann, San Francisco, CA.
[11] DAVIDSON, K. R. and SZAREK, S. J. (2001). Local operator theory, random matrices, andBanach spaces. In Handbook of the Geometry of Banach Spaces 1 317–336. Elsevier,Amsterdam. MR1863696
[12] DONOHO, D. and ELAD, M. (2003). Maximal sparsity representation via �1 minimization.Proc. Natl. Acad. Sci. USA 100 2197–2202. MR1963681
1318 P. RAVIKUMAR, M. J. WAINWRIGHT AND J. D. LAFFERTY
[13] GEMAN, S. and GEMAN, D. (1984). Stochastic relaxation, Gibbs distributions, and theBayesian restoration of images. IEEE Trans. PAMI 6 721–741.
[14] HASSNER, M. and SKLANSKY, J. (1980). The use of Markov random fields as models oftexture. Comp. Graphics Image Proc. 12 357–370.
[15] HOEFFDING, W. (1963). Probability inequalities for sums of bounded random variables.J. Amer. Statist. Assoc. 58 13–30. MR0144363
[16] HORN, R. A. and JOHNSON, C. R. (1985). Matrix Analysis. Cambridge Univ. Press, Cam-bridge. MR0832183
[17] ISING, E. (1925). Beitrag zur theorie der ferromagnetismus. Zeitschrift für Physik 31 253–258.[18] KALISCH, M. and BUHLMANN, P. (2007). Estimating high-dimensional directed acyclic
graphs with the pc-algorithm. J. Mach. Learn. Res. 8 613–636.[19] KIM, Y., KIM, J. and KIM, Y. (2005). Blockwise sparse regression. Statist. Sinica 16 375–390.[20] KOH, K., KIM, S. J. and BOYD, S. (2007). An interior-point method for large-scale �1-
regularized logistic regression. J. Mach. Learn. Res. 3 1519–1555. MR2332440[21] MANNING, C. D. and SCHUTZE, H. (1999). Foundations of Statistical Natural Language
Processing. MIT Press, Cambridge, MA. MR1722790[22] MEIER, L., VAN DE GEER, S. and BÜHLMANN, P. (2007). The group lasso for logistic regres-
sion. Technical report, Mathematics Dept., Swiss Federal Institute of Technology Zürich.[23] MEINSHAUSEN, N. and BÜHLMANN, P. (2006). High dimensional graphs and variable selec-
tion with the lasso. Ann. Statist. 34 1436–1462. MR2278363[24] NG, A. Y. (2004). Feature selection, �1 vs. �2 regularization, and rotational invariance. In
Proceedings of the Twenty-First International Conference on Machine Learning (ICML-04). Morgan Kaufmann, San Francisco, CA.
[25] OBOZINSKI, G., WAINWRIGHT, M. J. and JORDAN, M. I. (2008). Union support recoveryin high-dimensional multivariate regression. Technical report, Dept. Statistics, Univ. Cal-ifornia, Berkeley.
[26] RIPLEY, B. D. (1981). Spatial Statistics. Wiley, New York. MR0624436[27] ROCKAFELLAR, G. (1970). Convex Analysis. Princeton Univ. Press, Princeton. MR0274683[28] ROTHMAN, A., BICKEL, P., LEVINA, E. and ZHU, J. (2008). Sparse permutation invariant
covariance estimation. Electron. J. Stat. 2 494–515. MR2417391[29] SANTHANAM, N. P. and WAINWRIGHT, M. J. (2008). Information-theoretic limits of high-
dimensional graphical model selection. In International Symposium on Information The-ory. Toronto, Canada.
[30] SPIRTES, P., GLYMOUR, C. and SCHEINES, R. (2000). Causation, Prediction and Search.MIT Press, Cambridge, MA. MR1815675
[31] SREBRO, N. (2003). Maximum likelihood bounded tree-width Markov networks. Artificial In-telligence 143 123–138. MR1963987
[32] TROPP, J. A. (2006). Just relax: Convex programming methods for identifying sparse signals.IEEE Trans. Inform. Theory 51 1030–1051. MR2238069
[33] WAINWRIGHT, M. J. (2009). Sharp thresholds for high-dimensional and noisy sparsity recov-ery using �1-constrained quadratic programming (Lasso). IEEE Trans. Inform. Theory 552183–2202.
[34] WAINWRIGHT, M. J. and JORDAN, M. I. (2003). Graphical models, exponential families, andvariational inference. Technical Report 649, Dept. Statistics, Univ. California, Berkeley.MR2082153
[35] WAINWRIGHT, M. J., RAVIKUMAR, P. and LAFFERTY, J. D. (2007). High-dimensional graph-ical model selection using �1-regularized logistic regression. In Advances in Neural Infor-mation Processing Systems (B. Schölkopf, J. Platt and T. Hoffman, eds.) 19 1465–1472.MIT Press, Cambridge, MA.
[36] WELSH, D. J. A. (1993). Complexity: Knots, Colourings, and Counting. Cambridge Univ.Press, Cambridge. MR1245272
[37] WOODS, J. (1978). Markov image modeling. IEEE Trans. Automat. Control 23 846–850.[38] YUAN, M. and LIN, Y. (2006). Model selection and estimation in regression with grouped
variables. J. R. Stat. Soc. Ser. B Stat. Methodol. 68 49–67. MR2212574[39] ZHAO, P. and YU, B. (2007). On model selection consistency of lasso. J. Mach. Learn. Res. 7