Procedia Computer Science 00 (2018) 1–10 Procedia Computer Science International Conference on Computational Science, ICCS 2010 High-performance astrophysical visualization using Splotch Zhefan Jin School of Creative Technologies, University of Portsmouth, Winston Churchill Avenue, Portsmouth, United Kingdom Mel Krokos School of Creative Technologies, University of Portsmouth, Winston Churchill Avenue, Portsmouth, United Kingdom Marzia Rivi CINECA, Via Magnanelli 6/3, Casalecchio di Reno, Italy Claudio Gheller CINECA, Via Magnanelli 6/3, Casalecchio di Reno, Italy Klaus Dolag Max-Planck-Institut f¨ ur Astrophysik, Karl-Schwarzschild Strasse 1, Garching bei M¨ unchen, Germany Martin Reinecke Max-Planck-Institut f¨ ur Astrophysik, Karl-Schwarzschild Strasse 1, Garching bei M¨ unchen, Germany Abstract The scientific community is presently witnessing an unprecedented growth in the quality and quantity of data sets coming from simulations and real-world experiments. To access effectively and extract the scientific content of such large-scale data sets (often sizes are measured in hundreds or even millions of Gigabytes) appropriate tools are needed. Visual data exploration and discovery is a robust approach for rapidly and intuitively inspecting large-scale data sets, e.g. for identifying new features and patterns or isolating small regions of interest within which to apply time-consuming algorithms. This paper presents a high performance parallelized implementation of Splotch, our pre- viously developed visual data exploration and discovery algorithm for large-scale astrophysical data sets coming from particle-based simulations. Splotch has been improved in order to exploit modern massively parallel architectures, e.g. multicore CPUs and CUDA-enabled GPUs. We present performance and scalability benchmarks on a number of test cases, demonstrating the ability of our high performance parallelized Splotch to handle efficiently large-scale data sets, such as the outputs of the Millennium II simulation, the largest cosmological simulation ever performed. Keywords: Visual Discovery, Splotch, Numerical Simulations, High-Performance Visualization, MPI, CUDA-enabled GPUs, Millenium II Simulation arXiv:1004.1302v1 [astro-ph.IM] 8 Apr 2010
Transcript
Procedia Computer Science 00 (2018) 1–10
Procedia ComputerScience
International Conference on Computational Science, ICCS 2010
High-performance astrophysical visualization using Splotch
Zhefan Jin
School of Creative Technologies, University of Portsmouth, Winston Churchill Avenue, Portsmouth, United Kingdom
Mel Krokos
School of Creative Technologies, University of Portsmouth, Winston Churchill Avenue, Portsmouth, United Kingdom
Marzia Rivi
CINECA, Via Magnanelli 6/3, Casalecchio di Reno, Italy
Claudio Gheller
CINECA, Via Magnanelli 6/3, Casalecchio di Reno, Italy
Klaus Dolag
Max-Planck-Institut fur Astrophysik, Karl-Schwarzschild Strasse 1, Garching bei Munchen, Germany
Martin Reinecke
Max-Planck-Institut fur Astrophysik, Karl-Schwarzschild Strasse 1, Garching bei Munchen, Germany
Abstract
The scientific community is presently witnessing an unprecedented growth in the quality and quantity of datasets coming from simulations and real-world experiments. To access effectively and extract the scientific content ofsuch large-scale data sets (often sizes are measured in hundreds or even millions of Gigabytes) appropriate tools areneeded. Visual data exploration and discovery is a robust approach for rapidly and intuitively inspecting large-scaledata sets, e.g. for identifying new features and patterns or isolating small regions of interest within which to applytime-consuming algorithms. This paper presents a high performance parallelized implementation of Splotch, our pre-viously developed visual data exploration and discovery algorithm for large-scale astrophysical data sets coming fromparticle-based simulations. Splotch has been improved in order to exploit modern massively parallel architectures,e.g. multicore CPUs and CUDA-enabled GPUs. We present performance and scalability benchmarks on a number oftest cases, demonstrating the ability of our high performance parallelized Splotch to handle efficiently large-scale datasets, such as the outputs of the Millennium II simulation, the largest cosmological simulation ever performed.
Z. Jin et al. / Procedia Computer Science 00 (2018) 1–10 2
1. Introduction
Nowadays the technological advances in instrumentation and computing capability impact profoundly on thedramatic growth in the quality and quantity of astrophysical data sets obtained from observational instruments, e.g.sky surveys [1], [2], or large-scale numerical simulations, e.g. the Millennium II simulation [3].
The main characteristic of modern astrophysical data sets is extremely large sizes (in the order of hundreds ofGigabytes) requiring storage in extremely large-scale distributed databases. The forthcoming next-generation astro-physical data sets are expected to exhibit massively large sizes (in the order of hundreds of Terabytes), e.g. [4]. Toobtain a comprehensive insight into modern astrophysical data sets, astronomers employ sophisticated data miningalgorithms, often at prohibitively high computational costs. Visual data exploration and discovery tools are then ex-ploited in order to rapidly and intuitively inspect very large-scale data sets to identify regions of interest within whichto apply time-consuming algorithms. Such tools are based on a combination of meaningful data visualizations anduser interactions with them.
This apporoach can be a very intuitive and ready way of discovering and understanding rapidly new correlations,similarities and data patterns. For on-going processes, e.g. a numerical simulation in progress, visual data explorationand discovery allow constant monitoring and - if anomalies are discovered - prompt correction of the run, thus savingvaluable time and resources.
The data exploration tools traditionally employed by astronomers are limited either to processing and displayingof 2D images (see, e.g., [5], [6], [7], [8]) or to generation of meaningful 2D and 3D plots (e.g. [9], [10], [11]).
To overcome the shortcomings of traditional tools, a new generation of software packages is now emerging,providing astronomers with robust instruments in the context of large-scale astrophysical data sets (e.g. [12], [13],[14], [15] and [16], [17], [18] and [19]). The underlying principles are exploitation of high performance architectures(i.e. multicore CPUs and powerful graphics boards), interoperability (different applications can operate simultaneouslyon shared data sets) and collaborative workflows (permitting several users to work simultaneously for exchanginginformation and visualization experiences).
This paper describes a high performance implementation of Splotch [20], our previously developed ray-tracingalgorithm for effective visualization of large-scale astrophysical data sets coming from particle-based computer sim-ulations. N-Body simulations constitute prime examples of particle-based simulations, typically associated with verylarge-scale data sets, e.g. the Millennium II simulation [3]. This is a simulation of the evolution of a meaningful frac-tion of the universe by means of 10 billion fluid elements (particles) interacting with each other through gravitationalforces. The typical size of a snapshot of the Millennium II simulation is about 400 Gigabytes representing a particle’sID, position and velocity together with additional properties, e.g. local smoothing length, density and velocity disper-sion. For further details on the Millennium II simulation and other works about the visualization of its data sets, thereader is referred to [3], [21] and [22].
The fundamentals and the traditional sequential operation of Splotch are reviewed in section 2. Section 3 dis-cusses our strategy for parallelizing Splotch based on different approaches that are suitable for a variety of underlyingarchitecture configurations. Our implementations are Single Instruction Multiple Data (SIMD) designs founded onthe MPI library [23] in order to support distributed multicore CPUs and CUDA [24] for exploiting not only currentlyavailable but also forthcoming next-generation multiple GPUs. The advantage of adopting several parallelization solu-tions is that we can deploy them simultaneously on hybrid architectures, e.g. mixed hardware architectures consistingof a large number of multicore CPUs and CUDA-enabled GPUs. Benchmarks for our parallelization designs and adiscussion on the Millenium II visualization are presented in section 4. Finally section 5 outlines a summary of ourwork and includes pointers to future developments.
2. The Splotch Algorithm
The rendering algorithm of Splotch is designed to handle point-like particle distributions. Such tracer particlescan be smoothed to obtain a continuous field, which is rendered based on the following assumptions:
Z. Jin et al. / Procedia Computer Science 00 (2018) 1–10 3
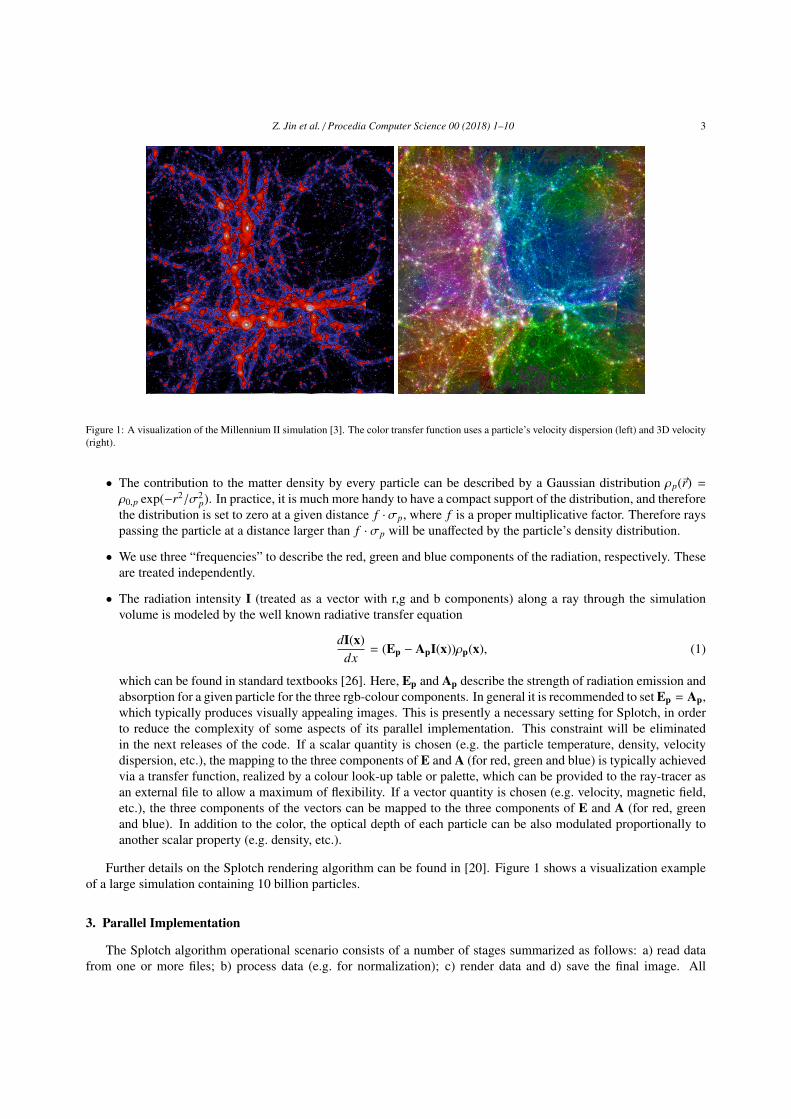
Figure 1: A visualization of the Millennium II simulation [3]. The color transfer function uses a particle’s velocity dispersion (left) and 3D velocity(right).
• The contribution to the matter density by every particle can be described by a Gaussian distribution ρp(~r) =
ρ0,p exp(−r2/σ2p). In practice, it is much more handy to have a compact support of the distribution, and therefore
the distribution is set to zero at a given distance f ·σp, where f is a proper multiplicative factor. Therefore rayspassing the particle at a distance larger than f · σp will be unaffected by the particle’s density distribution.
• We use three “frequencies” to describe the red, green and blue components of the radiation, respectively. Theseare treated independently.
• The radiation intensity I (treated as a vector with r,g and b components) along a ray through the simulationvolume is modeled by the well known radiative transfer equation
dI(x)dx
= (Ep − ApI(x))ρp(x), (1)
which can be found in standard textbooks [26]. Here, Ep and Ap describe the strength of radiation emission andabsorption for a given particle for the three rgb-colour components. In general it is recommended to set Ep = Ap,which typically produces visually appealing images. This is presently a necessary setting for Splotch, in orderto reduce the complexity of some aspects of its parallel implementation. This constraint will be eliminatedin the next releases of the code. If a scalar quantity is chosen (e.g. the particle temperature, density, velocitydispersion, etc.), the mapping to the three components of E and A (for red, green and blue) is typically achievedvia a transfer function, realized by a colour look-up table or palette, which can be provided to the ray-tracer asan external file to allow a maximum of flexibility. If a vector quantity is chosen (e.g. velocity, magnetic field,etc.), the three components of the vectors can be mapped to the three components of E and A (for red, greenand blue). In addition to the color, the optical depth of each particle can be also modulated proportionally toanother scalar property (e.g. density, etc.).
Further details on the Splotch rendering algorithm can be found in [20]. Figure 1 shows a visualization exampleof a large simulation containing 10 billion particles.
3. Parallel Implementation
The Splotch algorithm operational scenario consists of a number of stages summarized as follows: a) read datafrom one or more files; b) process data (e.g. for normalization); c) render data and d) save the final image. All
Z. Jin et al. / Procedia Computer Science 00 (2018) 1–10 4
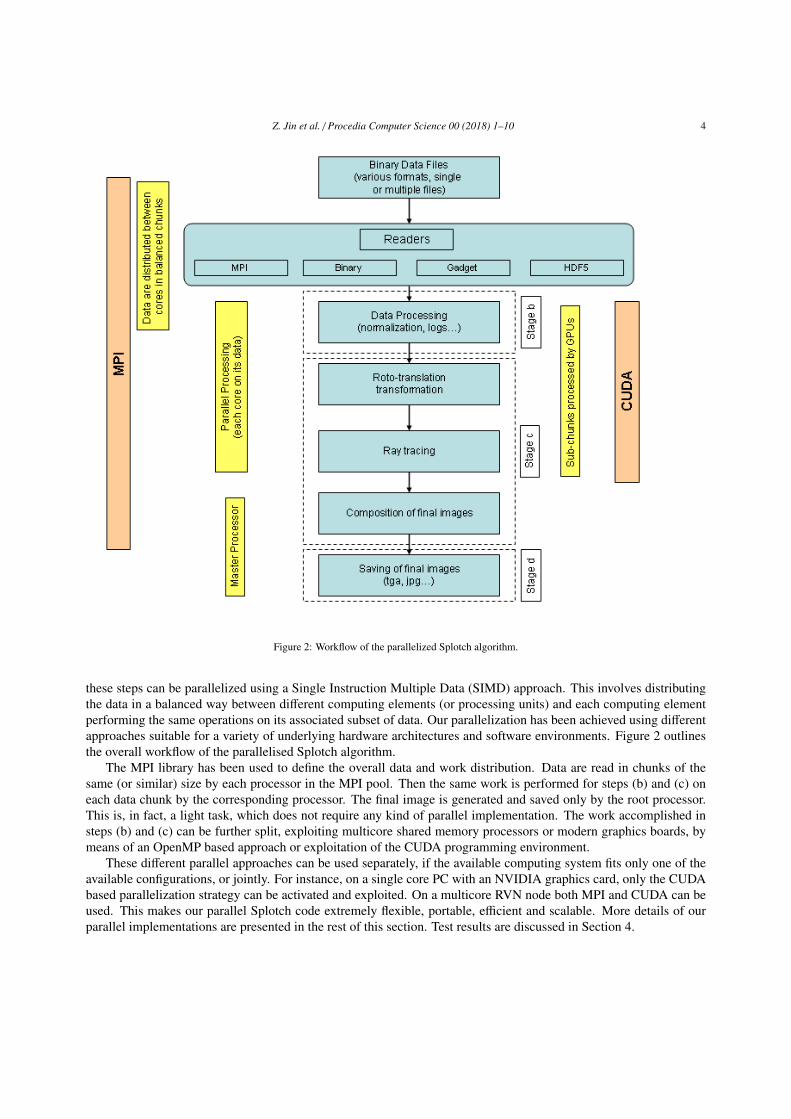
Figure 2: Workflow of the parallelized Splotch algorithm.
these steps can be parallelized using a Single Instruction Multiple Data (SIMD) approach. This involves distributingthe data in a balanced way between different computing elements (or processing units) and each computing elementperforming the same operations on its associated subset of data. Our parallelization has been achieved using differentapproaches suitable for a variety of underlying hardware architectures and software environments. Figure 2 outlinesthe overall workflow of the parallelised Splotch algorithm.
The MPI library has been used to define the overall data and work distribution. Data are read in chunks of thesame (or similar) size by each processor in the MPI pool. Then the same work is performed for steps (b) and (c) oneach data chunk by the corresponding processor. The final image is generated and saved only by the root processor.This is, in fact, a light task, which does not require any kind of parallel implementation. The work accomplished insteps (b) and (c) can be further split, exploiting multicore shared memory processors or modern graphics boards, bymeans of an OpenMP based approach or exploitation of the CUDA programming environment.
These different parallel approaches can be used separately, if the available computing system fits only one of theavailable configurations, or jointly. For instance, on a single core PC with an NVIDIA graphics card, only the CUDAbased parallelization strategy can be activated and exploited. On a multicore RVN node both MPI and CUDA can beused. This makes our parallel Splotch code extremely flexible, portable, efficient and scalable. More details of ourparallel implementations are presented in the rest of this section. Test results are discussed in Section 4.
Z. Jin et al. / Procedia Computer Science 00 (2018) 1–10 5
3.1. MPI Implementation
Once the data is distributed among the processors, all the remaining operations are performed locally and furthercommunication is not needed, until the generation of the final display. Each MPI process uses the assigned data toproduce its own partial image. At the end, all the partial contributions are merged by means of a collective reductionoperation producing the final image. As the data load stage is the crucial step for balancing the overall workload andfast reading data from the disk, we paid specific attention to efficient implementation of this functionality.
The adoption of MPI I/O based functions represents the ideal solution for obtaining a high-performance, scalabledata input utility. With this approach each process has a different view of individual files. that allows simultaneous andcollective writing/reading of non-contiguous interleaved data. Our implementation assumes that data are organizedin the input file according to a block structure, where each block contains a single information for all N particles.Therefore we have as many contiguous blocks as the number n of properties given for each particle, and we can seethem as a 2-dimensional array A of n × N float elements. Then, we have defined the MPI I/O filetype as a simple2-dimensional subarray of A of size n × N/nprocs.
To support high performance computing environments where MPI I/O is not available, we have also provided twostandard MPI binary readers based on standard fstream functions. Data to be read are equally distributed amongprocesses and each one reads simultaneously their own portion of data by a direct access operation. In all readers anendianness conversion is also performed if required.
3.2. CUDA Implementation
Nowadays Graphics Processing Units (GPUs) can offer a means of increased performance (often substantially)in the context of computationally intensive scientific applications by exploiting high speed underlying ALUs andstream data-parallel organization. The Compute Unified Device Architecture (CUDA) introduced by NVIDIA offersaccess to highly parallellized modern GPU architectures via a simplified C language interface. A thread on the GPUis extremely lightweight compared to CPU threads, so changing context among threads is not a costly operation.The minimum data chunks processed by a CUDA multiprocessor are numbers of threads (warps) handled in groupsas blocks and grids so that GPU-executed functions can exploit large numbers of threads. CUDA executes blockssequentially in case of limited hardware resources, but reverts to parallel execution for large numbers of processingunits. The resulting code can thus target simultaneously entry-level, high-end or even next-generation GPUs. Furtherdetails on CUDA can be found on [27].
As soon as data is loaded in the memory of each processing unit (defined as a multicore CPU together with abundle of associated GPUs), our CUDA approach can be combined with the MPI parallelization strategy outlinedin Section 3.1. At that point in fact, processing units can be regarded as completely independent of each other,and CUDA can be exploited by determining each parallel task based on a single particle, that is a single particle isprocessed and displayed by a single CUDA thread. The processing involves normalizing of some particle values. Thedisplaying involves transformation into screen coordinates, assigning of colours and rendering for determining screenareas affected by individual particles and subsequently combining them for final imaging.
The granularity during processing, transformation and colorization is more or less fixed among different particles.However during rendering it can vary considerably depending upon the number of screen pixels influenced by indi-vidual particles. As a worst case scenario consider two particles influencing all screen pixels and a single screen pixelrespectively. Assuming they are handled by the same warp (this is determined by CUDA automatically), they are thenscheduled to execute simultaneously. This unbalanced granularity can compromise significantly overall executiontimes.
To alleviate this situation we follow a ’split particles’ strategy dividing large computational tasks into smalleraverage ones. For any particle influencing a number of pixels that is larger than a threshold value, the relevantcomputational task is sub-divided into multiple ones, each associated with a subset of the original number of pixels.The threshold value can be determined in advance and given as input to Splotch. To our experience a thresholdclose to the average of the width and height of the display window works satisfactorily. A shortcoming of this is thecomputational cost when doing the splitting; for an increased number of particles more threads are required. Executionof the splitting algorithm and memory copying among host and device involve additional costs. Nevertheless ourresults demonstrate improved timings (see Table 2). The pseudo-code below summarizes the overall workflow of ourCUDA paralellization approach.
Z. Jin et al. / Procedia Computer Science 00 (2018) 1–10 6
while ( not all particles are rendered )
{
find subset S(i) of particle array;
A: call device to render S(i);
if ( S(i) is not first subset )
{
B: combine with F(i-1), the output of S(i-1) in fragment buffer;
}
C: copy fragment buffer from device to host;
if ( S(i) is the last subset )
{
combine with F(i);
}
i++;
}
The instruction A is the render computation executed on the graphics board in parallel with execution of instructionB, while the combination operation is carried out by the CPU. The results of A and B are merged by instruction C. Ourtest results indicate that overall times required for performing combination operations are mostly contained within thetimes demanded by render computations.
4. Benchmarks
The parallelized Splotch code has been tested on low-end and high-end hardware architectures using several testdata sets in order to investigate applicability of different parallelization approaches.
Exploiting the high portability of our code we could perform our tests on a 5000 cores UNIX-AIX SP6 system(referred to as SP6) and a Windows XP PC (referred to as Win). The SP6 system is a cluster of 168 Power6 575computing nodes with 32 cores and a memory of 128 Gigabytes per node. The Win system is an Intel Xeon X54823.2 GHz CPU with two NVIDIA Quadro FX 5600 graphics boards. Our target was to test parallelized versions ofSplotch on computing systems of different sizes and target applications, from a standard PC, where small to mediumdata sets can be used, up to high performance platforms for handling very large data sets.
We used several benchmark data sets for our testing. The first few data sets are derived from a cosmological N-Body simulation of more than 850 million particles characterized by spatial information together with velocities, massdensity and smoothing length, for defining the size of the region influenced by the properties of each particle whendeploying Splotch. We randomly extracted data sets containing 1, 10 and 100 million particles. These are indicatedas 1M, 10M and 100M tests. We also employed the data set 850M containing the entire simulation. Such varietyof data set sizes is required to match the memory available on the different computing systems used for our testing.Our most challenging data set comes from the Millennium II simulation [3] and consists of 10 billion particles. Thedata files employed are pure binaries organized in such a way that different quantitites are stored consecutively (e.g. xcoordinates of all particles, then y coordinates and so on) as expected by the MPII/O based reader.
We provide a rough estimate of the errors associated with our measures only for the Millennium Run (the mostchallenging). The benchmarks, in fact, were performed on production systems, where random fluctuations in theworkload can affect the results. This is expecially true for I/O, which is shared between a number of users and jobs.Therefore, we chose to present the best performance obtained in each test, focusing on the scalability of the code,more than on the absolute result. Anyway, the sample error bars presented in Figure 5, show that the performance hasnegligible fluctuations, slightly larger, as expected, for the I/O operations.
4.1. MPI Benchmarks
Our test results on the SP6 platform for data sets 100M and 850M are presented in Figure 3. Power6 cores canschedule for execution two processes (or threads) in the same clock cycle, and it is also possible to use a single coreas two virtual CPUs. This mode of Power6 is called Simultaneous Multi-Threading (SMT), to distinguish it from the
Z. Jin et al. / Procedia Computer Science 00 (2018) 1–10 7
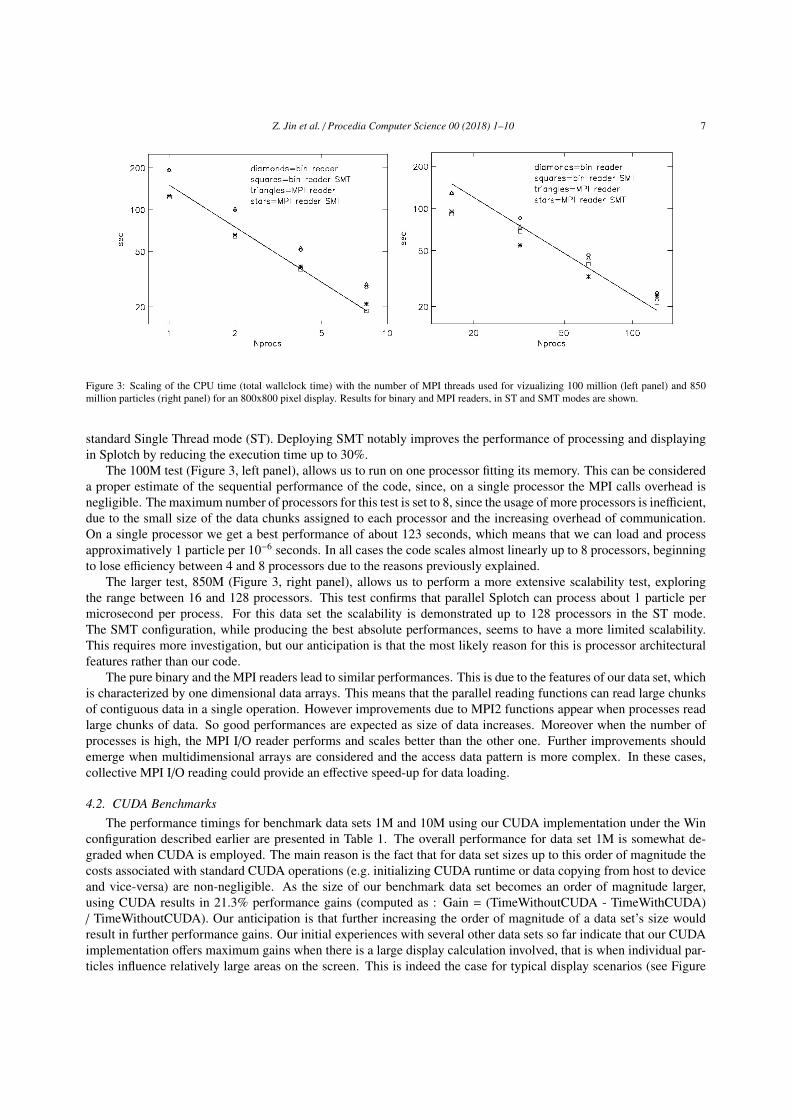
Figure 3: Scaling of the CPU time (total wallclock time) with the number of MPI threads used for vizualizing 100 million (left panel) and 850million particles (right panel) for an 800x800 pixel display. Results for binary and MPI readers, in ST and SMT modes are shown.
standard Single Thread mode (ST). Deploying SMT notably improves the performance of processing and displayingin Splotch by reducing the execution time up to 30%.
The 100M test (Figure 3, left panel), allows us to run on one processor fitting its memory. This can be considereda proper estimate of the sequential performance of the code, since, on a single processor the MPI calls overhead isnegligible. The maximum number of processors for this test is set to 8, since the usage of more processors is inefficient,due to the small size of the data chunks assigned to each processor and the increasing overhead of communication.On a single processor we get a best performance of about 123 seconds, which means that we can load and processapproximatively 1 particle per 10−6 seconds. In all cases the code scales almost linearly up to 8 processors, beginningto lose efficiency between 4 and 8 processors due to the reasons previously explained.
The larger test, 850M (Figure 3, right panel), allows us to perform a more extensive scalability test, exploringthe range between 16 and 128 processors. This test confirms that parallel Splotch can process about 1 particle permicrosecond per process. For this data set the scalability is demonstrated up to 128 processors in the ST mode.The SMT configuration, while producing the best absolute performances, seems to have a more limited scalability.This requires more investigation, but our anticipation is that the most likely reason for this is processor architecturalfeatures rather than our code.
The pure binary and the MPI readers lead to similar performances. This is due to the features of our data set, whichis characterized by one dimensional data arrays. This means that the parallel reading functions can read large chunksof contiguous data in a single operation. However improvements due to MPI2 functions appear when processes readlarge chunks of data. So good performances are expected as size of data increases. Moreover when the number ofprocesses is high, the MPI I/O reader performs and scales better than the other one. Further improvements shouldemerge when multidimensional arrays are considered and the access data pattern is more complex. In these cases,collective MPI I/O reading could provide an effective speed-up for data loading.
4.2. CUDA BenchmarksThe performance timings for benchmark data sets 1M and 10M using our CUDA implementation under the Win
configuration described earlier are presented in Table 1. The overall performance for data set 1M is somewhat de-graded when CUDA is employed. The main reason is the fact that for data set sizes up to this order of magnitude thecosts associated with standard CUDA operations (e.g. initializing CUDA runtime or data copying from host to deviceand vice-versa) are non-negligible. As the size of our benchmark data set becomes an order of magnitude larger,using CUDA results in 21.3% performance gains (computed as : Gain = (TimeWithoutCUDA - TimeWithCUDA)/ TimeWithoutCUDA). Our anticipation is that further increasing the order of magnitude of a data set’s size wouldresult in further performance gains. Our initial experiences with several other data sets so far indicate that our CUDAimplementation offers maximum gains when there is a large display calculation involved, that is when individual par-ticles influence relatively large areas on the screen. This is indeed the case for typical display scenarios (see Figure
Z. Jin et al. / Procedia Computer Science 00 (2018) 1–10 8
Table 1: The performance timings (secs) obtained with our CUDA implementation of Splotch (indicated by yes) compared to timings obtainedusing the standard sequential implementation of Splotch (indicated by no) for benchmark data sets 1M and 10M.
Table 2: The performance timings (secs) obtained with our CUDA implementation of Splotch. The number of particles in the data sets employedfor our experimental results is 370,852 (small), 2,646,991 (medium) and 16,202,527 (large) respectively.
CPU GPUdata set disp. t. tot. t. disp. t. tot. t. disp. t. no splitsmall 12.6419 13.0144 7.3885 7.7668 12.4894medium 18.5443 19.7190 11.3855 12.7118 16.6905large 31.8976 39.3234 19.7792 27.0321 24.6305
4). Table 2 shows that our CUDA parallelization improves the performance of Splotch. The ’split particles’ strategy(see Section 3.2) further improves performance timings.
4.3. Millennium II Visualization
The visualization of the outputs of the Millennium II simulation [3] represents our most challenging benchmarkas it requires the processing of 10 billion particles simultaneously. To do this at least 300 Gigabytes of memory arenecessary, only available on HPC platforms such as the SP6 system. In our performance results we have used thefinal output of the simulation, producing high resolution images of 3200x3200 pixels. A minimum number of 128processors is necessary to process the entire data set.
For this benchmark, we could not use our MPI reader, due to a serious limitation related to the MPI I/O API(usage of 32 bits counters which do not allow us to handle the large-scale data sets of the Millennium). We will workto overcome this problem in the future versions of Splotch. At the moment, we used instead the built-in parallel readerderived by the original Gadget 2 code (used for the simulation - [28]), which allows to access directly data files asthey where saved by the simulation code.
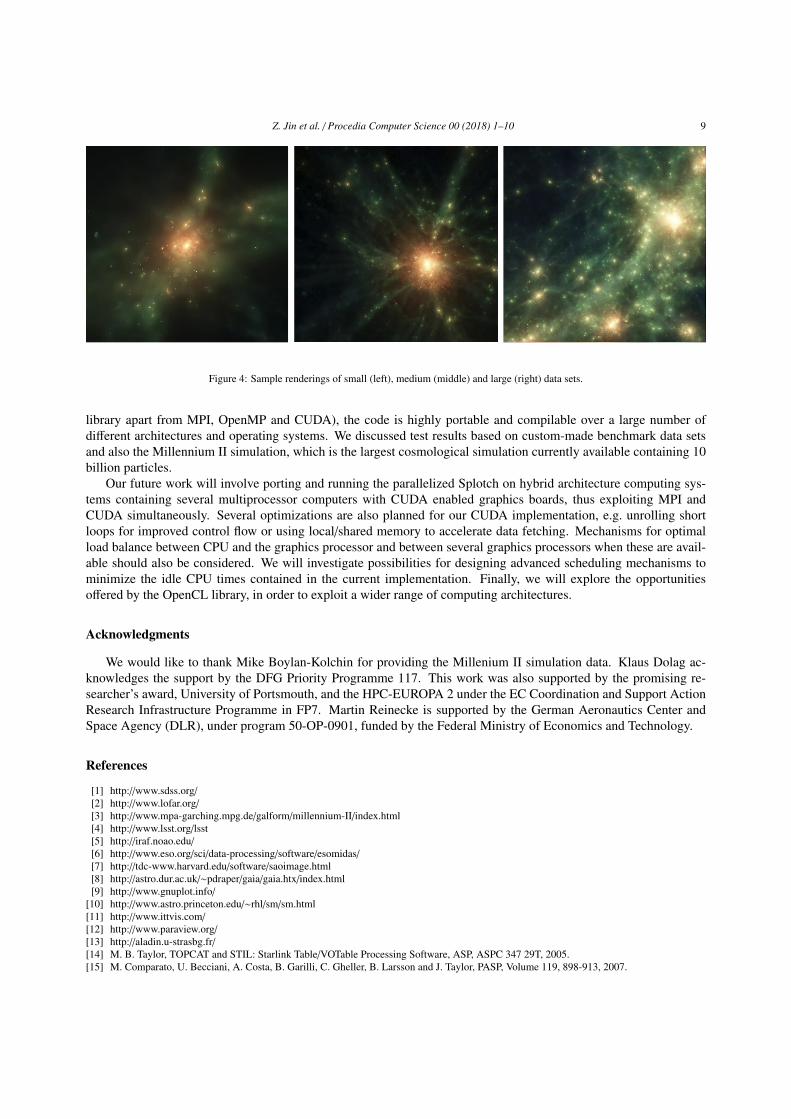
Examples of the Millennium II simulation rendered images are shown in Figure 1. In Figure 5, we present theresults of the benchmarks, in ST and SMT modes. The left panel shows the data processing time from 128 to 2048MPI processes in ST mode and from 256 to 4096 threads for SMT. The right panel shows instead the data readtime, using the Gadget 2 reader. In this case, the read process is performed by a subset of processors, belonging toa dedicated MPI sub-communicator, which then scatters the loaded data to the complete processors pool. The testsconfirm the scalability properties of the code even when a large number of threads is used. The reader’s curve tends toflatten toward 100 processors, achieving the physical bandwidth limit of the underlying GPFS based storage system.
5. Summary and Future Developments
In this paper we have described a high performance parallel implementation of Splotch able to execute on avariety of high performance computing architectures. This is due to its hybrid nature exploiting multi-processorsystems adopting an MPI based approach, multi-core shared memory processors exploiting OpenMP, and modernCUDA enabled graphics boards. This allows to achieve extremely high performance overcoming the typical memorybarriers posed by small personal computing systems, commonly adopted for visualization. Finally, as parallel Splotchis implemented in ISO C++ and is completely self-contained (in other words it does not require any complementary
Z. Jin et al. / Procedia Computer Science 00 (2018) 1–10 9
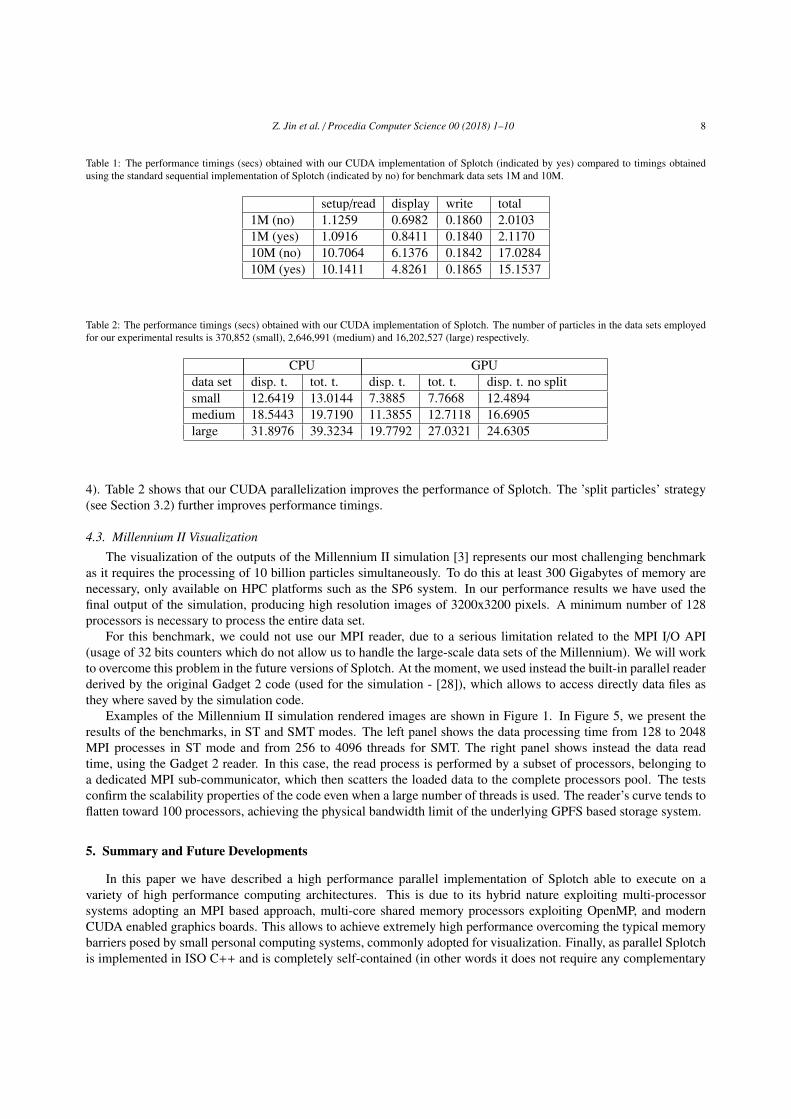
Figure 4: Sample renderings of small (left), medium (middle) and large (right) data sets.
library apart from MPI, OpenMP and CUDA), the code is highly portable and compilable over a large number ofdifferent architectures and operating systems. We discussed test results based on custom-made benchmark data setsand also the Millennium II simulation, which is the largest cosmological simulation currently available containing 10billion particles.
Our future work will involve porting and running the parallelized Splotch on hybrid architecture computing sys-tems containing several multiprocessor computers with CUDA enabled graphics boards, thus exploiting MPI andCUDA simultaneously. Several optimizations are also planned for our CUDA implementation, e.g. unrolling shortloops for improved control flow or using local/shared memory to accelerate data fetching. Mechanisms for optimalload balance between CPU and the graphics processor and between several graphics processors when these are avail-able should also be considered. We will investigate possibilities for designing advanced scheduling mechanisms tominimize the idle CPU times contained in the current implementation. Finally, we will explore the opportunitiesoffered by the OpenCL library, in order to exploit a wider range of computing architectures.
Acknowledgments
We would like to thank Mike Boylan-Kolchin for providing the Millenium II simulation data. Klaus Dolag ac-knowledges the support by the DFG Priority Programme 117. This work was also supported by the promising re-searcher’s award, University of Portsmouth, and the HPC-EUROPA 2 under the EC Coordination and Support ActionResearch Infrastructure Programme in FP7. Martin Reinecke is supported by the German Aeronautics Center andSpace Agency (DLR), under program 50-OP-0901, funded by the Federal Ministry of Economics and Technology.
[13] http://aladin.u-strasbg.fr/[14] M. B. Taylor, TOPCAT and STIL: Starlink Table/VOTable Processing Software, ASP, ASPC 347 29T, 2005.[15] M. Comparato, U. Becciani, A. Costa, B. Garilli, C. Gheller, B. Larsson and J. Taylor, PASP, Volume 119, 898-913, 2007.
Z. Jin et al. / Procedia Computer Science 00 (2018) 1–10 10
Figure 5: Scaling of the CPU time with the number of MPI threads used for the Millennium II simulation data. The left panel shows the totalwallclock time minus the time needed for reading, the right panel the read-data time. The dashed line indicates the expectation for an idealscaling. The diamonds represent runs in ST mode, the triangles indicate the SMT configuration. The 128 processors point shows also the error bar,calculated as the variance of 13 repeated realizations. The processing time error is extremely small and the error bar is within the data point.
[16] U. Becciani, A. Costa, V. Antonnuccio-Delogu, G. Caniglia, M. Comparato, C, Gheller, Z. Jin, M. Krokos, P. Massimino, PASP, Volume 122,119-130, 2010
[17] M. A. Borkin, N. A. Ridge, A. A. Goodman and M. Halle, astro-ph/0506604, 2005.[18] http://users.monash.edu.au/∼dprice/splash/index.html[19] https://wci.llnl.gov/codes/visit/[20] K.Dolag, M. Reinecke, C.Gheller, S. Imboden, New Journal of Physics, Volume 10, Issue 12, pp. 125006, 2008.[21] R. Fraedrich, J. Schneider, R. Westermann, IEEE Transactions on Visualization and Computer Graphics, vol. 15, no. 6, pp. 1251-1258,
Nov./Dec. 2009, doi:10.1109/TVCG.2009.142[22] T. Szalay, V. Springel and G. Lemson, http://arxiv.org/abs/0811.2055, 2008[23] http://www.mpi-forum.org/
[24] http://www.Nvidia.com/object/cuda home.html[25] J. Monaghan and J. Lattanzio, A&A, 149, 135, 1985[26] Physics of Astrophysics: Volume I Radiation, Shu F., 1991, Published by University Science Books, 648 Broadway, Suite 902, New York,
NY 10012[27] NVIDIA CUDA Programming Guide, Version 2.1 Beta, 10/23/2008, http://www.Nvidia.com[28] Springel V 2005 Monthly Notices of the Royal Astronomical Society 364, 1105-1134