Page 1
High Performance, Federated,
Service-Oriented Geographic Information
Systems
Ahmet Sayar
Submitted to the faculty of the University Graduate School
in partial fulfillment of the requirements
for the degree
Doctor of Philosophy
in the Department of Computer Science,
Indiana University
February 2009
Page 2
ii
Accepted by the Graduate Faculty, Indiana University, in partial fulfillment of the
requirements for the degree of Doctor of Philosophy.
Doctoral Committee ________________________________
Prof. Geoffrey C. Fox (Principal Advisor)
________________________________
Prof. Randall Bramley
________________________________
Prof. Kay Connelly
________________________________
Prof. Yuqing (Melanie) Wu
February 2, 2009
Page 3
iii
© 2009
AHMET SAYAR
ALL RIGHTS RESERVED
Page 4
iv
Acknowledgements
This dissertation has been achieved with the encouragement, support, and
assistance I received from many remarkable people. I would like to offer my sincere
gratitude to them.
First of all, I would like to thank my advisor Prof. Geoffrey C. Fox for his
support, guidance and an exceptional research environment provided by him along the
way of this endeavor. I deeply appreciate how much he contributed with his keen insight
and extensive experience. His advice was always invaluable contribution to my academic
life.
I would also like to thank the members of the research committee for generously
offering time, support, guidance and good will throughout the preparation and review of
this dissertation. I am very thankful to Prof. Randall Bramley for his suggestions and
remarkable inspiration, Prof. Kay Connelly and Prof. Yuqing (Melanie) Wu for their
constructive comments, kindnesses and keen intellects.
I want to thank all members of Community Grids Lab for the priceless moments
that we shared together. I have had great pleasure of working with these wonderful
people. I particularly thank Dr. Marlon Pierce for his supports and productive discussions
on various aspects of my research.
Finally, I am especially grateful to my family and friends for their contributions
throughout my graduate studies. I have received wonderful support from my daughter
Page 5
v
Ayse Nazli, my parents, Mehmet and Semiha, my sisters, Selma, Zeynep and Hatice.
Their constant love and encouragement were invaluable. Their belief and generosity are
most profoundly acknowledged here.
Page 6
vi
Abstract
Geographic information is critical for many earth related geo-science applications
such as building disaster planning, crisis management, early-warning systems and urban
planning. Decision making in Geographic Information Systems (GIS) increasingly relies
on analyses of spatial data in map-based formats. Maps are complex structures composed
of layers created from distributed heterogeneous data belonging to the separate
organizations. This thesis presents a distributed service architecture for managing the
production of knowledge from distributed collections of archived observations and
simulation data through integrated data-views. Integrated views are defined by a
federation service (“federator”) located on top of the standard service components.
Common GIS standards enable the construction of this system. However, compliance
requirements for interoperability, such as XML-encoded data and domain specific data
characteristics, have costs and performance overhead. We investigate issues of combining
standard compliance with performance. Although our framework is designed for GIS, we
extend the principles and requirements to general science domains and discuss how these
may be applied.
Page 7
vii
TABLE OF CONTENTS
CHAPTER 1 INTRODUCTION .................................................................................. 1
1.1. Motivation ............................................................................................................ 2
1.2. Why Federation .................................................................................................... 4
1.3. Research Issues .................................................................................................... 7
1.4. Organization of Dissertation .............................................................................. 11
CHAPTER 2 LITERATURE SURVEY .................................................................... 13
2.1. Background ........................................................................................................ 13
2.1.1. Geographic Information Systems (GIS) ..................................................... 13
2.1.2. Open GIS Standards and GIS Web Services .............................................. 16
2.2. Related Works .................................................................................................... 20
2.2.1. Linked Environments for Atmospheric Discovery (LEAD) ....................... 20
2.2.2. Geosciences Network (GEON) ................................................................... 21
2.2.3. Laboratory for Advanced Information Technology and Standards (LAITS):
22
CHAPTER 3 GIS WEB SERVICE DATA-GRID COMPONENTS ......................... 25
3.1. Geo-data and Common Data Models ................................................................. 26
3.2. Web Service Extensions to Standard Service Definitions ................................. 29
3.3. System Framework and Web-Service Components ........................................... 32
3.3.1. Web Feature Service ................................................................................... 33
3.3.2. Web Map Service ........................................................................................ 38
3.3.2.1. GetCapabilities Services....................................................................... 39
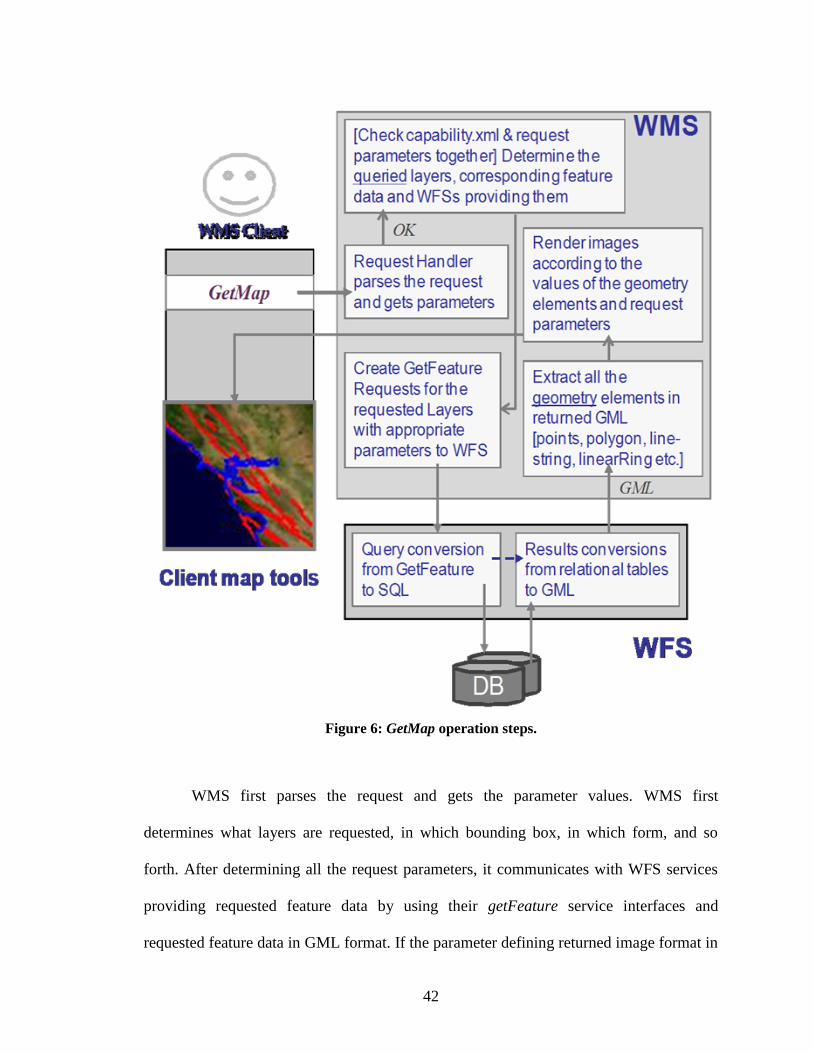
3.3.2.2. GetMap Services .................................................................................. 41
3.3.2.3. GetFeatureInfo Services ....................................................................... 47
3.3.3. Browser event-based Interactive Map Client Tools.................................... 53
3.3.3.1. Integration of AJAX approach to GIS Web Service Invocations ........ 59
3.3.3.2. AJAX & Web Services Synchronization Framework .......................... 61
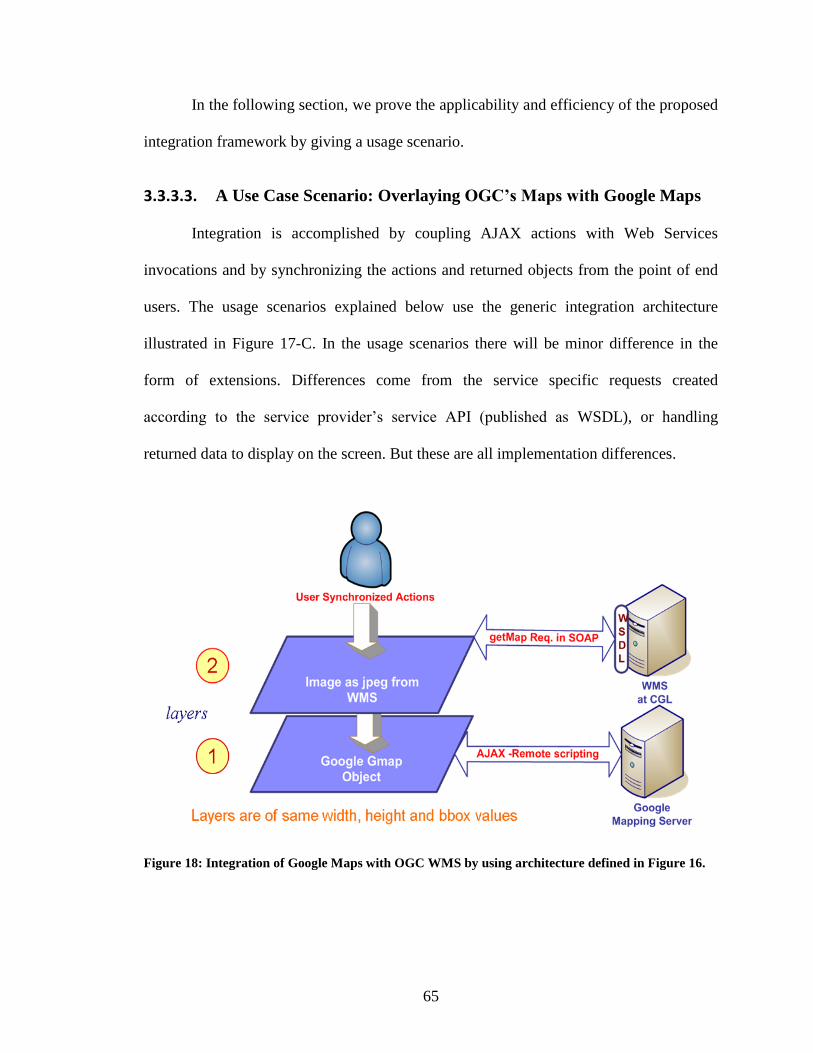
3.3.3.3. A Use Case Scenario: Overlaying OGC‟s Maps with Google Maps ... 65
Page 8
viii
CHAPTER 4 FINE-GRAINED FEDERATION OF GIS WEB-SERVICE
COMPONENTS ................................................................................... 68
4.1. Geo-Data and integrated data views................................................................... 70
4.1.1. Hierarchical Data Definition and Multi-layer Maps ........................................ 74
4.2. Federation Framework ........................................................................................... 75
4.3. Service Federation through Capability Aggregation .............................................. 79
4.3.1. Extending WMS as a Federator Service .......................................................... 80
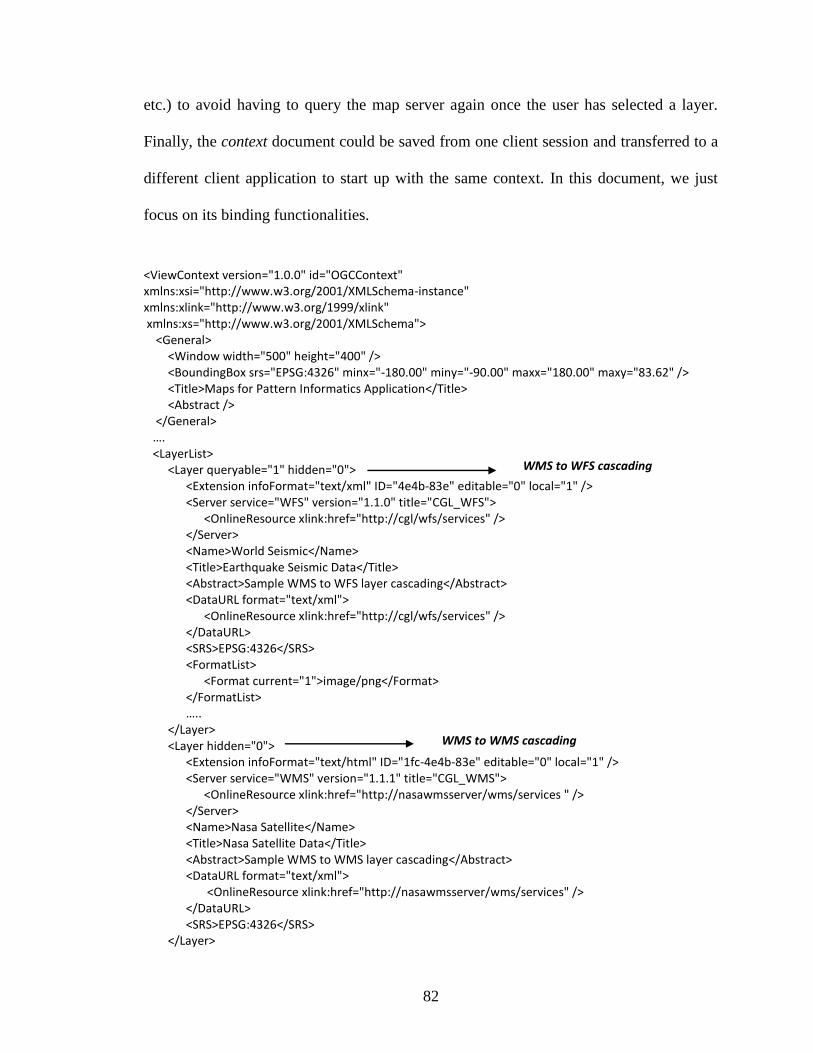
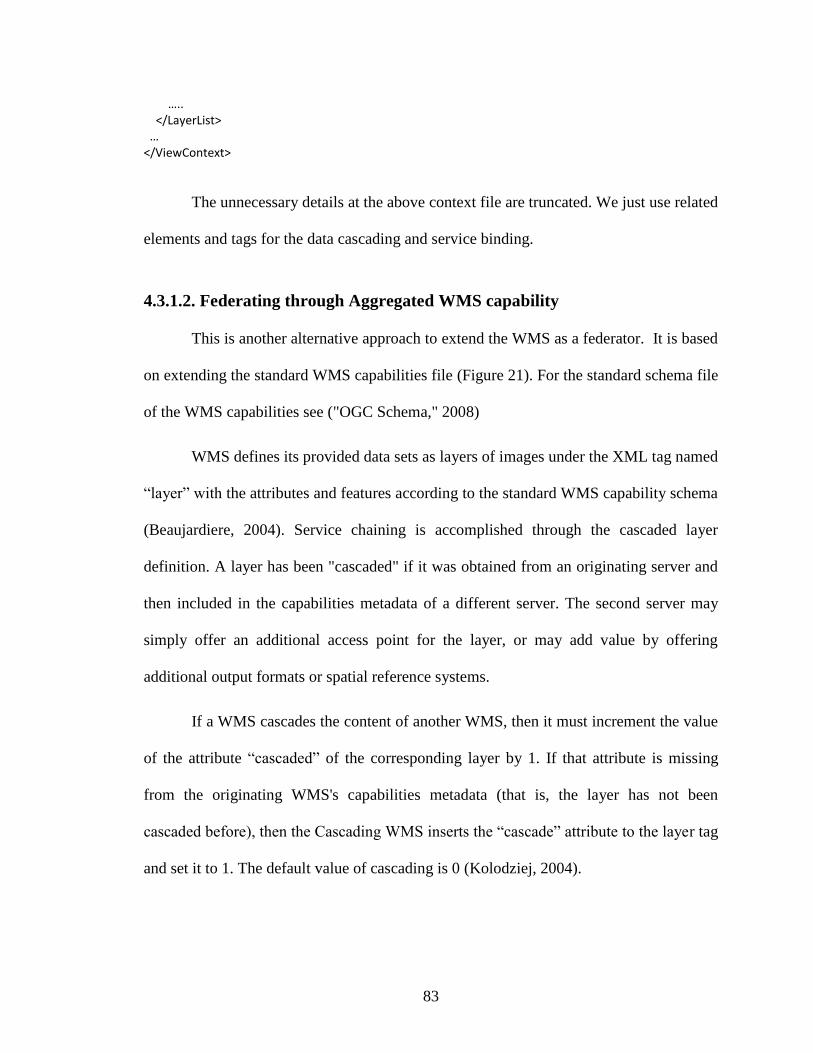
4.3.1.1. Federating through Context Document:.................................................... 81
4.3.1.2. Federating through Aggregated WMS capability ..................................... 83
CHAPTER 5 APPLICATIONS OF THE FEDERATION FRAMEWORK.............. 88
5.1. The National Infrastructure Simulation and Analysis Center (NISAC) ............ 89
5.2. Pattern Informatics (PI), Earthquake Science .................................................... 96
5.3. Virtual California (VC), Earthquake Science .................................................. 103
CHAPTER 6 HIGH-PERFORMANCE SUPPORT IN INTEROPERABLE GEO-
DATA RENDERING ......................................................................... 108
6.1. General Performance Issues ............................................................................. 109
6.1.1. Distributed Nature of Data ........................................................................ 109
6.1.2. Interoperability Cost – Common Data Model .......................................... 110
6.1.3. Tough Data Characteristics ....................................................................... 111
6.2. Extending OGC Standards with Streaming Data Transfer Capabilities .......... 112
6.3. Application of Pull Technique for GML Parsing and Rendering .................... 118
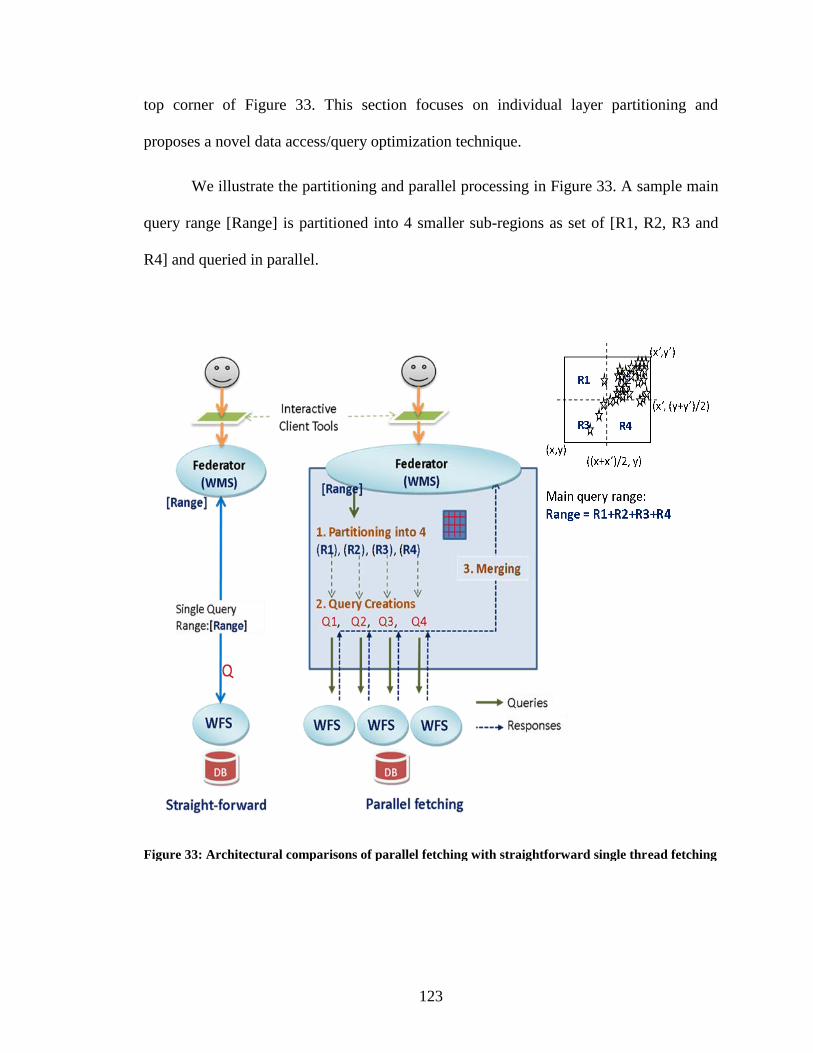
6.4. Adaptive load-balancing and Parallel Query Optimization ............................. 122
6.4.1. Problem Definition.................................................................................... 124
6.4.2. Workload Estimation Table for Two-dim Range Queries ........................ 125
6.4.3. Utilizing WT for Range Query Optimization ........................................... 130
6.4.4. Performance Evaluation ............................................................................ 134
6.5. Just-in-time Map Rendering ............................................................................. 139
6.6. Overall System Evaluation ............................................................................... 143
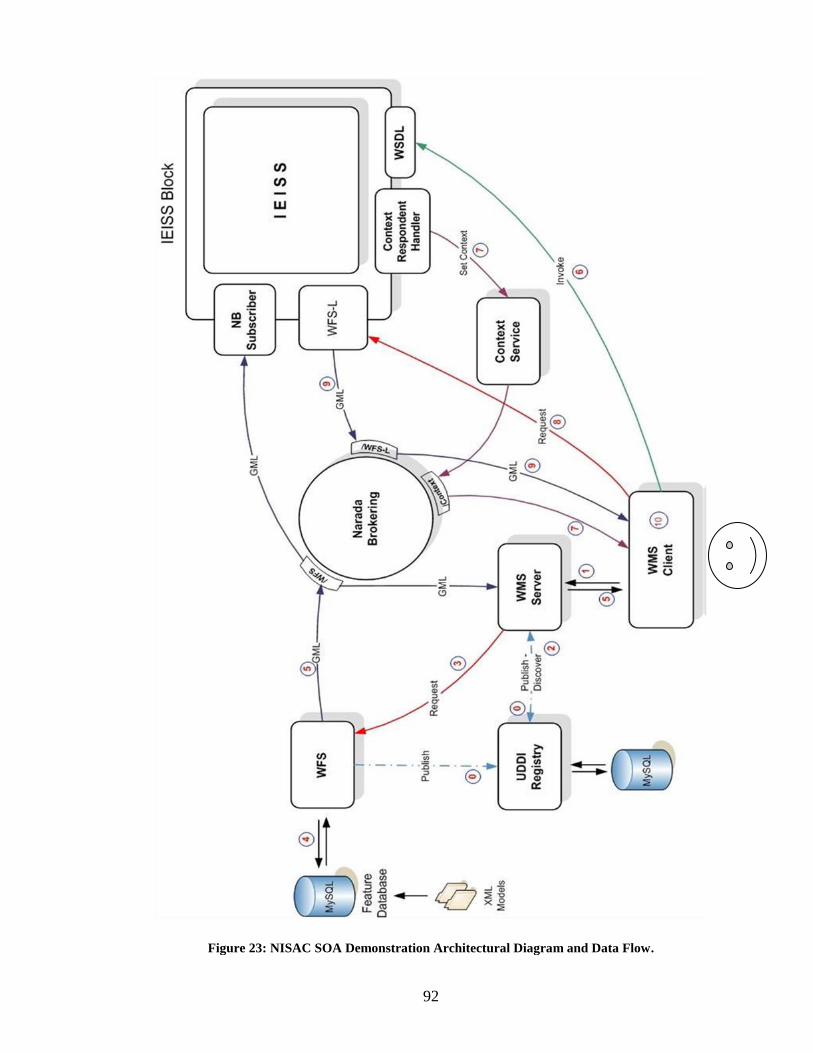
6.6.1. Data and Process Flow .............................................................................. 143
6.6.2. Test Case Scenario .................................................................................... 145
Page 9
ix
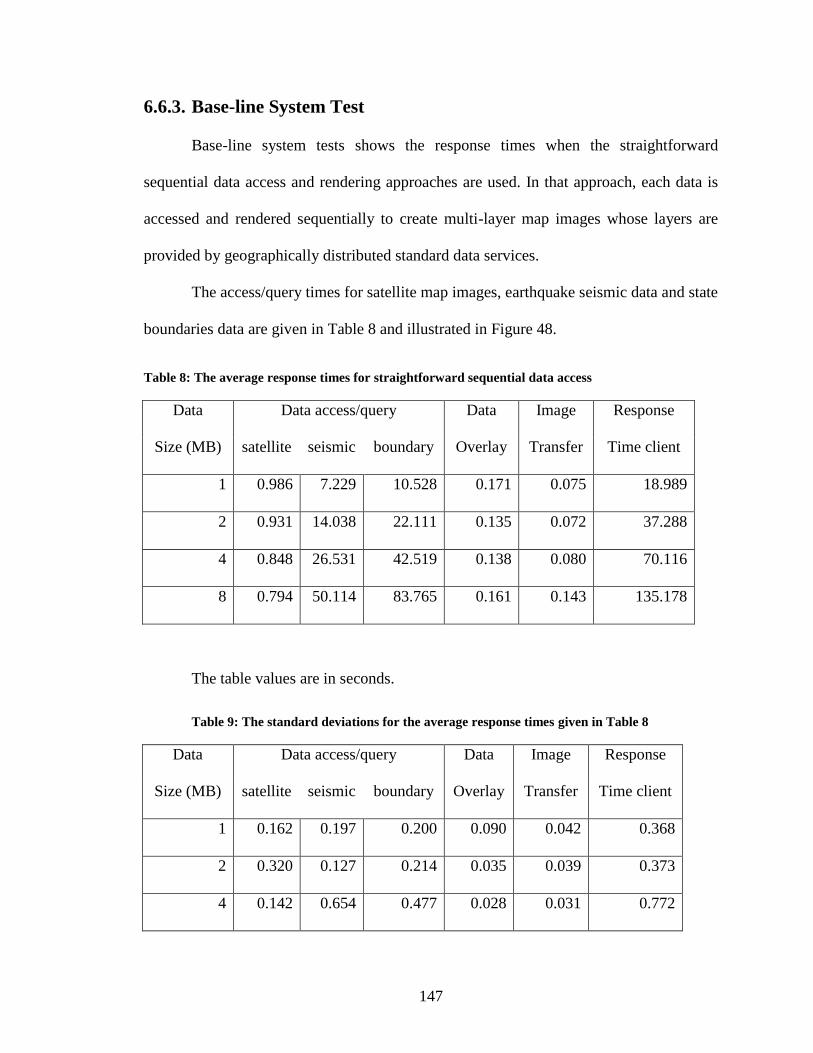
6.6.3. Base-line System Test ............................................................................... 147
6.6.4. Performance Enhancement with Federation and Parallel Query
Optimization through WT tables ............................................................................. 149
CHAPTER 7 ABSTRACTION OF THE FRAMEWORK FOR THE GENERAL
DOMAINS ......................................................................................... 157
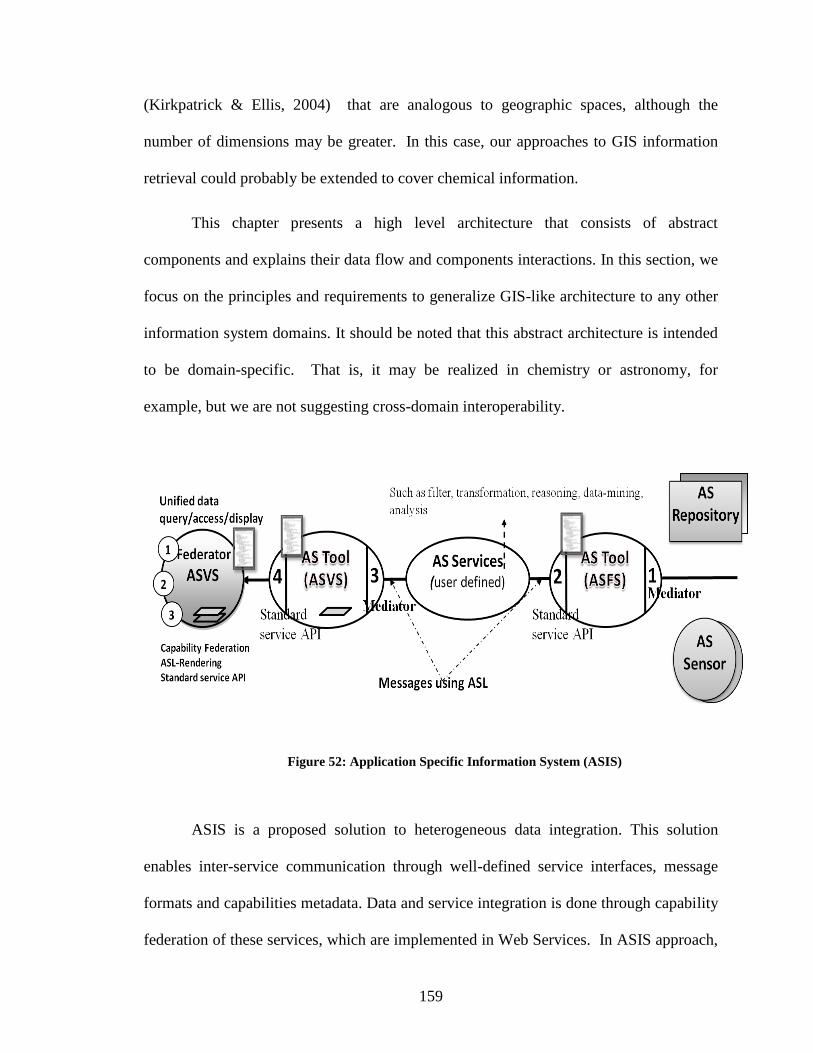
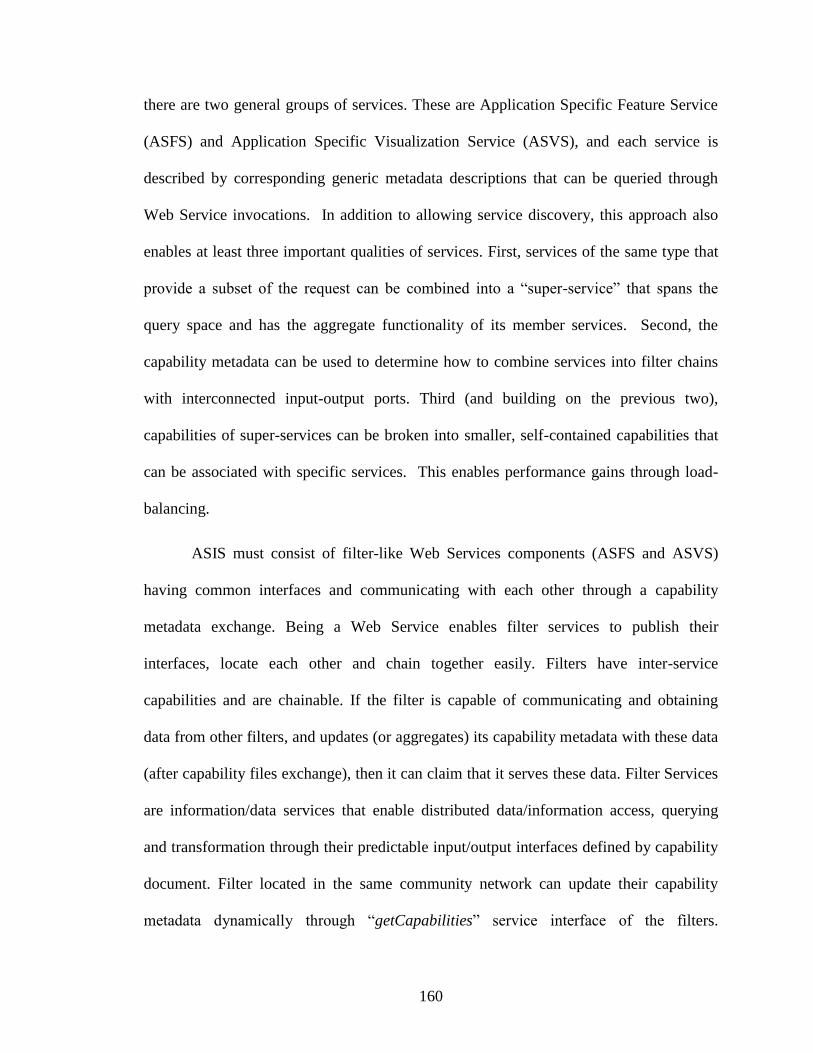
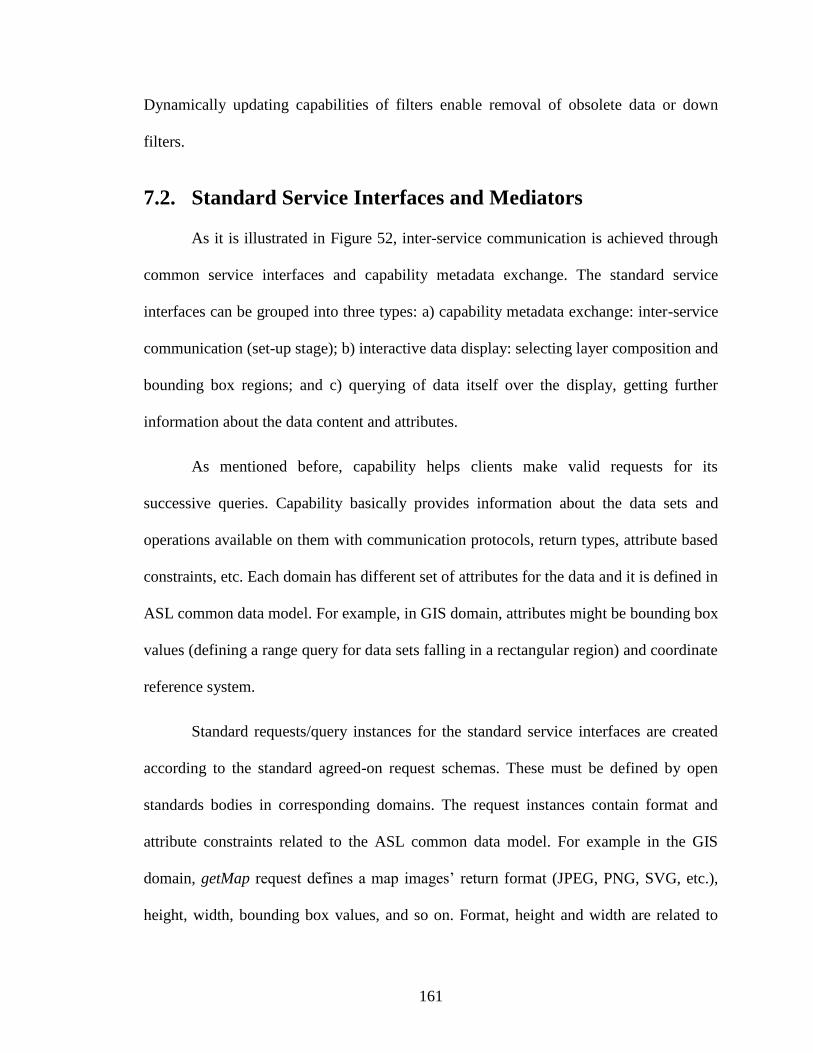
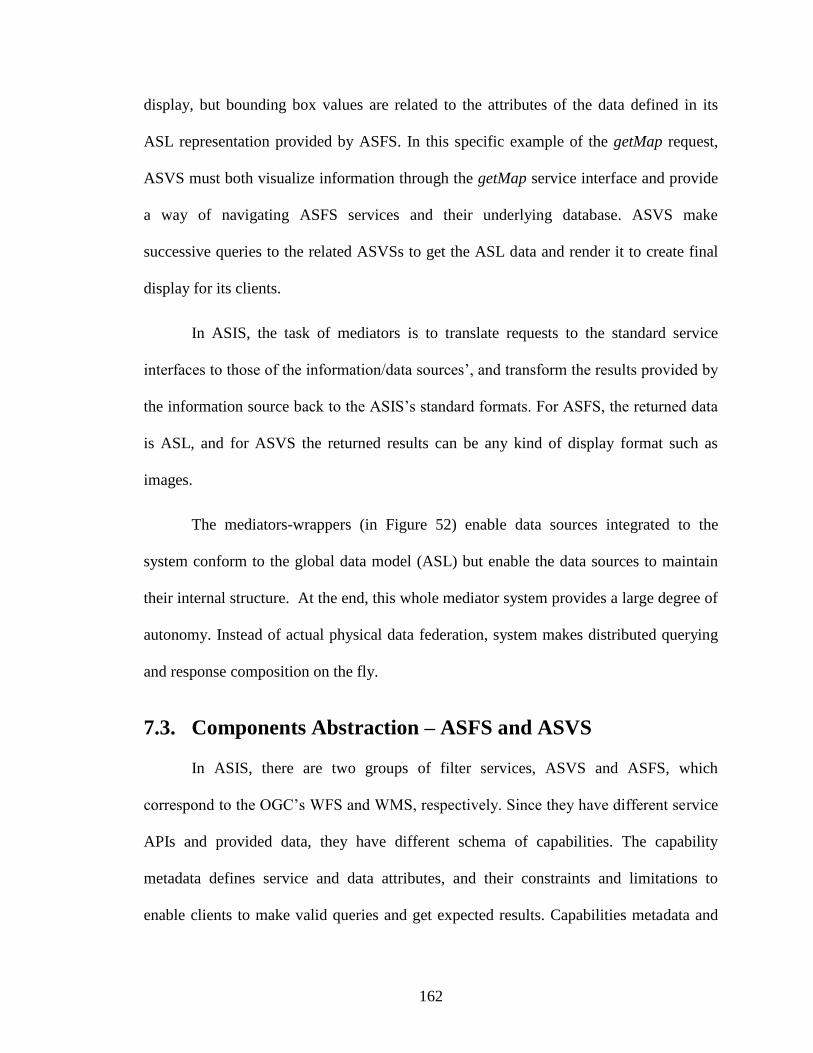
7.1. Generalization Framework ............................................................................... 158
7.2. Standard Service Interfaces and Mediators ...................................................... 161
7.3. Components Abstraction – ASFS and ASVS .................................................. 162
CHAPTER 8 CONCLUSION AND FUTURE WORK ........................................... 165
8.1. Summary and Conclusions ............................................................................... 165
8.2. Summary of Answers to Research Questions .................................................. 168
8.3. Future Research Directions .............................................................................. 173
APPENDICES
APPENDIX A: Sample Request Instances to standard WMS Service Interfaces .... 176
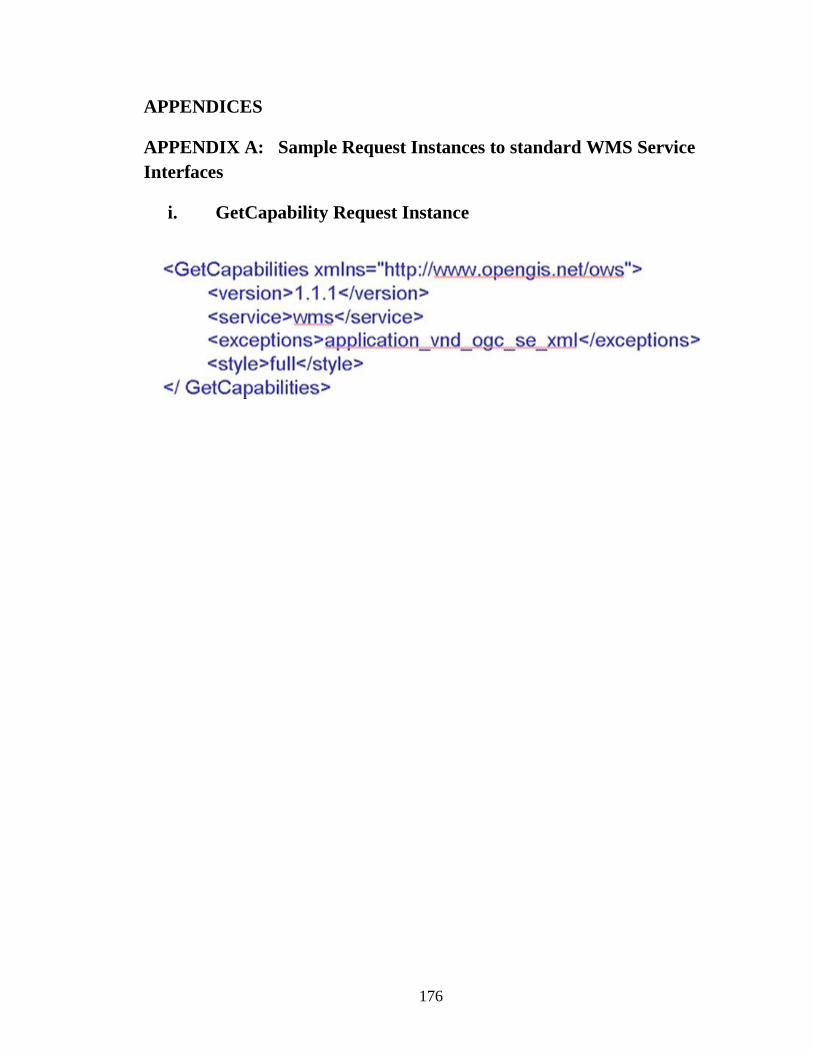
i. GetCapability Request Instance ....................................................................... 176
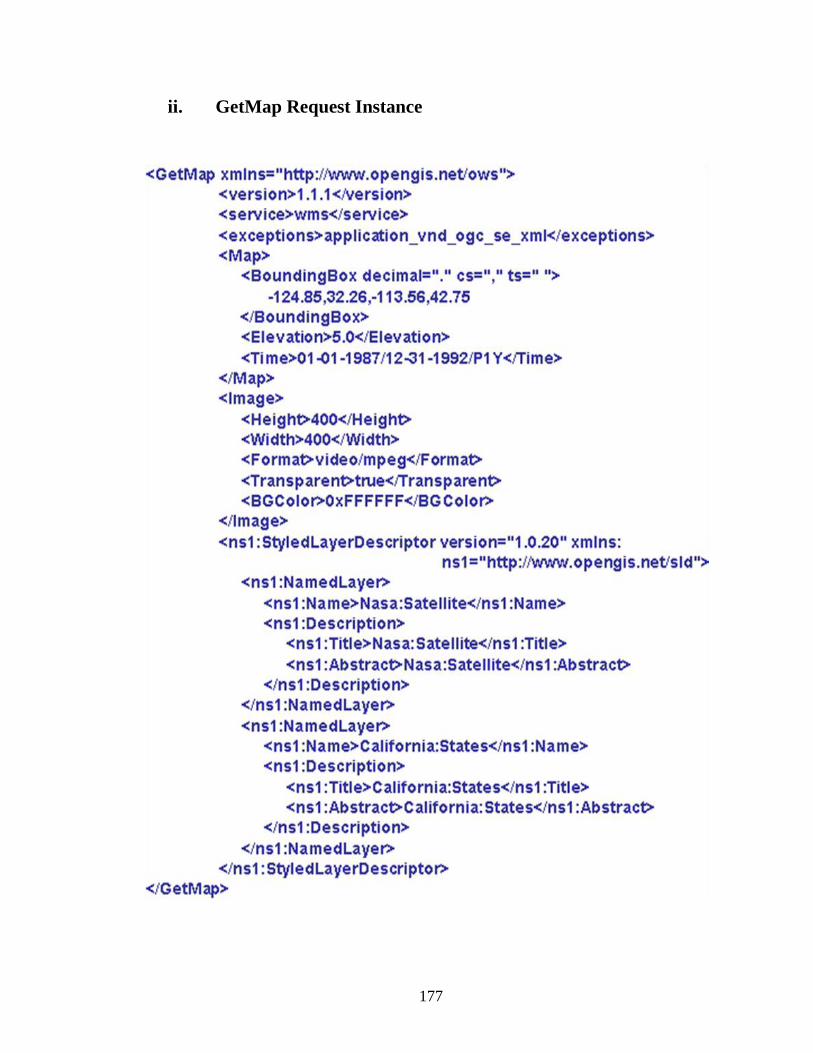
ii. GetMap Request Instance................................................................................. 177
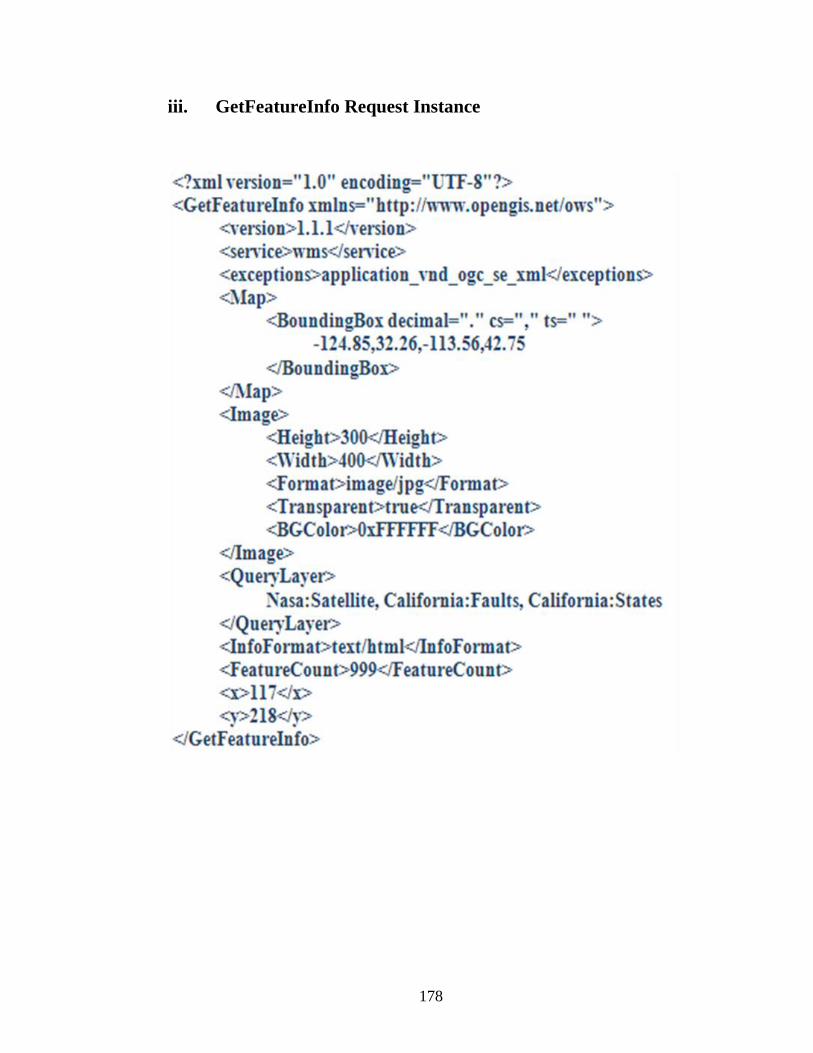
iii. GetFeatureInfo Request Instance ..................................................................... 178
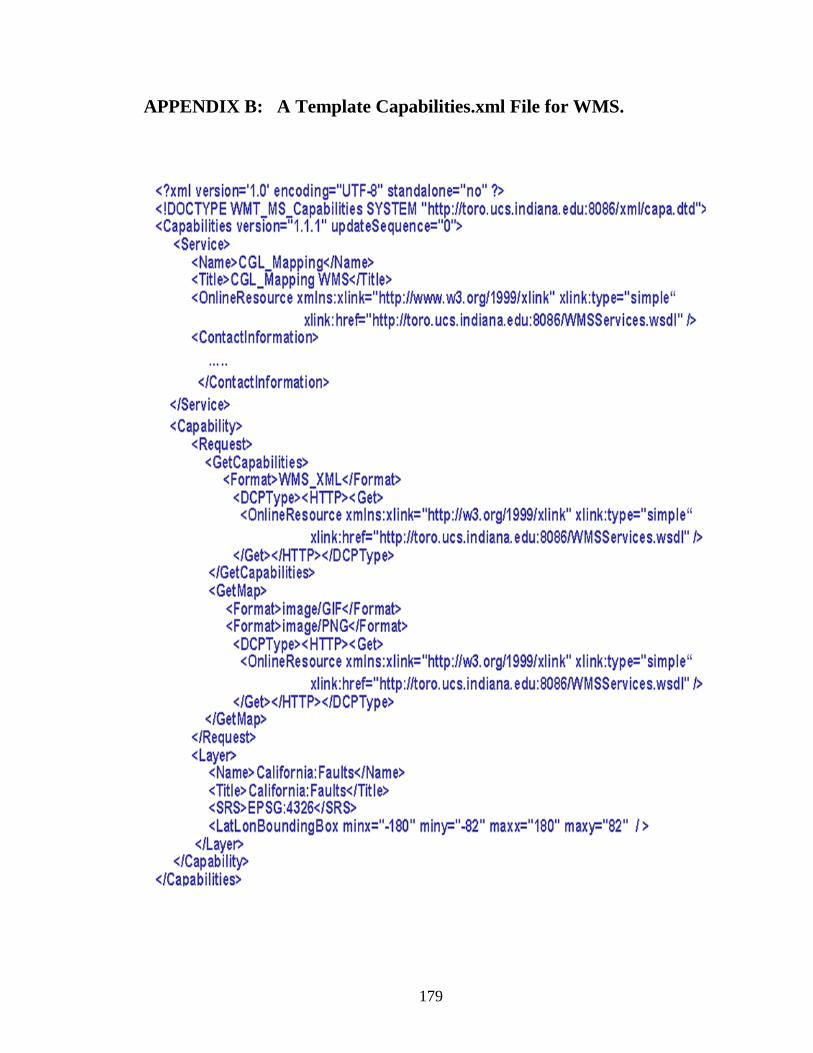
APPENDIX B: A Template Capabilities.xml File for WMS. .................................. 179
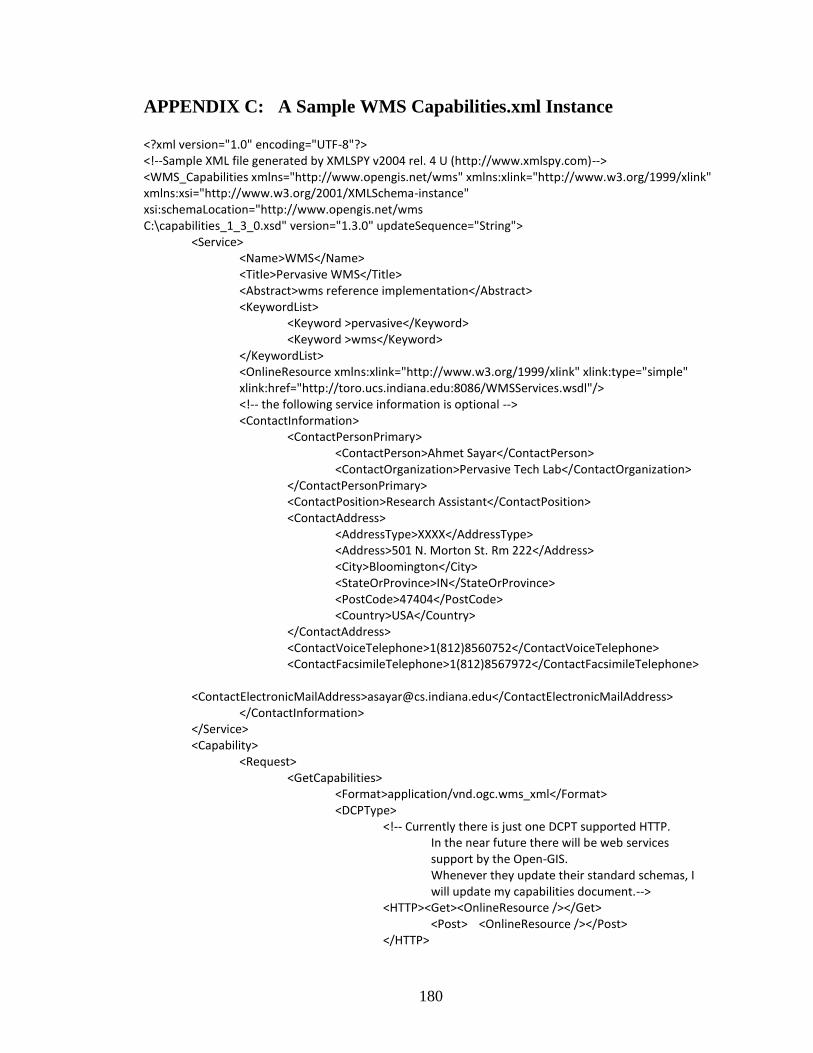
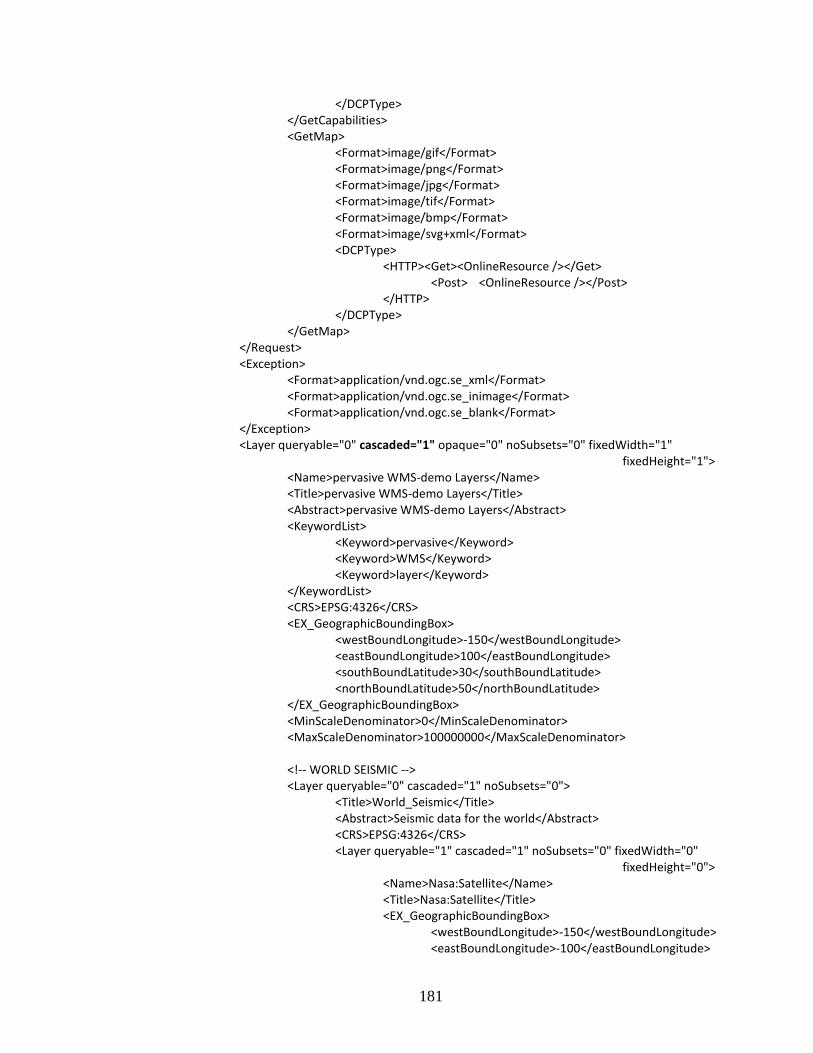
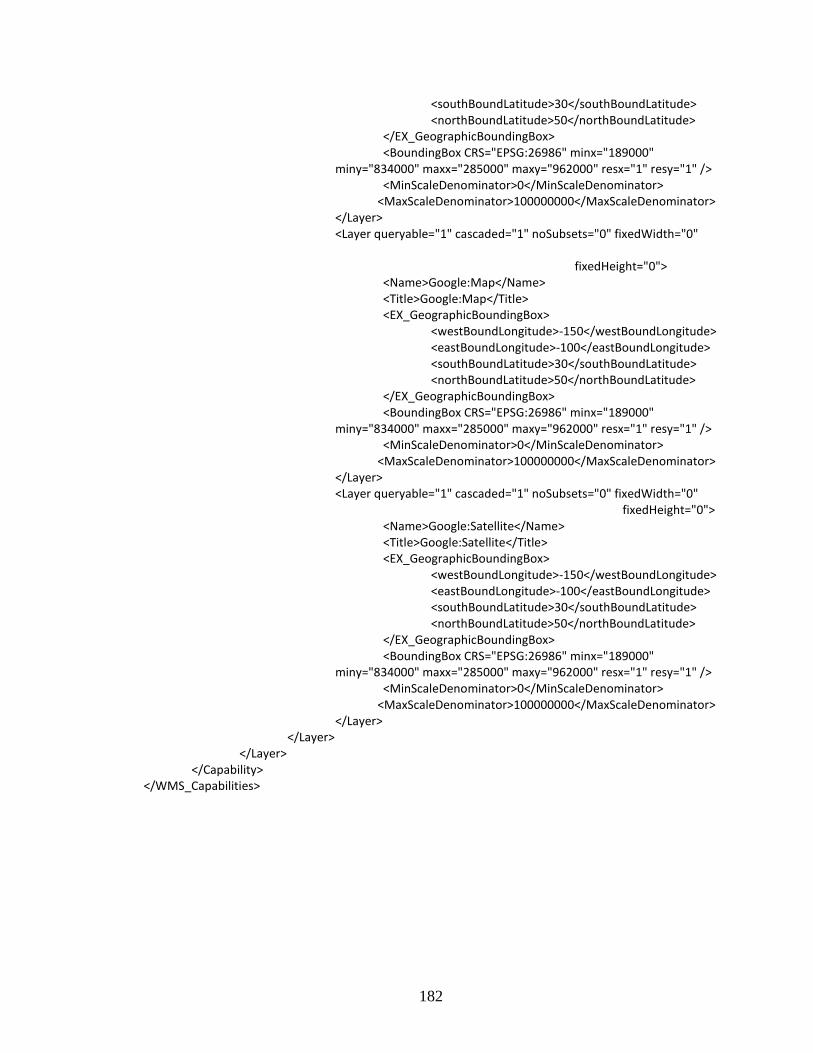
APPENDIX C: A Sample WMS Capabilities.xml Instance ..................................... 180
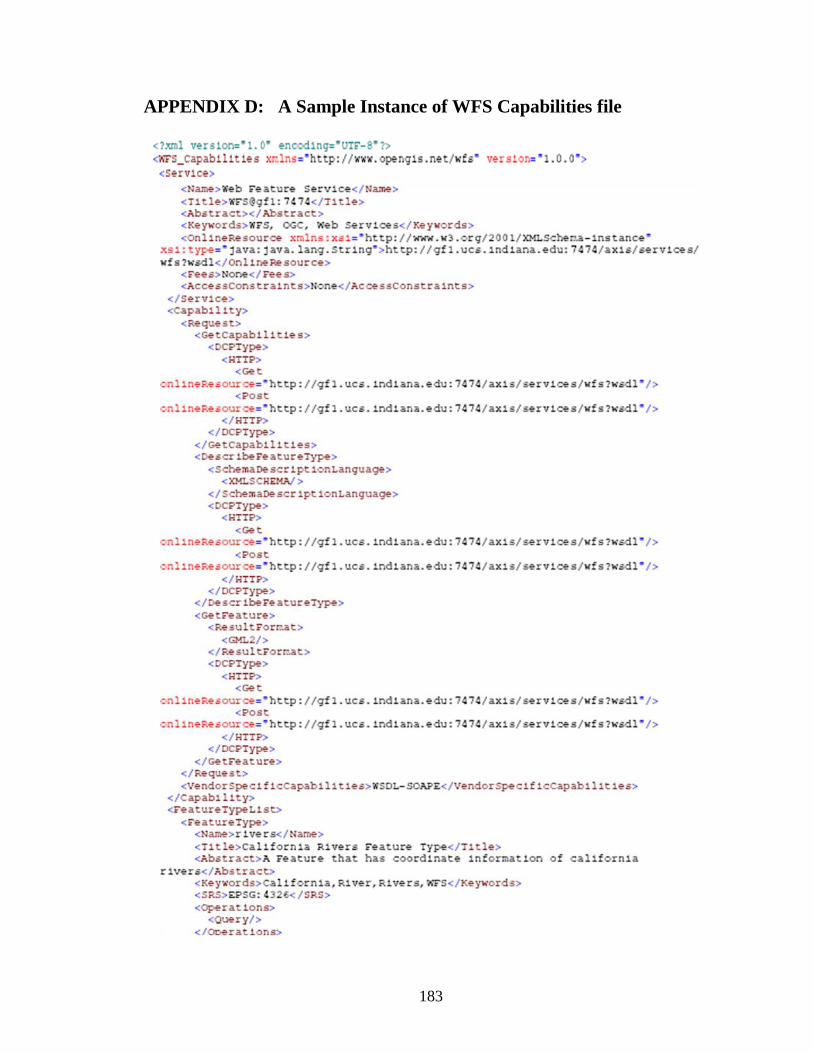
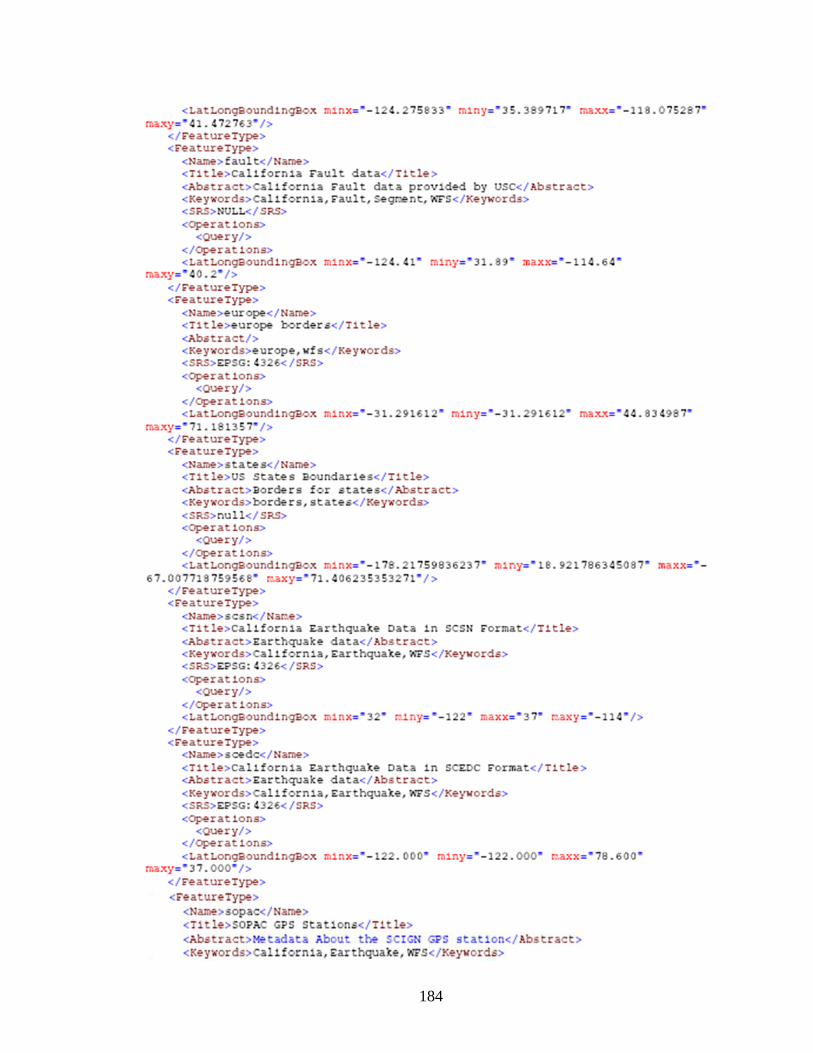
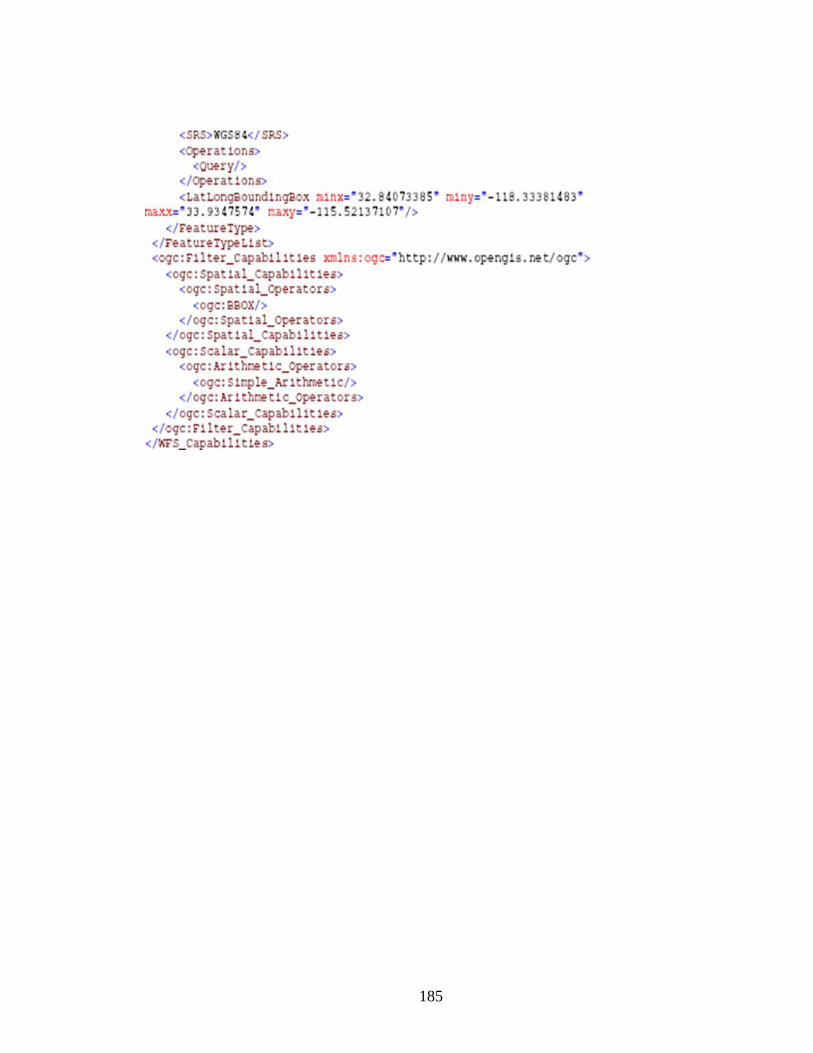
APPENDIX D: A Sample Instance of WFS Capabilities file ................................... 183
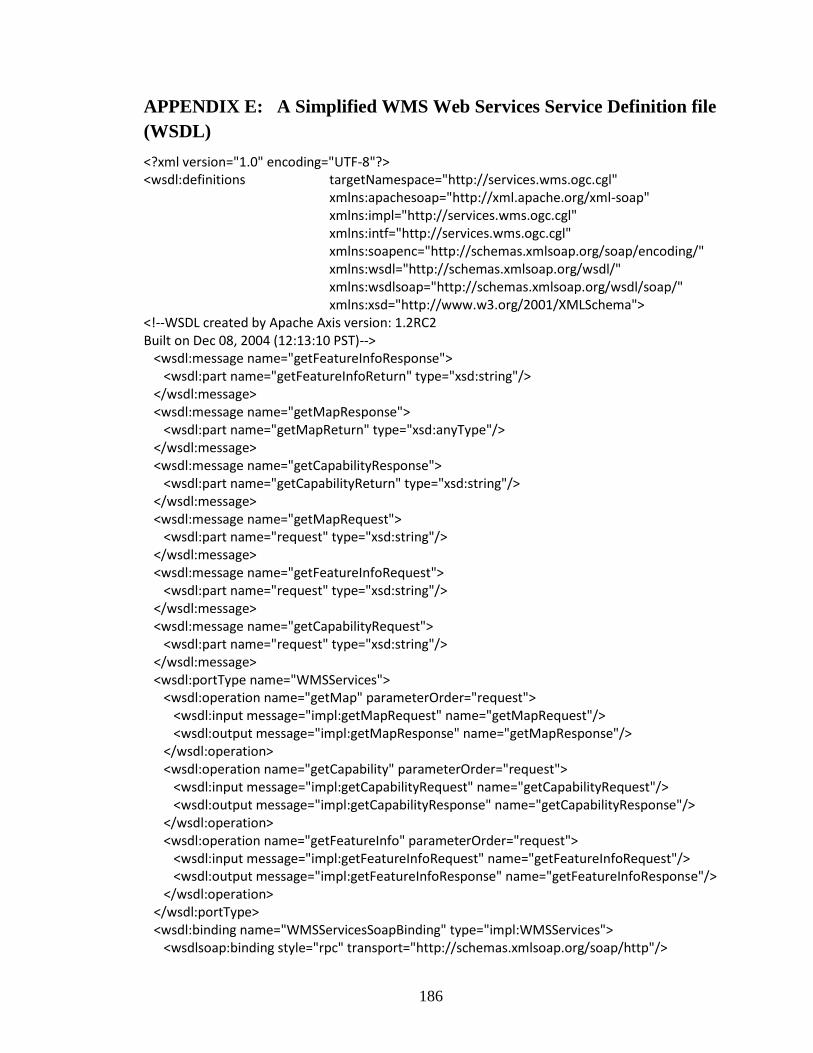
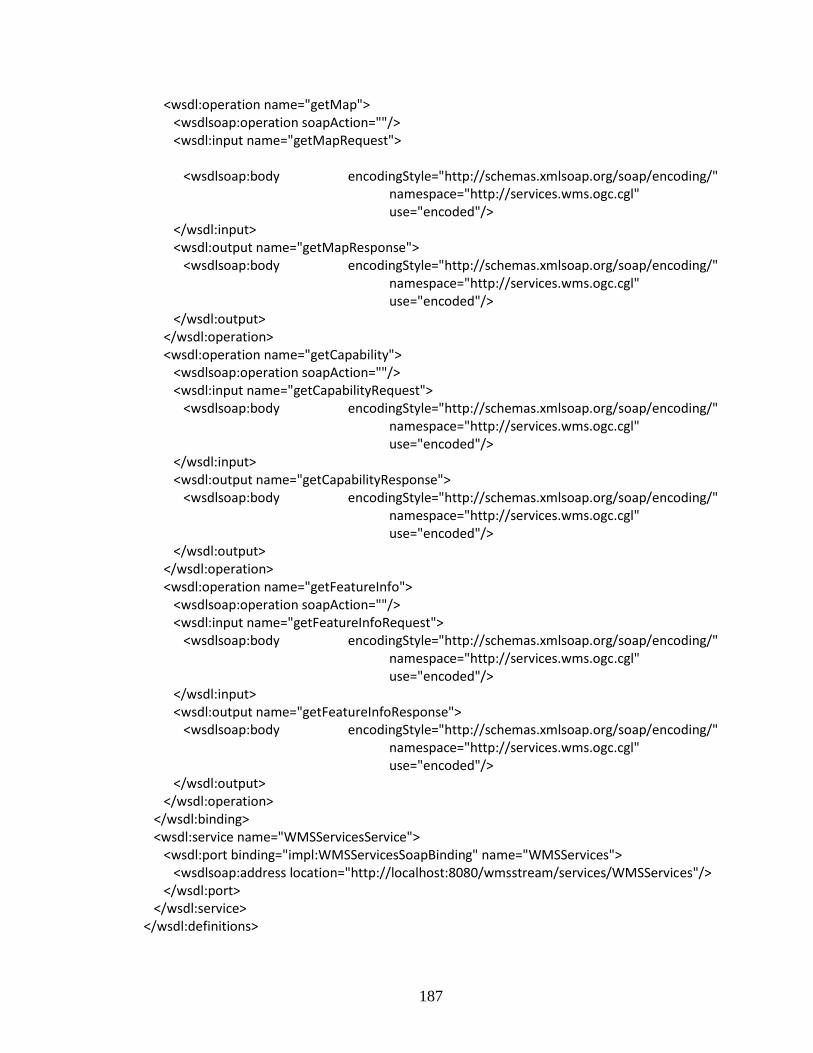
APPENDIX E: A Simplified WMS Web Services Service Definition file (WSDL) 186
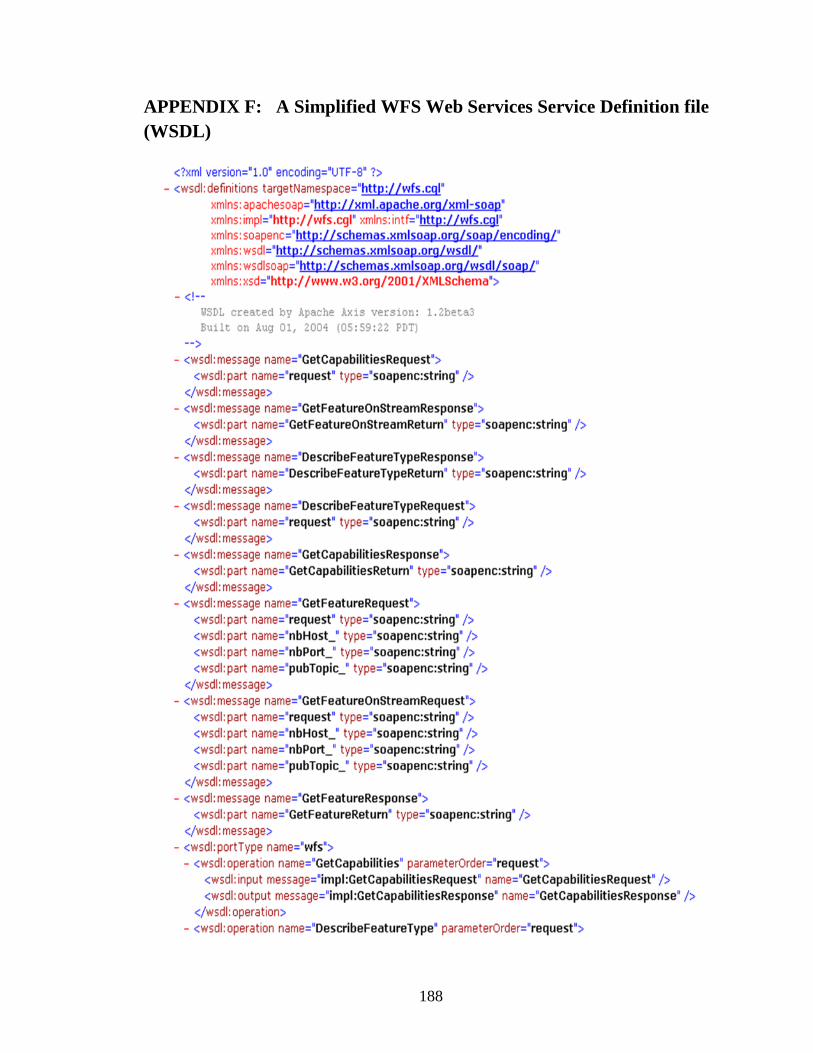
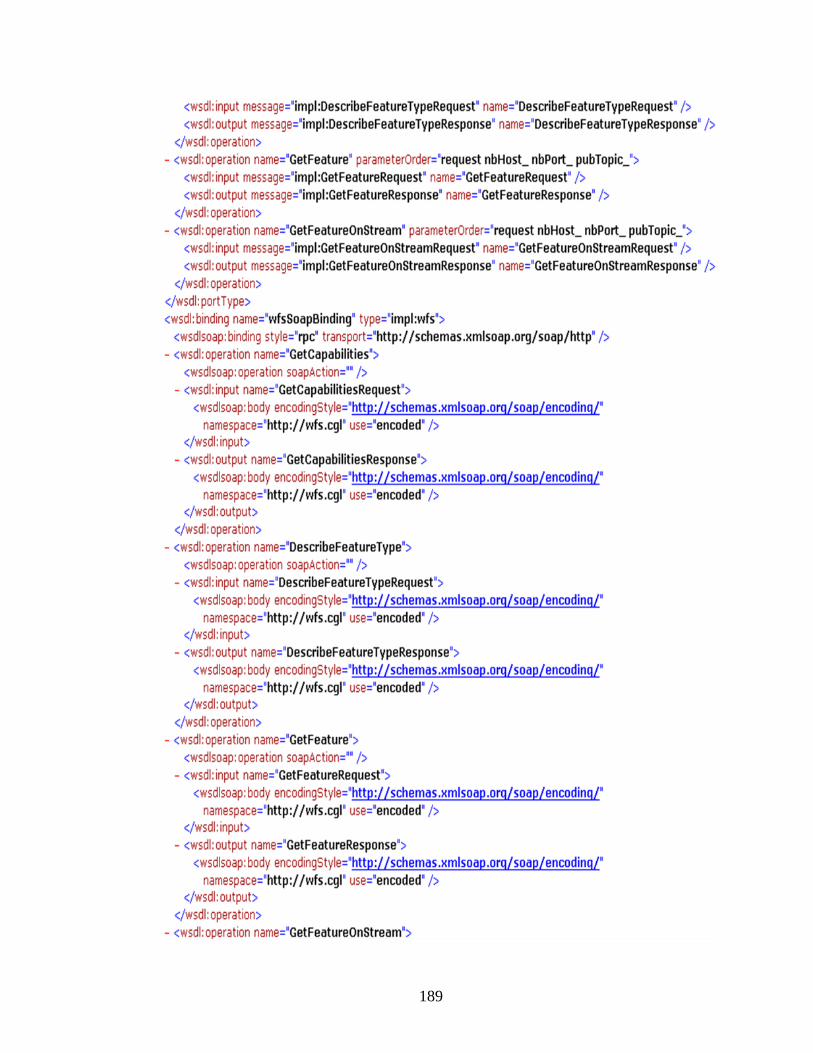
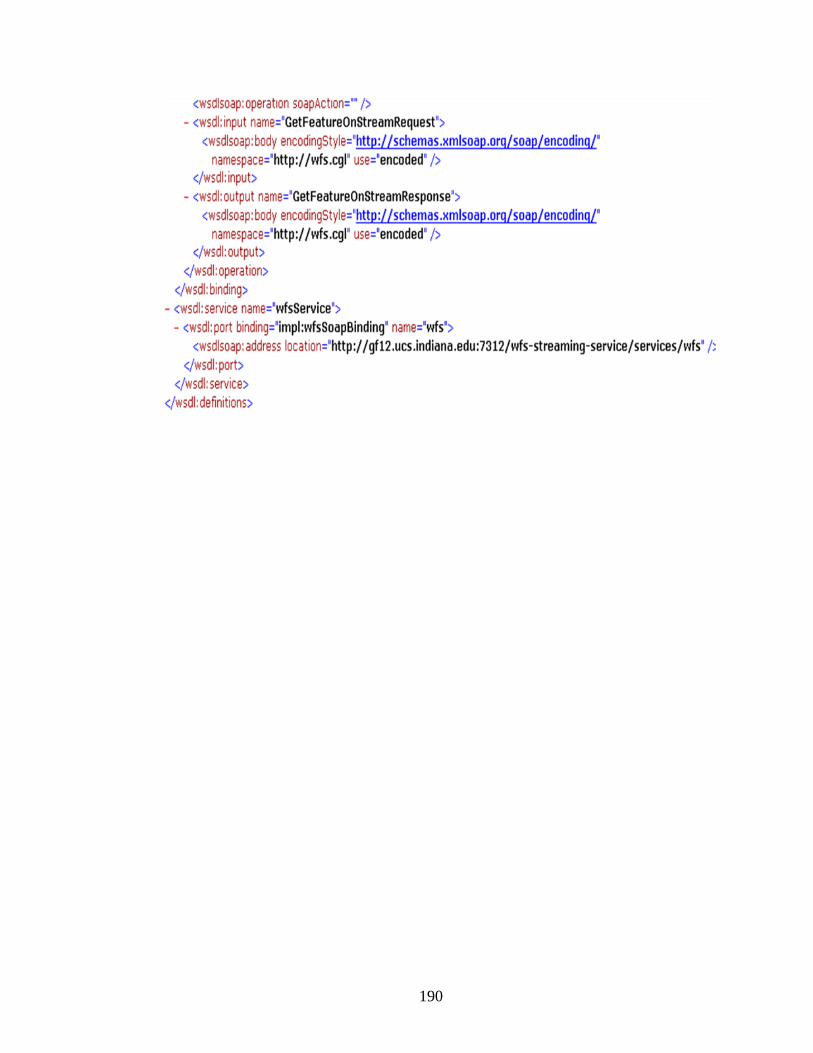
APPENDIX F: A Simplified WFS Web Services Service Definition file (WSDL) . 188
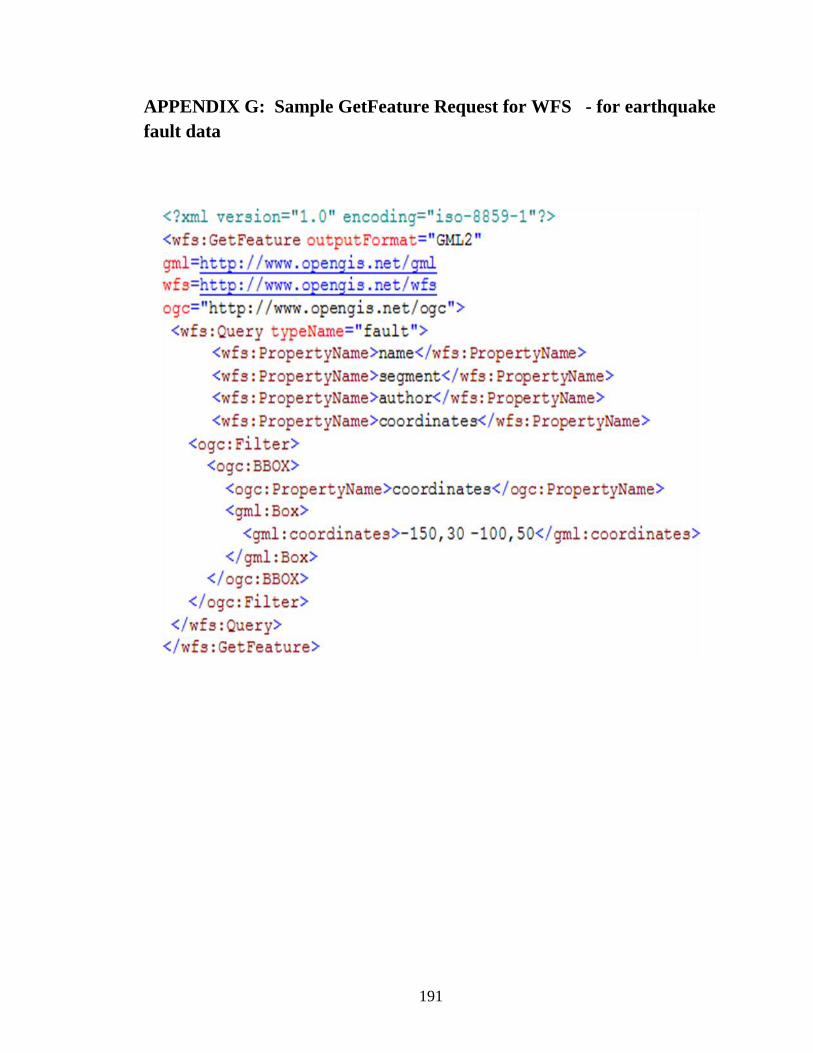
APPENDIX G: Sample GetFeature Request for WFS - for earthquake fault data .. 191
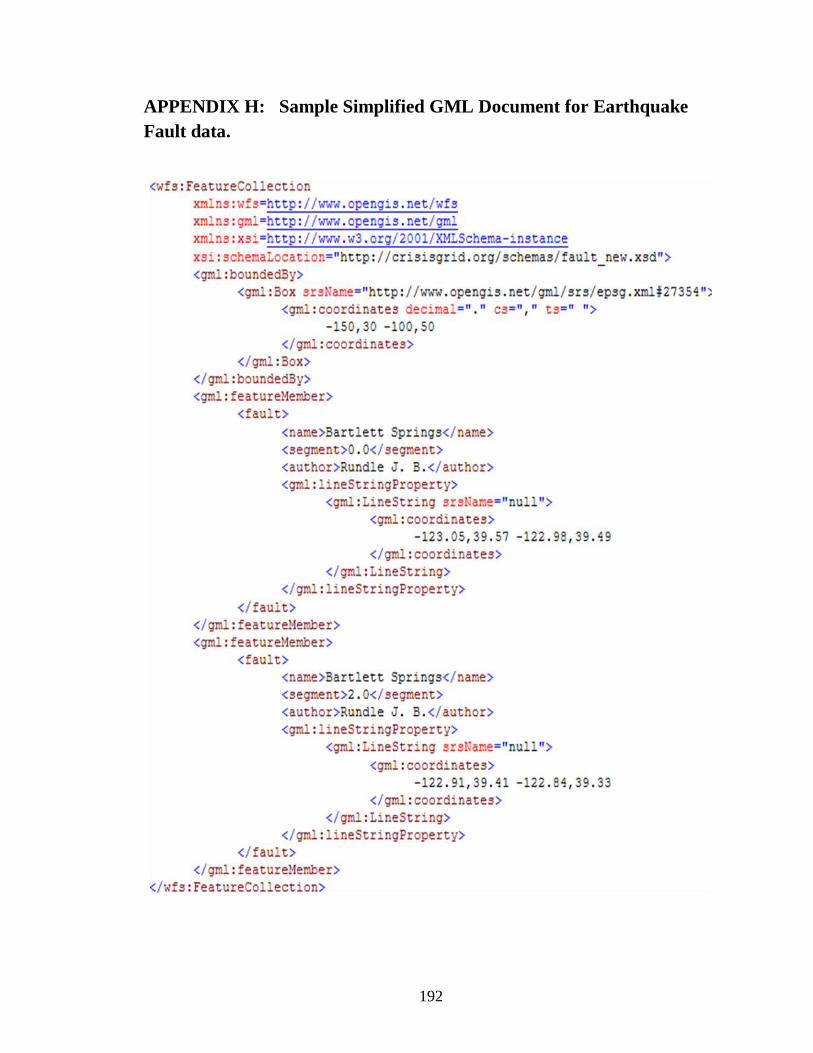
APPENDIX H: Sample Simplified GML Document for Earthquake Fault data. ..... 192
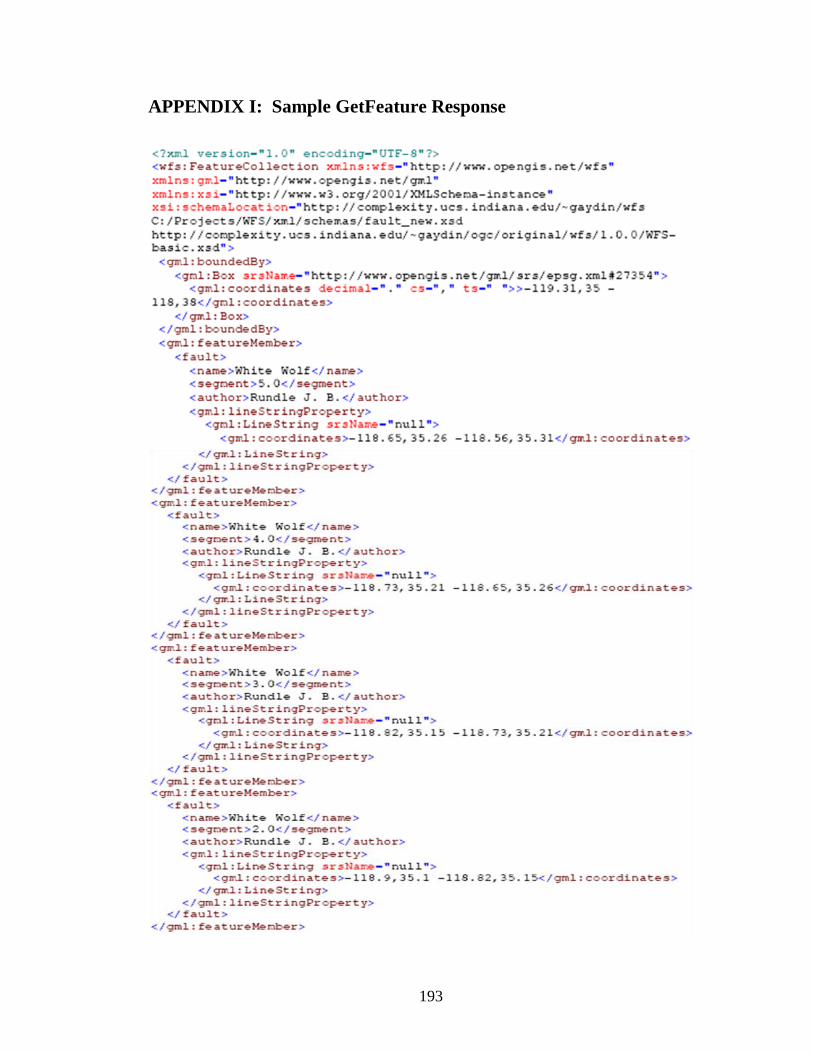
APPENDIX I: Sample GetFeature Response ............................................................ 193
REFERENCES 194
Glossary 210
Page 10
x
LIST OF FIGURES
Figure 1: Layered display – a map is composed of a set of multiple, distributed layers.
Figure is from (Koontz, 2003). ......................................................................................... 16
Figure 2: GIS framework with the proposed Web Service components and data flow. See
also Figure 3. ..................................................................................................................... 33
Figure 3: Illustration of client (WMS)-WFS interaction steps to get feature data............ 35
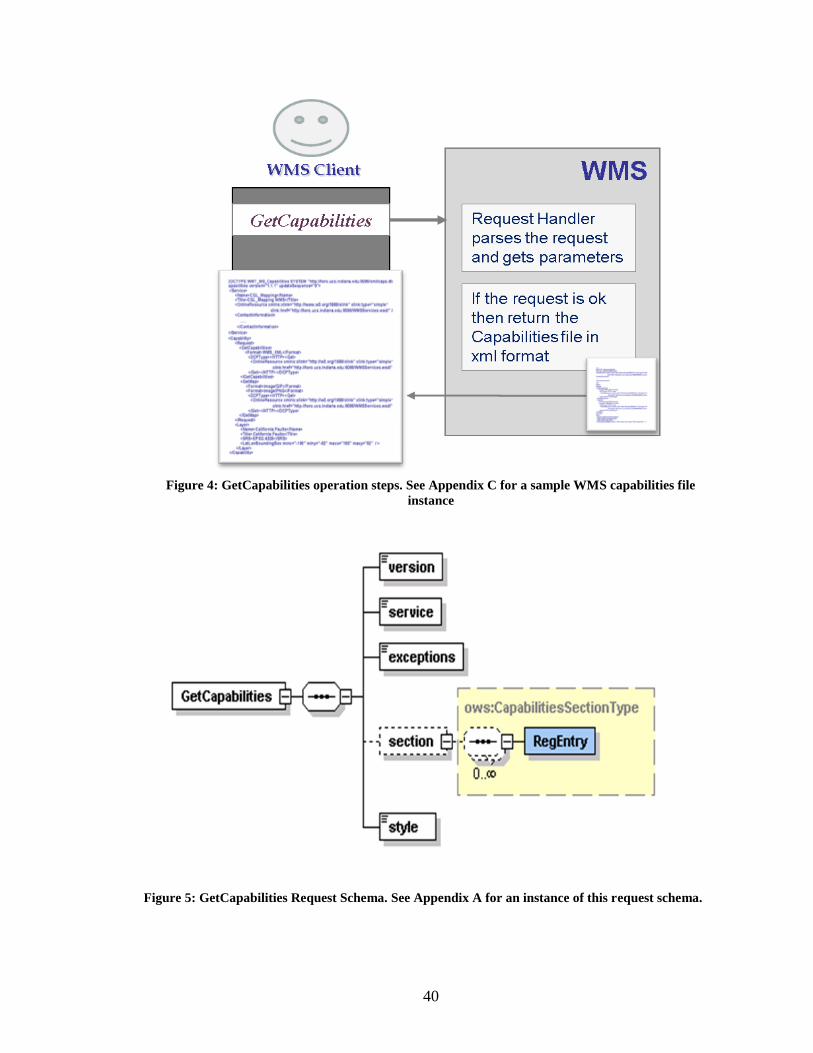
Figure 4: GetCapabilities operation steps. See Appendix C for a sample WMS
capabilities file instance .................................................................................................... 40
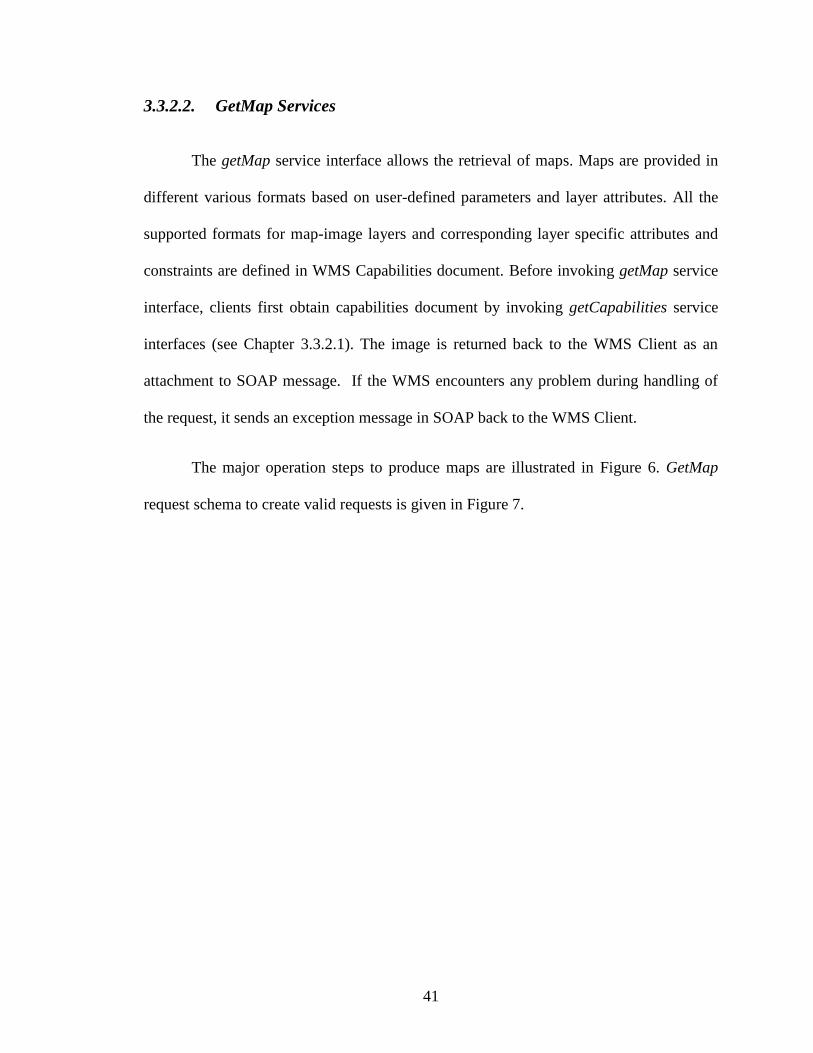
Figure 5: GetCapabilities Request Schema. See Appendix A for an instance of this
request schema. ................................................................................................................. 40
Figure 6: GetMap operation steps. .................................................................................... 42
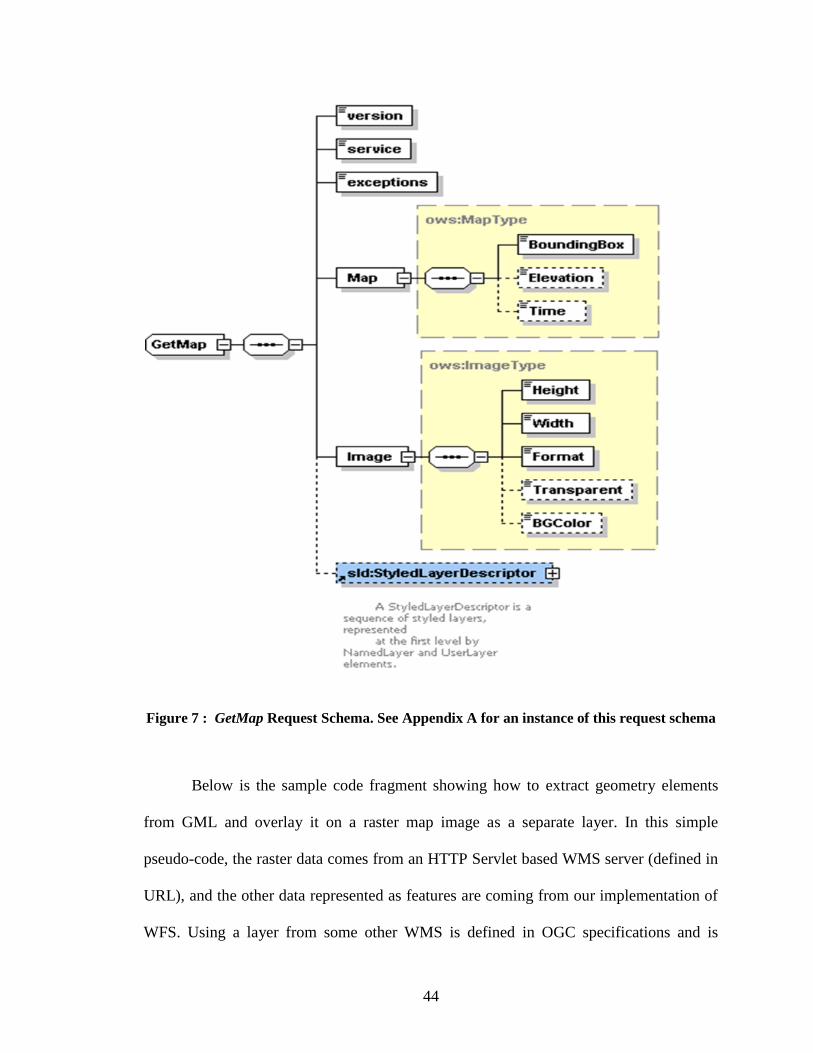
Figure 7 : GetMap Request Schema. See Appendix A for an instance of this request
schema............................................................................................................................... 44
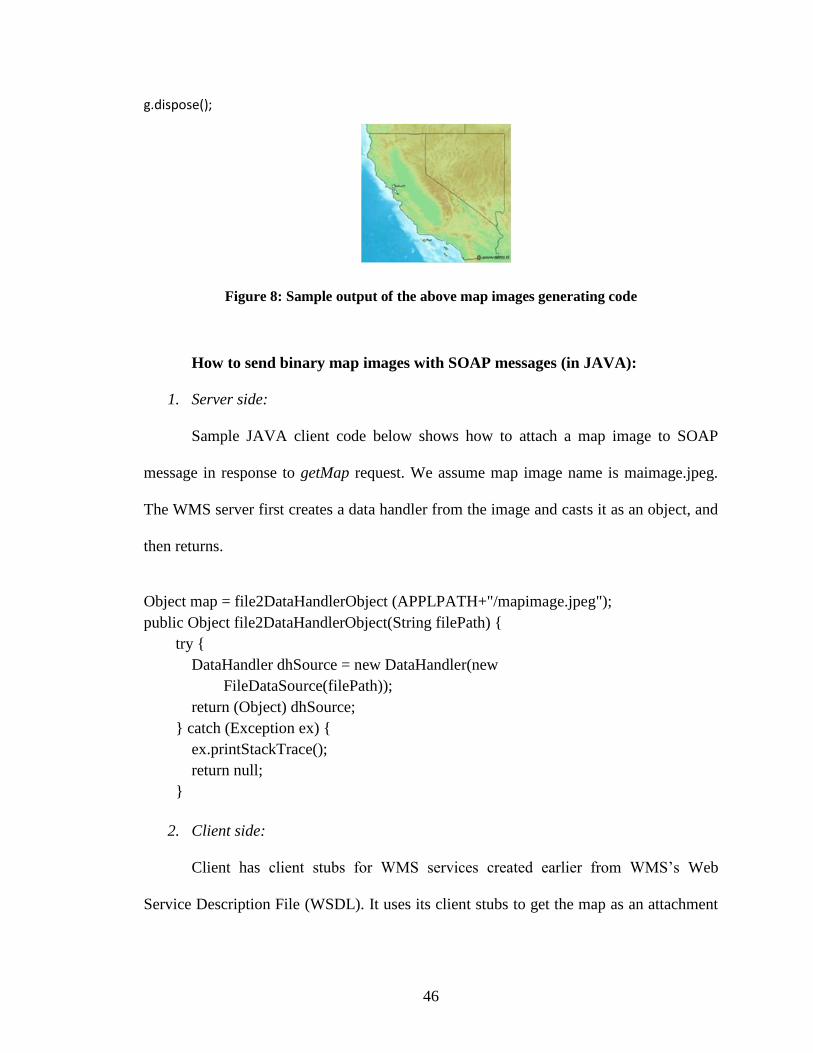
Figure 8: Sample output of the above map images generating code ................................ 46
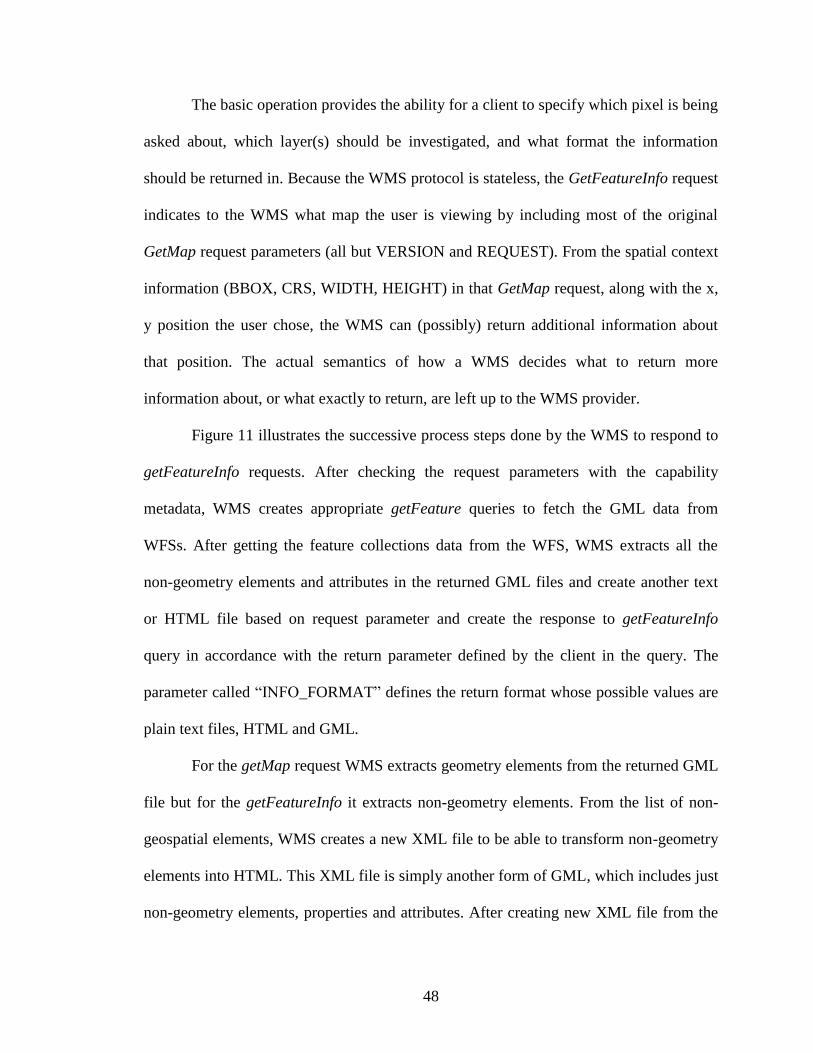
Figure 9: A snapshot of response to getFeatureInfo. It is actually an attribute querying of
earthquake seismic data layer shown on the map image. ................................................. 49
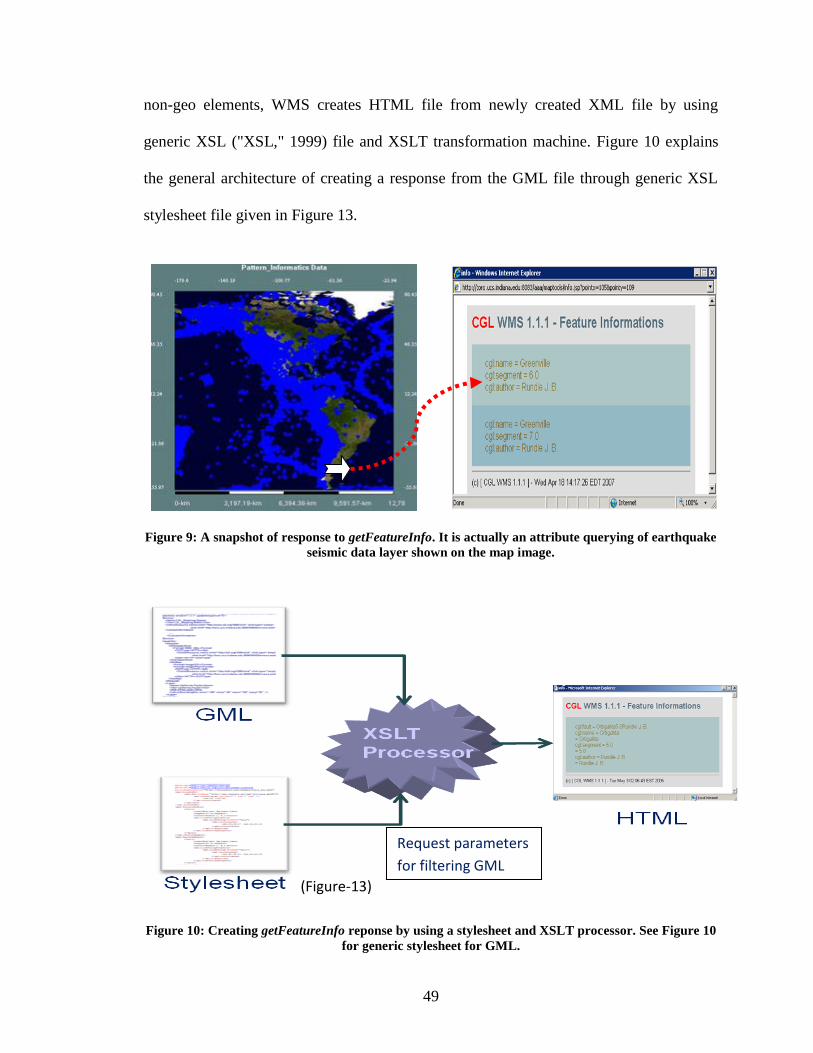
Figure 10: Creating getFeatureInfo reponse by using a stylesheet and XSLT processor.
See Figure 10 for generic stylesheet for GML. ................................................................. 49
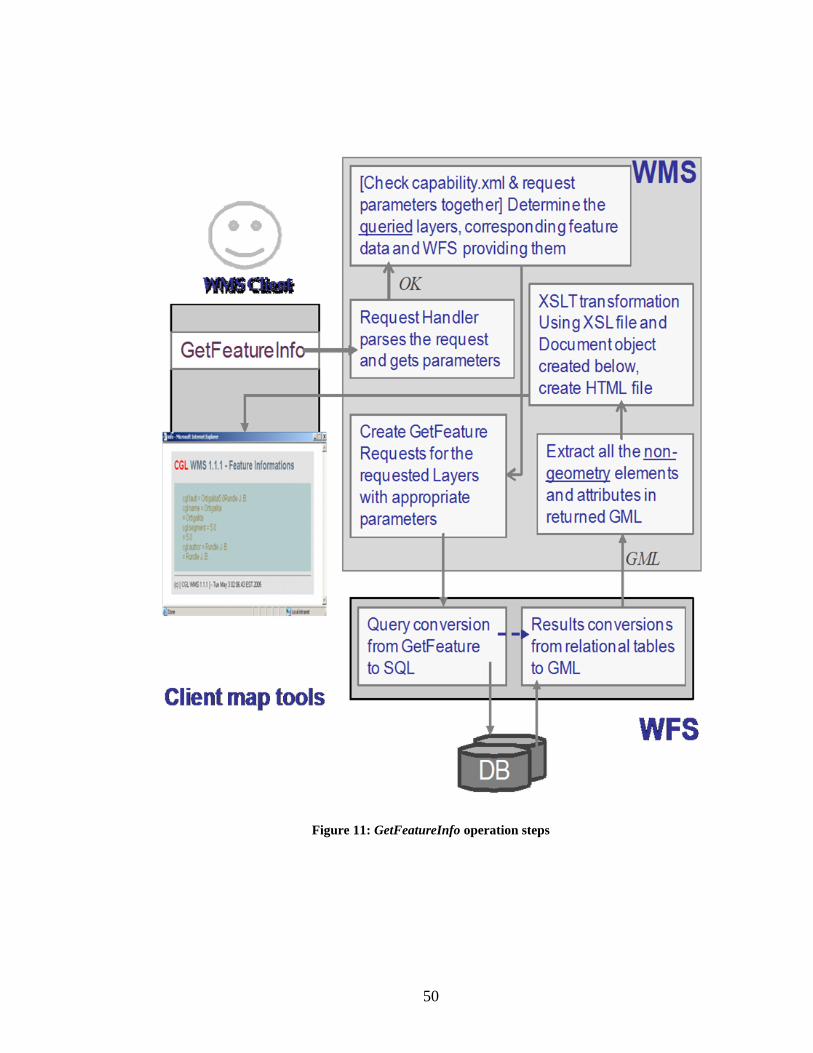
Figure 11: GetFeatureInfo operation steps ....................................................................... 50
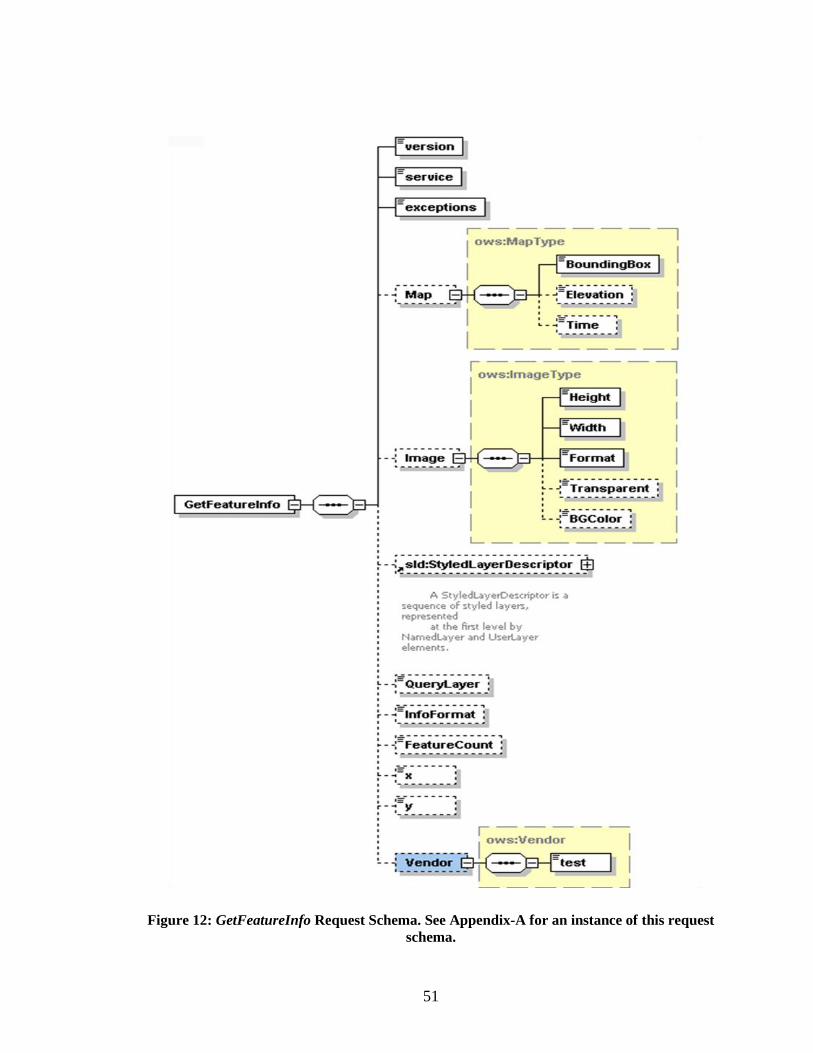
Figure 12: GetFeatureInfo Request Schema. See Appendix-A for an instance of this
request schema. ................................................................................................................. 51
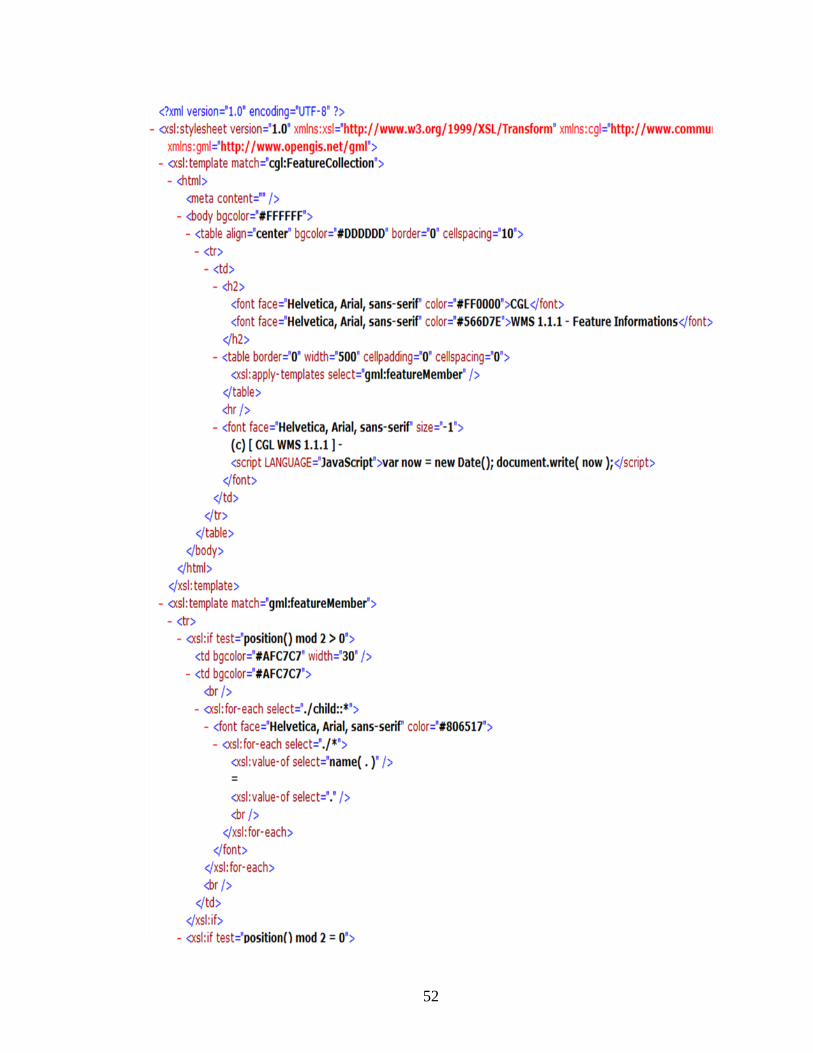
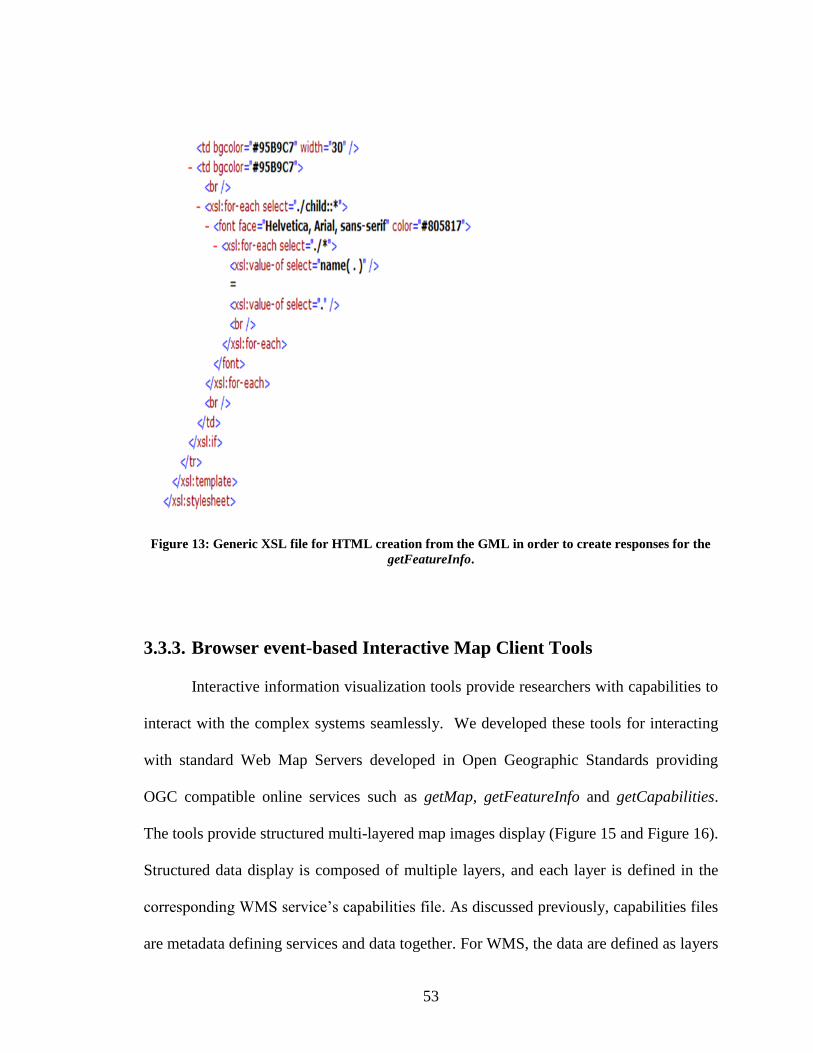
Figure 13: Generic XSL file for HTML creation from the GML in order to create
responses for the getFeatureInfo. ...................................................................................... 53
Page 11
xi
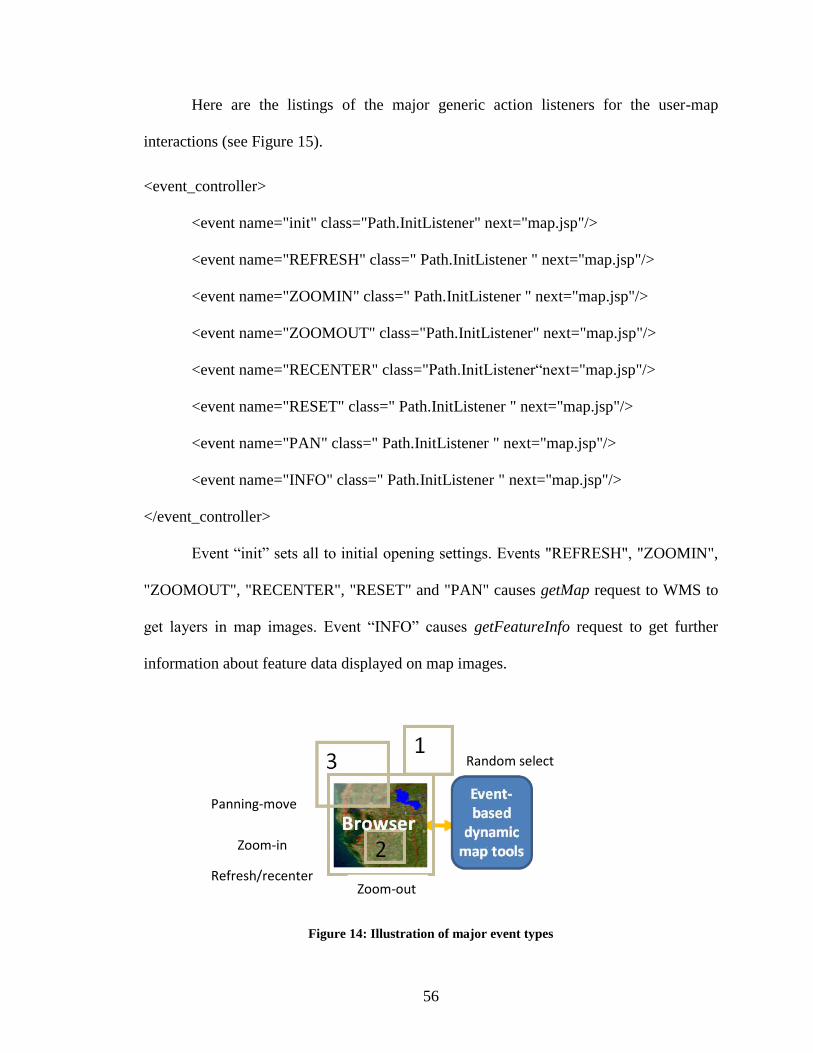
Figure 14: Illustration of major event types ...................................................................... 56
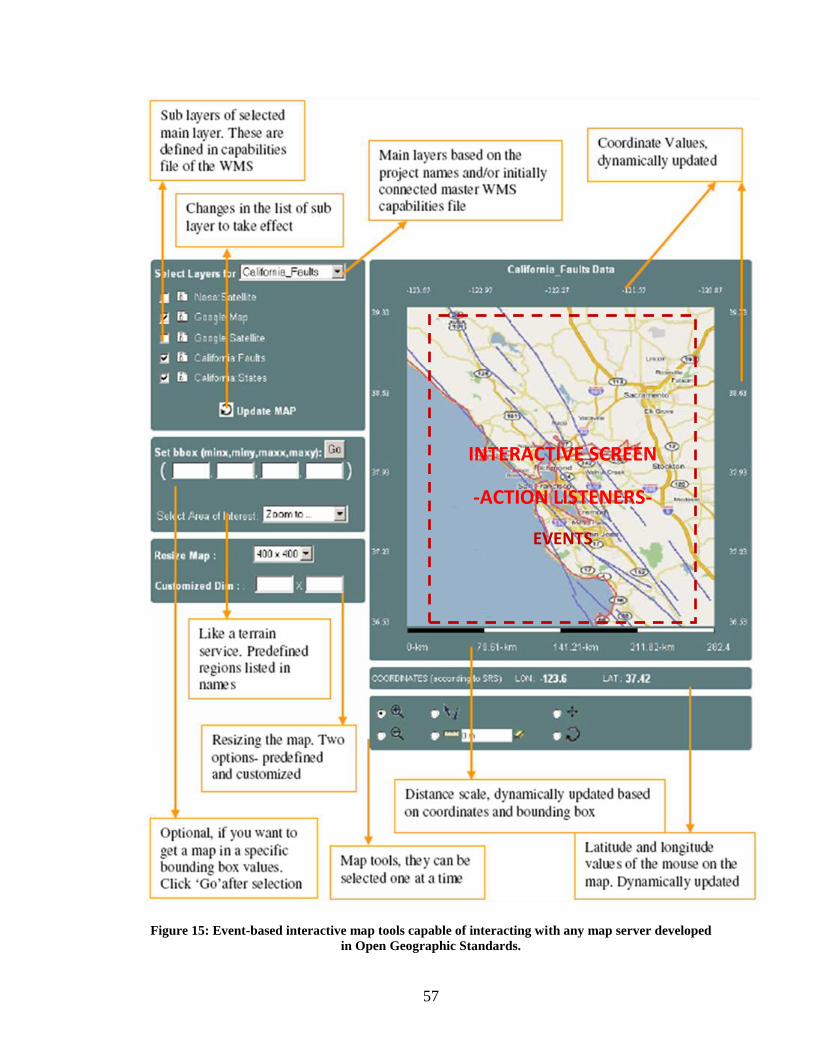
Figure 15: Event-based interactive map tools capable of interacting with any map server
developed in Open Geographic Standards. ....................................................................... 57
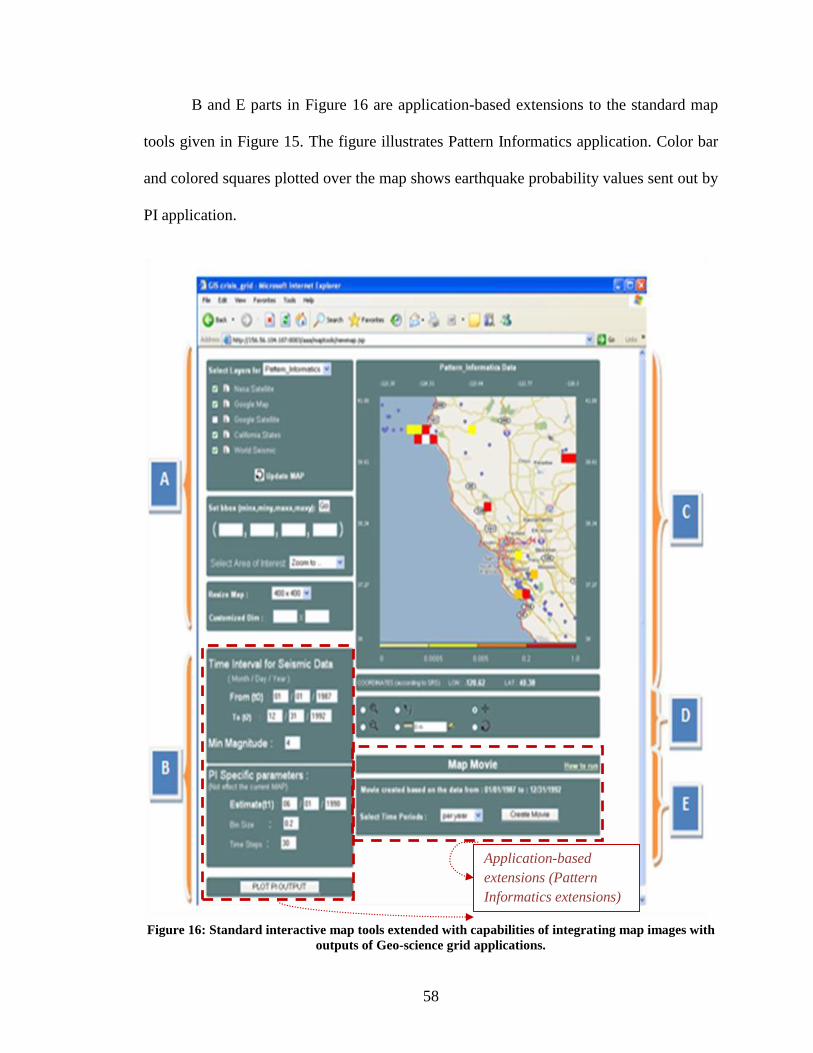
Figure 16: Standard interactive map tools extended with capabilities of integrating map
images with outputs of Geo-science grid applications. .................................................... 58
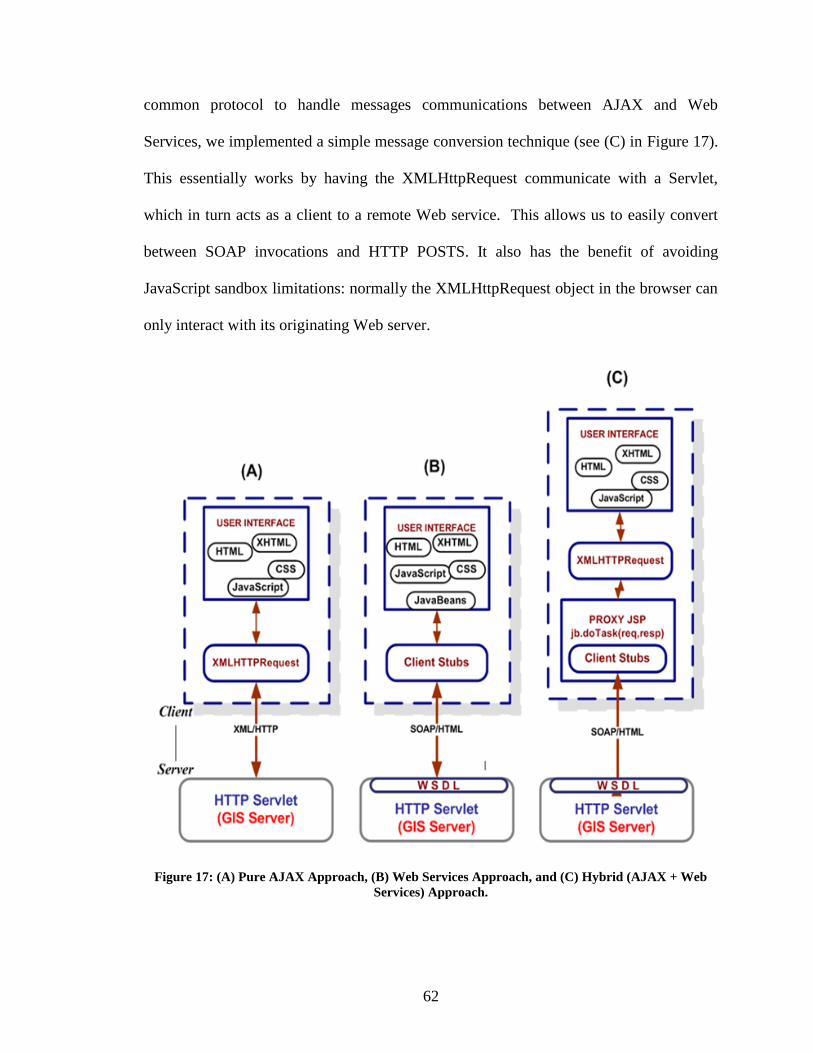
Figure 17: (A) Pure AJAX Approach, (B) Web Services Approach, and (C) Hybrid
(AJAX + Web Services) Approach................................................................................... 62
Figure 18: Integration of Google Maps with OGC WMS by using architecture defined in
Figure 16. .......................................................................................................................... 65
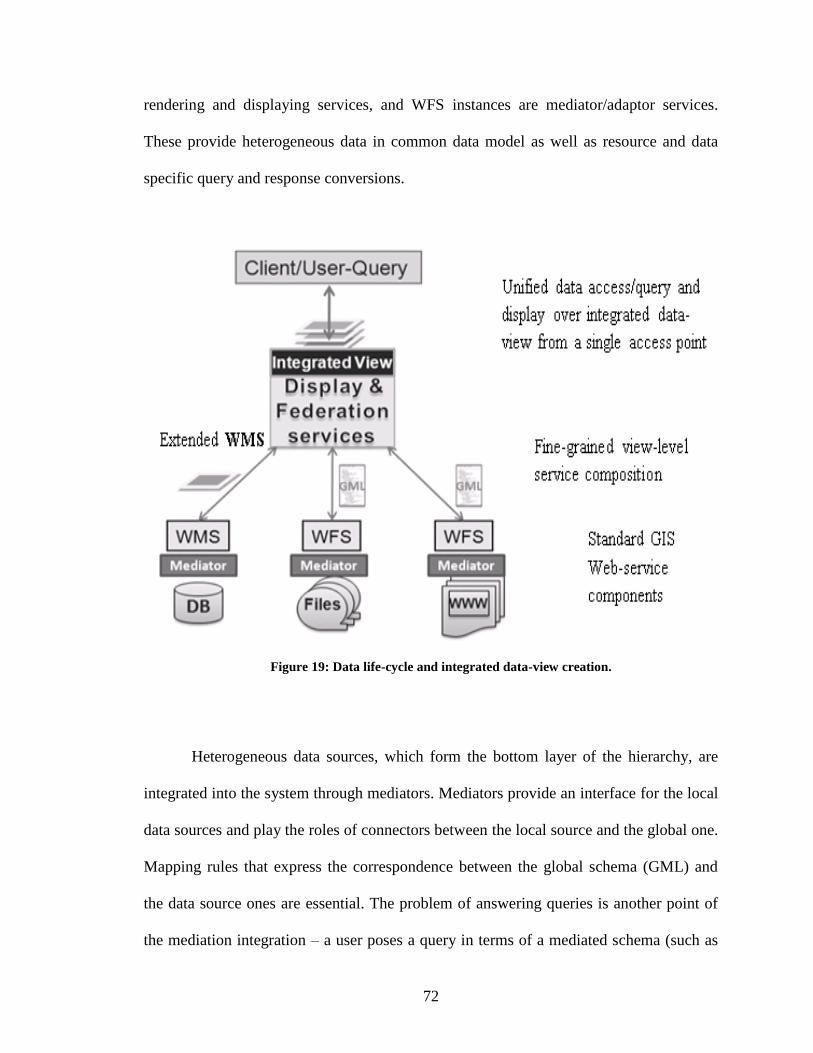
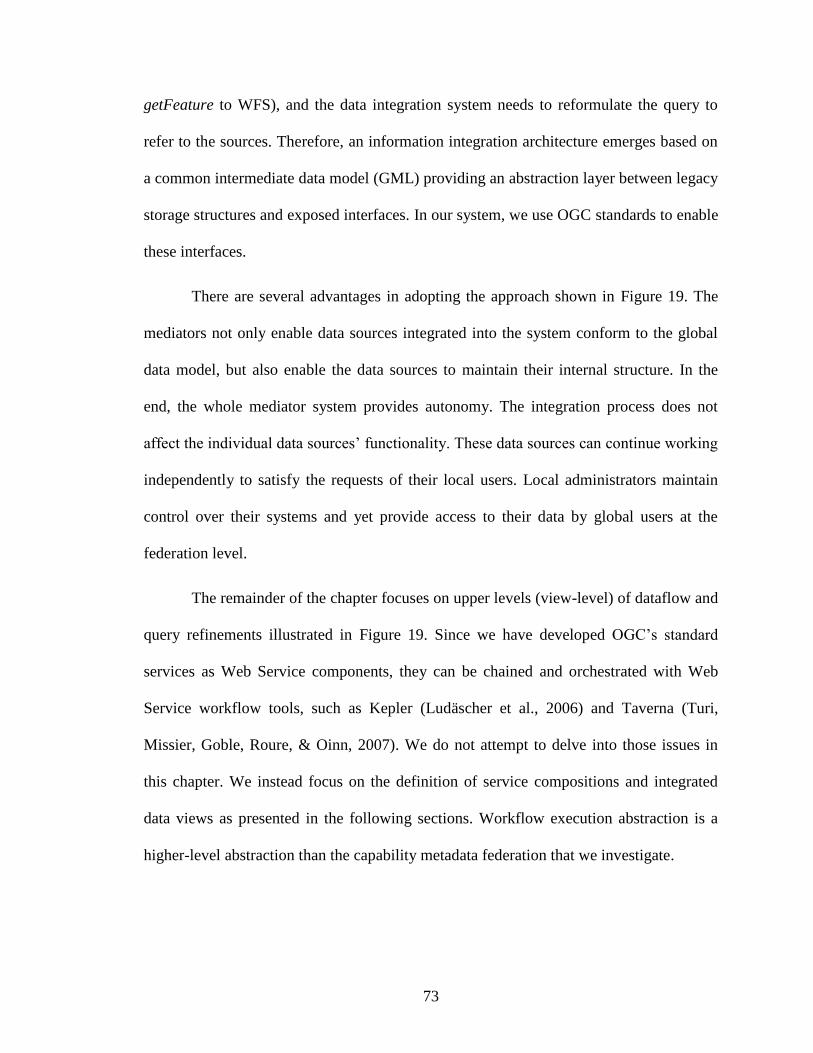
Figure 19: Data life-cycle and integrated data-view creation. .......................................... 72
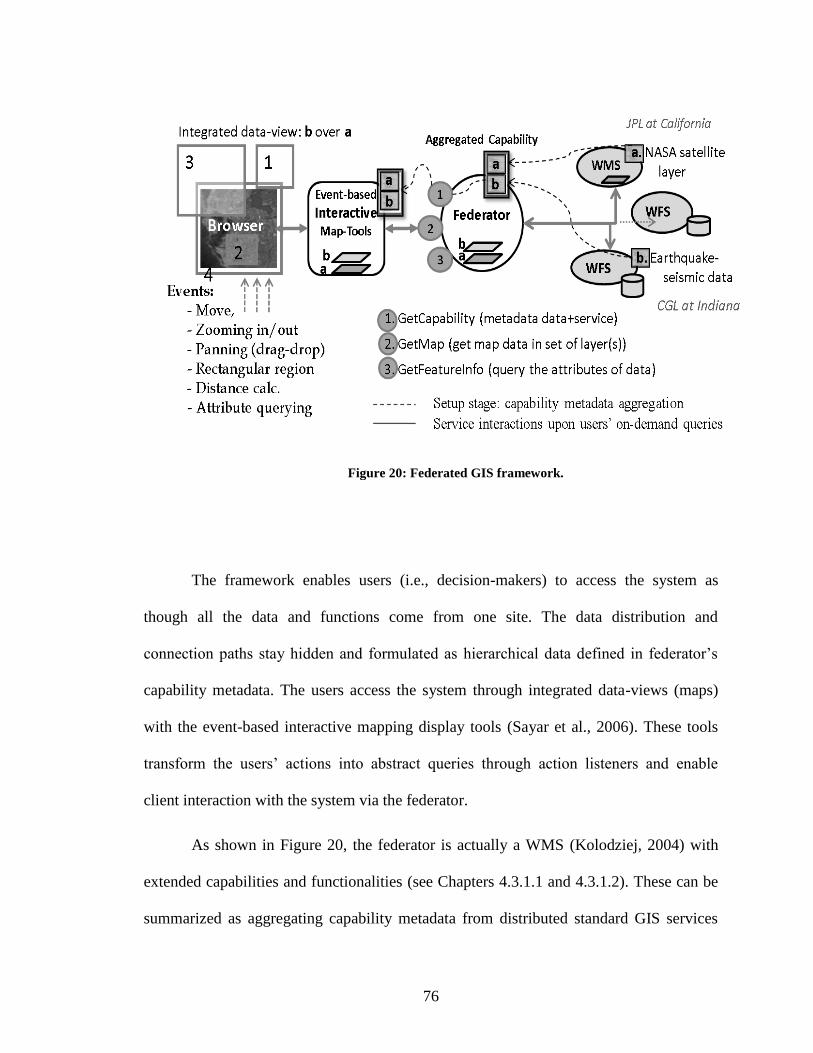
Figure 20: Federated GIS framework. .............................................................................. 76
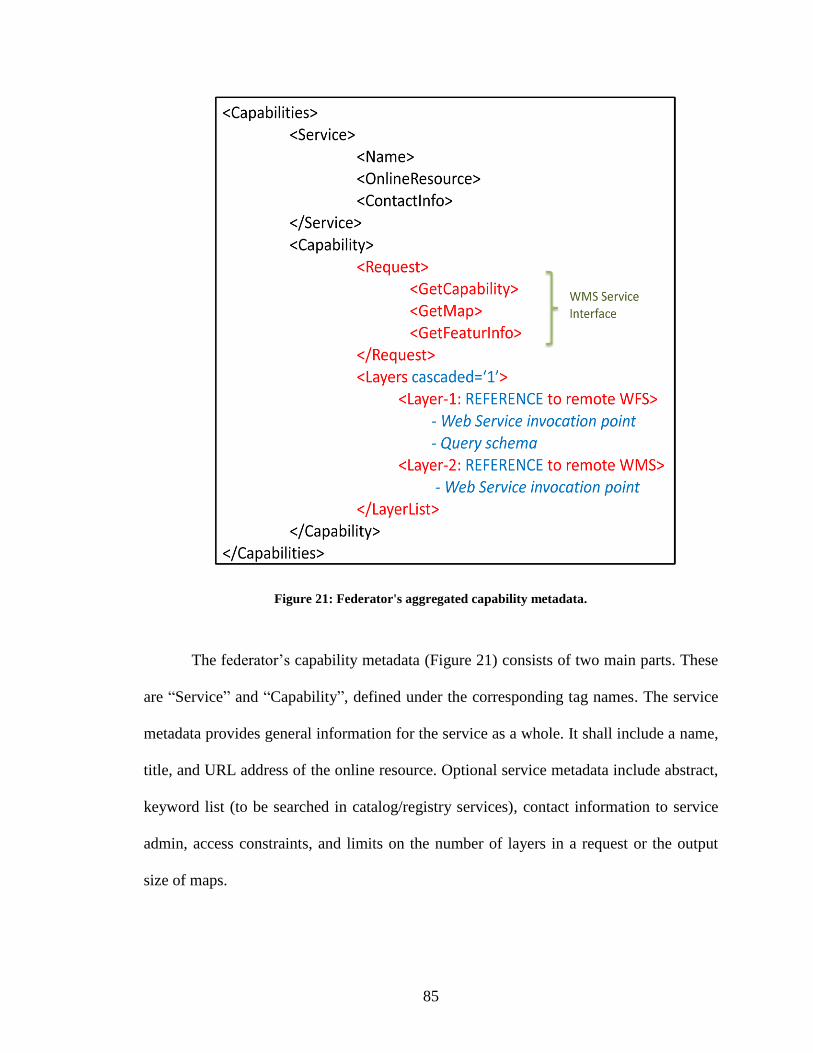
Figure 21: Federator's aggregated capability metadata. .................................................... 85
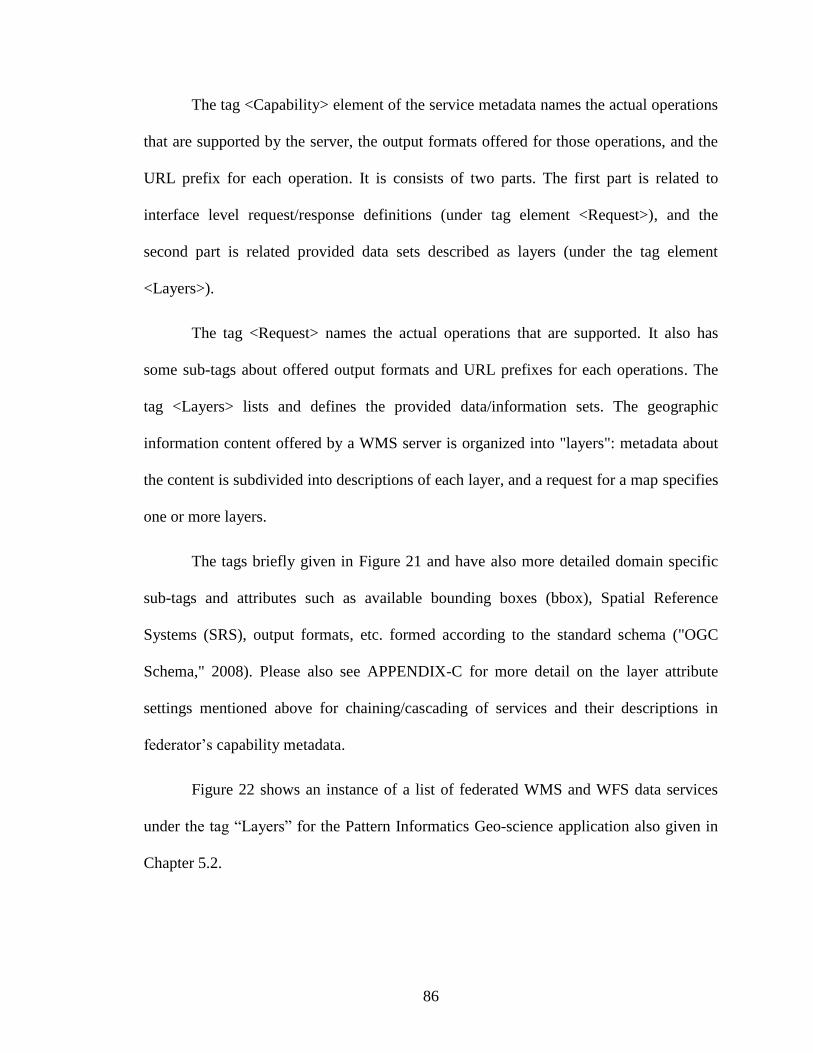
Figure 22: Example federated data sets defined in federator‟s metadata. ........................ 87
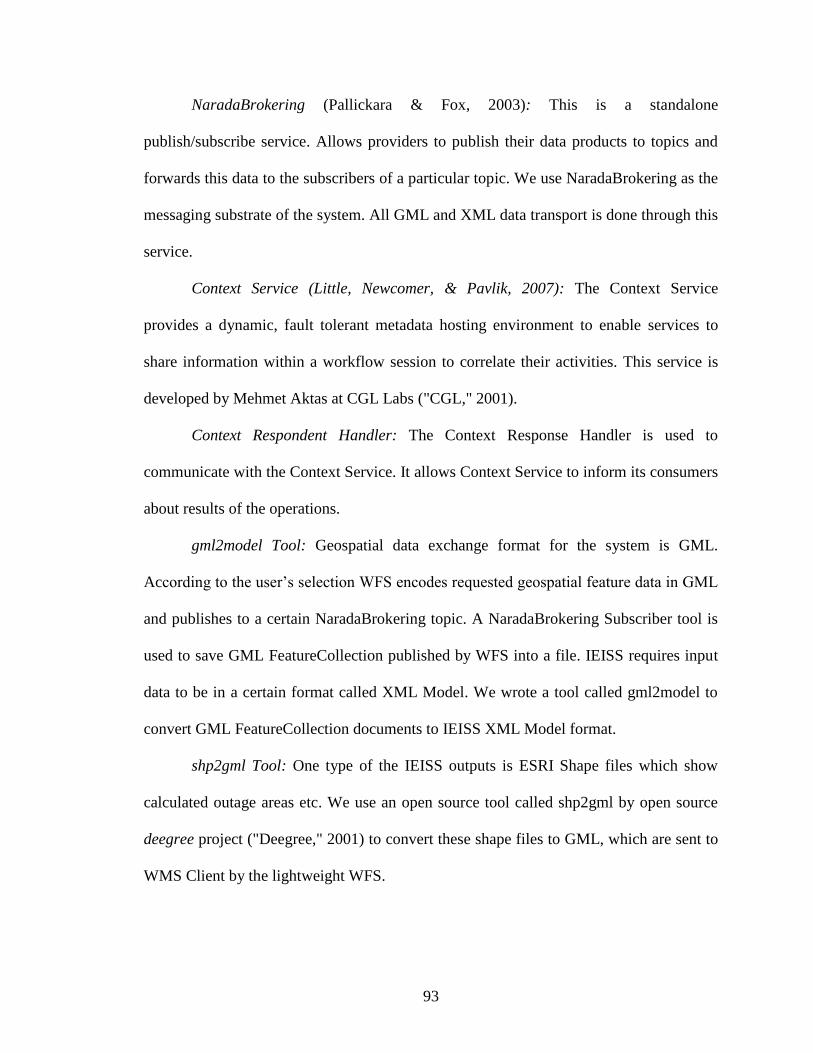
Figure 23: NISAC SOA Demonstration Architectural Diagram and Data Flow. ............. 92
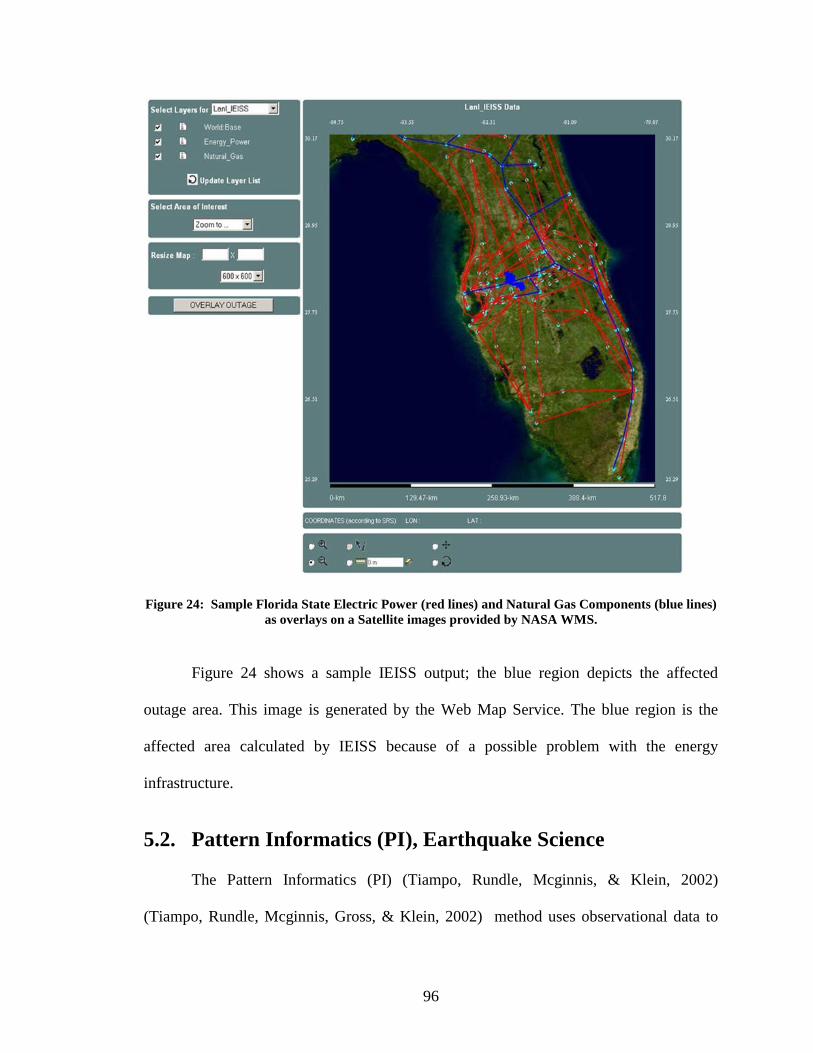
Figure 24: Sample Florida State Electric Power (red lines) and Natural Gas Components
(blue lines) as overlays on a Satellite images provided by NASA WMS. ........................ 96
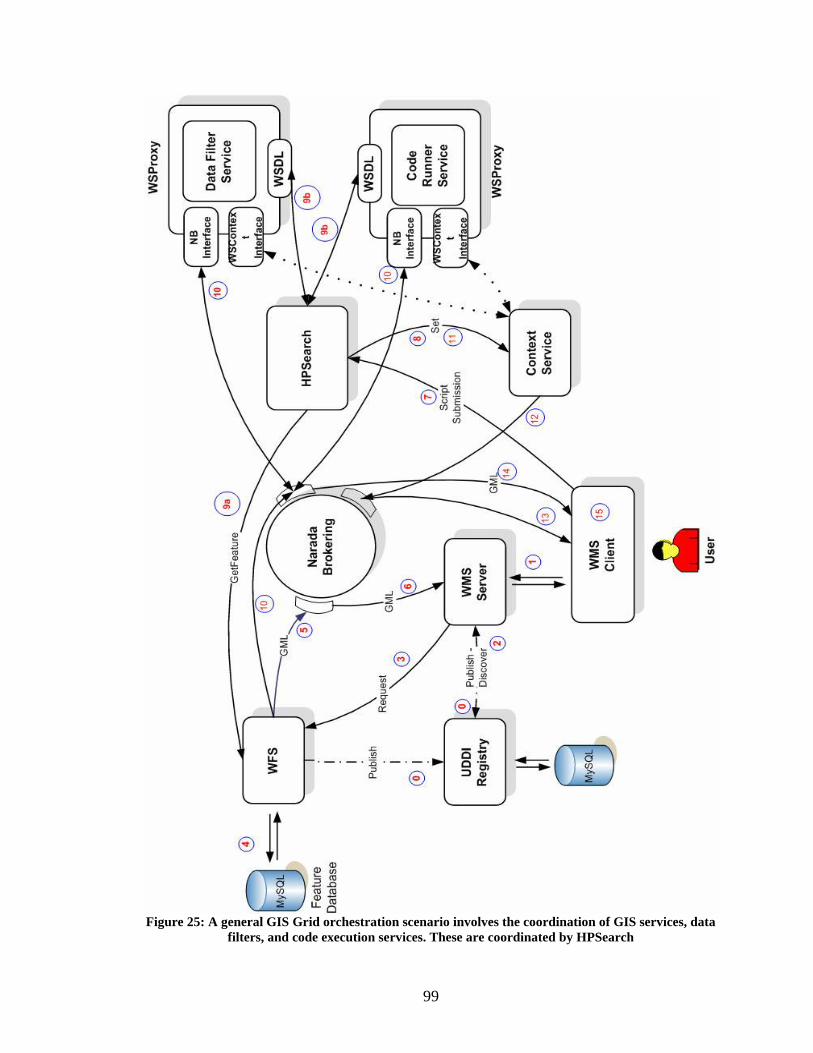
Figure 25: A general GIS Grid orchestration scenario involves the coordination of GIS
services, data filters, and code execution services. These are coordinated by HPSearch . 99
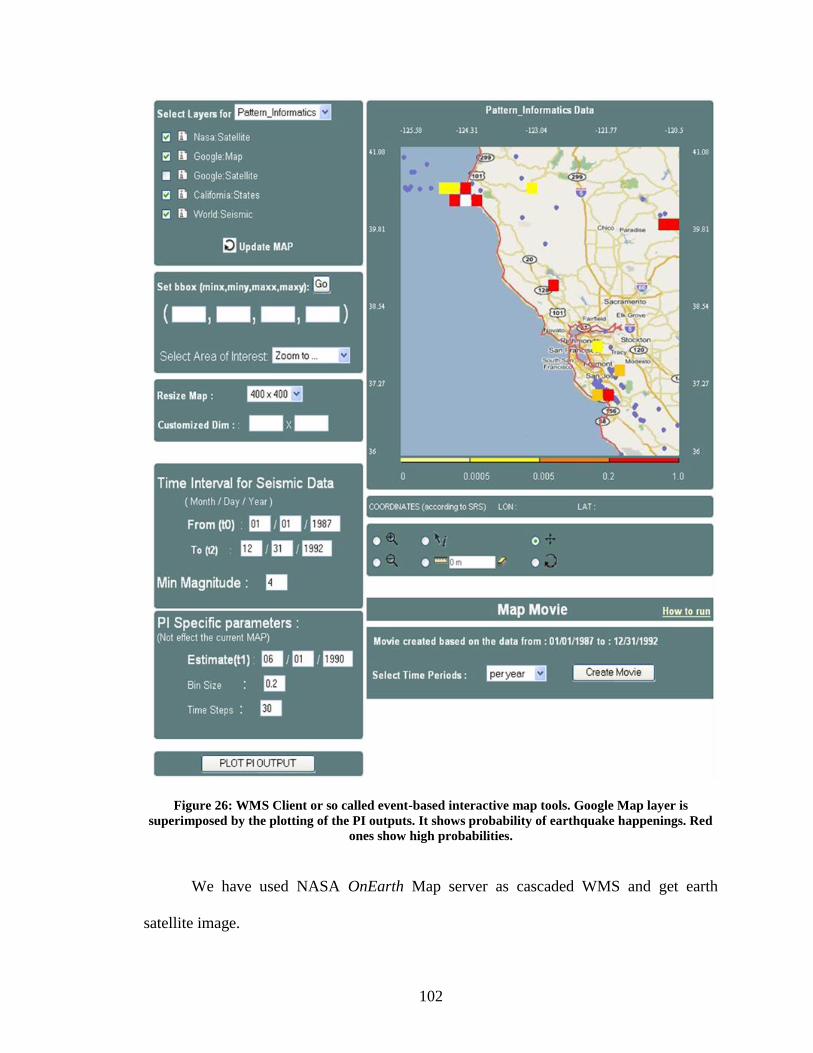
Figure 26: WMS Client or so called event-based interactive map tools. Google Map layer
is superimposed by the plotting of the PI outputs. It shows probability of earthquake
happenings. Red ones show high probabilities. .............................................................. 102
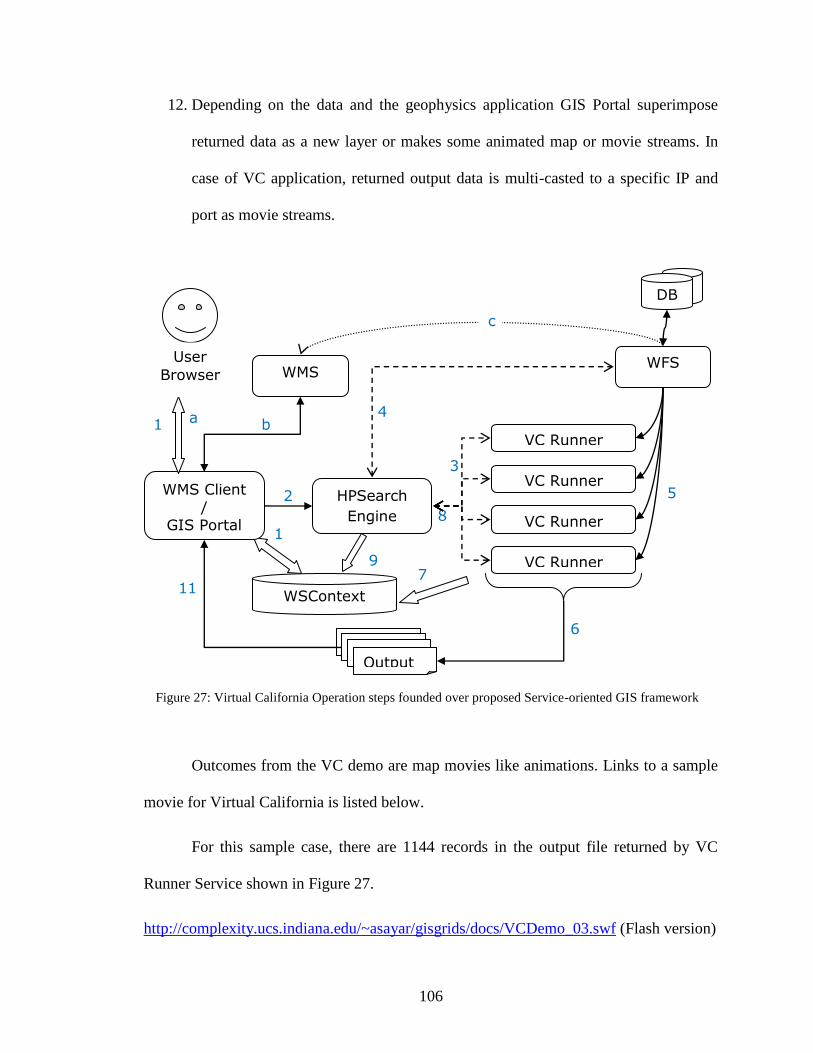
Figure 27: Virtual California Operation steps founded over proposed Service-oriented
GIS framework................................................................................................................ 106
Page 12
xii
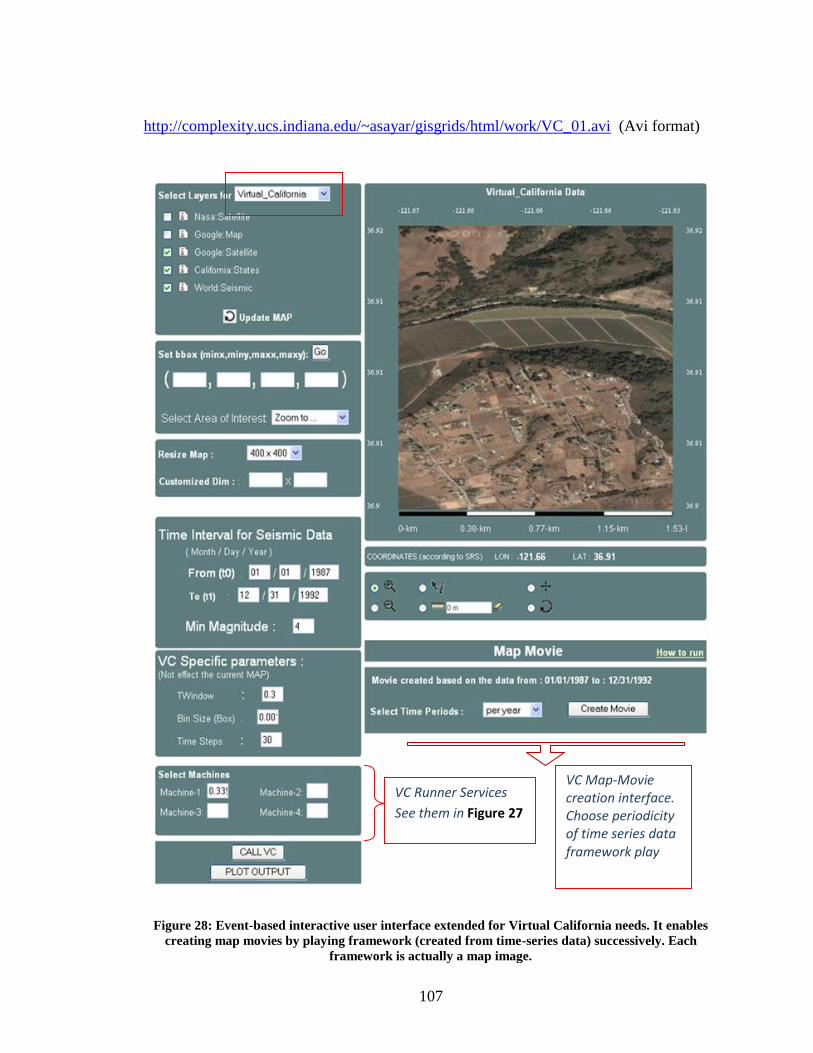
Figure 28: Event-based interactive user interface extended for Virtual California needs. It
enables creating map movies by playing framework (created from time-series data)
successively. Each framework is actually a map image. ................................................ 107
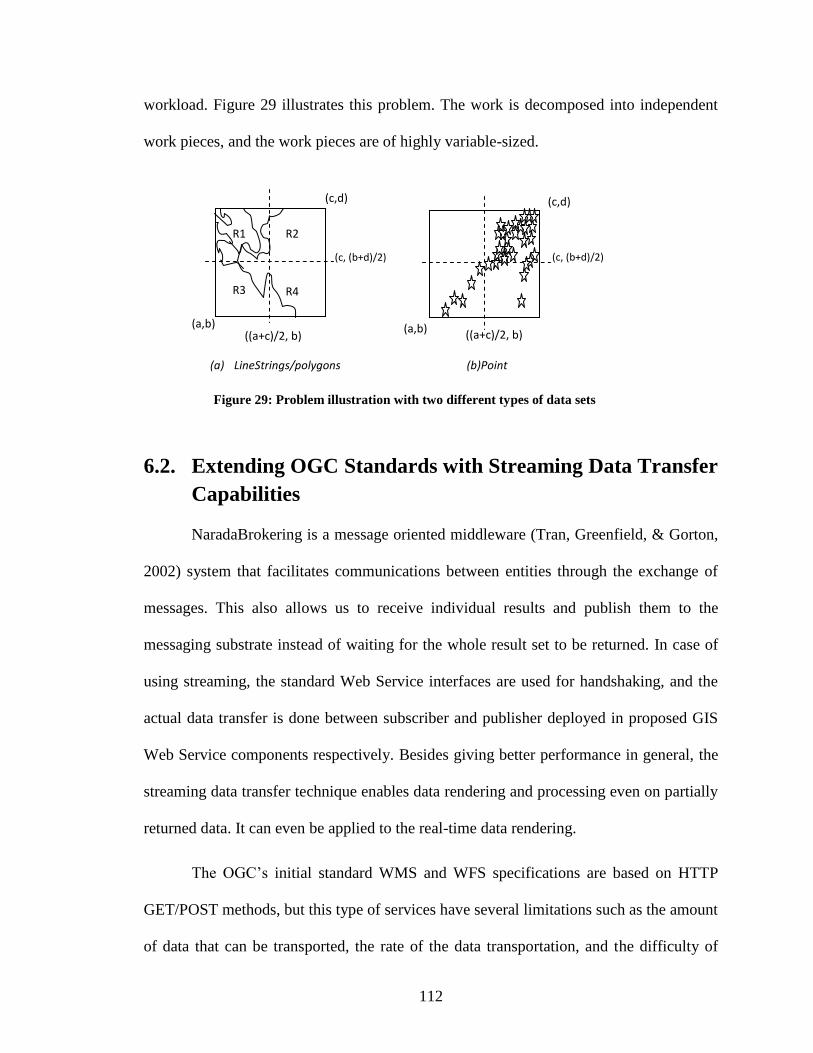
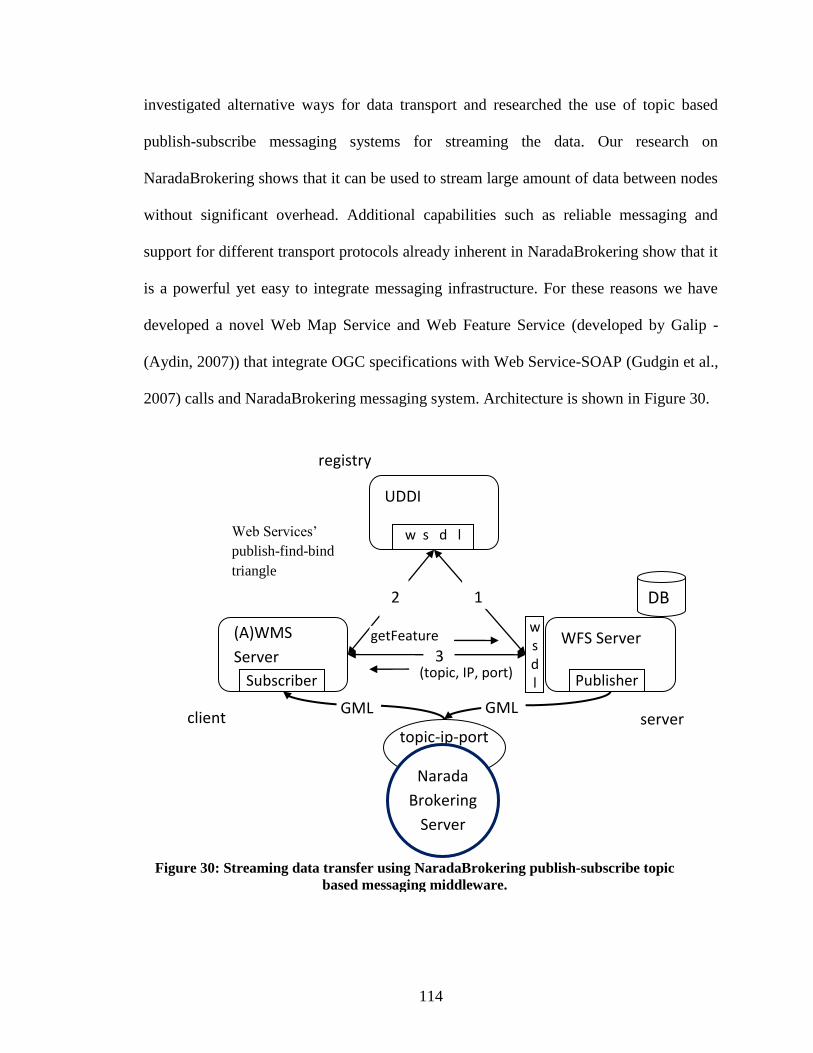
Figure 29: Problem illustration with two different types of data sets ............................. 112
Figure 30: Streaming data transfer using NaradaBrokering publish-subscribe topic based
messaging middleware. ................................................................................................... 114
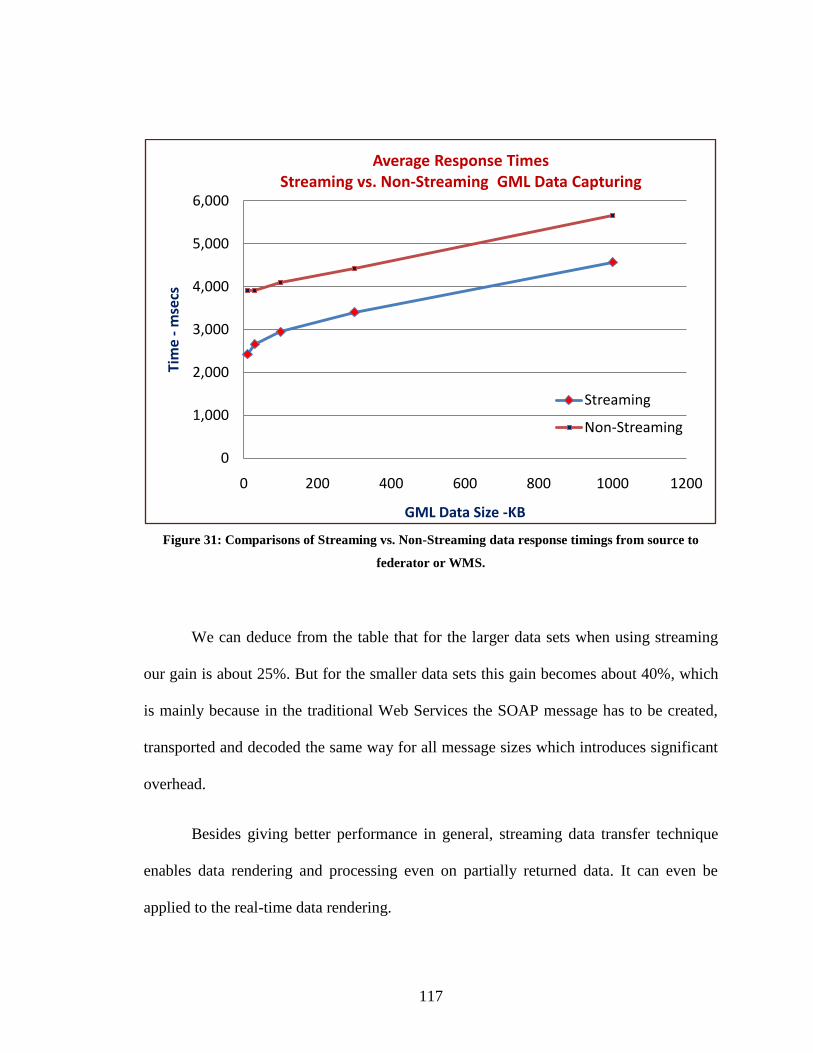
Figure 31: Comparisons of Streaming vs. Non-Streaming data response timings from
source to federator or WMS. ........................................................................................... 117
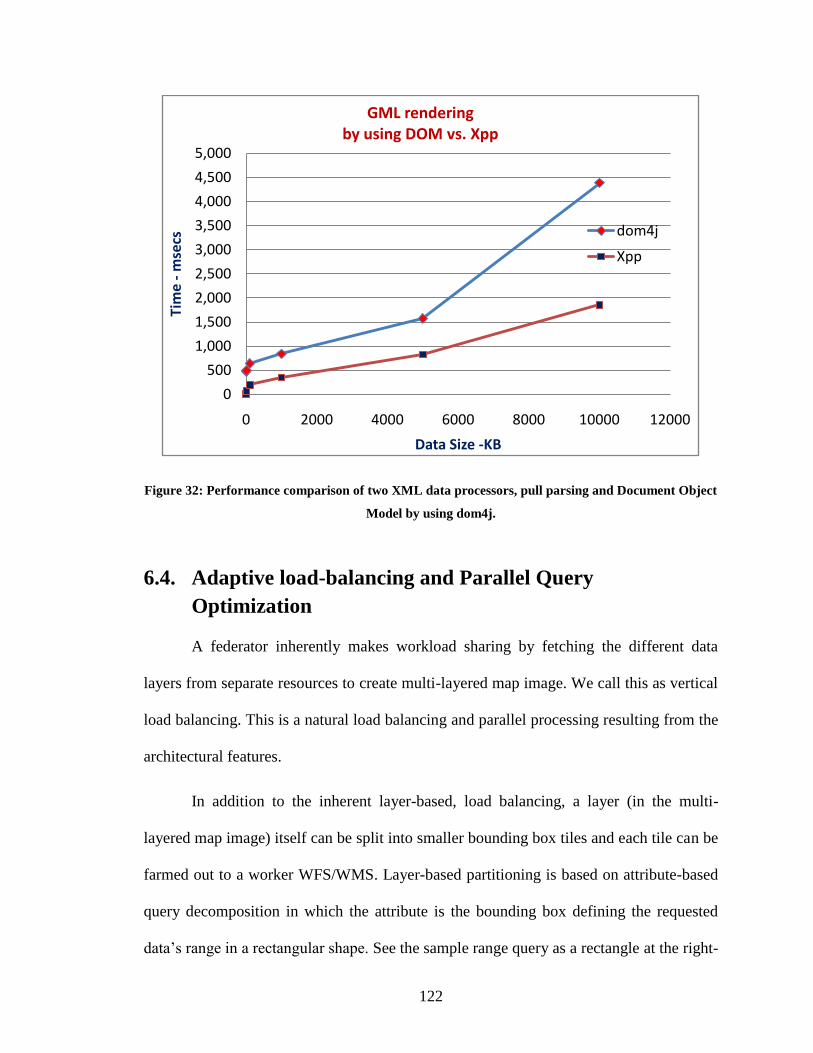
Figure 32: Performance comparison of two XML data processors, pull parsing and
Document Object Model by using dom4j. ...................................................................... 122
Figure 33: Architectural comparisons of parallel fetching with straightforward single
thread fetching ................................................................................................................ 123
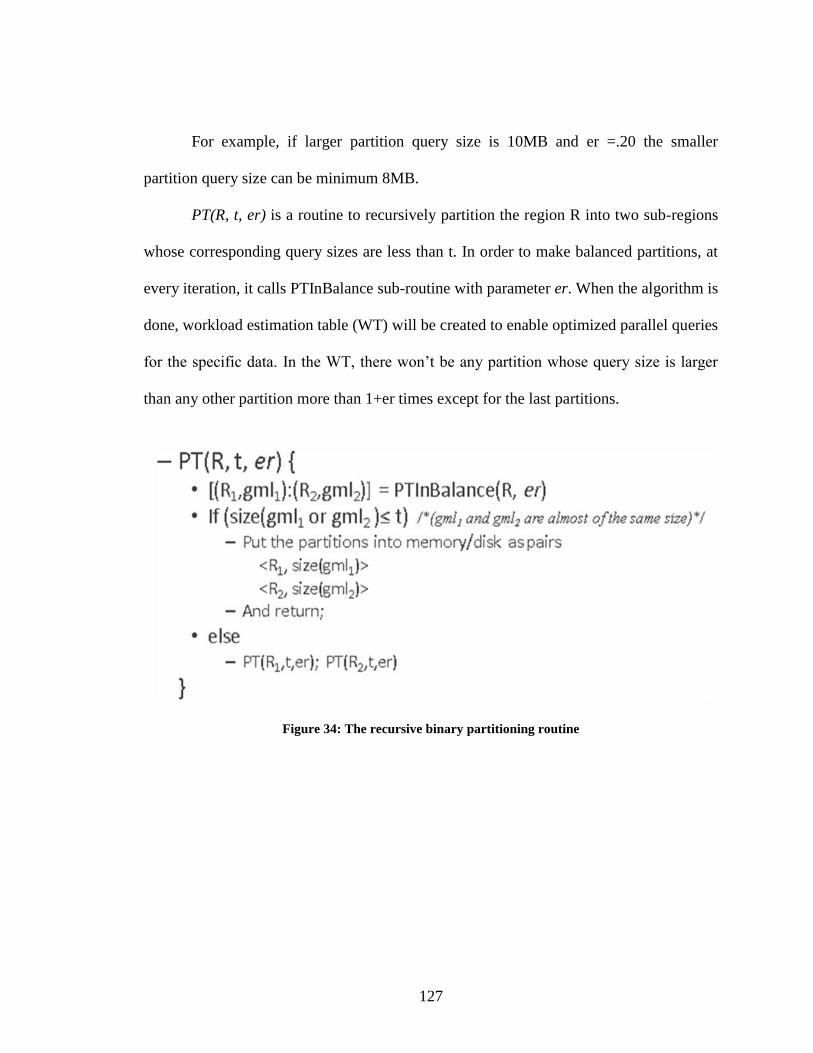
Figure 34: The recursive binary partitioning routine ...................................................... 127
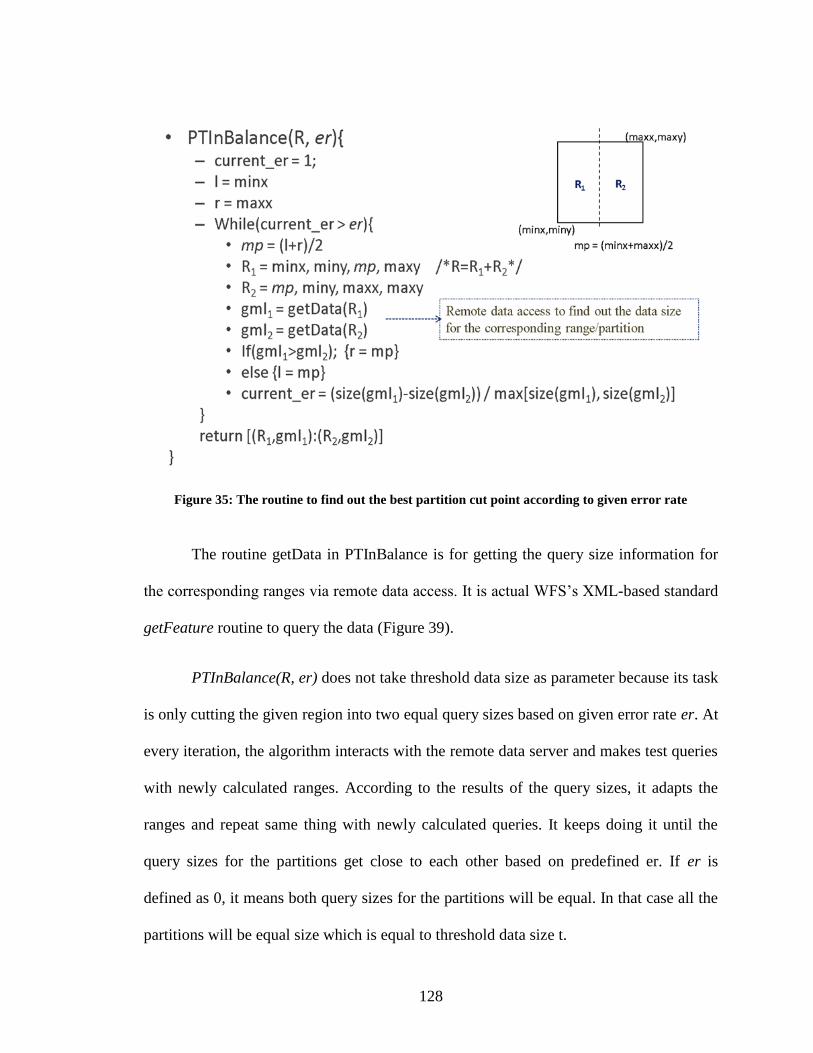
Figure 35: The routine to find out the best partition cut point according to given error rate
......................................................................................................................................... 128
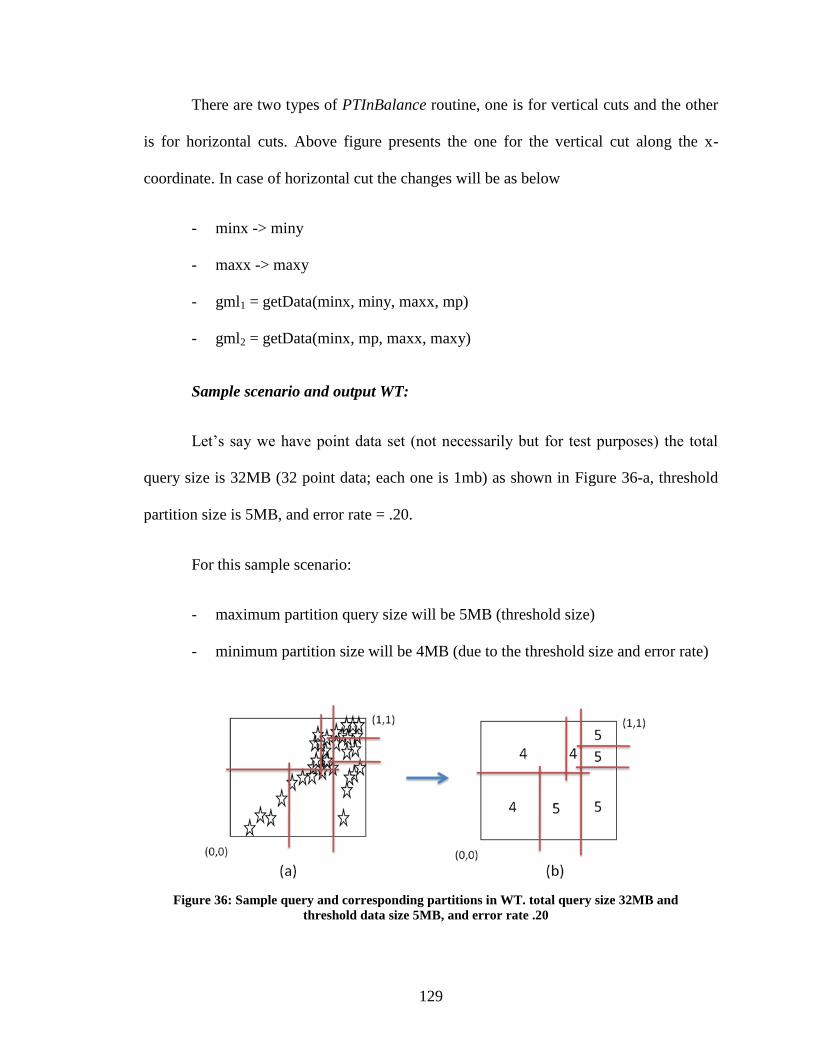
Figure 36: Sample query and corresponding partitions in WT. total query size 32MB and
threshold data size 5MB, and error rate .20 .................................................................... 129
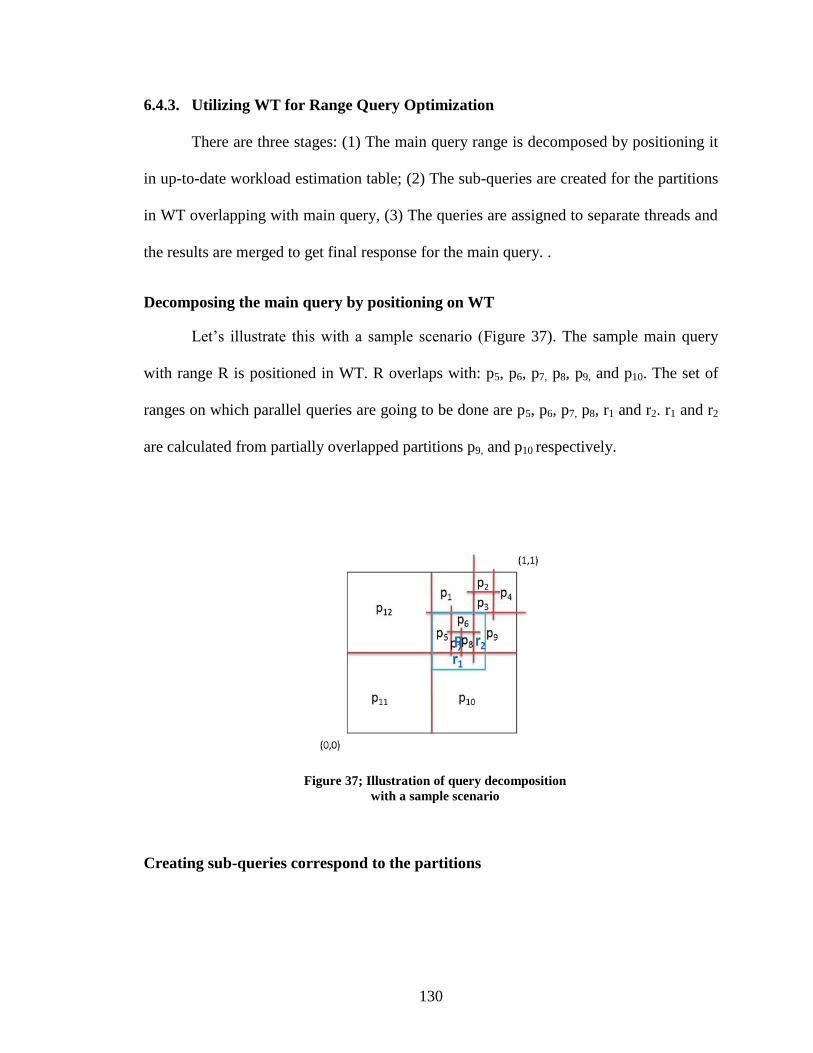
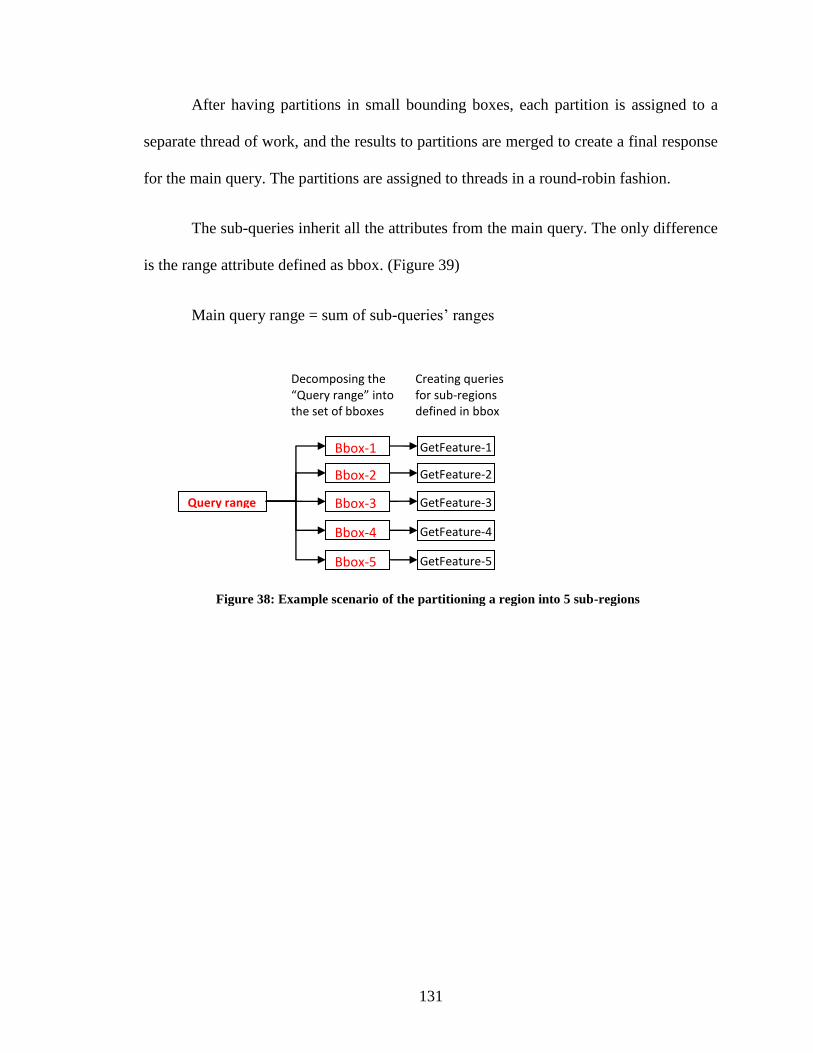
Figure 37; Illustration of query decomposition with a sample scenario ......................... 130
Figure 38: Example scenario of the partitioning a region into 5 sub-regions ................. 131
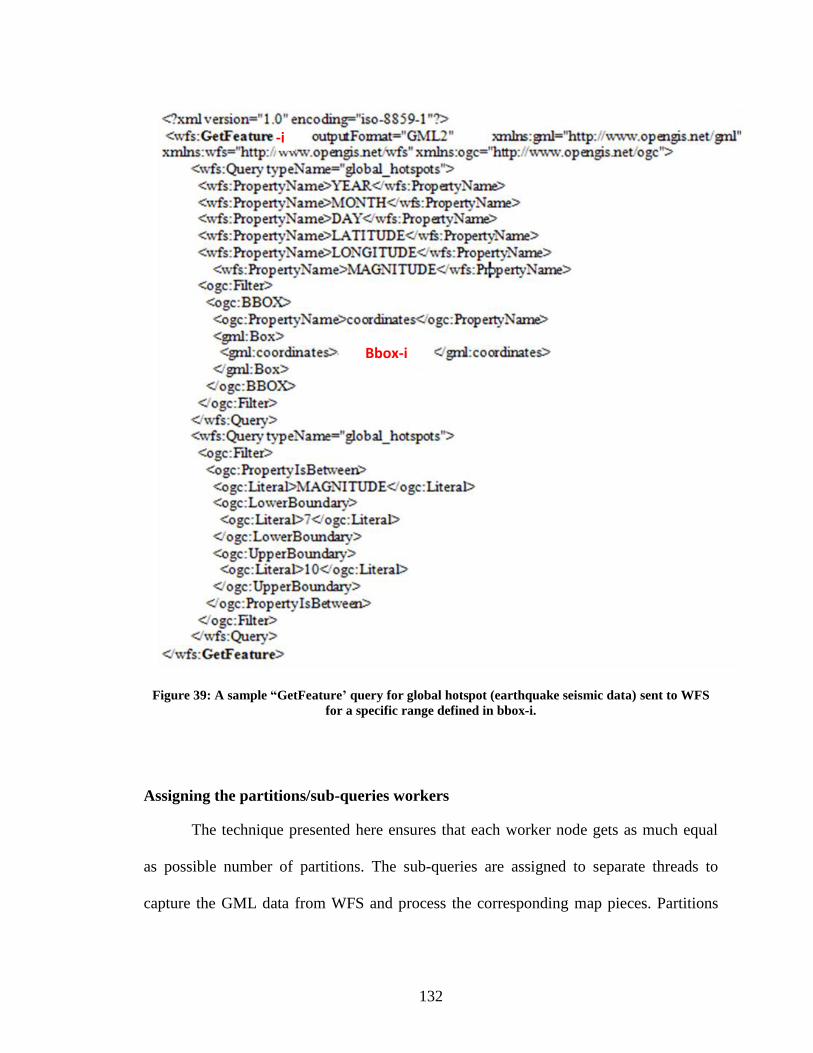
Figure 39: A sample “GetFeature‟ query for global hotspot (earthquake seismic data) sent
to WFS for a specific range defined in bbox-i. ............................................................... 132
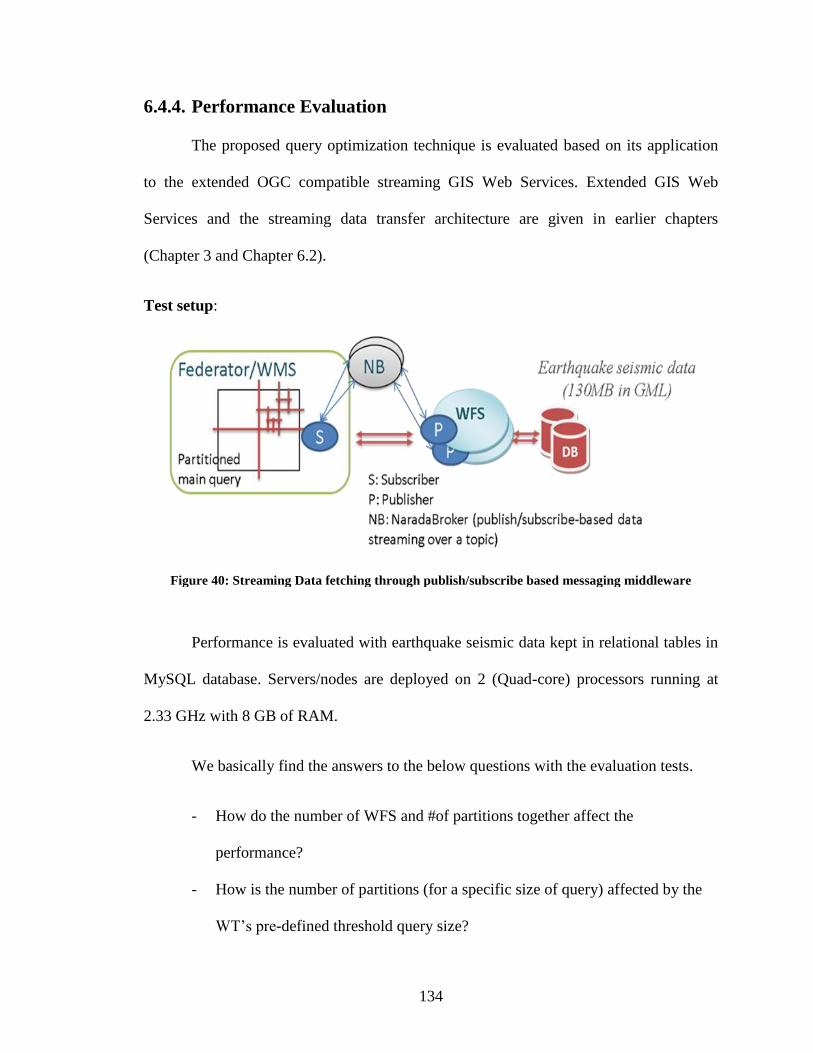
Figure 40: Streaming Data fetching through publish/subscribe based messaging
middleware ...................................................................................................................... 134
Page 13
xiii
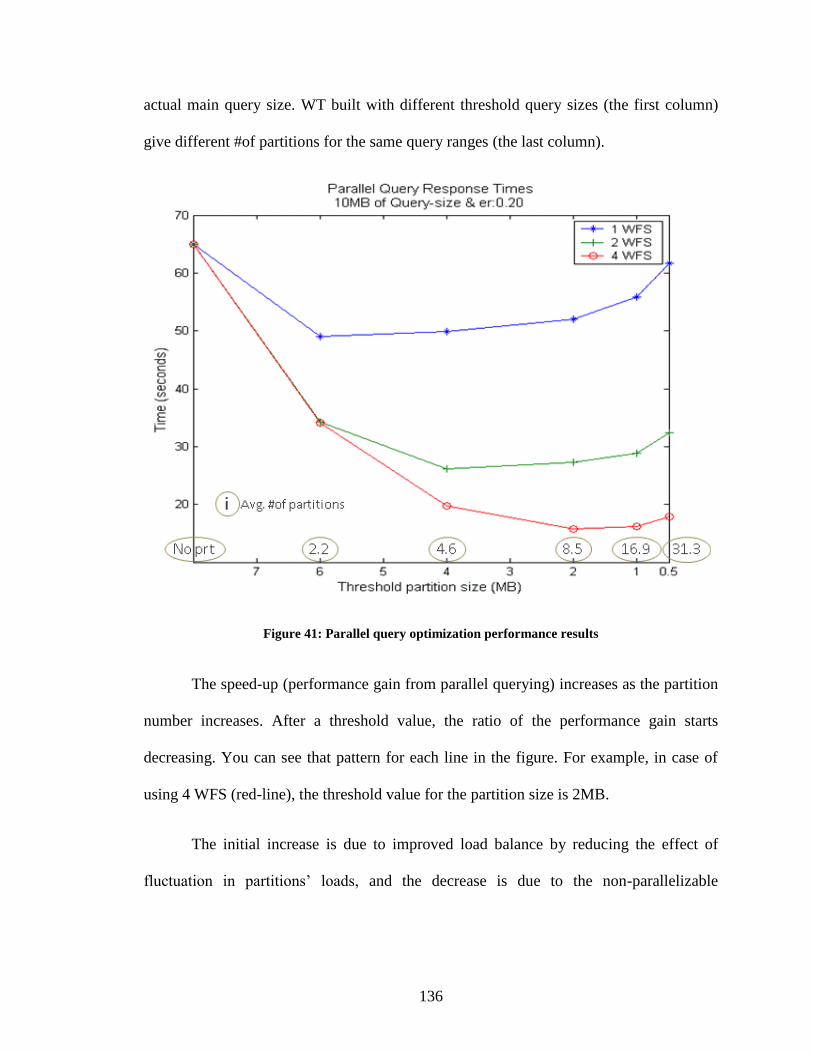
Figure 41: Parallel query optimization performance results ........................................... 136
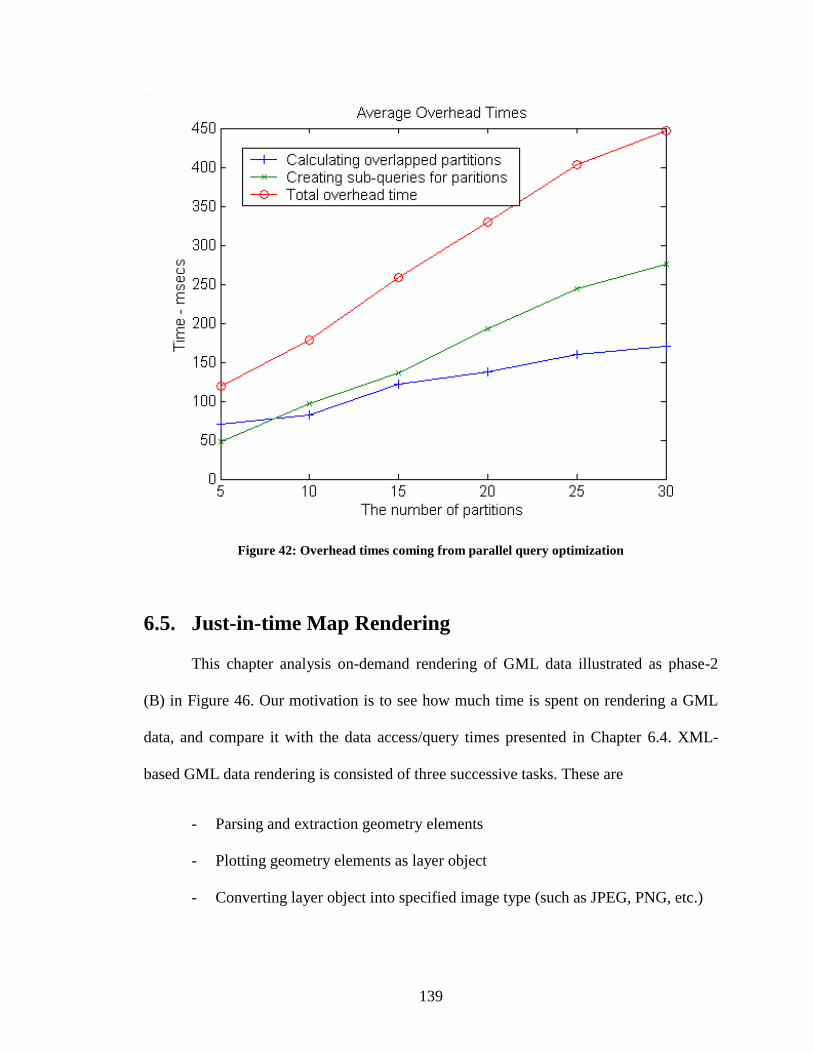
Figure 42: Overhead times coming from parallel query optimization ............................ 139
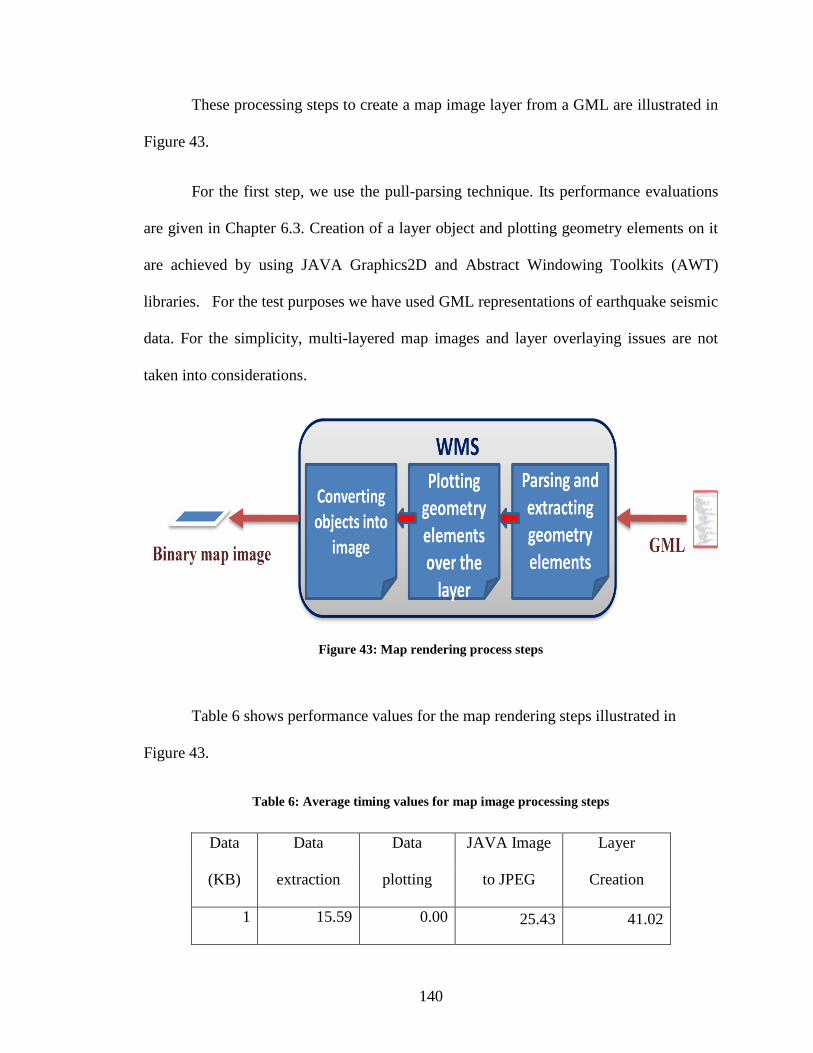
Figure 43: Map rendering process steps ......................................................................... 140
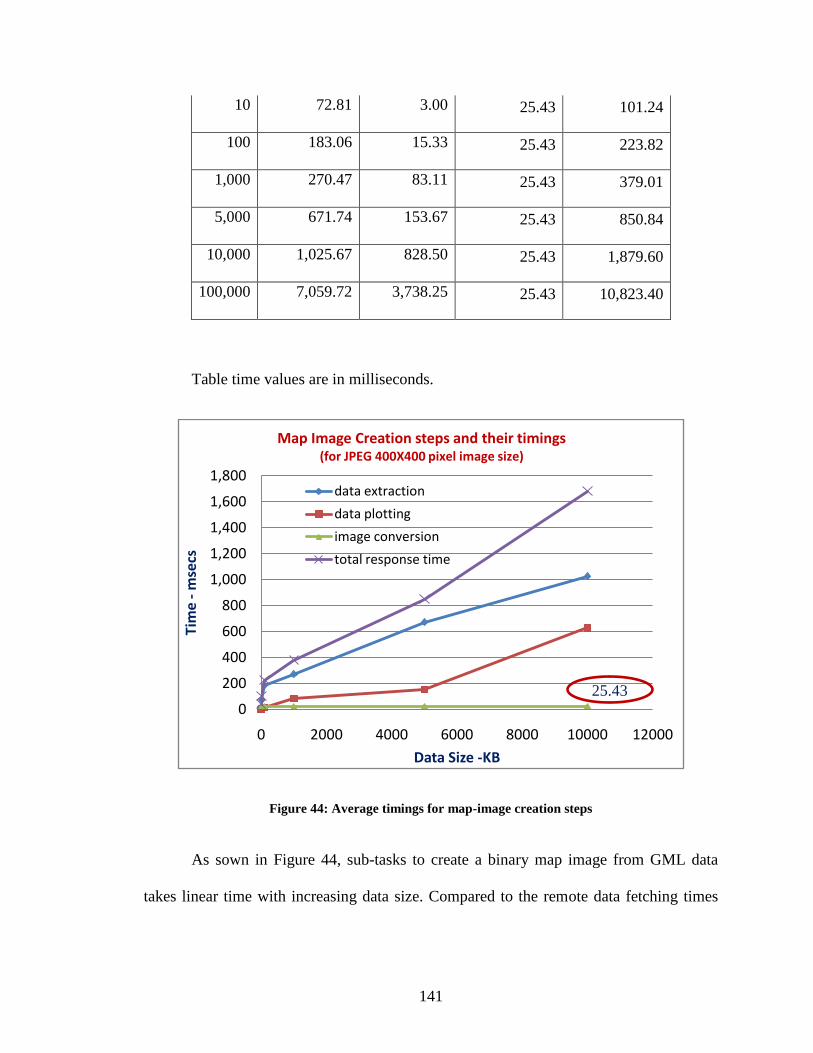
Figure 44: Average timings for map-image creation steps ............................................. 141
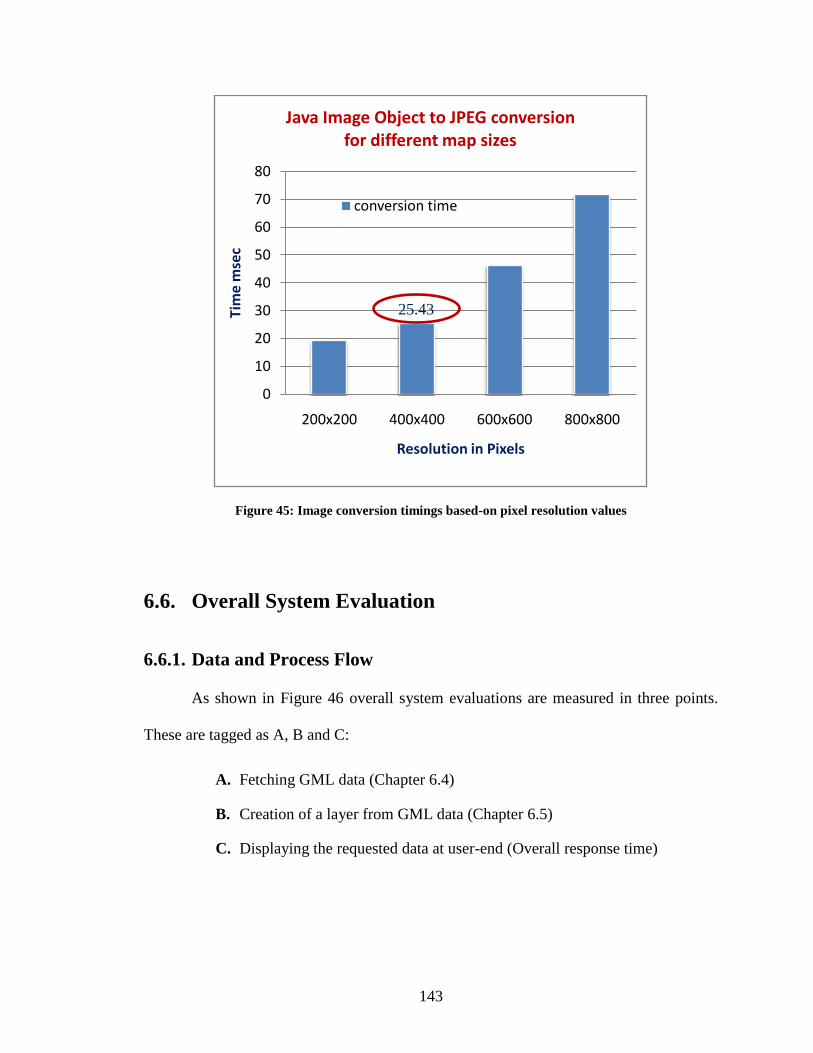
Figure 45: Image conversion timings based-on pixel resolution values ......................... 143
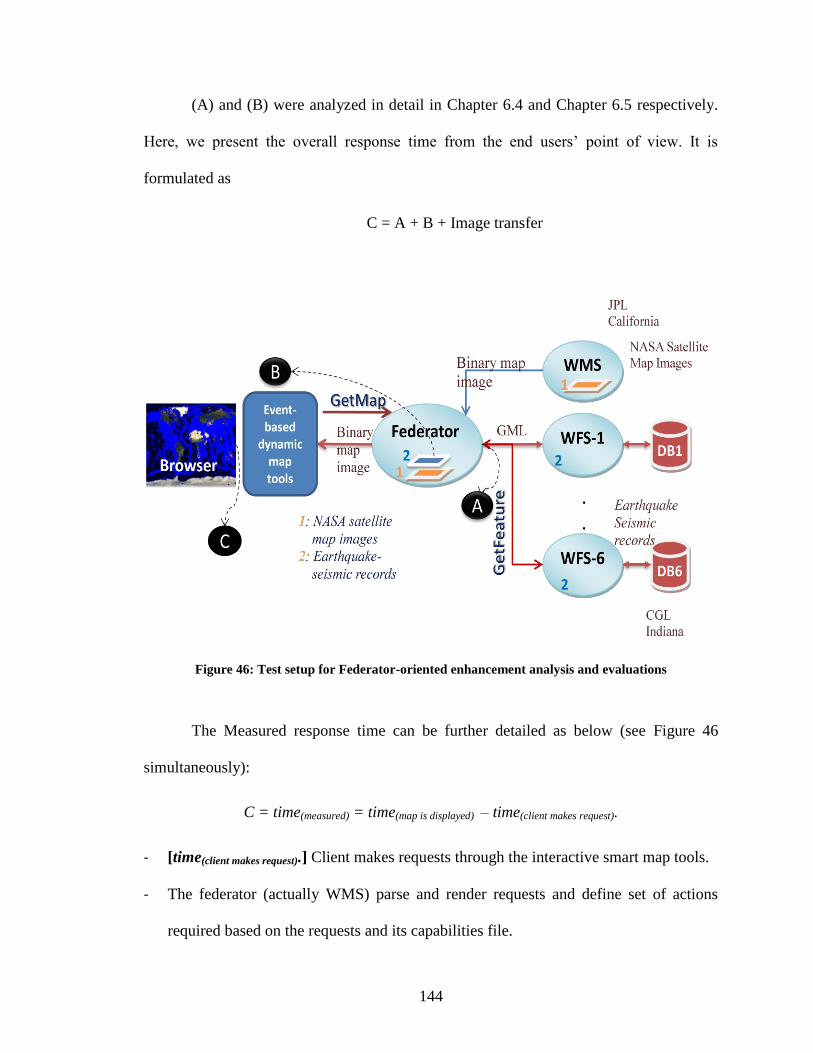
Figure 46: Test setup for Federator-oriented enhancement analysis and evaluations .... 144
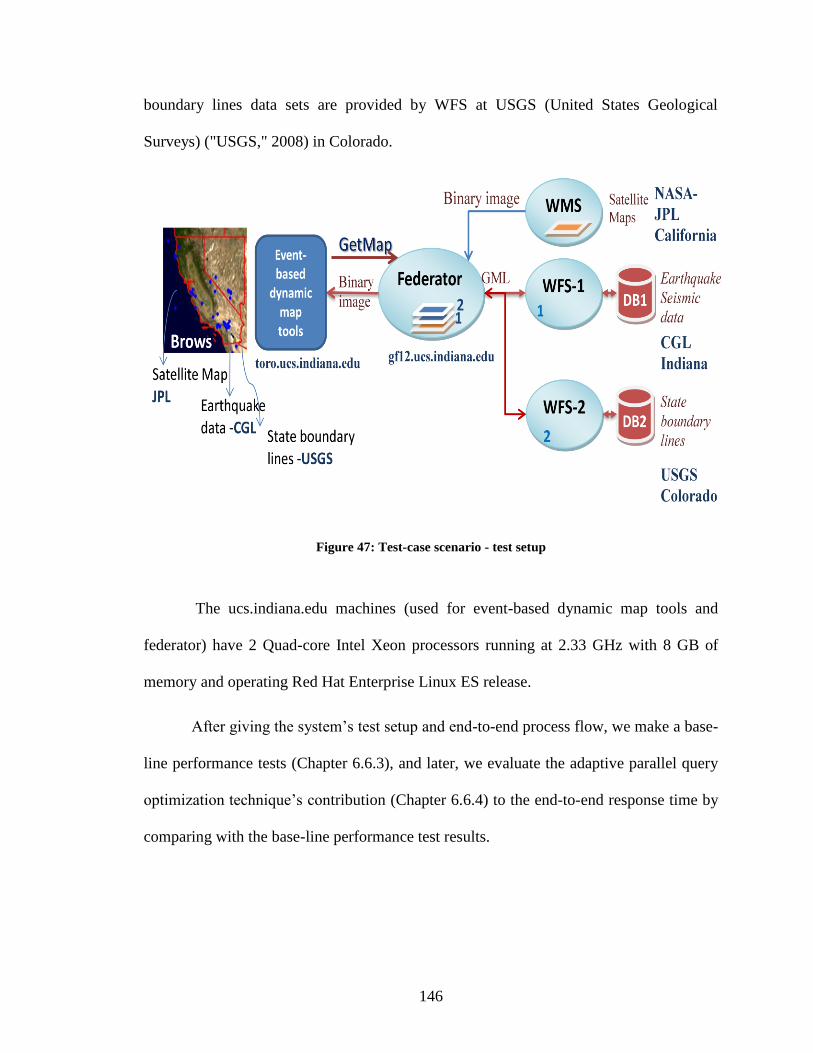
Figure 47: Test-case scenario - test setup ....................................................................... 146
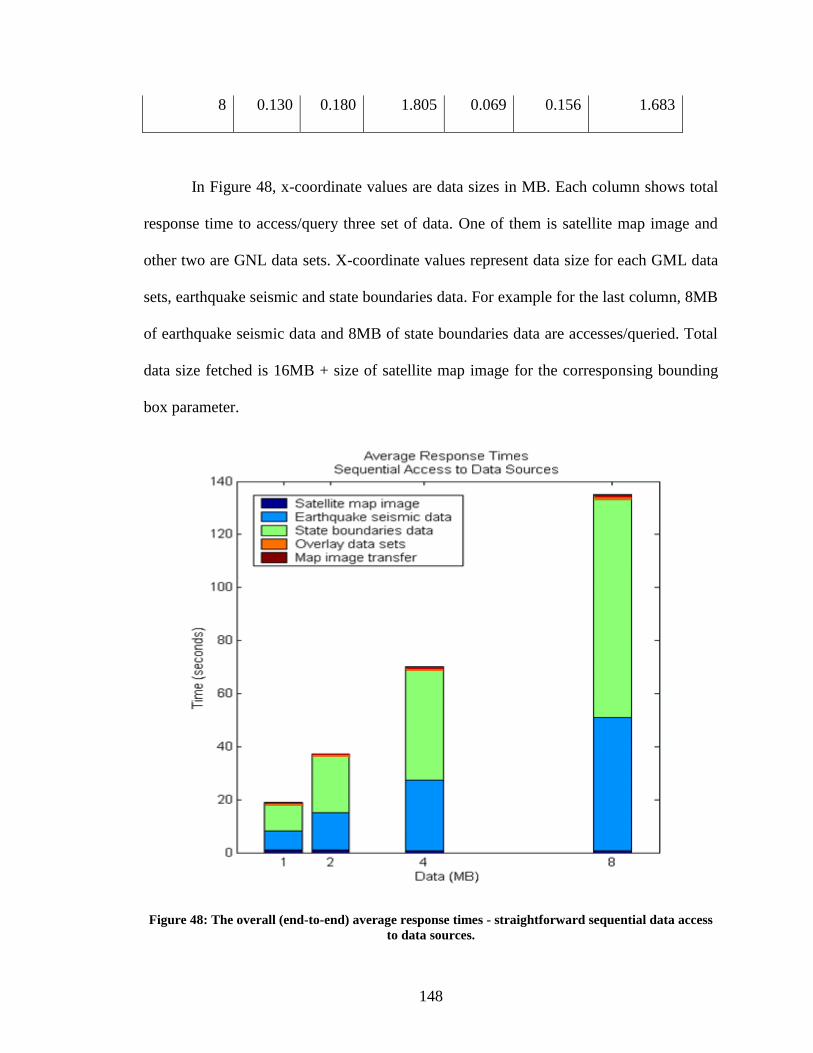
Figure 48: The overall (end-to-end) average response times - straightforward sequential
data access to data sources. ............................................................................................. 148
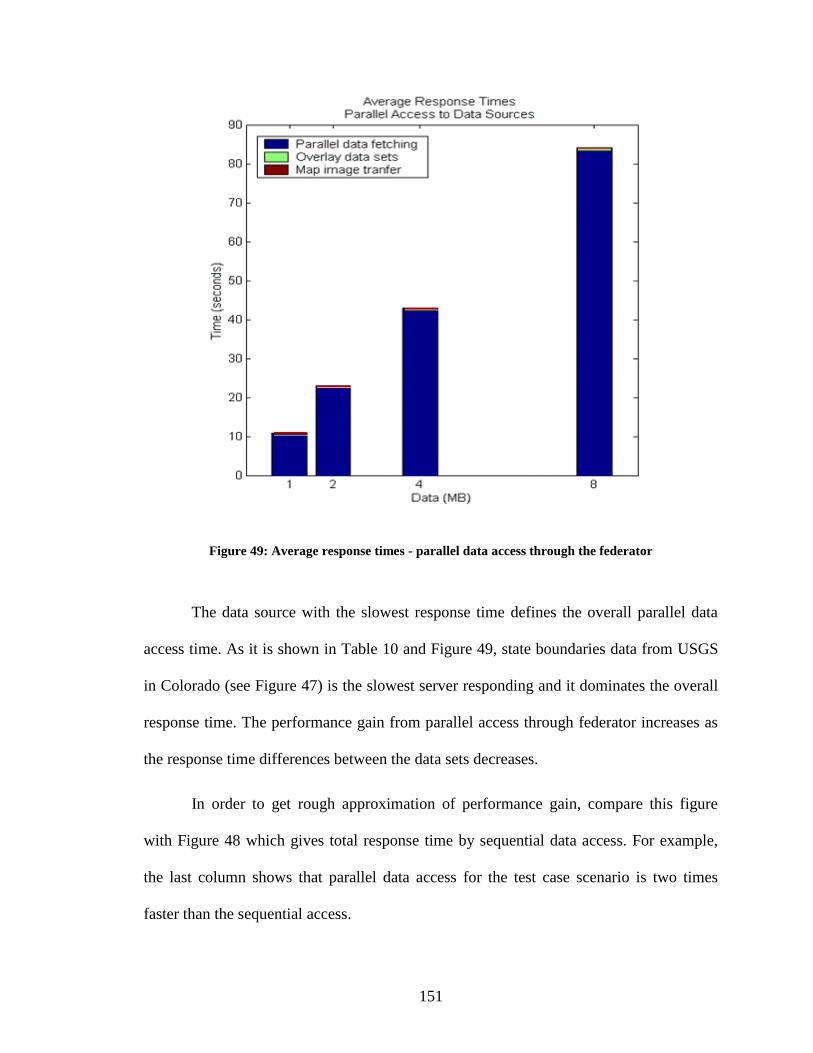
Figure 49: Average response times - parallel data access through the federator ............ 151
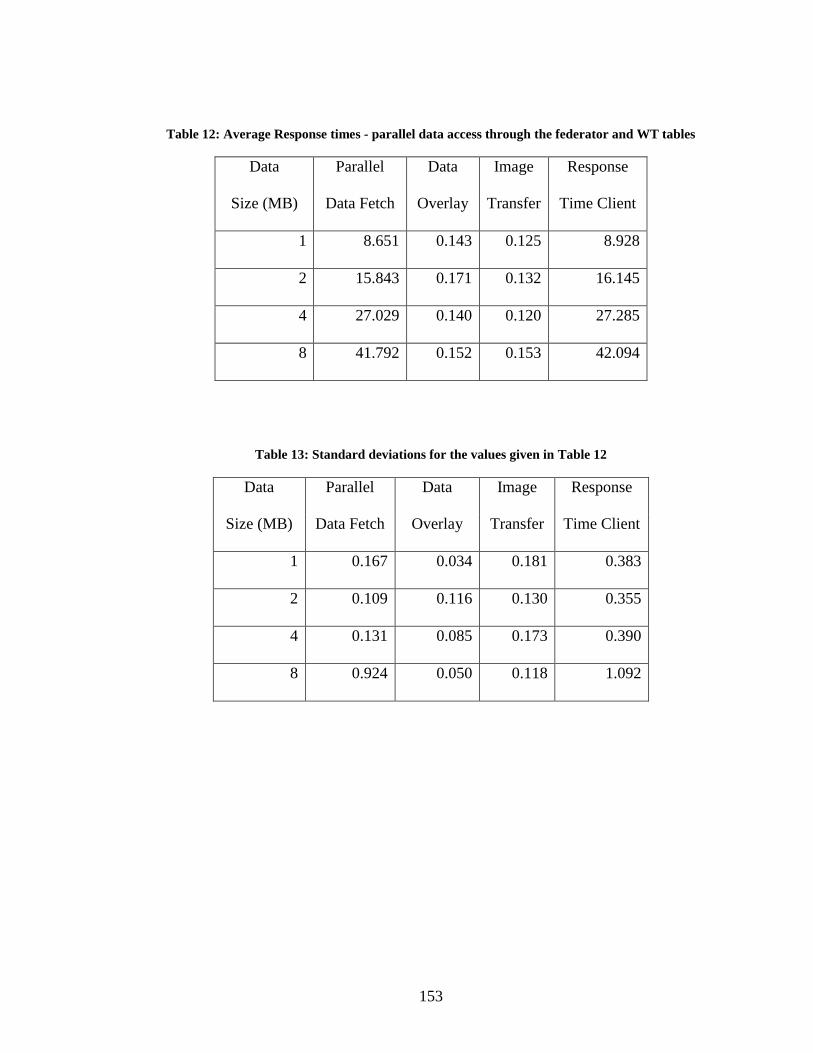
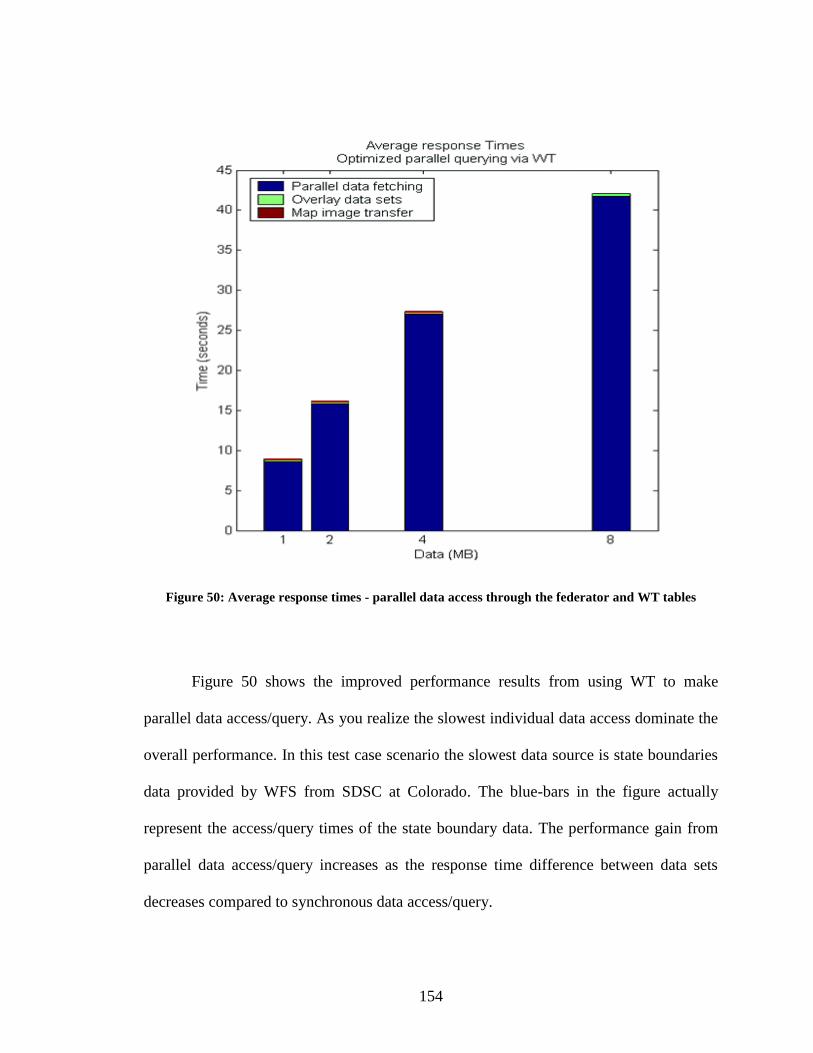
Figure 50: Average response times - parallel data access through the federator and WT
tables ............................................................................................................................... 154
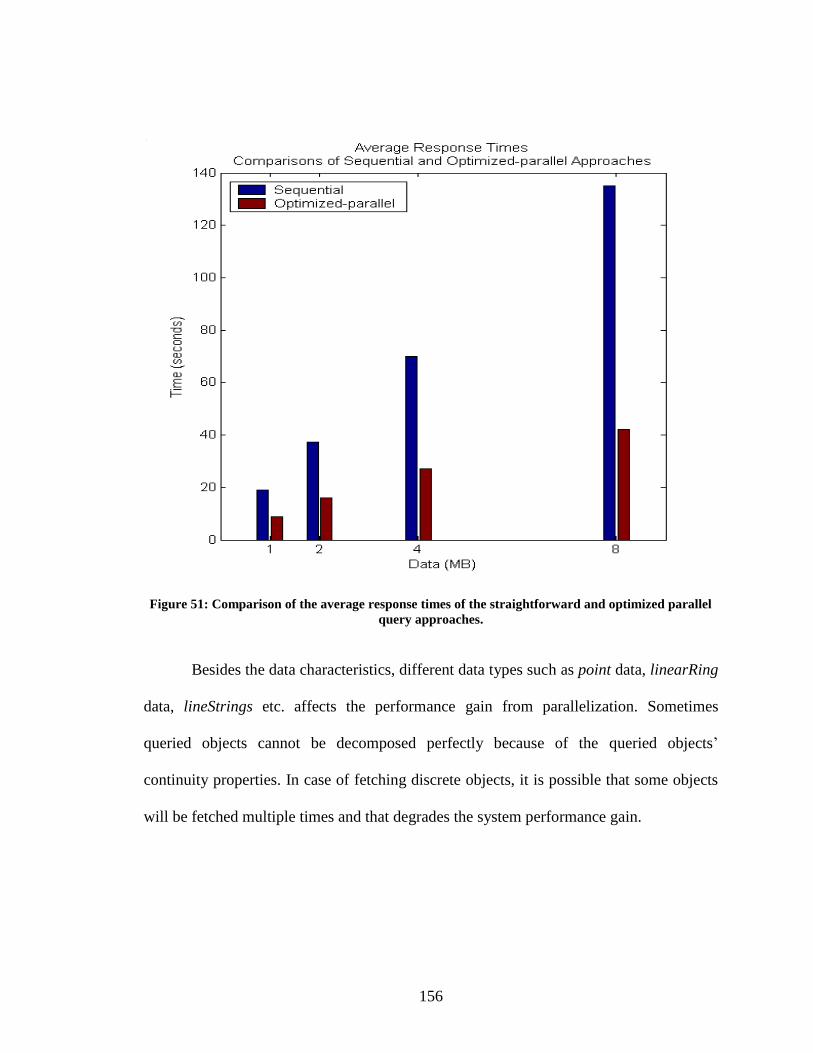
Figure 51: Comparison of the average response times of the straightforward and
optimized parallel query approaches. ............................................................................. 156
Figure 52: Application Specific Information System (ASIS) ......................................... 159
Page 14
xiv
LIST OF TABLES
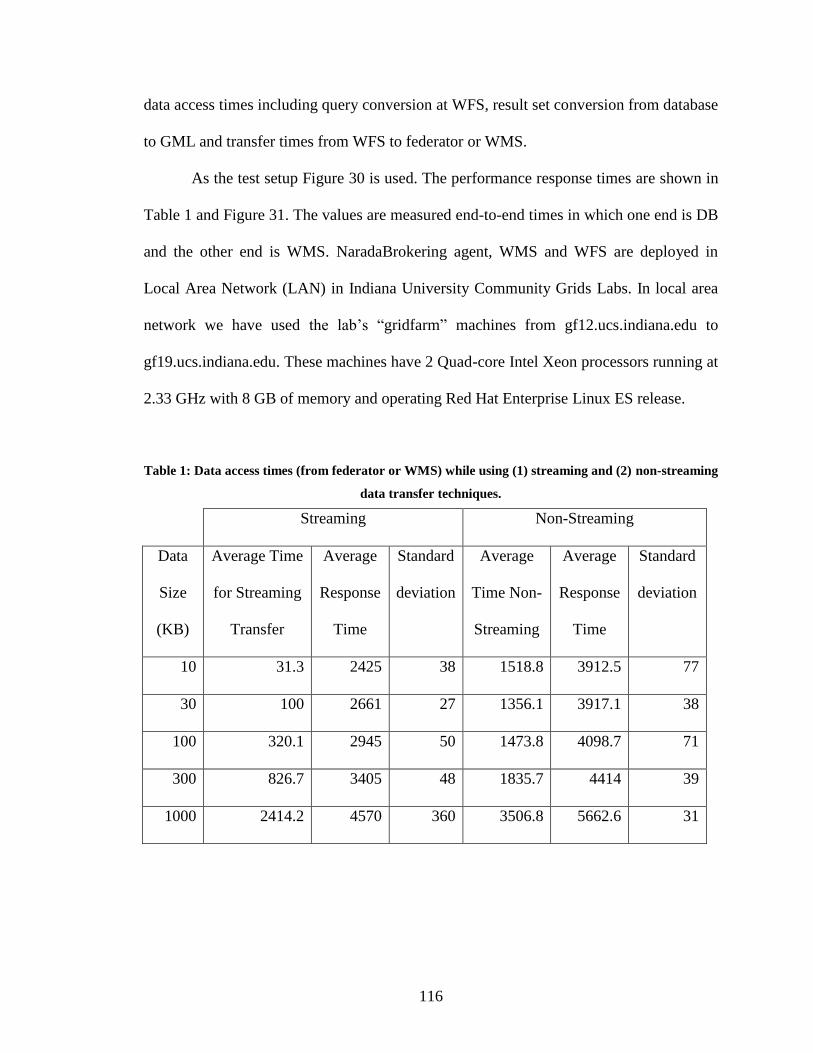
Table 1: Data access times (from federator or WMS) while using (1) streaming and (2)
non-streaming data transfer techniques. ......................................................................... 116
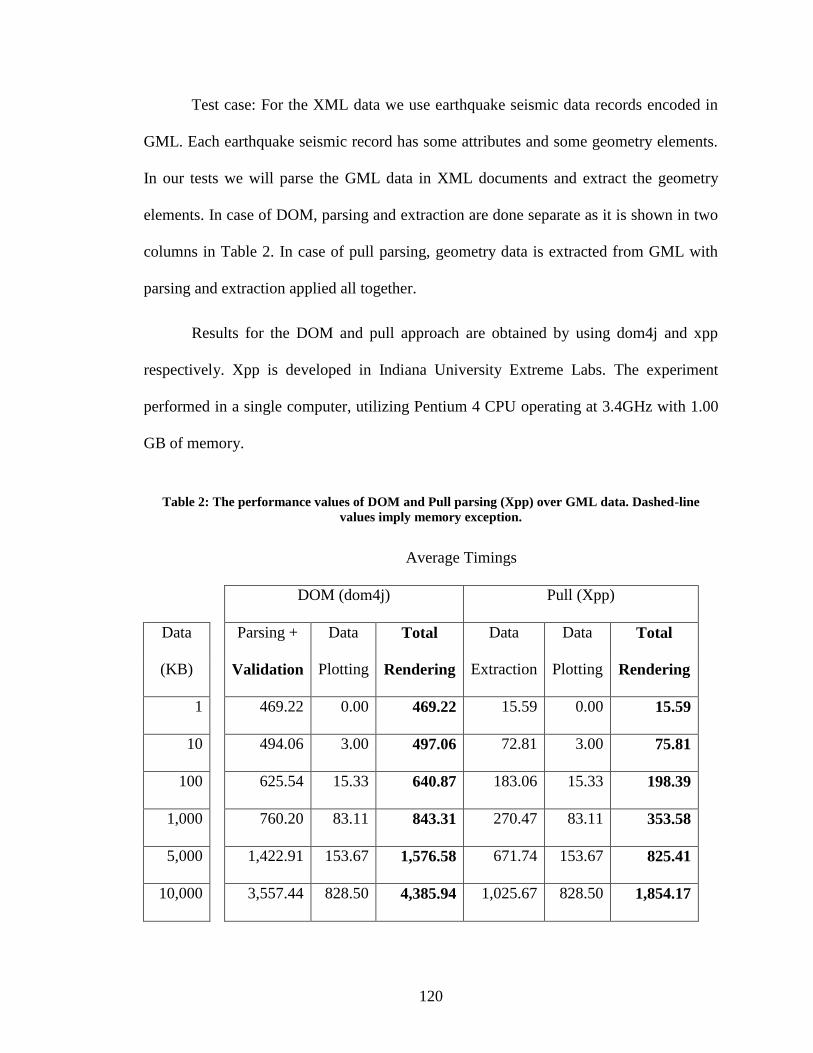
Table 2: The performance values of DOM and Pull parsing (Xpp) over GML data.
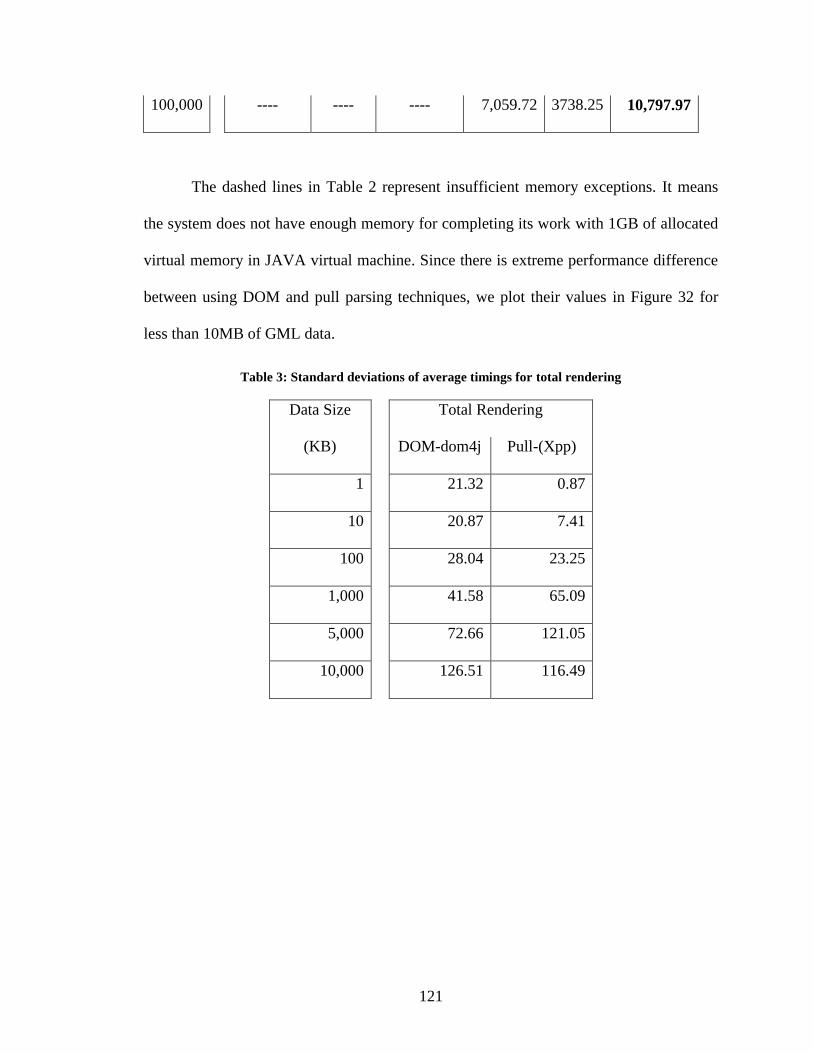
Dashed-line values imply memory exception. ................................................................ 120
Table 3: Standard deviations of average timings for total rendering .............................. 121
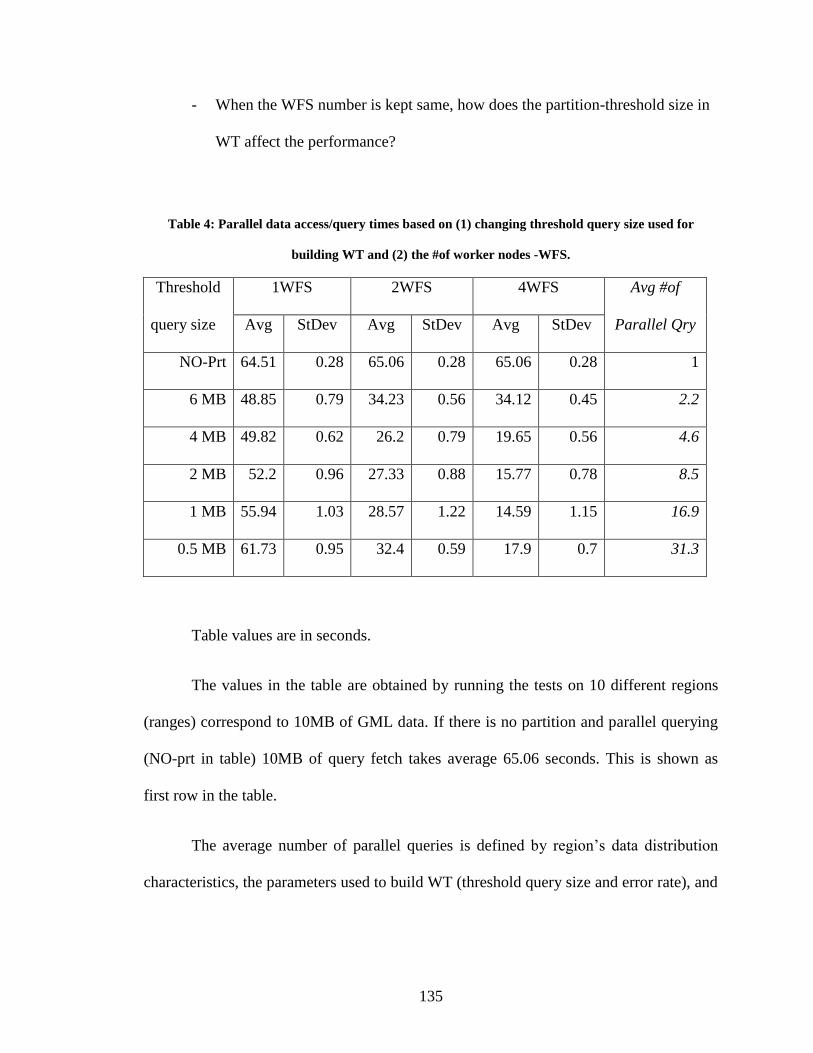
Table 4: Parallel data access/query times based on (1) changing threshold query size used
for building WT and (2) the #of worker nodes -WFS. ................................................... 135
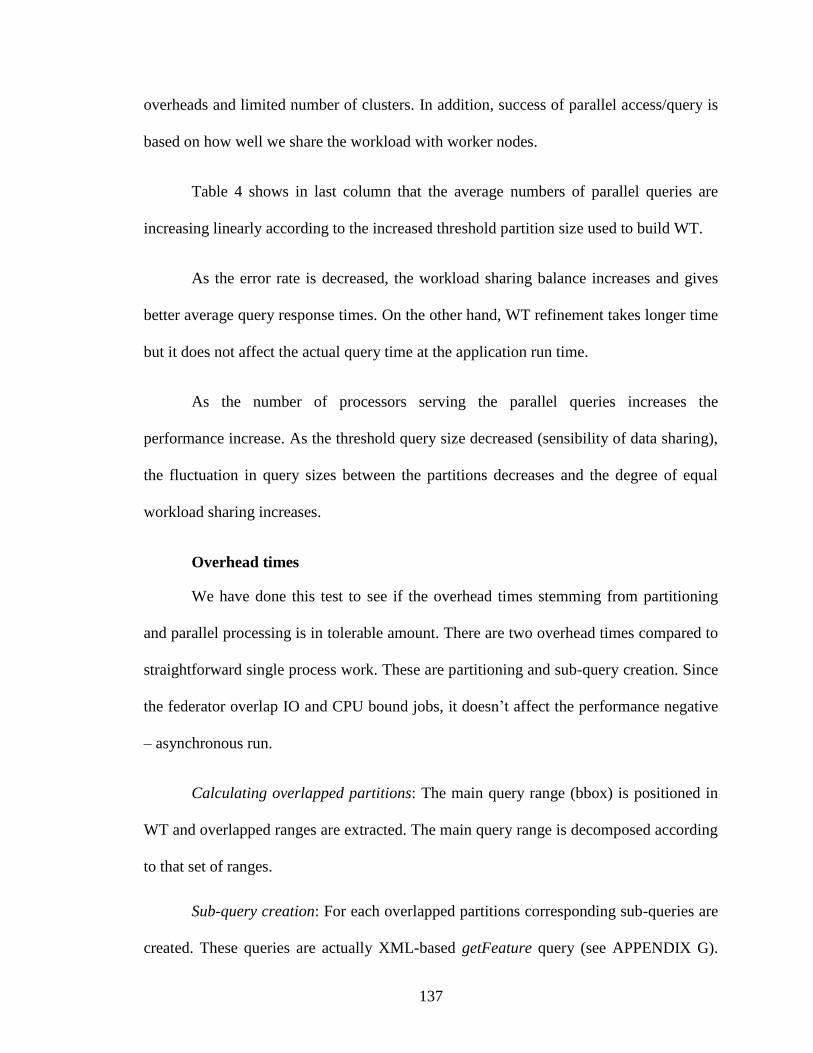
Table 5: Overhead times based on number of partitions to be applied ........................... 138
Table 6: Average timing values for map image processing steps ................................... 140
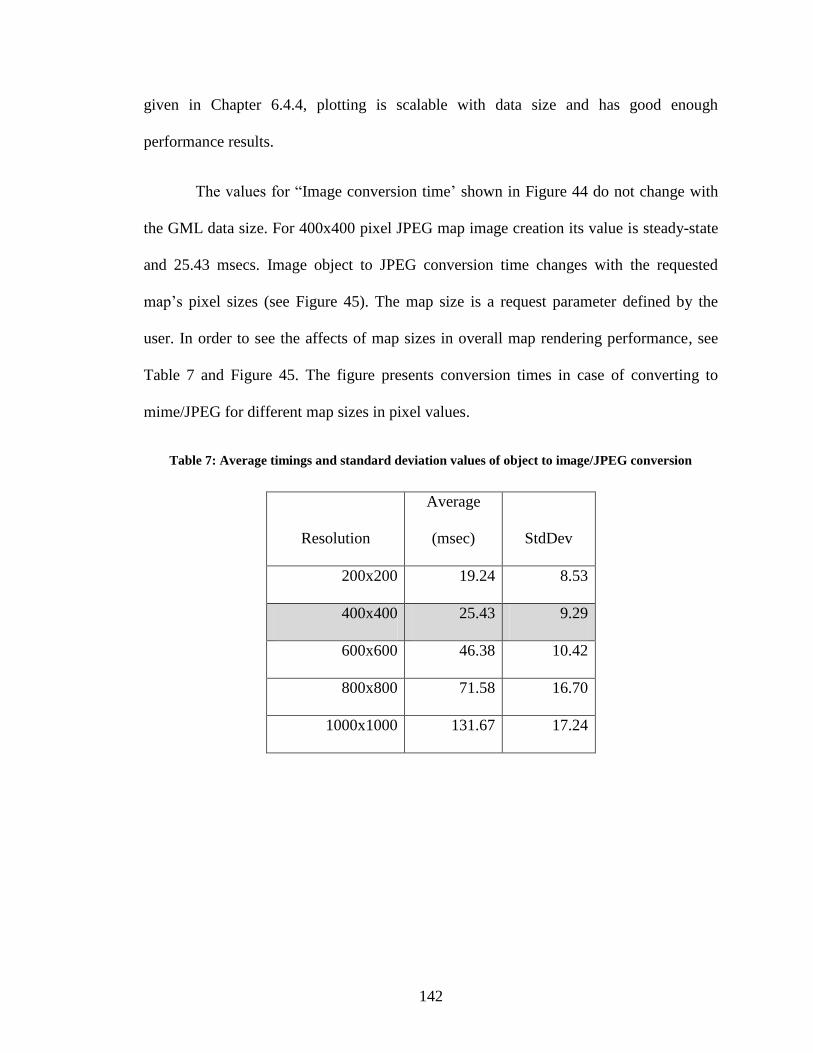
Table 7: Average timings and standard deviation values of object to image/JPEG
conversion ....................................................................................................................... 142
Table 8: The average response times for straightforward sequential data access ........... 147
Table 9: The standard deviations for the average response times given in Table 8 ....... 147
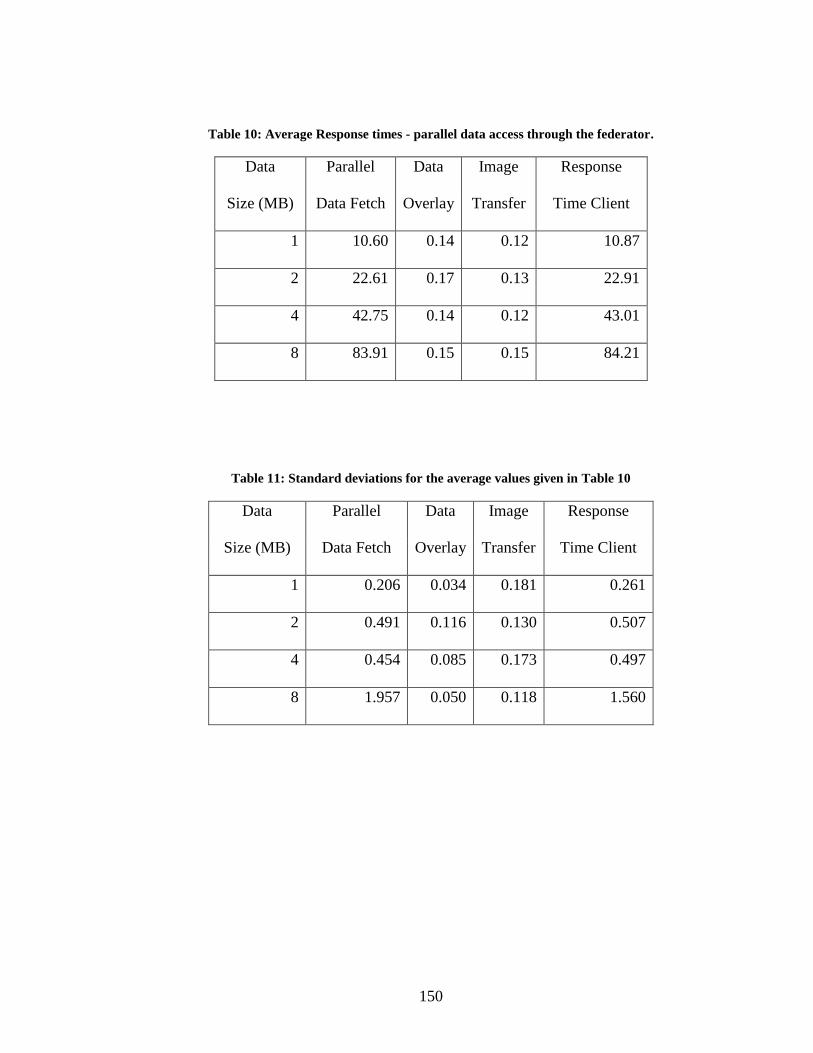
Table 10: Average Response times - parallel data access through the federator. ........... 150
Table 11: Standard deviations for the average values given in Table 10 ....................... 150
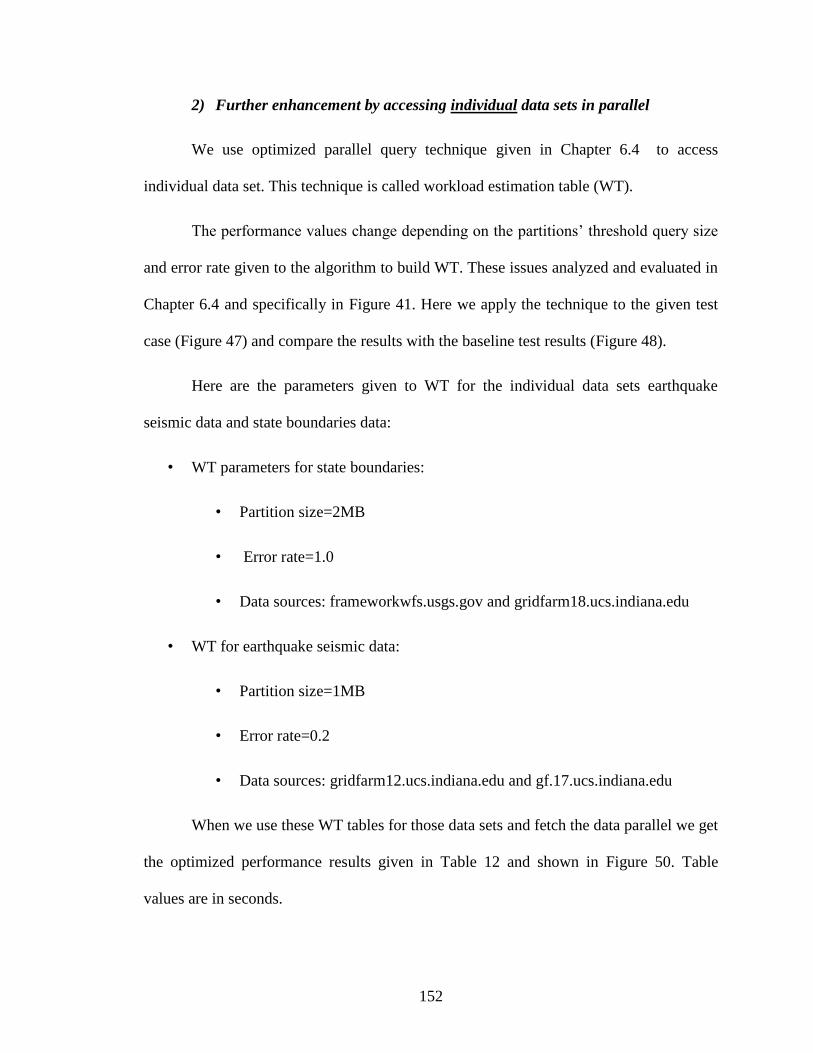
Table 12: Average Response times - parallel data access through the federator and WT
tables ............................................................................................................................... 153
Table 13: Standard deviations for the values given in Table 12 ..................................... 153
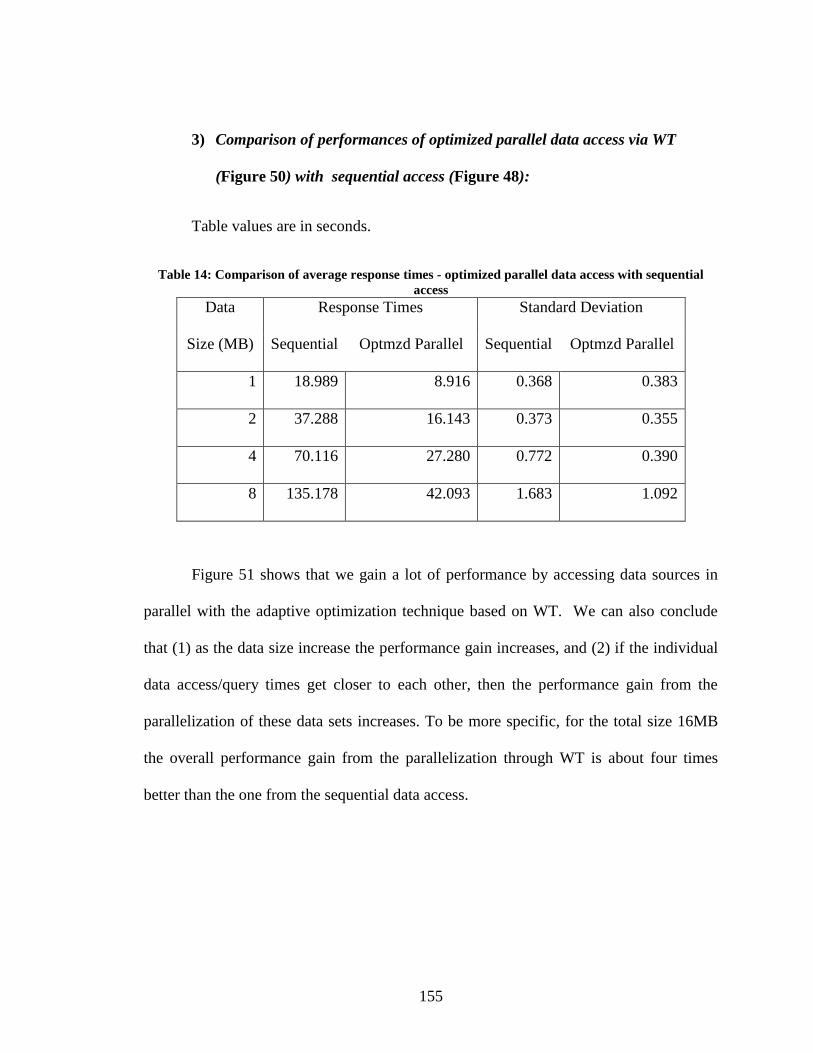
Table 14: Comparison of average response times - optimized parallel data access with
sequential access ............................................................................................................. 155
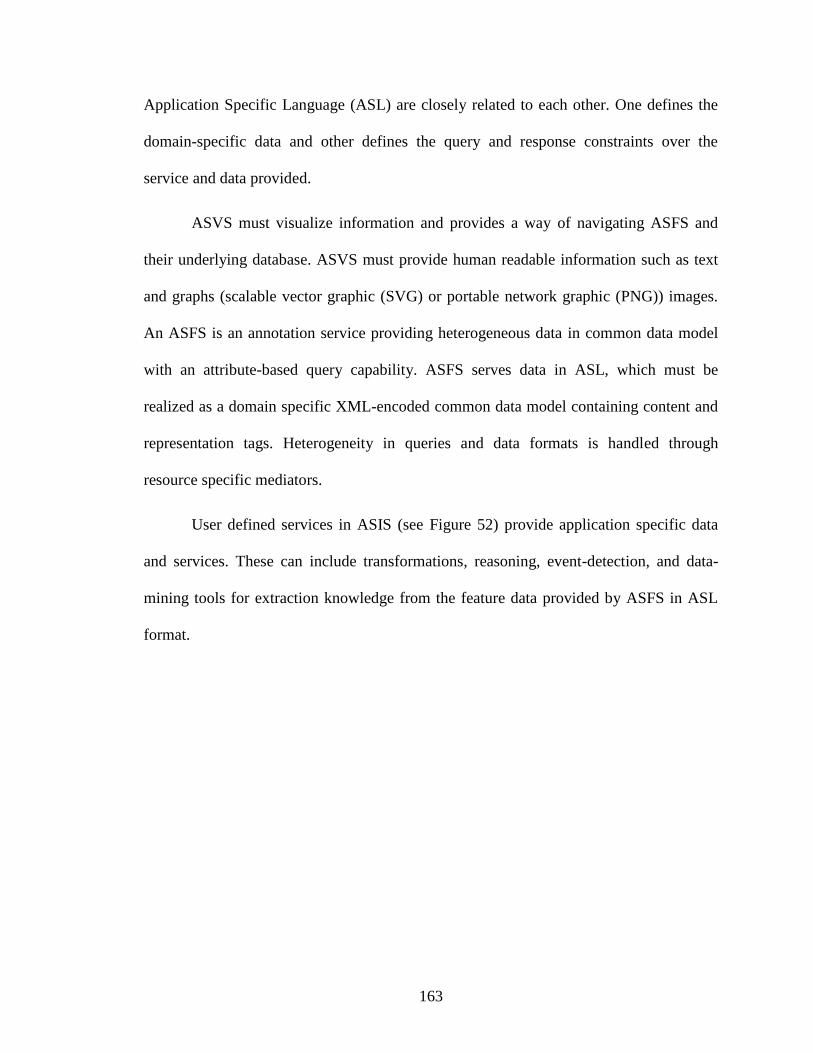
Table 15: Components and common data model matching for generalization of GIS to
ASIS. Two selected domains are Astronomy and Chemistry. ........................................ 164
Page 15
1
CHAPTER 1
INTRODUCTION
Geospatial information is critical to effective and collaborative decision-making
in earth-related geo-science applications such as disaster planning, crisis management,
early-warning systems and urban planning. Decision making in Geographic Information
Systems (GIS) (Delaney, 2007) increasingly relies on analyses of spatial data in map-
based formats. Maps are complex structures composed of layers created from distributed
heterogeneous data and computational resources belonging to separate virtual
organizations from various expert skill levels.
We propose a Service-oriented Architecture (SOA) (Erl, 2005) for understanding
and managing the production of knowledge from distributed observations, simulations
Page 16
2
and analysis through integrated data-views in the form of multi-layered map images
(Chapter 4). Our proposed distributed infrastructure is based on a common data model,
standard GIS Web-Service components, and a federator component. The federator
federates standard GIS data services and enables unified data access/query and
display/analysis over integrated data-views through event-based interactive display tools
(Section 3.3.3). Integrated data-views are defined in the federator‟s capability metadata as
composition of layers provided by standard GIS Web-Services. Our grid approach is
based on the WS-I+ Interoperability standards ("WS-I," 2002).
1.1. Motivation
Geographic Information Systems (GIS) are systems for creating, storing, sharing,
analyzing, manipulating and displaying spatial data and associated attributes. The
general purpose of GIS is extracting information/knowledge from the raw geo-data. The
raw data is collected from sensors, satellites or other sources and stored in databases or
file systems. The data goes through the filtering and rendering services and is presented
to the end-users in human recognizable formats such as images, graphs, charts, etc. GIS is
used in a wide variety of tasks such as urban planning, resource management, emergency
response planning in case of disasters, crisis management and rapid responses, to name a
few.
Over the past decade, GIS has evolved from the traditional centralized mainframe
systems to desktop systems to modern collaborative distributed systems. Centralized
systems provide an environment for stand-alone applications in which data sources,
rendering and processing services are all tightly coupled and application specific.
Therefore, they are not capable of allowing seamless interaction with the other data or
Page 17
3
processing/rendering services. On the other hand, the distributed systems are composed
of geographically distributed and loosely coupled autonomous hosts that are connected
through a computer network. They aim to share data and computation resources
collaborating on large scale applications.
Modern collaborative GIS requires data and computation resources from
distributed virtual organizations to be composed based on application requirements, and
accessed and queried from a single uniform access point over the refined data with
interactive display tools. This requires seamless integration and interaction of data and
computation resources. The resources span over organizational disciplinary and technical
boundaries and use different client-server models, data archiving systems and
heterogeneous message transfer protocols.
Furthermore, GIS is particularly used in emergency early-warning systems like
homeland security and natural disasters (earthquake, floods, etc), and crisis management
applications require quick responses. However, because of the characteristics of geo-data
(large and unevenly distributed data such as the distribution of human population and
earthquake seismic events), time-consuming rendering processes and limited network
bandwidth, the increasing and optimizing performance and responsiveness stand as the
toughest challenges in distributed modern GIS (Peng & Tsou, 2003).
These problems have motivated us to research the application of techniques in
distributed and service oriented computing to Geographic Information Systems. As a
consequence of this research, we have developed a framework that enables sharing and
integration of heterogeneous data and computational resources for the collaborative
decision support applications requiring quick response times.
Page 18
4
1.2. Why Federation
The compassable nature of the standard GIS data services (Web Map Service and
Web Feature Service) (Chapter 3) inspired us to develope a federated information system
framework enabling both application-based hierarchical data definitions (architectural
features) (Chapter 4) and high performance designs based on load-balancing and parallel
processing (high performance features) (Chapter 6).
Our proposed federated service-oriented information system framework (Chapter
4) must support collaborative decision making over integrated data views, described in a
layer-structured hierarchical data provided by a federator. The users access the system as
though all the data and functions come from one site. The data distribution and
connection paths stay hidden and formulated as hierarchical data defined in federator‟s
capability metadata (see Section 4.1.1). The users access the system through integrated
data-views (maps) with the event-based interactive mapping display tools. Tools create
abstract queries from the users‟ actions through action listeners and communicate with
the system through the federator.
Federation is based on federating service-oriented standard GIS Web Services‟
capabilities metadata and their standard service interfaces describing data access/query
and rendering. Capability (for more information see APPENDIX B and C) is a metadata
about the data and services together. It includes information about the data and
corresponding operations with the attribute-based constraints and acceptable
request/response formats. It also enables developing application-based, standard,
interactive, re-usable client tools for data access/query and display.
Page 19
5
Creating such a federated design has some advantages in data sharing,
performance and system expansion (interoperability and extensibility). It also removes
the burdens of accessing heterogeneous data sources with resource specific client tools
and enables attribute based unified querying over federated data sources from a single
access point.
Architectural Design Features
A federated, service-oriented GIS framework is composed of two parts. One part
consists of interoperable GIS component services. These services should be compliant
with existing standards such as Open Geospatial Consortium. , The other part is the
federator, which composes the component services according to the application
requirements by providing integrated data-views in its aggregated capability metadata.
We have developed a federator that federates the standard GIS Web Services
components through aggregation of their capabilities metadata. This effectively presents
a single database image to the user defined in its aggregated capability metadata. This
enables application-based data sets to be composed (which is defined in capability
metadata) and unifies data access/query/display from a single access point.
In order to create a complete system from the users‟ point of view, we have
developed event-based interactive map display tools with AJAX technologies integrated
with Web Services. The user‟s interaction with the system is carried over the integrated
data views (map) with event-based interactive map tools (drag and drop, zoom in-out
etc.). Event-based interactive map tools are generic tools enabling seamless interaction
with the system through federator or any other compatible Web Map Service (WMS).
Page 20
6
A map is an application-based, human-recognizable, integrated data display
composed of layers. A layer is a data rendering of a single homogeneous data source.
Data sources are standard Web Map Services (WMS) and Web Feature Services (WFS)
defined by Open GIS Standards. Layers are created from the structured XML-encoded
common data model (GML) or binary map images (raster data). Heterogeneous data
source are integrated to the system through the WFS in the form of GML and through
WMS in the form of binary map images. WFS and WMS serve these data with standard
service programming interfaces and capability metadata describing their data and
resources to enable clients to make valid queries.
High-performance Design Features
The high-performance design issues addressed in our proposed framework can be
grouped into two types: extending the service specifications of open geographic standards
(Chapter 6.2 and 6.3) and federation (Chapter 6.4).
The first group of design issues is related to the extension and enhancements of
Open Geospatial Consortium (OGC) ("OGC," 1994) standards. We extended the OGC‟s
online service descriptions with the streaming data transfer capabilities. At the service
programming interface level, these services provide standard functionalities and
interfaces, but the data payloads are transferred using topic-based, publish/subscribe
messaging middleware.
The second group of design features is concerned with how to federate multiple
services (including optimized services of the first group) into a more efficient and
capable integrated system. The requirements of such a federation framework have
inspired us to develop novel load balancing and parallel processing techniques. Optimal
Page 21
7
partitioning of geo-data is difficult to achieve because the data (polygons, line-strings,
points) are neither distributed uniformly nor of similar sizes. The load they impose varies
depending on query range attributes (the geographic location or bounding box of the
query). It is difficult to develop a fair partitioning strategy that is optimal for all range
queries.
Federating services can provide stateful access to stateless GIS Web Services and
also optimize the load balancing and parallel queries by taking the regions of data density
or sparsity into consideration (Chapter 6). The federator‟s aim is to turn OGC compliance
requirements into competitiveness and to provide high-performance responsive services
that still meet the interoperability and extensibility requirements.
Extending the Architecture to other Science Domains
Our experience with GIS systems has shown that our federated, service-oriented
service model can be generalized to apply to other application areas such chemistry and
astronomy. We call this generalized framework Application Specific Information System
(ASIS) and give blueprint architecture in terms of principles and requirements (Chapter
7). Developing such a framework requires first defining a core language (such as GML –
Geographic Markup Language) expressing the primitives of the domain, second, key
service components, service interfaces and message formats defining services
interactions, and third, the capability file requirements (based on core-language) enabling
inter-service communications to link the services for the federation.
1.3. Research Issues
Our proposed service framework will allow us to investigate the following
research issues.
Page 22
8
Interoperability and extensibility: We first investigate the adoption of open
geographic standards from the OGC to create an interoperable Geographic Information
System with standard data models, service descriptions, service programming interfaces,
and service capability metadata. Second, we investigate the application of Web-Service
and service-oriented Architecture (SOA) principles (Newcomer & Lomow, 2005) to our
GIS data-grid (Chapter 3).
We also propose standard event-based interactive query and display tools
enhanced with “Asynchronous JavaScript and XML” (AJAX) technologies for the users
to interact with the standard GIS Web services seamlessly.
Research Questions:
How to integrate Web Service principles with features (data and rendering
services) of GIS to enable fine-grained dynamic information presentation?
o Incorporating widely accepted Open GIS Standards with Web Services
How to merge Asynchronous JavaScript and XML (AJAX) with Web
Services clients for event-driven, browser-based interactive map tools?
o Mediating HTTP-based AJAX tools with Simple Object Access
Protocol (SOAP)-based GIS Web Services
Federation: We propose a framework for federation of standard GIS data services
enabling unified data access/query/display through event-based interactive tools over
integrated data-views (Chapter 4). Federation is achieved by aggregating GIS services‟
capability metadata in to federating service.
We investigate how to use capability federation to develop application-based,
hierarchical data definitions in a federated capability description. We first define GIS
Page 23
9
Web Services and their service programming interfaces to allow inter-service
communication through capability metadata exchange and then define a aggregating
service that enabling federation through the combined capability metadata of its
constituent services.
We also investigate the principles for generalizing the proposed federated GIS
system for general science domains such as chemistry and astronomy in terms of
components and framework requirements.
Research Questions:
How to make attribute based federated query over distributed heterogeneous
geo-data sources?
o Capability metadata aggregation of standard GIS Web Services
o Unified data access/query from a single access point (with the help of
federator‟s aggregated capability metadata)
How to generalize the domain-specific federation framework (proposed for
GIS) to other science domains such as astronomy and chemistry?
o Defining architectural requirements
o Analyzing constraints and limitations
Performance and Responsiveness: We investigated the ways to turn compliance
requirements into competitiveness in Geographic Information Systems built on XML-
encoded common data models. Interoperability requirements bring up some compliance
costs. XML‟s emergence as the de facto standard for encoding tree-oriented, semi-
structured data has brought significant interoperability and standardization benefits to
distributed computing. On the other hand XML representations of data tend to be
Page 24
10
significantly larger than binary representations of the same data. The larger document
size means that the greater bandwidth is required to transfer the data, as compared to the
equivalent binary representations.
In addition, due to the architectural features (integration of autonomous
resources), the system spends a lot of time on query/response transformations for
relational-database to XML-encoded data model mappings.
We first investigated the performance efficient designs for XML structured data
transfer and processing (parsing and rendering). Second, we research federation-oriented
design features to enable better performance for Geographic Information Systems
(Chapter 4). A federator inherently provides workload sharing by fetching the different
data sets from separate resources to create multi-layered map image. On the other hand, a
layer itself can also be split into smaller bounding box (ranges) tiles and each tile can be
farmed out to a worker feature and map services.
The spatial data is defined in location (range) attribute and is unevenly distributed
and variably sized. Because of these stringent characteristics and dynamic nature of data,
it is not easy to perform efficient load balancing and parallel processing. In order to solve
this, we propose and adaptive workload estimation algorithm to optimize the range
queries (Chapter 6.4).
Research Questions:
How to make responsive data access/query over the data defined and queried
by range attributes?
o Sharing an unpredictable workload (whose load changes by range
query) to the workers in a most efficient way
Page 25
11
o Adaptive load balancing and unpredictable workload estimation
o Parallel data access/query via attribute-based query decomposition
How to apply pull-parsing technique to GML data rendering, and analyzing
the limitations of the other parsing techniques.
1.4. Organization of Dissertation
This introduction consists of an overview of the Geographic Information Systems,
architectural and high-performance design features of the federated services, a summary
of the outstanding issues that relate to the research outlined in this thesis, and a discussion
on the contribution of the thesis. The remaining of the thesis is organized as follows.
Chapter 2 consists of two parts. The first part gives background information about
Geographic Information Systems, Open GIS Standards and Web Services architectures.
The second part reviews of the related projects.
Chapter 3 describes the design principles and components of the federated
information Grid architecture. The components are developed in accordance with Open
GIS Standards and integrated with Web Service principles at both the data and
application level.
Chapter 4 investigates a fine-grained service federation architecture built over the
GIS Web Service components. It enables unified data access/query and display over
integrated data views.
Chapter 5 provides three substantial projects that we have used to validate the
practical applicability of our approach. These projects are Pattern Informatics (PI),
Page 26
12
Virtual California (VC) and the National Infrastructure Simulation and Analysis Center
(NISAC) projects.
Chapter 6 first introduces common performance issues and then presents general
and federator-oriented performance enhancing techniques. The chapter ends with overall
system evaluations based on applications to a real Geo-science application.
Chapter 7 examines the design principle and requirements of the proposed
framework for the general science domains and gives a blueprint architecture.
Finally, in Chapter 8, we give answers to the research questions identified in
Chapter 1, outline future research directions, and conclude the dissertation.
Page 27
13
CHAPTER 2
LITERATURE SURVEY
2.1. Background
2.1.1. Geographic Information Systems (GIS)
Geographic Information Systems (GIS) (Peng & Tsou, 2003) are systems for
creating, storing, sharing, analyzing, manipulating and displaying geospatial data and the
associated attributes. GIS introduces methods and environments to visualize, manipulate,
and analyze geospatial data. The nature of the geographical applications requires
seamless integration and sharing of spatial data from a variety of providers ("crisisgrids,"
2006).
Page 28
14
The general purpose of GIS is modeling, accessing, extracting and representing
information and knowledge from the raw geo-data. The raw data is collected from
sources ranging from sensors to satellites and stored in databases or file systems. The
data goes through the filtering and rendering services and is ultimately presented to the
end-users in human recognizable formats such as images, graphs, and charts. GIS is used
in a wide variety of tasks such as urban planning, resource management, emergency
response planning in case of disasters, crisis management, and rapid response.
Over the past two decades, GIS has evolved from traditional centralized
mainframe and desktop systems to collaborative distributed systems. Centralized
systems provide an environment for stand-alone applications in which data sources,
rendering services, and processing services are all tightly coupled and application
specific. Therefore, they are not capable of allowing seamless interaction with the other
data or processing/rendering services. On the other hand, the distributed systems are
composed of autonomous hosts (or geographically distributed virtual organizations) that
are connected through a computer network. They aim to share data and computation
resources collaborating on large scale applications.
Modern GIS requires data and computation resources from distributed virtual
organizations to be composed based on application requirements and to be queried from a
single uniform access point over the refined data with interactive display tools. This
requires seamless integration and interaction of data and computation resources. The
resources span organizational, disciplinary, and technical boundaries and use different
client-server models, data archiving systems and heterogeneous message transfer
protocols.
Page 29
15
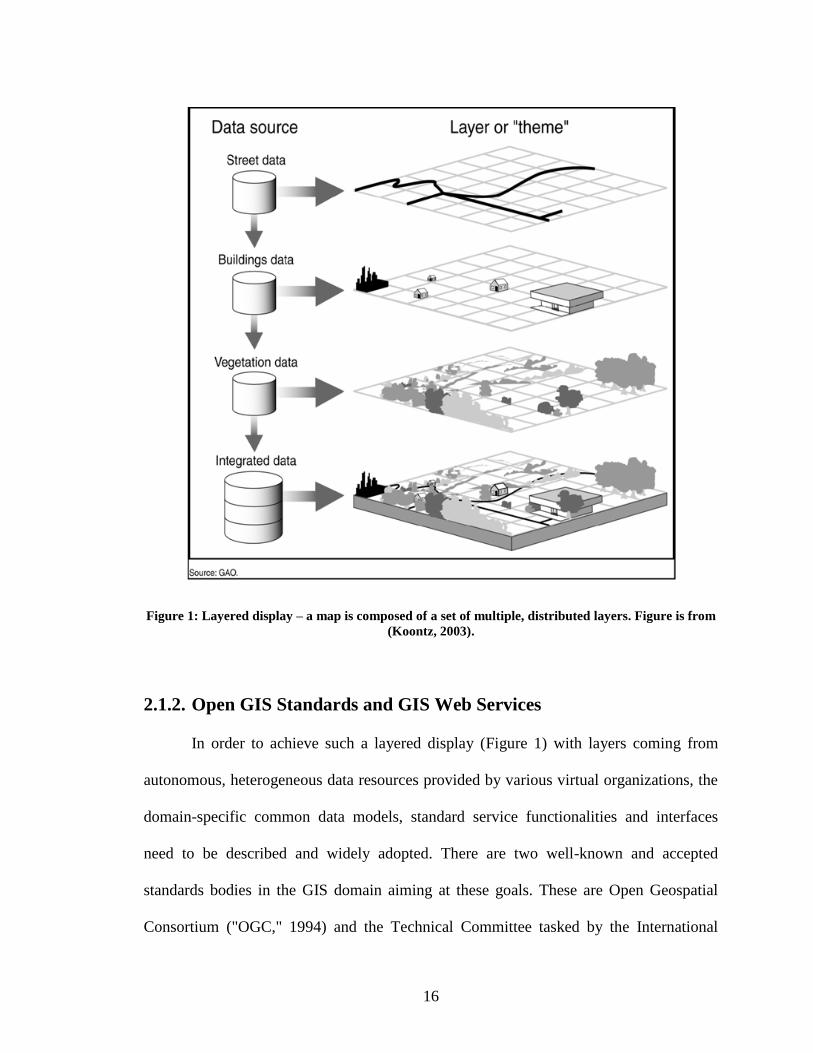
The primary function of a GIS is to link multiple sets of geospatial data and
graphically display that information as maps with potentially many different layers of
information (see Figure 1). Each layer of a GIS map represents a particular “theme” or
feature, and one layer could be derived from a data source completely different from the
other layers (Koontz, 2003). As long as standard processes and formats have been
arranged to facilitate integration, each of these themes could be based on data originally
collected and maintained by a separate organization. Analyzing this layered information
as an integrated entity (map) can significantly help decision makers in considering
complex choices.
Page 30
16
Figure 1: Layered display – a map is composed of a set of multiple, distributed layers. Figure is from
(Koontz, 2003).
2.1.2. Open GIS Standards and GIS Web Services
In order to achieve such a layered display (Figure 1) with layers coming from
autonomous, heterogeneous data resources provided by various virtual organizations, the
domain-specific common data models, standard service functionalities and interfaces
need to be described and widely adopted. There are two well-known and accepted
standards bodies in the GIS domain aiming at these goals. These are Open Geospatial
Consortium ("OGC," 1994) and the Technical Committee tasked by the International
Page 31
17
Standards Organization (ISO/TC211) ("ISO," 2008). The standards bodies‟ aims are to
make the geographic information and services neutral and available across any network,
application, or platform by defining common data models and online service descriptions.
The standards bodies specify methods, tools and services for data management,
accessing, processing, analyzing, presenting and transferring such data in digital form
between different users and systems. ISO/TC211 defines a high-level data model for
public sectors, such as governments, federal agencies, and professional organizations
(Peng & Tsou, 2003). On the other hand, OGC is interested in developing both abstract
definitions of Open GIS frameworks and technical implementation details of data models
and to a lesser extent services. They are compatible with each other. ("JAG," 1999)
OGC‟s standards definition for data model (Geographic Markup Language -
GML) (Cox, Daisey, Lake, Portele, & Whiteside, 2003) and online data services are well-
known and widely adopted. As more GIS vendors are releasing compatible products and
more institutions use OGC standards in their research and implementations, OGC
specifications are becoming de facto standards in GIS community, and GML is rapidly
emerging as the standard XML encoding for geographic information.
The Web Map Service (WMS) (Beaujardiere, 2004; Kolodziej, 2004) and the
Web Feature Service (WFS) (Vretanos, 2002) are two major services defined by OGC for
creating a basic GIS framework enabling information rendering of heterogeneous data
sources as map images. WMS is the key service to the information rendering and
visualization. WMS produces maps from the geographic data in GML that is obtained
from various WFS instances. It also enables attribute and feature-based data querying
over data display by its standard service interfaces. This general approach is similar to the
Page 32
18
SkyServers (Gray et al., 2002) defined by the National Virtual Observatory community.
OGC‟s WFS implementation specification defines interfaces for data access and
manipulation operations on geographic features. Geographic features are basically earth-
related data definitions such as rivers, lakes, earthquake seismic records etc. Via its
standard service interfaces, a web client can combine, use and manage geo-data from
different sources by invoking several standard operations (Vretanos, 2002). By adopting
interoperable Open GIS Standards (that is, using GML and standard online services
WMS and WFS) for our distributed computing research infrastructure, we open the door
of interoperability to this growing community.
In addition to the domain-level interoperability and extensibility, information
systems need cross-language, operating system, and platform interoperability to enable
data sharing/federating and analysis over autonomous heterogeneous resources provided
by various organizations. Web Service standards (Booth et al., 2004) are a common
implementation of Service Oriented Architectures (SOA) ideas, giving us a means of
interoperability between different software applications running on a variety of platforms.
Grid computing (Foster & Kesselman, 2004; Fox, 2004) (Berman, Fox, & Hey, 2003) has
a converging Web Service-based architecture. By implementing Web Service versions of
GIS services, we can integrate them directly with scientific application Grids (Atkinson
et al., 2005; Aydin et al., 2008).
A Web Service is an interface that describes a collection of operations that are
network accessible through standardized XML messaging (Kreger, 2001). Web Services
collectively are a software framework that is designed to support interoperable machine-
to-machine interactions over a network. A typical service has an interface described in a
Page 33
19
machine-processable format called the Web Service Description language (WSDL)
(Christensen, Curbera, Meredith, & Weerawarana, 2001). Other systems interact with the
Web Services in a manner prescribed by its description using SOAP-messages (Simple
Object Access Protocol), typically conveyed using HTTP with an XML serialization in
conjunction with other Web-related standards. Representational State Transfer (REST)
(Fielding & Taylor, 2002; Khare & Taylor, 2004) is a variation of this architecture that
replaces WSDL with standard HTTP operations (GET, POST, PUT, DELETE). REST
can be used to transmit SOAP messages as well as other formatted transmissions such as
RSS (Melamed & Keidar, 2004), ATOM, or JSON (Crockford, 2006).
The major difference between Web Services and other component technologies is
that Web Services are accessed via the ubiquitous Web protocols such as HTTP using
Extensible Markup Language (XML)-encoded messages instead of object-model-specific
protocols such as Distributed Component Object Model (DCOM) (Redmond, 1997),
Remote Method Invocation (RMI) ("RMI," 2004), or Internet Inter-Orb Protocol (IIOP)
(Kirtland, 2001). One typically builds services to be stateless and places the distributed
system state in a single state machine that aggregates clients to services. This simplifies
several well-known problems in distributed object systems (such as fault tolerance),
enabling Web Service-based systems to have better scalability.
Adopting and combining GIS Open Standards and Web Service standards and
implementing Web Service versions of standard GIS services permit applications to span
programming languages, platforms and operating systems. It also enables application
developers to integrate the third party geospatial functionality and data into their custom
Page 34
20
applications easily. Also, it allows us to potentially leverage the more general Web
Service-based tools such as workflow engines in GIS problems.
2.2. Related Works
2.2.1. Linked Environments for Atmospheric Discovery (LEAD)
Linked Environments for Atmospheric Discovery (LEAD) is a large scale project
funded by an NSF Large Information Technology Research grant. LEAD‟s goal is to
address fundamental IT and meteorology research challenges to create an integrated
framework for analyzing and predicting weather at a finer grained resolution than is
currently possible. The proposed framework helps researchers to identify and access,
prepare, manage, analyze or visualize a broad array of meteorological data and model
output independent of format and physical location (Ramamurthy & Droegemeier, 2008).
LEAD is developing the middleware for adaptive utilization of distributed
resources, sensors and workflows. The LEAD distributed computing infrastructure is
constructed as a service-oriented architecture and decomposes into services which
communicate via well-defined interfaces and protocols (Plale, Gannon et al., 2006).
LEAD provides scientists with necessary tools to build forecast models using
available both observations and model generated data and manages necessary resources
for executing the model. The tools include services for accessing supercomputer
resources and services for automated search, selection and transfer of required data
products between computing resources (Plale, Ramachandran, & Tanner, 2006). One
major feature of LEAD is support for adaptive analysis and prediction of mesoscale
Page 35
21
meteorological events. To provide such features LEAD data subsystem supports three
important capabilities: automated data discovery by replacing the manual data
management tasks with automated ones; a highly scalable data archiving system which
allows transfer of large scale data products between resources, metadata descriptions of
the available information and protected storage facilities; and easy search and access
interfaces for the data via a search GUI and underlying ontology (Plale, Ramachandran et
al., 2006).
2.2.2. Geosciences Network (GEON)
The Geosciences Network (GEON) (Zaslavsky & Memon, 2004) is a multi-
university project funded by the National Science Foundation (NSF) to develop cyber
infrastructure to enable sharing of data sets and services in a distributed environment for
the Earth Sciences. The GEON Grid is a distributed network of GEON nodes, each of
which runs a GEON software stack that includes Web and Grid services to enable users
to register data sets, register services, issue queries across multiple information sources,
using spatiotemporal search conditions and ontologies, download data into personal
spaces, invoke analysis services, visualize output of queries, and perform analysis. The
architecture includes data mediation services, workflow services, and a portal. Much of
the data is geospatial and spatiotemporal in nature and provides appropriate search
interfaces, and efficient mapping interfaces for such data is an important requirement.
The GEON Grid software stack includes ArcIMS (Esri, 2004) as one of its components to
provide GIS and mapping functionality.
Geosciences Network (GEON) provides ontology enabled applications mostly
based on data registration, discovery, manipulation and display in the GIS domain
Page 36
22
(Bhata, Menon, Zaslavsky, Seber, & Baru, 2003). They also have the myGEON (Youn et
al., 2007) concept functioning similarly as in the LEAD, and they have data display tools
in a portal implemented by GridSphere (Novotny, Russell, & Wehrens, 2004).
GEON is based on a “Service-Oriented Architecture (SOA)”. Advanced
information technologies are being developed in the project to support “intelligent”
searching, semantic integration, and visualization of multidisciplinary information spaces
as well as four-dimensional scientific datasets and geospatial data. The project also plans
to provide access to high performance computing platforms for data analysis and model
execution. The GEON Portal also provides a Web-based interface to access the various
resources.
2.2.3. Laboratory for Advanced Information Technology and Standards
(LAITS):
The LAITS ("LAITS," 2008) is a project of Center for Spatial Information
Science and Systems (CSISS) in George Mason University. The LAITS project is
primarily working on integrating OGC Web Services with Globus-based Grid technology
(Foster & Kesselman, 1996) for geospatial modeling and applications. The objectives of
the project are enabling the management of geospatial data by Grids, providing OGC
standard compliant access to Grid-managed geospatial data, and enabling geospatial
modeling and the production of virtual geospatial products in the Grid environment (Di,
Chen, Yang, & Zhao, 2003). For the test and demonstration of their architecture, they use
NASA EOS data environment and coverage data provided by OGC Web Coverage
Service (WCS) (Evans, 2003)]. Their goal is to develop a complete suite of Globus-based
Page 37
23
GIS services using OGC WCS, WMS and WFS. Currently they have WCS services to
demonstrate their work.
They also have a demo to access GIS data kept in the form of coverage in
different databases connected to different WCS instances. These OGC compatible WCS
are implemented and wrapped as Grid services and called GWCS (Grid Web Coverage
Services) (Committee, 2001). LAITS enhanced the WCS to process four dimensional
HDF-EOS data, which is in the network Common Data Format (netCDF) (Rew & Davis,
1990). In their proposed architecture, data providers are deployed as WCS in NASA
Ames, in LLNL and in LAITS hosts. In their GCSW (Grid Catalog Services for Web),
they store and serve information about the available coverage servers. They use OGC‟s
CSW (Catalog Services for Web) services to search for a user-specified data server. Data
transfer is achieved by using GridFTP (Allcock, 2003).
The brain of the system is iGSM (Intelligent Grid Service mediator). iGSM (Chu,
Di, & Thornton, 2006) dispatches user requests from a WCS/WMS portal to the most
appropriate GWCS/GWMS in the Virtual Organization. Portals tasks are implemented at
iGSM. Portals instances and data-service providers meet at the iGSM. iGSM also does
request conversion. Geospatial-data access requests from OGC WCS portal are
transferred to an appropriate format for the Grid enabled WCS (GWCS). Catalog Service
search is also done in iGSM.
Regarding workflow or process pipelining, LAITS use a workflow management
and execution engine called BPELPower. It supports BPEL based web service chain
completely.
Page 38
24
LAITS‟s grid approach is based on Globus toolkit ("GT4," 2008). In contrast, our
Grid approach is based on WS-I+ interoperability standards and Web Service principles.
The implementation of SOA in the web environment is called Web services and in the
Grid environment the open Grid Services. The web service and grid service have
converged with the introduction of Web Service Resource Framework (WSRF) (Graham,
Karmarkar, Mischkinsky, Robinson, & Sedukhin, 2006).
Page 39
25
CHAPTER 3
GIS WEB SERVICE DATA-GRID COMPONENTS
A Geographic Information System (GIS) is a primarily a collection of data is
driven by observations, yet a mechanism to share collected data and developed software
tools has not been widely established. The data collected are stored in several different
formats on different platforms. Software developed in the community employs a variety
of mechanisms for accessing such data and conduct analysis on them, with little or no
collaboration and standards.
The heterogeneity of geographic resources may arise for a number of reasons,
including differences in projections, precision, data quality, data structures and indexing
Page 40
26
schemes, topological organization (or lack of it), and the set of transformation and
analysis services implemented in the source.
Our proposed information system Grid framework is based on common data
models, GIS Web Service components, and a service-oriented architecture implemented
with “WS-I” Web Service principles. In this chapter we first present the requirements for
the common data models and their advantages of usage in such a framework (Chapter
3.1). Next, we present motivations and advantages of extending and enhancing service
components as Web Services to develop a SOA framework for GIS (Chapter 3.2).
Finally, we present the system‟s general architectural features in terms of its components,
interactions and data-flow from the archived data stores to the end users (Chapter 3.3)
3.1. Geo-data and Common Data Models
Geospatial data, in general, refers to a class of data that has a geographic or
spatial nature, e.g., the information that identifies the geographic location and
characteristics of natural or constructed features and boundaries on the earth.
Geospatial data represents real world objects and properties (roads, land use,
elevation) with digital data. Real world objects can be divided into two abstractions:
discrete objects (a house) and continuous fields (rain fall amount or elevation). There are
two broad methods used to store data in a GIS for both abstractions: Raster and Vector.
Raster data is called “coverage data” by OGC. Raster data type consists of rows
and columns of cells where in each cell is stored a single value. Most often, raster data
are images (raster images), but besides just color, the value recorded for each cell may be
a discrete value, such as land use, a continuous value, such as rainfall, or a null value if
Page 41
27
no data is available. Raster data is stored in various formats ranging from a standard file-
based structure such as TIFF and JPEG to Binary Long Object (BLOB) data stored
directly in a relational database management system.
Common data format for the raster data in our system: In our GIS system we use
image formats such as JPEG or TIFF to represent the raster data provided by third party
OGC compatible Web Map Services or Coverage Portrayal Services (CPS) (Lansing,
2002).
The vector data type uses geometrical constructions such as points, lines (series of
point coordinates), or polygons (shapes bounded by lines), to represent objects on the
Earth‟s surface. Examples include property boundaries for a housing subdivision
(represented as polygons) and water well locations (represented as points). Vector
features can be made to respect spatial integrity through the application of topology rules
such as 'polygons must not overlap'. Vector data can also be used to represent
continuously varying phenomena.
Common data format for the vector data in our system: The data model developed
by OGC is the Geography Markup Language (GML. It is currently widely accepted as
the universal encoding for geo-referenced data. GML is an XML grammar written in
XML Schema for the modeling, transport, and storage of geographic information
including both the spatial and non-spatial properties of geographic features. It provides a
variety of kinds of objects for describing geography including features, coordinate
reference systems, geometry, topology, time, units of measure and generalized values
(see Appendix H).
Page 42
28
Just as XML helps the Web by separating content from presentation, GML does
the same thing specifically for geography. GML allows the data providers to deliver
geographic information as distinct features. Using the latest Web technologies, users can
process these features without having to purchase proprietary GIS software. By
leveraging related XML technologies such as XML Schema, XML Data Binding
Frameworks, XSLT (Clark, 1999), XPath (Clark & DeRose, 1999), XQuery (Boag et al.,
2007) etc. a GML dataset becomes easier to process in heterogeneous environments.
By incorporating GML in our systems as common data format we gain several
advantages:
1. It allows us to unify different data formats. For instance, various organizations
offer different formats for position information collected from GPS stations. GML
provides suitable geospatial and temporal types for this information, and by using
these types a common GML schema can be produced. See Appendix H for a
sample GML.
2. As more GIS vendors are releasing compatible products and more institutions use
OGC standards in their research and implementations, OGC specifications are
increasingly becoming de facto standards in GIS community. GML is rapidly
emerging as the standard XML encoding for geographic information. By using
GML we open the door of interoperability to this growing community.
3. GML and related technologies allow us to build general set of tools to access and
manipulate data. Since GML is an XML dialect, many XML related technologies
(such as parsers) can be utilized for application development purposes.
Page 43
29
4. One approach to achieve machine-to-machine communications and autonomous
computations.
5. It enables separating data‟s representation from the context.
6. Since it is XML based, it can be used in other XML based systems and
communication protocols such as XMLHttpProtocol (in other words AJAX) and
Web Services (Sayar, Pierce, & Fox, 2006).
7. It is an approach to achieving cross-language interoperability.
Due to the numerous advantages of using semi-structured data representation,
other science domains also have adopted similar approaches. For example, chemistry
uses CML (Chemistry Markup Language) (G. L. Holliday, Murray-Rust, & Rzepa,
2006), Astronomy domain uses VOTable (Virtual Observatory Tables) (Williams et al.,
2002) and Mathematic science domain uses MathML (Mathematic Markup Language)
(Buswell et al., 1999).
3.2. Web Service Extensions to Standard Service Definitions
The proposed GIS framework is service-oriented and has components as Web
Services. These Web Services provide standard service interfaces and communicate with
common messages formats defined in standard specifications. By integrating Web
Services with Open Geographic Standards, we support interoperability at both data and
application level and have the common advantages of SOA architectures listed below:
Distribution: It will be easier to distribute geospatial data and applications across
platforms, operating systems, computer languages, etc. They are platform and language
Page 44
30
neutral. Web services can be used on different platforms than those on which they were
implemented.
Integration: It will be easier for application developers to integrate geospatial
functionality and data into their custom applications. For example, there are many tools
in various programming languages that can create client stubs from WSDL files that can
be used to invoke the services. Web Service-based frameworks are loosely coupled and
component oriented. Because of the standard interfaces and messaging protocols the Web
Services can easily be assembled to solve more complex problems.
Infrastructure: We can take advantage of the huge amount of infrastructure that is
being built to enable the Web Services architecture – including development tools,
application servers, messaging protocols, security infrastructure, workflow definitions,
etc.
The OGC Web Feature Service implementation specification (Vretanos, 2002)
defines HTTP as the only explicitly supported distributed computing platform. This
requires the use of one of the two request methods: GET and POST. Although SOAP
messages are also supported, they must be transported using the HTTP POST method.
However, employing the HTTP protocol and GET or POST introduces significant
limitations for both producers and consumers of a service. As discussed above Web
Services provide us with valuable capabilities such as providing standard interfaces to
access various databases or remote resources, the ability to launch and manage
applications remotely, and the ability to control collaborative sessions. Developments in
the Web Services and Grid areas provide us with significant technologies for exposing
our resources to the outer world using relatively simple yet powerful interfaces and
Page 45
31
message formats. Furthermore, sometimes we need to access several data sources and run
several services for solving complex problems. This is extremely difficult in HTTP
services, but rapidly developing workflow technologies for Web and Grid Services may
help us combine several services into composite applications. For these reasons we have
based our implementation of standard GIS services on Web Services principals.
Moreover, complex scientific applications require access to various data sources
and run several services consecutively or at the same time. Since this is not in the scope
of HTTP but can be supported using rapidly developing workflow technologies for Web
and Grid Services, we have based our implementations on Web Services principals. Our
goal is to make seamless coupling of GIS Data sources with other applications possible in
a Grid environment.
GIS systems are supposed to provide data access tools to the users as well as
manipulation tools to the administrators. In principle the process of serving data in a
particular format is simple when it is made accessible as files on an HTTP or FTP server.
But additional features like query capabilities on data or real-time, push-style access in a
streaming fashion require more complicated approaches. As the complexity of the
services grows, the client‟s chance of easily accessing data products decreases, because
every proprietary application developed for some type of data require its own specialized
clients. Web Services help us overcome this difficulty by providing standard interfaces to
the tools or applications we develop.
No matter how complex the application itself, its WSDL interface will have
standard elements and attributes, and the clients using this interface can easily generate
Page 46
32
methods for invoking the service and receiving the results. This method allows providers
to make their applications available to others in a standard way.
Most scientific applications that couple high performance computing, simulation
or visualization codes with databases or real-time data sources require more than
simplistic remote procedure call message patterns. These applications are sometimes
composite systems where some of the components require output from others. If they are
asynchronous, it may take hours or days to complete. Such properties require additional
layers of control and capabilities from Web Services, which introduces the necessity for a
messaging substrate that can provide these extra features.
3.3. System Framework and Web-Service Components
Our proposed Geographic Information System is based on common data models
provided by standard service components and their service interfaces (Sayar, Pierce, &
Fox, 2005a). Service interactions start with a discovery step that involves retrieving the
capabilities document. A capability document is an XML encoded metadata file about
both the service and data. Its formats and schema are defined by Open Geographic
Standards (OGC specifications) ("OGC Schema," 2008). Sample capabilities documents
are given in Appendix-C for WMS and Appendix-D for WFS. All the interactions and
service bindings are done through capability exchange. So, each service keeps its own
capability defining its data providing and available operations on these data. For the
sample interaction steps between WMS and WFS to get feature data from WFS, see
Chapter 3.3.1.
Page 47
33
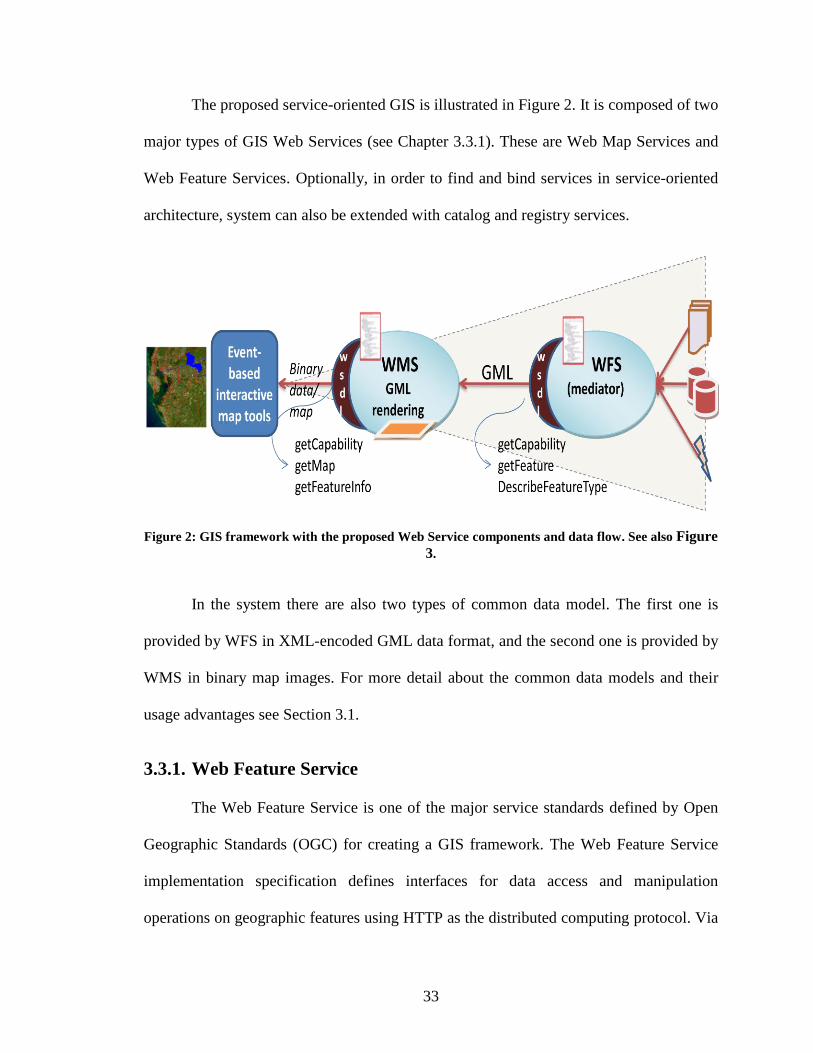
The proposed service-oriented GIS is illustrated in Figure 2. It is composed of two
major types of GIS Web Services (see Chapter 3.3.1). These are Web Map Services and
Web Feature Services. Optionally, in order to find and bind services in service-oriented
architecture, system can also be extended with catalog and registry services.
Figure 2: GIS framework with the proposed Web Service components and data flow. See also Figure
3.
In the system there are also two types of common data model. The first one is
provided by WFS in XML-encoded GML data format, and the second one is provided by
WMS in binary map images. For more detail about the common data models and their
usage advantages see Section 3.1.
3.3.1. Web Feature Service
The Web Feature Service is one of the major service standards defined by Open
Geographic Standards (OGC) for creating a GIS framework. The Web Feature Service
implementation specification defines interfaces for data access and manipulation
operations on geographic features using HTTP as the distributed computing protocol. Via
Page 48
34
these interfaces, a web user or service can combine, use and manage geo-data from
different sources by invoking several standard operations (Vretanos, 2002).
OGC specifications describe the state of a geographic feature by a set of
properties, where each property can be thought of as a [name, type, value] tuple.
Geographic features are those that may have at least one property that is geometry-
valued. This also implies that features can be defined with no geometric properties at all.
According to the Open Geographic Standard‟s definition, WFS must minimally provide
three operations: getCapabilities, describeFeatureType and getFeature. The more
advanced transactional WFS must provide two more service interfaces, transaction and
lockFeature. In our research framework, we assume that the WFS instances are provided.
However, to understand the relationships of the WFS instances to WMS and federataotr
instances, we summarize the WFS standard operations below (Vretanos, 2002):
- GetCapabilities: A Web Feature Service must be able to describe its capabilities.
Specifically, it must indicate which feature types it can service and what operations are
supported on each feature type.
- DescribeFeatureType: A Web Feature Service must be able, upon request, to
describe the structure of any feature type it can serve.
- GetFeature: A Web Feature Service must be able to service a request to retrieve
feature instances. In addition, the client should be able to specify which feature properties
to fetch and should be able to constrain the query spatially and non-spatially. Features
are instances of Feature types.
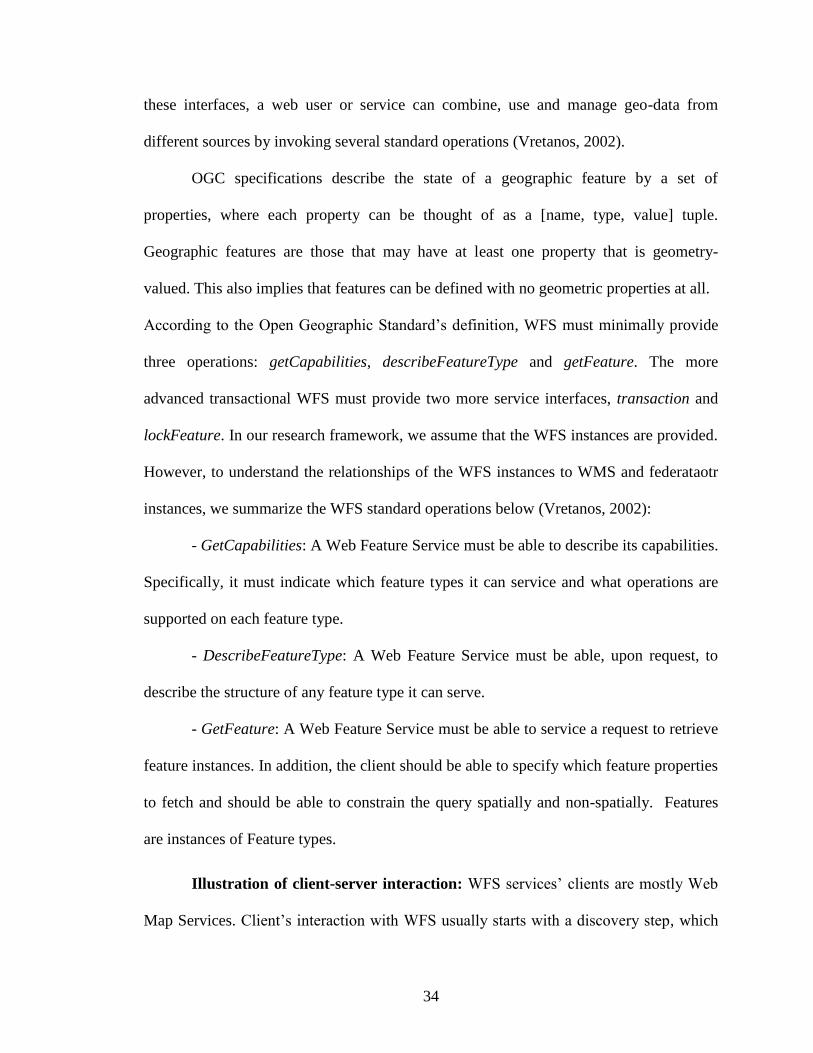
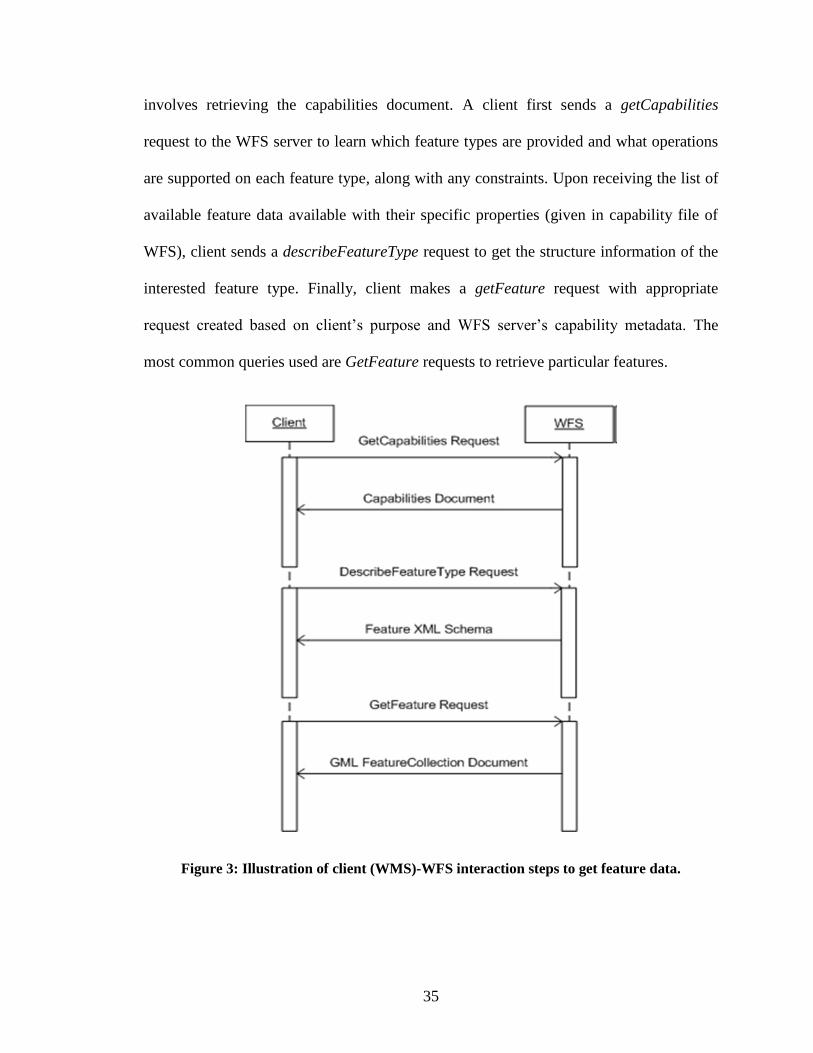
Illustration of client-server interaction: WFS services‟ clients are mostly Web
Map Services. Client‟s interaction with WFS usually starts with a discovery step, which
Page 49
35
involves retrieving the capabilities document. A client first sends a getCapabilities
request to the WFS server to learn which feature types are provided and what operations
are supported on each feature type, along with any constraints. Upon receiving the list of
available feature data available with their specific properties (given in capability file of
WFS), client sends a describeFeatureType request to get the structure information of the
interested feature type. Finally, client makes a getFeature request with appropriate
request created based on client‟s purpose and WFS server‟s capability metadata. The
most common queries used are GetFeature requests to retrieve particular features.
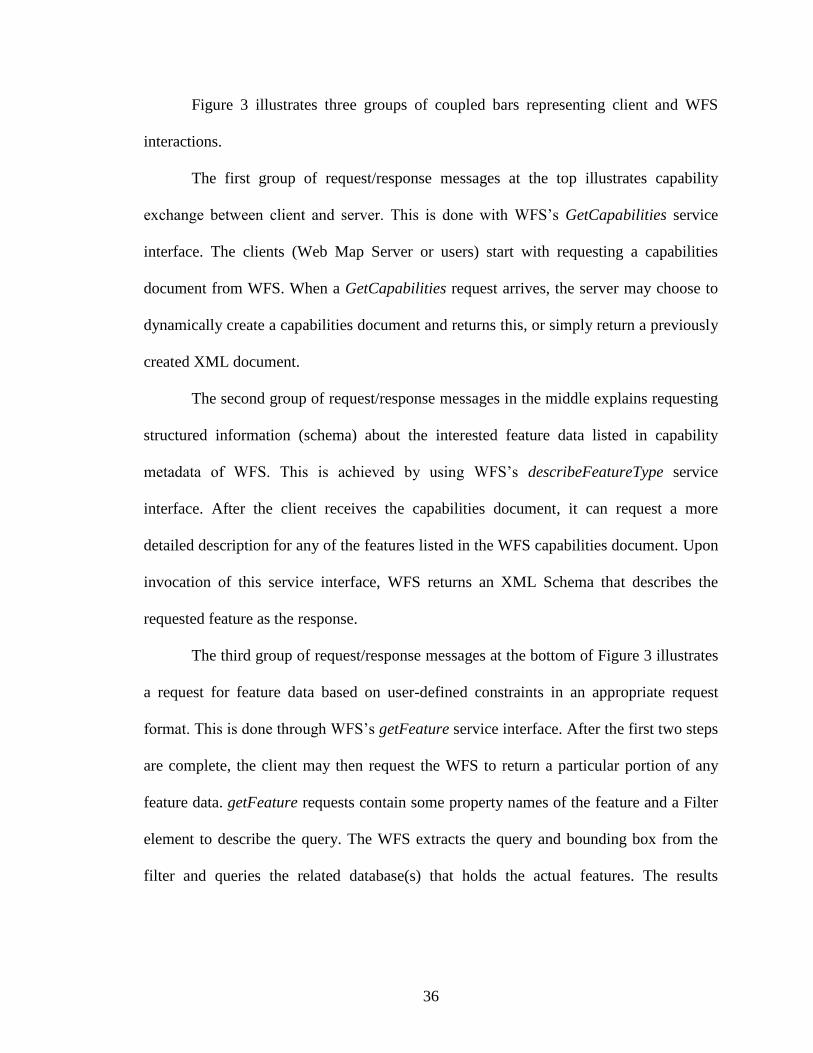
Figure 3: Illustration of client (WMS)-WFS interaction steps to get feature data.
Page 50
36
Figure 3 illustrates three groups of coupled bars representing client and WFS
interactions.
The first group of request/response messages at the top illustrates capability
exchange between client and server. This is done with WFS‟s GetCapabilities service
interface. The clients (Web Map Server or users) start with requesting a capabilities
document from WFS. When a GetCapabilities request arrives, the server may choose to
dynamically create a capabilities document and returns this, or simply return a previously
created XML document.
The second group of request/response messages in the middle explains requesting
structured information (schema) about the interested feature data listed in capability
metadata of WFS. This is achieved by using WFS‟s describeFeatureType service
interface. After the client receives the capabilities document, it can request a more
detailed description for any of the features listed in the WFS capabilities document. Upon
invocation of this service interface, WFS returns an XML Schema that describes the
requested feature as the response.
The third group of request/response messages at the bottom of Figure 3 illustrates
a request for feature data based on user-defined constraints in an appropriate request
format. This is done through WFS‟s getFeature service interface. After the first two steps
are complete, the client may then request the WFS to return a particular portion of any
feature data. getFeature requests contain some property names of the feature and a Filter
element to describe the query. The WFS extracts the query and bounding box from the
filter and queries the related database(s) that holds the actual features. The results
Page 51
37
obtained from the DB query are converted to that particular feature‟s GML format and
returned to the client as a FeatureCollection object.
A WFS allows clients to access and manipulate the geographic features without
having to consider the underlying data stores. The clients‟ only view of the data is
through the WFS interface, which allows the data providers to integrate various types of
data stores with one WFS instance. Figure 2 displays this instances where the WFS server
is accessed by different types of clients and has access to various types of spatial
databases, file systems and any-type of storages. Clients interact with WFS by submitting
database queries encoded in OGC Filter Encoding Implementation (Vretanos, 2001) and
in compliance with the Common Query Language (Rao, Percivall, & Enloe, 2000). The
query results are returned as GML FeatureCollection documents. In this context, WFS
also behaves as mediator services to provide feature data in a common data model
(Geographic Markup Language) through standard service interfaces. For the technical
details about implementing Web Service based WFS see (Aydin, 2007).
In order to make WFS like services more clear in your mind, we can give an
example from the other well known domain, Astronomy. In Astronomy domain,
SkyServers (Purger, Budav´ari, Szalay, Thakar, & Csabai1, 2004) serve the same purpose
as WFS serve in GIS domain. SkyServer provides a range of interfaces to underlying
Microsoft SQL Server. Clients interact with SkyServers (group, 2005) using ADQL
(Astronomical Data Query Language) based SOAP interface returning VOTable (Virtual
Observatory Table) based results. VOTable is GML like XML structured data format
carrying content and presentation information for the data set. ADQL is an SQL-like
language used by the IVOA to represent astronomy queries posted to VO data services.
Page 52
38
3.3.2. Web Map Service
Web Map Service (WMS) (Beaujardiere, 2004) (Kolodziej, 2004) is the key
service for information visualization in the GIS domain. WMS produces maps from both
vector-encoded and binary data. The vector data is GML and is obtained from requests
to WFS instances. Binary data can be obtained from Coverage Portrayal Services (CPS)
(Lansing, 2002) and other Web Map Servers.
A map is not the data itself. Maps create information from raw geographic data,
vector data, or coverage data. Maps are generally rendered in pictorial formats such as
JPEG (Joint Photographic Expert Group), GIF (Graphics Interchange Format), or PNG
(Potable Network Graphics) (Adler et al., 2003). WMS also produces maps from vector-
based graphical elements in Scalable Vector Graphics (SVG) (Andersson & others,
2003).
Web Map Service (WMS) enables visualizing, manipulating and analyzing
geospatial data through maps displayed on browser based interactive GUI (see Chapter
3.3.3). Map Servers typically compose maps in the layers. The layers may come from
distributed sources: Web Feature Services provide abstract feature representations that
can be converted to images, and other Map Servers may contribute map images. NASA‟s
OnEarth WMS is an example ("OnEarth," 2007). WMSs can be federated and cascaded
to create more detailed and comprehensible map images. We discuss this in greater depth
in Chapter 4.
WMS provides three main services (Appendix A); these are getCapabilities
(Chapter 3.3.2.1), getMap (Chapter 3.3.2.2) and GetFeatureInfo (Chapter 3.3.2.3).
GetCapabilities and getMap are required services to produce a map but GetFeatureInfo is
Page 53
39
an optional service. The implementation details and service interfaces are given in the
following two sub-sections.
3.3.2.1. GetCapabilities Services
The purpose of the getCapabilities operation is to obtain service metadata, which
is a machine and human readable description of the server‟s information content and
acceptable request parameter values. Figure 5 presets the getCapabilities request schema.
WMS provide its data in the layer format. The GetCapabilities request and the
corresponding service interface allow the server to advertise its capabilities such as
available layers, supported output projections, supported output formats and general
service information. Before a WMS Client requests a map from WMS, it should know
what layers WMS provides in which bounding boxes. The capability file is kept in the
local file system and sent to clients upon getCapabilities request (see Figure 4). For the
sample capabilities file instances see APENDICES C and D.
Page 54
40
Figure 4: GetCapabilities operation steps. See Appendix C for a sample WMS capabilities file
instance
Figure 5: GetCapabilities Request Schema. See Appendix A for an instance of this request schema.
Page 55
41
3.3.2.2. GetMap Services
The getMap service interface allows the retrieval of maps. Maps are provided in
different various formats based on user-defined parameters and layer attributes. All the
supported formats for map-image layers and corresponding layer specific attributes and
constraints are defined in WMS Capabilities document. Before invoking getMap service
interface, clients first obtain capabilities document by invoking getCapabilities service
interfaces (see Chapter 3.3.2.1). The image is returned back to the WMS Client as an
attachment to SOAP message. If the WMS encounters any problem during handling of
the request, it sends an exception message in SOAP back to the WMS Client.
The major operation steps to produce maps are illustrated in Figure 6. GetMap
request schema to create valid requests is given in Figure 7.
Page 56
42
Figure 6: GetMap operation steps.
WMS first parses the request and gets the parameter values. WMS first
determines what layers are requested, in which bounding box, in which form, and so
forth. After determining all the request parameters, it communicates with WFS services
providing requested feature data by using their getFeature service interfaces and
requested feature data in GML format. If the parameter defining returned image format in
Page 57
43
getMap request is Scalable Vector Graphics (SVG) (Bowler et al., 2001), then WMS
creates SVG from returned feature data by using its geometry elements. If the requested
image is not in SVG format, we first create the SVG image and then convert it into the
desired image formats (such as PNG, GIF, or JPEG). Apache Batik provides libraries for
this conversion. Batik is a Java(tm) technology based toolkit for applications or applets
that use images in the SVG format for various purposes, such as viewing, generation or
manipulation. By using these schema files we derive geometry elements from the GML
file to visualize the feature data. These geometry elements in GML are basically Point,
Polygon, LineString, LinearRing, MultiPoint, MultiPolygon, MultiGeometry, etc.
To create the images from the features returned from the WFS, we have used Java
Graphics2D and Java AWT libraries. For each layer we create a different graphics object.
If you assign each layer to different graphics object than Java libraries allow you to
overlay these graphic objects in various combinations.
Alternatively, WMS can use SVG conversion to create map-image layers. When
this way is used, WMS uses its internally defined XSL file to convert standard GML files
into SVG by using XSLT machine. We developed standard XSL (see Figure 13) file to
convert XML coded GML feature collections into SVG files. After having SVG, these
image objects then converted into any image format such as JPEG, TIFF, PNG etc.
(Sayar, Pierce, & Fox, 2005b).
Page 58
44
Figure 7 : GetMap Request Schema. See Appendix A for an instance of this request schema
Below is the sample code fragment showing how to extract geometry elements
from GML and overlay it on a raster map image as a separate layer. In this simple
pseudo-code, the raster data comes from an HTTP Servlet based WMS server (defined in
URL), and the other data represented as features are coming from our implementation of
WFS. Using a layer from some other WMS is defined in OGC specifications and is
Page 59
45
known as cascading. WMS behaving as a client to another WMS is called cascading
WMS, and the layer used is called cascaded layer. We will exploit and extend cascading
in our federation approach.
URL url = new URL(
Wmsaddress+”?request=GetMap&width=" +
width + "&height=" + heigth +
"&layers="+layername+
”&styles=&srs=EPSG:4326&format=”+format+”&bbox=" +
bbox);
BufferedImage im = ImageIO.read(url);
Graphics2D g = im.createGraphics();
…
if(istherePoint)
String[] points = getPointsFromFeatureData();
if(isthereLineString)
String [] LineStrings = getLineStringFromFeatureData();
if(isthereLineRing)
String [] LineRings = getLineRingFromFeatureData();
if(istherePolygon)
String [] polygons = getPolygonsFromFeatureData();
…
if(polygons!=NULL){
for(int i=0; i<polygons. length; i++){
int [][] xypoints = wm.getXYpoints(polygons[i]);
g.setColor(Color.darkGray);
g.drawPolygon(xypoints[0], xypoints[1], xypoints[0].length);
}
}
if(LineRings!=NULL){
for(int i=0; i< LineStrings. length; i++){
int [][] xypoints = wm.getLinesInStr(LineStrings[i]);
g.setColor(Color.darkGray);
g.drawPolyline(xypoints[0], xypoints[1], xypoints[0].length);
}
}
…
Check all the geometry elements in GML for a queried region of the map .Point, LineString Polygon etc.
If you find any geometry data above such as Points, LineStrings, convert the numbers in the GML file for the feature data into appropriate format to draw shapes for representing these geometry elements and display them by using graphics2D object. If you use the same grpahics2D data the layers will be overlaid.
Page 60
46
g.dispose();
Figure 8: Sample output of the above map images generating code
How to send binary map images with SOAP messages (in JAVA):
1. Server side:
Sample JAVA client code below shows how to attach a map image to SOAP
message in response to getMap request. We assume map image name is maimage.jpeg.
The WMS server first creates a data handler from the image and casts it as an object, and
then returns.
Object map = file2DataHandlerObject (APPLPATH+"/mapimage.jpeg");
public Object file2DataHandlerObject(String filePath) {
try {
DataHandler dhSource = new DataHandler(new
FileDataSource(filePath));
return (Object) dhSource;
} catch (Exception ex) {
ex.printStackTrace();
return null;
}
2. Client side:
Client has client stubs for WMS services created earlier from WMS‟s Web
Service Description File (WSDL). It uses its client stubs to get the map as an attachment
Page 61
47
to SOAP message. It first extracts the attachment and then data handler from the
attachment. It created map images as byte array through data handler.
java.lang.Object value = null;
value = binding.getMap(request);
byte[] bs = null;
Object[] attachments = binding.getAttachments();
for (int i = 0; i < attachments.length; i++) {
AttachmentPart att = (AttachmentPart) attachments[i];
DataHandler dh = att.getActivationDataHandler();
BufferedInputStream bis = new BufferedInputStream(dh.getInputStream());
bs = new byte[bis.available()];
bis.read(bs, 0, bs.length);
bis.close();
3.3.2.3. GetFeatureInfo Services
The GetFeatureInfo operation is designed to provide clients of a WMS with more
information about features over the map images that were returned by previous Map
requests. GetFeatureInfo is used when a user needs further information about any feature
data on the map. Its return type is human readable text or HTML, which is defined as
request parameter. See Figure 7 for general schema for creation of getFeatureInfo query
instances.
The GetFeatureInfo works as follows (see also Figure 11):
The user supplies (x, y) Cartesian coordinates and the layers of interest and gets
the information back in the form of HTML, GML or ASCII format.
Page 62
48
The basic operation provides the ability for a client to specify which pixel is being
asked about, which layer(s) should be investigated, and what format the information
should be returned in. Because the WMS protocol is stateless, the GetFeatureInfo request
indicates to the WMS what map the user is viewing by including most of the original
GetMap request parameters (all but VERSION and REQUEST). From the spatial context
information (BBOX, CRS, WIDTH, HEIGHT) in that GetMap request, along with the x,
y position the user chose, the WMS can (possibly) return additional information about
that position. The actual semantics of how a WMS decides what to return more
information about, or what exactly to return, are left up to the WMS provider.
Figure 11 illustrates the successive process steps done by the WMS to respond to
getFeatureInfo requests. After checking the request parameters with the capability
metadata, WMS creates appropriate getFeature queries to fetch the GML data from
WFSs. After getting the feature collections data from the WFS, WMS extracts all the
non-geometry elements and attributes in the returned GML files and create another text
or HTML file based on request parameter and create the response to getFeatureInfo
query in accordance with the return parameter defined by the client in the query. The
parameter called “INFO_FORMAT” defines the return format whose possible values are
plain text files, HTML and GML.
For the getMap request WMS extracts geometry elements from the returned GML
file but for the getFeatureInfo it extracts non-geometry elements. From the list of non-
geospatial elements, WMS creates a new XML file to be able to transform non-geometry
elements into HTML. This XML file is simply another form of GML, which includes just
non-geometry elements, properties and attributes. After creating new XML file from the
Page 63
49
non-geo elements, WMS creates HTML file from newly created XML file by using
generic XSL ("XSL," 1999) file and XSLT transformation machine. Figure 10 explains
the general architecture of creating a response from the GML file through generic XSL
stylesheet file given in Figure 13.
Figure 9: A snapshot of response to getFeatureInfo. It is actually an attribute querying of earthquake
seismic data layer shown on the map image.
Figure 10: Creating getFeatureInfo reponse by using a stylesheet and XSLT processor. See Figure 10
for generic stylesheet for GML.
(Figure-13)
Request parameters
for filtering GML
Page 64
50
Figure 11: GetFeatureInfo operation steps
Page 65
51
Figure 12: GetFeatureInfo Request Schema. See Appendix-A for an instance of this request
schema.
Page 67
53
Figure 13: Generic XSL file for HTML creation from the GML in order to create responses for the
getFeatureInfo.
3.3.3. Browser event-based Interactive Map Client Tools
Interactive information visualization tools provide researchers with capabilities to
interact with the complex systems seamlessly. We developed these tools for interacting
with standard Web Map Servers developed in Open Geographic Standards providing
OGC compatible online services such as getMap, getFeatureInfo and getCapabilities.
The tools provide structured multi-layered map images display (Figure 15 and Figure 16).
Structured data display is composed of multiple layers, and each layer is defined in the
corresponding WMS service‟s capabilities file. As discussed previously, capabilities files
are metadata defining services and data together. For WMS, the data are defined as layers
Page 68
54
(see Appendix C). For WFS, the data sets are defined as feature collections (see
Appendix D). Client tools enable users and decision makers to interact with the system
through interactive event-based maps seamlessly and easily by hiding the system
complexity. These tools also enable querying of the vector data in the multi-layered
structured map images shown on the screen (see Figure 9). They do so by using WMS‟s
standard getFeatureInfo service interface.
Several capabilities are implemented for the user to access and display geospatial
data. The client tools enable the user to zoom in, zoom out, measure distance between
two points on the map for different coordinate reference systems, to get further
information by making getFeatureInfo requests for the attributes of the features on the
map, and drag and drop the map to display different bounding boxes. Users can also
request maps for the area of interest by selecting predefined options by clicking the drop-
down list. The user interface also allows the user to change the map sizes from the drop-
down lists. Users can also give specific dimensions for the desired map size. Zoom-in
and zoom-out features let the user change the bounding box values to display the map in
more or less details. Each time a user changes the bounding box values, the user interface
shows the updated bounding box values at the each side of the map.
The proposed client tools are generic and capable of interacting with any other
WMS and WFS developed according to Open Geographic Standards. Our GIS portal is
deployed into Apache Tomcat ("Apache Tomcat Project," 2008). We have implemented
several capabilities for the decision makers to access and interpret geo-data seamlessly.
Our GIS portal is built up with the various technologies, including Java, Java Servlets,
Page 69
55
Java Server Pages (JSP), Java-Script, and Cascading Style Sheets (CSS) (E. A. Meyer,
2006).
Figure 15 shows the portal‟s interactive map tools and user interface enabling
interactive data access, query, and display over integrated data views (map images). The
sample map in the figure shows California earthquake seismic data superimposed over a
Google Map ("Google Map," 2005) image.
Figure 16 shows application-based decision-making tools extended from generic
map tools. Our client interface system is modular and can be updated according to the
application requirements in terms of parameters and output results. The sample project in
the figure superimposes earthquake forecasts generated by the Pattern Informatics
(Nanjo, Holliday, Chen, Rundle, & Turcotte, 2006) application over Google maps.
Map layers (their orders, numbers, attributes, etc.) are manipulated through the
parts A, C and D (Figure 16). Application output is manipulated through part B/E and
utilizes the parameters given in part A. Part C is the output screen and enables interactive
manipulation of the layers and interactive query of the feature data on the map. Part E is
used for animating successive static map images to create map movies from time series
feature data. Part A enables users to set the problem‟s bounding box, map size, specific
regions if zooming in, the layers to be overlaid, and project to work with. Part D consists
of map tools enabling zoom-in, zoom-out, drag and drop, and data query of the map
displayed in Part C. Part B enables users to enter parameters specific to the Geo-Science
application. For example, for the Pattern Informatics application (Nanjo et al., 2006),
users should enter the parameters “bin size” and “time steps”. Users can easily move
from one project to another by using drop-down list at the top-left corner.
Page 70
56
Here are the listings of the major generic action listeners for the user-map
interactions (see Figure 15).
<event_controller>
<event name="init" class="Path.InitListener" next="map.jsp"/>
<event name="REFRESH" class=" Path.InitListener " next="map.jsp"/>
<event name="ZOOMIN" class=" Path.InitListener " next="map.jsp"/>
<event name="ZOOMOUT" class="Path.InitListener" next="map.jsp"/>
<event name="RECENTER" class="Path.InitListener“next="map.jsp"/>
<event name="RESET" class=" Path.InitListener " next="map.jsp"/>
<event name="PAN" class=" Path.InitListener " next="map.jsp"/>
<event name="INFO" class=" Path.InitListener " next="map.jsp"/>
</event_controller>
Event “init” sets all to initial opening settings. Events "REFRESH", "ZOOMIN",
"ZOOMOUT", "RECENTER", "RESET" and "PAN" causes getMap request to WMS to
get layers in map images. Event “INFO” causes getFeatureInfo request to get further
information about feature data displayed on map images.
Zoom-in
Panning-move
Refresh/recenter
Random select
Zoom-out
Figure 14: Illustration of major event types
Page 71
57
Figure 15: Event-based interactive map tools capable of interacting with any map server developed
in Open Geographic Standards.
INTERACTIVE SCREEN
-ACTION LISTENERS-
EVENTS
Page 72
58
B and E parts in Figure 16 are application-based extensions to the standard map
tools given in Figure 15. The figure illustrates Pattern Informatics application. Color bar
and colored squares plotted over the map shows earthquake probability values sent out by
PI application.
Figure 16: Standard interactive map tools extended with capabilities of integrating map images with
outputs of Geo-science grid applications.
Application-based
extensions (Pattern
Informatics extensions)
Page 73
59
There are many related works in developing such a framework for interacting GIS
systems and enabling end-users to use such systems seamlessly. Our contribution is
developing a framework capable of interacting with service-oriented GIS systems with
AJAX (Serrano & Aroztegi, 2007) techniques. The following section gives more details
about this intermediary framework to synchronize Web Service and AJAX transport
protocols (SOAP over HTTP vs. XMLHttpRequest (Kesteren, 2008)) and corresponding
request/response formats.
3.3.3.1. Integration of AJAX approach to GIS Web Service Invocations
This section discusses the AJAX integration framework that we designed for
browser based web applications using Web Services. Our proposed framework enables
users to utilize AJAX and Web Services advantages together. Our major focus on
developing such a framework is the GIS domain, but the framework can be applied to any
browser event-based interactive user interfaces that communicate with Web Service
components.
As Web technologies continue to mature, we see an increasing number of
technologies that take GIS visualization applications to new levels of power and
usability. By integrating new powerful technologies into GIS systems, we get higher
performance results with additional functionalities. A recent development that has
captured the attention of the browser based application developers is AJAX
(Asynchronous JavaScript and XML). In this section, we present a generic and
performance efficient framework for integrating AJAX models into the browser based
GIS visualization Web Services systems.
Page 74
60
AJAX is an important development model for the browser-based web
applications. It uses several technologies that come together to create a powerful new
model. Technologies forming the AJAX model (XML, JavaScript, HTTP and XHTML)
are widely used and well known. Google Maps use this new powerful browser based
application model.
On the server side, Web Services are self-contained, self-described, and
composable. Unlike earlier, more tightly coupled distributed object approaches such as
Common Objects Request Brokers (CORBA) (Siegel, 1996), Web Service systems
support an XML message-centric approach, allowing us to build loosely coupled, highly
distributed systems that span organizations. Web Services also generalize many of the
desirable characteristics of GIS systems, such as standards for providing general-purpose
specifications for publishing, locating, and invoking services across the Web. Web
Services also use well-known technologies such as XML and HTTP as AJAX does. Since
AJAX and Web Services are XML based structures they are able to leverage each other‟s
strength.
There are some GIS projects adapting only Web Services or only AJAX
approaches into their GIS systems but not both. That is because of the idea that they are
totally different technologies using different communication protocol and it is impossible
to use them in the same framework. To give examples, ESRI, Cubewerx, Demis and
Intergraph are adapting Web Service technologies and Google Maps, and KA-Map (T.
Mitchell, 2005) are adapting AJAX to their GIS systems.
The project ECMAScript ("ECMA,") (ECMAScript Language, 1999) for XML
(E4X) is the only related work involving AJAX and Web Services together. E4X is a
Page 75
61
simple extension to JavaScript that makes XML scripting very simple. The European
Computer Manufacturers Association (ECMA) is the standards body where JavaScript is
standardized. E4X is compatible with AJAX technologies without extension.
Via E4X, developers do not have to use XML parsers such as DOM (Apparao et
al., 1998) or SAX (Means & Bodie, 2001). Instead, XML documents become one of the
native types that JavaScript understands. Developers can update XML documents from
the JavaScript very easily. These properties of E4X enable creating calls to Web Services
from the browser, but not all the browsers support it. E4X helps to interact with Web
Services, but again it is just an extended version of JavaScript. Some issues such as how
to put Web Service requests in SOAP messages and how to manipulate the returned
SOAP messages are still complicated.
In our approach, developers don‟t have to extend any technology involved in the
AJAX model. We use all the technologies in AJAX with their original forms. This gives
the developers and users the ability to integrate and customize their applications easily.
We first present the intermediary component to synchronize AJAX and Web
Service protocols in terms of request and responses. Later, we give a sample scenario.
3.3.3.2. AJAX & Web Services Synchronization Framework
AJAX uses HTTP GET/POST requests (through JavaScript‟s XMLHttpRequest)
for the message transfers (see (A) in Figure 17). Web Services use Simple Object Access
Protocol (SOAP) as a communications protocol (see (B) in Figure 17) In order to be able
to integrate these two different message protocols, we must convert the message formats
into a common format or make them interoperable. Since there is no ready-to-use
Page 76
62
common protocol to handle messages communications between AJAX and Web
Services, we implemented a simple message conversion technique (see (C) in Figure 17).
This essentially works by having the XMLHttpRequest communicate with a Servlet,
which in turn acts as a client to a remote Web service. This allows us to easily convert
between SOAP invocations and HTTP POSTS. It also has the benefit of avoiding
JavaScript sandbox limitations: normally the XMLHttpRequest object in the browser can
only interact with its originating Web server.
Figure 17: (A) Pure AJAX Approach, (B) Web Services Approach, and (C) Hybrid (AJAX + Web
Services) Approach.
Page 77
63
The client browser makes a request to the server broker (via a JSP page), which in
turn makes a request to the Web Service by using previously prepared Web Service client
stubs. The response from the Web Service is then transformed by the service broker, and
presented to the client browser. Below we go in more detail to explain all these steps.
Accessing Web Services from AJAX Using an Intermediary Server
The client first creates an XMLHttpRequest object to make a remote scripting
call.
- var http = new XMLHttpRequest();
Then, define the end-point as an URL to make a call. The URL address should be
local. This an intermediary proxy service to make appropriate requests for the GIS Web
Service.
- var url = “proxy.jsp”;
Then, make a call to the local proxy service end point defined above by the user
given parameters.
- http.open (“GET”, url + ”?bbox = “ + bbox +…[parameter-value pairs]……)
proxy.jsp is an intermediary server page to capture request (HttpServletRequest)
and response (HttpServletResponse) objects. Proxy JSP includes just one line of code to
forward the HttpServletRequest and HttpServletResponse parameters coming from the
first page via XMLHttpRequest protocol.
Page 78
64
- jb.doTask(request,response)
“request” and “response” parameters come from the user interface page. This first
page includes some JavaScript, XHTML, CSS and JSP to capture the user given
parameters and to display the returned result on the screen.
“jb” is a Java class object which handles creating appropriate requests by using its
request-response handlers and Web Service client stubs. Request-response handler also
handles receiving and parsing response object coming from GIS Web Services interacted
with.
After having received response from the GIS Web Service, “jb” object sends the
returned result to XMLHttpRequest object in the first page.
- PrintWriter pw = response.getWriter();
- pw.write(response);
XMLHttpRequest object at the user interface page captures this value by making
a call as below
- http.onreadystatechange = handleHttpResponse
This generic integration architecture can be applied to any kind of Web services.
Since return types of each Web services are different and they provide different service
API, you need to handle application specific implementations and requirements in
browser based client side.
Page 79
65
In the following section, we prove the applicability and efficiency of the proposed
integration framework by giving a usage scenario.
3.3.3.3. A Use Case Scenario: Overlaying OGC’s Maps with Google Maps
Integration is accomplished by coupling AJAX actions with Web Services
invocations and by synchronizing the actions and returned objects from the point of end
users. The usage scenarios explained below use the generic integration architecture
illustrated in Figure 17-C. In the usage scenarios there will be minor difference in the
form of extensions. Differences come from the service specific requests created
according to the service provider‟s service API (published as WSDL), or handling
returned data to display on the screen. But these are all implementation differences.
Figure 18: Integration of Google Maps with OGC WMS by using architecture defined in Figure 16.
Page 80
66
Web Map Service returns maps in the form of images such as JPEG, GIF and
PNG. Web Map Service clients get the maps in image formats and overlays them.
Ordinary Web Map Service clients cannot use maps coming from Google Map Servers.
To solve this problem and use interactive Google maps in our Web Map Service
applications, we created an intermediary Google Mapping Server. This approach will also
support overlaying different map layers coming from the common Web Map Service with
the Google Maps ("Google Map," 2005). The intermediary server takes Web Map
Service compatible requests from the Web Map Service clients, converts these requests
into a new form that real Google Map Server can understand. In contrast to Open
Geospatial Consortium compatible getMap requests, Google Map server uses requests
with different parameters such as zoom level, tile numbers and tile width.
Evaluation of the approach: If the GIS visualization client uses Web Services
from the desktop browser application and Web Services are capable of responding fast
enough, then using the AJAX model for calling Web Services gives high performance
increases. Since both AJAX and Web Services use XML based protocols for the request
and responses, they leverage their advantages. This framework enables application
developers to easily integrate AJAX based browser applications into Web Services.
AJAX and Web Services make use of XML message structures. This property
allows developers to utilize their advantages together. Our proposed system enables
AJAX based high performance web application approaches to utilize web services. If
Web Service based applications have web based user interface for end users, then using
this framework makes displays interactive. Users do not need to wait for the whole data
to be received to render and display the results. Partial displaying is possible without
Page 81
67
refreshing the whole page. Instead of making request for whole page, only the interested
part will be requested. This also reduces the workload of the network traffic.
In addition to its advantages, the proposed system has a couple of disadvantages.
The proposed integration framework introduces some extra work for web application
developers. This extra work mostly comes from the conversion of parameters to be able
to make compatible requests to remote Web Services. In order to make valid requests, the
proxy server should be deployed locally, and client stubs for Web Service invocations
should be created before running the application. Compared to a pure AJAX based web
application, the performance of the application is reduced by the intermediary proxy
server during its conversion and message handling jobs, but the gains (from our
experiences) are much higher than the overhead times coming from the proposed
intermediary service. This is not demonstrated in this thesis.
Page 82
68
CHAPTER 4
FINE-GRAINED FEDERATION OF GIS WEB-
SERVICE COMPONENTS
Our federation framework provides an infrastructure for understanding and
managing the production of information from distributed observation, simulation and
analysis through integrated data-views in the form of multi-layered map images. Our
infrastructure is based on a common data model, OGC compatible standard GIS Web-
Service components and an extension of the Web Map Server, the federator service. The
federator aggregates GIS services and enables unified data access/query and display over
integrated data-views.
In the current context, the term “federation” means providing one global view of
several data sources that are processed as one source. There are three general issues here.
Page 83
69
The first is the data modeling (how to integrate different source schemas). The second is
their querying (how to answer the queries posed on the global schema). The third is the
common presentation model of data sources, i.e. mapping of common data model to a
display model enabling integration and overlaying with other data sets to create an
integrated data view. The first two research issues are related to lower level (database and
files) data format, query, and access heterogeneities that may be summarized as semantic
heterogeneity. In our research framework, Open Geographic Standards specifications for
data models (GML) and online services (WMS and WFS) solve the first two issues, but
we must address the third.
Our extended standard GIS Web Service components are integrated into the
system through the federator service, which is actually a WMS that is extended with
capability-aggregating and stateful service capabilities. These enable
definition/organization of distributed data sources into shared collections, and high
performance support for the responsive unified queries.
The proposed federation architecture is similar to Integrated Rule-Oriented Data
System (IRODS) (Cao & Wan, 2008; Hedges, Hasan, & Blanke, 2007) in terms of
research concerns. IRODS is a federated data system developed at San Diego Super
Computing Center (SDSC). It is based on expertise gained through nearly a decade of
applying the SRB (Doherty, Blanshard, & Manandhar, 2003; Rajasekar, Wan, & Moore,
2002) technology in support of data Grids, digital libraries, persistent archives, and real-
time data systems. IRODS management policies (sets of assertions these communities
make about their digital collections) are characterized in IRODS rules and state
information. At the IRODS core, a rule engine interprets the rules to decide how the
Page 84
70
system is to respond to various requests and conditions. In contrast, in our framework we
don‟t need such rules, we use standard data components and their standard service
interfaces defined with distributed capability metadata. Moreover, IRODS and SRB use
central metadata catalog services - ICAT (or MCAT) ("MCAT," 1998) – for discovering
data and services. MCAT is based on database relation tables. On the other hand, our
proposed framework is based on aggregation of standard capability metadata files of the
distributed data components. These metadata files can be accessed and queried remotely
through the standard service interfaces. Different from the SRB and IROD, we also
enable view-level federation and unified access/query over the integrated data view as a
representation of shared data collections.
This section describes the implementation of view-level information presentation
through federation of standard GIS Web Service components. The framework is designed
for GIS domain; however we present the generalization architecture in terms of principles
and requirements in Section 7.
4.1. Geo-Data and integrated data views
Geo-data is provided by geographically distributed services from many different
vendors in different formats, stored in various different storage systems and served
through heterogeneous service API and transport protocols. The heterogeneity of
geographic resources may arise for a number of reasons, including differences in
projections, precision, data quality, data structures and indexing schemes, topological
organization (or lack of it), set of transformation and analysis services implemented in the
source.
Page 85
71
The OGC and ISO/TC-211 have tried to address these issues. The specifications
for data models and online service descriptions define compliance requirements at data
and service API level. In brief, according to the standard specifications there are three
general groups of data services: Web Map Services, Web Feature Services, and Web
Coverage Services (Evans, 2003). WMS provides rendered data in maps in MIME/image
formats; WFS provides annotated feature-vector data in XML-encoded GML, and WCS
provides coverage data as objects or images. Since they have standard service
programming interfaces and capability metadata about their services and data, they can
be composed, or chained, by capability exchange and aggregation through their common
service method called getCapability.
This idea has inspired us to develop an infrastructure for creating and managing
the production of knowledge from distributed observation, simulation and analysis
through integrated data views in the form of multi-layered map images (see Figure 19).
This approach enables unified data access, query, and display from a single access point.
As shown in the figure, the geo-data is accessed through a federator service, and data is
always kept in its originating resources. They are integrated into the system with user‟s
on-demand querying (just-in-time federation). This enables easy data maintenance and
autonomy.
There is a three-level hierarchy of data. At the top layer, the federator service
provides human comprehensible data display in multi-layered map images. The
federators compose the data from the standard data services located at the middle level
(WMS and WFS). The bottom levels consist of heterogeneous data sources integrated
into the system through standard data services at the middle level. WMS instances are
Page 86
72
rendering and displaying services, and WFS instances are mediator/adaptor services.
These provide heterogeneous data in common data model as well as resource and data
specific query and response conversions.
Heterogeneous data sources, which form the bottom layer of the hierarchy, are
integrated into the system through mediators. Mediators provide an interface for the local
data sources and play the roles of connectors between the local source and the global one.
Mapping rules that express the correspondence between the global schema (GML) and
the data source ones are essential. The problem of answering queries is another point of
the mediation integration – a user poses a query in terms of a mediated schema (such as
Figure 19: Data life-cycle and integrated data-view creation.
Page 87
73
getFeature to WFS), and the data integration system needs to reformulate the query to
refer to the sources. Therefore, an information integration architecture emerges based on
a common intermediate data model (GML) providing an abstraction layer between legacy
storage structures and exposed interfaces. In our system, we use OGC standards to enable
these interfaces.
There are several advantages in adopting the approach shown in Figure 19. The
mediators not only enable data sources integrated into the system conform to the global
data model, but also enable the data sources to maintain their internal structure. In the
end, the whole mediator system provides autonomy. The integration process does not
affect the individual data sources‟ functionality. These data sources can continue working
independently to satisfy the requests of their local users. Local administrators maintain
control over their systems and yet provide access to their data by global users at the
federation level.
The remainder of the chapter focuses on upper levels (view-level) of dataflow and
query refinements illustrated in Figure 19. Since we have developed OGC‟s standard
services as Web Service components, they can be chained and orchestrated with Web
Service workflow tools, such as Kepler (Ludäscher et al., 2006) and Taverna (Turi,
Missier, Goble, Roure, & Oinn, 2007). We do not attempt to delve into those issues in
this chapter. We instead focus on the definition of service compositions and integrated
data views as presented in the following sections. Workflow execution abstraction is a
higher-level abstraction than the capability metadata federation that we investigate.
Page 88
74
4.1.1. Hierarchical Data Definition and Multi-layer Maps
Hierarchical data is defined as an integrated data-view in the federator‟s
capability metadata. It actually defines a static workflow starting from the federator and
ending at the original data sources (WFS serving GML or WMS serving map layer
images). The services are linked through the reference-tags defined in their capability
metadata. Users‟ interactions with the system are carried over the integrated data views
through event-based interactive map tools. Integrated data-views are defined in the
hierarchical data format as explained below:
Map -> Layer -> Data (GML / binary images) ->Raw data (any type).
A map is an application-based, human-recognizable, integrated data display and is
composed of layers. A layer is a data rendering of a single homogeneous data source.
Layers are created from the structured XML-encoded common data model (GML) or
binary map images (raster data). Heterogeneous data sources (raw data) are integrated
into the system as GML or binary map images through the resource specific mediators.
The mediators have resource specific adaptors for request and response conversions and
appropriate capability metadata describing the data and resources.
Different applications need different maps that are composed of different data
layers in different numbers and combinations (Figure 20). Maps are multi-layered,
complex structures whose layers come from distributed heterogeneous resources and are
rendered from many different types of geospatial data. This type of multi-layered map
image is defined and managed in the federator with utilization of its cascading WMS
properties and inter-service communication between the components.
Page 89
75
4.2. Federation Framework
Our federation framework is built over a service-oriented GIS framework and its
components (WMS and WFS). Federation is based on federating capabilities metadata
from the GIS Web Services components. Capabilities are aggregated through inter-
service communication using standard service interfaces. We do not define common data
models, online standard service components and their capability metadata definitions in
GIS. These are already defined by Open Geographic Standards (OGC). We instead have
developed the components according to the open standard specifications, and applied
them to our proposed information system framework by defining required extensions at
implementation and application levels in compliance with WS-I Web Service standards
(Sayar et al., 2005b). They also serve as a test bed for implementing and testing general
concepts in service architectures.
This section presents a federation framework based on common data models
(GML), standard Web Service components, federator and event-based interactive
decision making tools over integrated data views in the form of multi-layered map
images. The general architecture is illustrated in Figure 20. This figure presents the
proposed federation framework with a sample application using earthquake seismic data
(from WFS) and NASA satellite map images (from WMS). WMS is the NASA OnEarth
server located at the NASA Jet Propulsion Laboratory (JPL) ("OnEarth," 2007) and WFS
is located at Community Grids Labs (CGL) at Indiana University.
Page 90
76
The framework enables users (i.e., decision-makers) to access the system as
though all the data and functions come from one site. The data distribution and
connection paths stay hidden and formulated as hierarchical data defined in federator‟s
capability metadata. The users access the system through integrated data-views (maps)
with the event-based interactive mapping display tools (Sayar et al., 2006). These tools
transform the users‟ actions into abstract queries through action listeners and enable
client interaction with the system via the federator.
As shown in Figure 20, the federator is actually a WMS (Kolodziej, 2004) with
extended capabilities and functionalities (see Chapters 4.3.1.1 and 4.3.1.2). These can be
summarized as aggregating capability metadata from distributed standard GIS services
Figure 20: Federated GIS framework.
Page 91
77
and orchestrating/synchronizing requests and responses over the composition of data
services referenced in aggregated capability metadata. The federator enables stateful
service access over the stateless GIS Web Service components, and results in a better
performance for responsive GIS systems. These issues are addressed in Chapter 6.
Interactive information visualization tools provide researchers with capabilities to
support discovery. We developed these tools for interacting with standard WMS
providing OGC compatible online services such as getMap, getFeatureInfo and
getCapabilities. Since the federator is also a WMS, clients still use getMap service
interface to display multi-layered map images and/or query it through getFeatureInfo
service interface. The system removes the burden of accessing each data source with ad-
hoc query languages such as SQL for MySQL source, and enables interactive feature
based querying besides displaying the data. It also enables easy data-maintenance and
high degree of autonomy.
The federation framework is based on a two-stage process. The first stage is the
setup (or initialization) stage. The second stage is the application run-time stage. In the
setup stage, an integrated data-view (in the form of multi-layered map image) is defined
in the federator‟s aggregated capability metadata. The federator searches for standard GIS
Web Service components (WMS or WFS) providing required data layers and organize
them into one aggregated capability file (see the following section). This is shown as
dotted lines in the Figure 20. There is no client/user interaction with the system in this
first stage. In the second stage (run-time stage), a user/client interacts with the system
through a browser that provides event-based interactive display and query tools over the
integrated data-view. The second stage is illustrated with solid arrows in the figure.
Page 92
78
How Federation runs:
1. Set-up stage –dotted lines, there is no client/user interaction yet
a. Creation of application specific hierarchical data definitions
i. Service compositions in federator‟s aggregated capability
metadata through getCapability standard service interfaces.
ii. Federator searches for standard GIS Web Service components
(WMS or WFS) providing required data layers and organize
them in one aggregated capability file.
iii. Aggregated capability is basically a WMS capability created by
utilizing cascading definition of OGC standards (see Chapter
4.3).
b. Federator provides that aggregated capability metadata to its clients
through its getCapability service interface.
2. Application Run-time (green lines, actual user interactions with the system):
Users access/query and display data sources from a single access point
(federator) over integrated data-views (multi-layered map images) defined in
federator‟s aggregated capability metadata.
a. Clients/user interacts with the system through event-based interactive
map tools associated with the federator with the help of its aggregated
capability metadata.
b. Since federator is also a WMS, clients still use getMap service
interface to display multi-layered map images and/or query it
through getFeatureInfo service interface.
Page 93
79
c. On Demand Data Access: There is no copying of the data at any
intermediary places. Data are kept at their originating sources.
Consistency and autonomy.
The issues regarding creation of aggregated capability metadata and multi-layered
map images definitions are presented in Chapter 4.3.
4.3. Service Federation through Capability Aggregation
Capabilities are metadata about the data and services and have an XML schema
that is defined by Open Geospatial Consortium (OGC). Capability descriptions include
information about data and its corresponding operations with the attribute-based
constraints and acceptable request/response formats. It supplements the Web Service
Description Language (WSDL) (Christensen et al., 2001), which specifies key low-level
message formats but does not define information or data architecture. These are left to
domain specific capabilities metadata and data description languages (such as GML).
Capabilities also provide machine and human readable information that enables
integration and federation of data/information. Capabilities also aid the development of
interactive, re-usable client tools for data access/query and display. We use the open
standard specifications‟ definitions and present the required extensions for the federation
through hierarchical data creation by service chaining.
The integrated data-view in multi-layered map images is defined in the federator‟s
aggregated capability metadata. There are two major issues here: a) definition of
aggregated capability metadata and b) definition of multi-layered map images.
Page 94
80
As mentioned earlier, the federation framework is built over the standard GIS
Web Service components, and the federator concept is inspired from OGC‟s cascading
WMS definition (Beaujardiere, 2004). In this respect, the federator is actually a cascading
WMS with extended capabilities. In the following sections, we describe how we apply
OGC‟s ideas related to the service chaining and aggregation, and define multi-layered
map images in the aggregated capability metadata.
4.3.1. Extending WMS as a Federator Service
The federator is actually a cascading Web Map Server. A cascading Web Map
Server is a WMS that behaves like a client to other WMSs and like a WMS to other
clients. It can receive input from other WMS (and WFS) and display layers from them.
For example, a cascading Web Map Server can aggregate the contents of several distinct
map servers into one service. Furthermore, it even perform additional functions such as
output format conversion or coordinate transformation on behalf of other servers.
There are two possible ways to chain the services to be able to create a federator
framework and application specific hierarchical data in integrated data-view. One is
extending the WMS capability file by giving the reference to the service access points
providing the required layer (WMS) and/or feature data (WFS). Another way is using
Web Map Context‟s standards defining chaining in a context document (described
below). In any case, we utilize the cascading WMS definitions to develop a federator
providing information/knowledge in multi-layered map images.
Page 95
81
4.3.1.1. Federating through Context Document:
OGC‟s WMS and WFS services are inherently capable of being cascaded and
chained in order to create more complex data/information. In order to standardize these
issues, OGC has introduced the Web Map Context (WMC) (Sonnet, 2005) standard
specifications. Before that, OGC recommended application developers to extend their
services‟ capabilities for cascading. WMC is a companion specification to WMS.
The present context specification states how a particular grouping of one or more
maps from one or more map servers can be described in a portable, platform-independent
format for storage in a repository or for transmission between clients. This description is
known as a "Web Map Context Document," or simply a "context." Presently, context
documents are primarily designed for WMS bindings. However, extensibility is
envisioned for binding to other services.
A context document is structured using XML, and its standard schema is defined
in the WMC specifications (Sonnet, 2005). A context document includes information
about the server(s) providing layer(s) in the overall map, the bounding box and map
projection shared by all the maps, sufficient operational metadata for client software to
reproduce the map, and additional metadata used to annotate or describe the maps and
their provenance for the benefit of end-users.
There are several possible uses for context documents besides providing chaining
and binding of services. The context document can provide default startup views for
particular classes of users. For example, specific applications require a specific list of
layers. The context document can store not only the current settings but also additional
information about each layer (e.g., available styles, formats, spatial reference system,
Page 96
82
etc.) to avoid having to query the map server again once the user has selected a layer.
Finally, the context document could be saved from one client session and transferred to a
different client application to start up with the same context. In this document, we just
focus on its binding functionalities.
<ViewContext version="1.0.0" id="OGCContext" xmlns:xsi="http://www.w3.org/2001/XMLSchema-instance" xmlns:xlink="http://www.w3.org/1999/xlink" xmlns:xs="http://www.w3.org/2001/XMLSchema"> <General> <Window width="500" height="400" /> <BoundingBox srs="EPSG:4326" minx="-180.00" miny="-90.00" maxx="180.00" maxy="83.62" /> <Title>Maps for Pattern Informatics Application</Title> <Abstract /> </General> …. <LayerList> <Layer queryable="1" hidden="0"> <Extension infoFormat="text/xml" ID="4e4b-83e" editable="0" local="1" /> <Server service="WFS" version="1.1.0" title="CGL_WFS"> <OnlineResource xlink:href="http://cgl/wfs/services" /> </Server> <Name>World Seismic</Name> <Title>Earthquake Seismic Data</Title> <Abstract>Sample WMS to WFS layer cascading</Abstract> <DataURL format="text/xml"> <OnlineResource xlink:href="http://cgl/wfs/services" /> </DataURL> <SRS>EPSG:4326</SRS> <FormatList> <Format current="1">image/png</Format> </FormatList> ….. </Layer> <Layer hidden="0"> <Extension infoFormat="text/html" ID="1fc-4e4b-83e" editable="0" local="1" /> <Server service="WMS" version="1.1.1" title="CGL_WMS"> <OnlineResource xlink:href="http://nasawmsserver/wms/services " /> </Server> <Name>Nasa Satellite</Name> <Title>Nasa Satellite Data</Title> <Abstract>Sample WMS to WMS layer cascading</Abstract> <DataURL format="text/xml"> <OnlineResource xlink:href="http://nasawmsserver/wms/services" /> </DataURL> <SRS>EPSG:4326</SRS> </Layer>
WMS to WFS cascading
WMS to WMS cascading
Page 97
83
….. </LayerList> … </ViewContext>
The unnecessary details at the above context file are truncated. We just use related
elements and tags for the data cascading and service binding.
4.3.1.2. Federating through Aggregated WMS capability
This is another alternative approach to extend the WMS as a federator. It is based
on extending the standard WMS capabilities file (Figure 21). For the standard schema file
of the WMS capabilities see ("OGC Schema," 2008)
WMS defines its provided data sets as layers of images under the XML tag named
“layer” with the attributes and features according to the standard WMS capability schema
(Beaujardiere, 2004). Service chaining is accomplished through the cascaded layer
definition. A layer has been "cascaded" if it was obtained from an originating server and
then included in the capabilities metadata of a different server. The second server may
simply offer an additional access point for the layer, or may add value by offering
additional output formats or spatial reference systems.
If a WMS cascades the content of another WMS, then it must increment the value
of the attribute “cascaded” of the corresponding layer by 1. If that attribute is missing
from the originating WMS's capabilities metadata (that is, the layer has not been
cascaded before), then the Cascading WMS inserts the “cascade” attribute to the layer tag
and set it to 1. The default value of cascading is 0 (Kolodziej, 2004).
Page 98
84
In order to illustrate service federation, we give a practical Geo-science
application as an example. In the Pattern Informatics (PI) application (Tiampo, Rundle,
Mcginnis, & Klein, 2002), decision makers need to see earthquake forecast values and
seismic data records plotted on satellite map images (see Chapter 5.2). Satellite map
images are provided by NASA OnEarth project‟s WMS at the NASA Jet Propulsions
Laboratory, and earthquake seismic data records are provided from WFS at the
Community Grids Labs (CGL) at Indiana University. The federator aggregates these
services‟ standard capability metadata and creates an aggregated one as if those data sets
are its own. The users access the system as though all the data and functions come from
that federator. The data distribution and connection paths stay hidden and formulated in
federator‟s aggregated capability metadata.
The federator lists the references to federated data and services in a specific WMS
tag element (called “Layers”). The federator publishes these data sets as if they were its
own. References are defined as bindings to the federated standard data services. In order
to federate GML data from WFS, the federator needs web service invocation address and
path to query schema for the corresponding data sets. In order to federate map images
from other WMS, the federator needs only the Web Service invocation address of the
corresponding WMS. This information is extracted from the federated WMS and WMS‟s
capabilities metadata accessed remotely through the standard service interface called
getCapability.
Page 99
85
Figure 21: Federator's aggregated capability metadata.
The federator‟s capability metadata (Figure 21) consists of two main parts. These
are “Service” and “Capability”, defined under the corresponding tag names. The service
metadata provides general information for the service as a whole. It shall include a name,
title, and URL address of the online resource. Optional service metadata include abstract,
keyword list (to be searched in catalog/registry services), contact information to service
admin, access constraints, and limits on the number of layers in a request or the output
size of maps.
Page 100
86
The tag <Capability> element of the service metadata names the actual operations
that are supported by the server, the output formats offered for those operations, and the
URL prefix for each operation. It is consists of two parts. The first part is related to
interface level request/response definitions (under tag element <Request>), and the
second part is related provided data sets described as layers (under the tag element
<Layers>).
The tag <Request> names the actual operations that are supported. It also has
some sub-tags about offered output formats and URL prefixes for each operations. The
tag <Layers> lists and defines the provided data/information sets. The geographic
information content offered by a WMS server is organized into "layers": metadata about
the content is subdivided into descriptions of each layer, and a request for a map specifies
one or more layers.
The tags briefly given in Figure 21 and have also more detailed domain specific
sub-tags and attributes such as available bounding boxes (bbox), Spatial Reference
Systems (SRS), output formats, etc. formed according to the standard schema ("OGC
Schema," 2008). Please also see APPENDIX-C for more detail on the layer attribute
settings mentioned above for chaining/cascading of services and their descriptions in
federator‟s capability metadata.
Figure 22 shows an instance of a list of federated WMS and WFS data services
under the tag “Layers” for the Pattern Informatics Geo-science application also given in
Chapter 5.2.
Page 101
87
Figure 22: Example federated data sets defined in federator’s metadata.
Page 102
88
CHAPTER 5
APPLICATIONS OF THE FEDERATION
FRAMEWORK
Our proposed service-oriented federated GIS framework architecture, its
components WMS Web Services and browser event-based interactive decision making
tools have been used in several GIS projects. This chapter discusses three of them. One is
Los Alamos National Laboratory project ("LANL," 2007) (Chapter 5.1) and other two are
Solid Earth Virtual Observatory Grid (SERVOGrid) projects (Chen et al., 2003) (Aydin
et al., 2005) (Chapter 5.2 and Chapter 5.3).
Page 103
89
5.1. The National Infrastructure Simulation and Analysis
Center (NISAC)
The National Infrastructure Simulation and Analysis Center (NISAC) at Los
Alamos National Laboratory (LANL) develop advanced modeling and simulation tools
for analysis of the critical infrastructure. These tools allow authorities to understand
interdependencies, vulnerabilities, and complexities of the infrastructure and help
develop policies, investment plans, education and training etc for crisis situations (T. W.
Meyer et al., 2003).
The Interdependent Energy Infrastructure Simulation System (IEISS) (Bush &
others, 2003) embodies analysis software tools developed at Los Alamos National
Laboratory with the collaboration of Argonne National Laboratory ("ANL," 2008).
IEISS aims to develope a comprehensive simulation study of the nation‟s interdependent
energy infrastructures to address wide variety of intra-and inter-infrastructure
dependency questions. The IEISS analysis tool has physical, logical, or functional entities
that have variety of attributes and behaviors that mimic its real-world counterpart.
Traditionally IEISS runs as a desktop application with local input data supplied as
XML files collected from various sources, and the result is locally generated. The data
are either kept in databases such as Environmental System Research Institute ("ESRI,"
2007) spatial database or in proprietary XML files. The user who runs the application
collects the data to local machine and runs the simulation. The results are usually shared
with e-mails. However, this approach has several limitations. Every time the simulation is
to be run, the data have to be copied to the local file system. There is no way of running
the simulations and getting the results remotely.
Page 104
90
We have worked with IEISS developers at LANL and applied our GIS Grids
ideas to create a service-oriented Architecture for Los Alamos National Laboratory
(LANL), National Infrastructure Simulation and Analysis Center (NISAC). We have
integrated several Web Services including Web Map Service and interactive event-based
decision making and map-data display tools with IEISS (Interdependent Energy
Infrastructure Simulation System) (Bush, 2004). In our sample service-oriented
architecture demonstration, we were able to invoke IEISS to simulate interdependencies
between electrical and natural gas infrastructure components using a provided sample
data set. The data do not actually correspond to real-world infrastructure maps. However
it allowed us to demonstrate that the normally desktop-based simulation applications
could be integrated into a Grid architecture using Web Services approach.
In summary, we have created an architecture consisting of several Web Services
that expose IEISS as a Web Service and show the analysis results on an interactive online
mapping application.
The major data flow in IEISS is in accordance with the general flow as expressed
in Figure 2. The overall proposed architecture for IEISS is shown in Figure 23. Figure 24
shows a snapshot of system client interaction GUI and a sample output. Output image
shows overlays of feature data layers on a satellite picture provided by the NASA
OnEarth WMS Server ("OnEarth," 2007). Feature data in that application are electric and
natural gas infrastructure components provided by WFS in GML common data model.
The components of the architecture (Figure 23):
Feature Database: This is our MySQL spatial database, which holds various
geospatial features such as California faults and earthquake data, US state borders, global
Page 105
91
seismic hotspots etc. For the NISAC SOA demonstration we have acquired a sample
XML file which contains natural gas and electric power components for the State of
Florida. This sample data is inserted into feature database as two distinct feature types.
This allows us to make geospatial queries on feature data as GML components.
Web Feature Service: Provides interfaces to access and query the Feature
Database. The features are provided as GML Feature collections, which then can be used
as map overlays or for geo-processing etc. We have created lightweight WFS in this
project (WFS-L), which receives the new model XML created by IEISS, converts to
GML and publishes to NB. This is actually a WFS server and developed by Galip Aydin.
UDDI Registry: This service provides an API for publishing and discovery of
geospatial and visualization services. It extends existing Universal Description,
Discovery and Integration (UDDI) (Clement, Hately, Riegen, & Rogers, 2004)
Information Model to provide GIS domain specific Information Services.
Web Map Client: It provides a user interface that displays the map overlays and
allows client interaction with the maps. It also synchronizes and controls all the user
interactions with the system.
Web Map Server: Relays the client requests to the WFS, and receives the response
as GML documents. WMS then converts GML to map images (JPG, TIFF, SVG etc.) and
forwards these to the Web Map Client.
Page 106
92
Figure 23: NISAC SOA Demonstration Architectural Diagram and Data Flow.
Page 107
93
NaradaBrokering (Pallickara & Fox, 2003): This is a standalone
publish/subscribe service. Allows providers to publish their data products to topics and
forwards this data to the subscribers of a particular topic. We use NaradaBrokering as the
messaging substrate of the system. All GML and XML data transport is done through this
service.
Context Service (Little, Newcomer, & Pavlik, 2007): The Context Service
provides a dynamic, fault tolerant metadata hosting environment to enable services to
share information within a workflow session to correlate their activities. This service is
developed by Mehmet Aktas at CGL Labs ("CGL," 2001).
Context Respondent Handler: The Context Response Handler is used to
communicate with the Context Service. It allows Context Service to inform its consumers
about results of the operations.
gml2model Tool: Geospatial data exchange format for the system is GML.
According to the user‟s selection WFS encodes requested geospatial feature data in GML
and publishes to a certain NaradaBrokering topic. A NaradaBrokering Subscriber tool is
used to save GML FeatureCollection published by WFS into a file. IEISS requires input
data to be in a certain format called XML Model. We wrote a tool called gml2model to
convert GML FeatureCollection documents to IEISS XML Model format.
shp2gml Tool: One type of the IEISS outputs is ESRI Shape files which show
calculated outage areas etc. We use an open source tool called shp2gml by open source
deegree project ("Deegree," 2001) to convert these shape files to GML, which are sent to
WMS Client by the lightweight WFS.
Page 108
94
The data flow in this architecture:
0. WFS and WMS publish their WSDL URL to the UDDI Registry
1. User starts the WMS Client on a web browser; the WMS Client displays the
available features. User submits a request to the WMS Server by selecting desired
features and an area on the map. WMS Client is actually the event-based
interactive map tools.
2. WMS Server dynamically discovers available WFS that provide requested
features through UDDI Registry and obtains their physical locations (WSDL
address).
3. WMS Server forwards user‟s request to the WFS.
4. WFS decodes the request, queries the database for the features and receives the
response.
5. WFS creates a GML FeatureCollection document from the database response and
publishes this document to NaradaBrokering topic ‘/NISAC/WFS’; WMS Server
and IEISS receive this GML document.
WMS Server creates a map overlay from the received GML document and sends
it to WMS Client which in turn displays it to the user. After receiving the GML
document IEISS NB Subscriber invokes gml2model tool; this tool converts GML
to XML Model format to be processed by IEISS.
6. User invokes IEISS through WMS Client interface for the obtained geospatial
features, and WMS Client starts a workflow session in the Context Service. On
receiving invocation message, IEISS updates the shared state data for the
workflow session to be “IEISS_IS_IN_PROGRES” on the Context Service. Both
Page 109
95
IEISS and WMS Client communicate with Context Service via asynchronous
function calls by utilizing Context Respond Handler Service. IEISS runs and
produces an ESRI Shape file that has the outage areas for the given region.
7. IEISS invokes shp2gml tool to convert produced Shape file to GML format. After
the conversion IEISS updates shared session state to be “IEISS_COMPLETED”.
As the state changes, the Context Service notifies all interested workflow entities
such as WMS Client. To notify WMS-Client, the Context Service publishes the
updates to a NaradaBrokering topic (/NISAC/Context://IEISS/SessionStatus) from
which the WMS-Client receives notifications.
8. WMS makes a request to the WFS-L for the IEISS output
9. WFS-L publishes the IEISS output as a GML Feature collection document to NB
topic ‘NISAC/WFS-L’. WMS Server is subscribed to this topic and receives the
GML file then converts it to map overlays
10. WMS Client displays the new model on the map
Page 110
96
Figure 24: Sample Florida State Electric Power (red lines) and Natural Gas Components (blue lines)
as overlays on a Satellite images provided by NASA WMS.
Figure 24 shows a sample IEISS output; the blue region depicts the affected
outage area. This image is generated by the Web Map Service. The blue region is the
affected area calculated by IEISS because of a possible problem with the energy
infrastructure.
5.2. Pattern Informatics (PI), Earthquake Science
The Pattern Informatics (PI) (Tiampo, Rundle, Mcginnis, & Klein, 2002)
(Tiampo, Rundle, Mcginnis, Gross, & Klein, 2002) method uses observational data to
Page 111
97
identify the existence of correlated regions of seismicity. The method does not predict
earthquakes, rather forecasts the regions or so-called hotspots where earthquakes are most
likely to occur in the relatively near future.
The PI algorithm is developed at the University of California-Davis by Prof. John
Rundle and his group. PI analyzes earthquake seismic records to forecast regions with
high future seismic activity. It also identifies the characteristic patterns associated with
the shifting of small earthquakes from one location to another over time prior to the
occurrence of large earthquakes.
There have been two major types of approaches for forecasting earthquakes. The
first approach is based on empirical observation of precursory changes such as seismic
activity, ground motions and others. The second approach is statistical patterns of
Seismicity (J. R. Holliday et al., 2005). The hypothesis behind these approaches is that
the earthquakes will occur in regions where typically large earthquakes have occurred in
the past. The Pattern Informatics (PI) approach suggests that a more promising approach
to this hypothesis is that the rate of the occurrence of small earthquakes in a particular
region can be analyzed to assess the probability of much larger earthquakes (Rundle,
Turcotte, Shcherbakov, Klein, & Sammis, 2003).
PI tries to discover patterns given past data to predict probability of future events.
The process of analysis involves data mining, which is made using results obtained from
a Web Feature Service. The Web Map Service is responsible for collecting parameters for
invoking the PI code. These parameters are then sent to an HPSearch (Gadgil, Fox, &
Pallickara, 2005) engine which invokes the various services to start the flow.
Additional components of the architecture
Page 112
98
In addition to the components mentioned for IEISS in Chapter 5.1, there is one
more component called HPSearch. It is a scripting technique for managing distributed
workflows. Different Geo-Science applications require different set of parameters for the
users to utilize the system. This set of parameters and their order are defined earlier by
the job manager, and the user portal knows how to invoke it. Users provide required
parameters through the project‟s user interface. After the application finish the task, job
manager send the output link to the user.
The services and data flows are illustrated in Figure 25 and the steps are
summarized as below. This is the basic scenario that we use for integrating Pattern
Informatics, Regularized Deterministic Annealing Hidden Markov Model (RDAHMM)
(Rabiner, 1989) (Granat, 2003), and other applications.
Page 113
99
Figure 25: A general GIS Grid orchestration scenario involves the coordination of GIS services, data
filters, and code execution services. These are coordinated by HPSearch
Page 114
100
Flow in this architecture is explained here (Figure 25):
0. WFS and WMS publish their WSDL URLs to the UDDI Registry.
1. User starts the WMS Client on a web browser; the WMS Client displays the
available features. User submits a request to the WMS Server by selecting desired
features and an area on the map. WMS Client is actually event-based interactive
map tools.
2. WMS Server dynamically discovers available WFSs that provide requested
features through UDDI and obtains their physical locations (WSDL address).
3. WMS Server forwards user's request to the WFS.
4. WFS decode request, query the database for features and receives the response.
5. WFS creates a GML FeatureCollection document from the database response and
publishes this document to a specific NaradaBrokering topic.
6. WMS receives the streaming feature data through NaradaBrokering's agreed upon
topic. WMS Server creates a map overlay from the received GML document and
sends it to WMS Client which in turn displays it to the user.
7. WMS submits flows for execution by invoking the HPSearch. This request also
includes all parameters required for execution of the script. The HPSearch system
works in tandem with a context service for communicating with WMS.
8. Initially, the context corresponding to the script execution is marked "Executing".
9. Once submitted, the HPSearch engine invokes and initializes (a) the various
services, namely the Data Filter service, that filters incoming data and reformats it
to the proper input format as required by the data analysis code, and the Code
Runner service that actually runs the analysis program on the mined data. After
Page 115
101
these services are ready, the HPSearch engine then proceeds to execute (b) the
WFS Web Service with the appropriate GML query as input.
10. The WFS then outputs the result of the query onto a predefined topic. This stream
of data is filtered as it passes through the Data Filter service and the result is
accumulated by the code runner service.
11. The code runner service then executes the analysis code on the data and the
resulting output can either be streamed onto a topic, or stored on a publicly
accessible Web server. The URL of the output is then written to the context
service by HPSearch (Gadgil, Fox, Pierce, & Pallickara, 2005).
12. The WMS constantly polls the context service to see if the execution has finished.
13. The execution completes and the context is updated.
14. The WMS downloads the result file from the web server and displays the output.
In short, we run Pattern Informatics (PI) code through the proposed
browser/event-based interactive user interface and plot the possibilities of the earthquake
happenings in color-coded grid over the previously created seismic and earth map (see
Figure 26). Seismic data are kept in WFS and accessed/queried based on the user
provided attribute based search criteria.
Page 116
102
Figure 26: WMS Client or so called event-based interactive map tools. Google Map layer is
superimposed by the plotting of the PI outputs. It shows probability of earthquake happenings. Red
ones show high probabilities.
We have used NASA OnEarth Map server as cascaded WMS and get earth
satellite image.
Page 117
103
5.3. Virtual California (VC), Earthquake Science
VC (Rundle et al., 2002) is earthquake simulation model for the California. The
simulation takes into account the gradual movement of faults and their interaction with
each other. It includes 650 segments representing the major fault systems in California,
including the San Andreas Fault responsible for the 1906 San Francisco earthquake
(Donnellan, 2004).
VC is a program to simulate interactions between vertical strike slip faults using
an elastic layer over a viscoelastic half-space. It relies on fault and fault friction models.
At the application, or simulation level, VC has a two-phase run. In the first phase, the
user runs the application by giving required parameters and gets the result for the best
cost. The definition of cost and it‟s calculation are application specific and defined at
(Rundle et al., 2003). If the user likes the returned cost, he runs the second-phase with the
returned cost and some other parameters given through VC GUI to get the forecast values
(Donnellan et al., 2003). The result forecast values are played in a movie streams (see the
below sample run with JMF -Java Media Framework- client) ("JMF," 2008). Each frame
in the stream is actually a three-layer structured static map.
There is no additional component needed besides the components explained
before.
Flow in this architecture is explained here (Figure 27)
Page 118
104
a. GIS users interact with the system through the user interface provided by WMS
Client and/or GIS Portal. GIS user enters the parameters to get specific region of
the world as a map from the WMS server.
b. WMS Client makes a request to the WMS on behalf of the user. It submits a
request to the WMS Server by selecting desired features and an area on the map.
WMS returns a map in the form of an image or an exception in case of an error.
c. In order to create user specific maps, WMS Server forwards user‟s request to the
WFS to get requested feature data. WFS decodes the request, queries the database
for the features and receives the response. Feature data is returned to the WMS
server as a set of feature collections.
The above three steps are common to any application to create a display in
the form of maps. Below, we list VC specific process flow to overlay VC output
as another layer on top of the map image created through the processes listed
above.
1. After receiving and displaying the maps returned from the WMS server, the user
starts running VC simulation code through GIS Portal. The GIS Portal provides
the user with the ability to setup the experiment and the parameters associated
with each set of run.
2. The user sets application specific parameters such as bounding box and the time
frame of the experiment‟s data. These values are bundled as script execution
parameters and sent to the HPSearch engine.
Page 119
105
3. The HPSearch engine then runs the script with the specified parameters. For each
run, the service selects an instance of the VC runner service and initializes it.
4. Once all initialization is done, the HPsearch engine invokes the streaming WFS
service.
5. The WFS sends the requested seismic records to the VC Runner service. The VC
Runner service filters the input data. This step also converts date to float format.
Once all the data has been accumulated, the VC Runner service runs the VC code
on the input data using the input parameters. Usually each instance of the VC
Runner service will work with different set of parameters.
6. The output of the VC runs is stored in output files.
7. On completion the VC runner stores the best cost that was computed per run in
the context service. The best cost is the smallest value and will be used for
determining the set of input parameters that needs investigated further.
8. The services then notify the HPSearch engine of the completion
9. HPSearch engine queries the context service to retrieve the best cost and then
again writes to the context service the location of the output file that corresponds
to the best cost.
10. The WMS constantly monitors the context service to see if the computation was
completed. Once the computation is complete, it retrieves the location of the
output file that corresponds to the best cost.
11. Finally the output file is retrieved (via FTP) and the output is used for
visualization purposes.
Page 120
106
12. Depending on the data and the geophysics application GIS Portal superimpose
returned data as a new layer or makes some animated map or movie streams. In
case of VC application, returned output data is multi-casted to a specific IP and
port as movie streams.
Outcomes from the VC demo are map movies like animations. Links to a sample
movie for Virtual California is listed below.
For this sample case, there are 1144 records in the output file returned by VC
Runner Service shown in Figure 27.
http://complexity.ucs.indiana.edu/~asayar/gisgrids/docs/VCDemo_03.swf (Flash version)
a b
2
1
7 9
1
0
11
8
6
5
4
3
WSContext
Service
HPSearch
Engine
VC Runner
Service
VC Runner
Service
VC Runner
Service
VC Runner
Service
Output
File Output
File Output
File Output
File
WMS Client
/ GIS Portal
WMS
c
D
B
WFS
DB
User
Browser
Figure 27: Virtual California Operation steps founded over proposed Service-oriented GIS framework
Page 121
107
http://complexity.ucs.indiana.edu/~asayar/gisgrids/html/work/VC_01.avi (Avi format)
VC Runner Services
See them in Figure 27
VC Map-Movie creation interface. Choose periodicity of time series data framework play
Figure 28: Event-based interactive user interface extended for Virtual California needs. It enables
creating map movies by playing framework (created from time-series data) successively. Each
framework is actually a map image.
Page 122
108
CHAPTER 6
HIGH-PERFORMANCE SUPPORT IN
INTEROPERABLE GEO-DATA RENDERING
This chapter addresses general performance issues in distributed, interoperable
and service oriented geo-data rendering, and presents performance enhancing approaches.
We present adaptive parallel query optimization technique (which is applicable to
any other domain) (Chapter 6.4), streaming data transfer extension to Open GIS
Standards by adopting publish/subscribe messaging middleware (NaradaBrokering),
(Chapter 6.2) and scalable large XML-data rendering with application of a pull-parsing
technique (Chapter 6.3). The last chapter presents overall evaluations of the
enhancements over the proposed federated GIS framework (Chapter 6.6).
Page 123
109
6.1. General Performance Issues
Distributed GIS systems typically handle a large volume of datasets and are
commonly used in early warning system and crisis management, where performance is
important. Therefore the transmission, processing and visualization/rendering techniques
need to be responsive to provide quick, interactive feedback. There are some
characteristics of GIS services and data that make it difficult to design distributed GIS
with satisfactory performance. Those characteristics can also be generalized to any other
domain.
In order to provide interoperable and extensible framework, we have adopted
domain-specific standard specifications for data model (GML) and online services from
OGC, and Web Services specifications from WS-I ("WS-I," 2002). However, these
adoptions degrade the performance even more for large-scale applications because using
XML-encoded data models and Web Services‟ XML-based SOAP protocol introduces
significant processing overhead. These issues and proposed enhancement approaches are
presented in the following sections. The aim is to combine compliance requirements with
competitiveness and to create a responsive information system framework providing map
images for interactive decision-making tools.
6.1.1. Distributed Nature of Data
The data ownership issues (that is, various data provided by geographically
distributed various virtual public/private organizations) and large data volumes make it
infeasible to put all geospatial data into one large data center. In addition, the
computational resources associated with those data centers are naturally distributed.
Page 124
110
Furthermore, decision making requires these distributed heterogeneous data sources to be
shared, and represented, or rendered, to extract useful knowledge giving sense to
anybody joining the decision making process. Although we concentrate on the
performance issues related to compliance requirements such as using XML-encoded data
model GML and Open GIS compatible Web Service components, throughout the section
we touch upon the general issues briefly mentioned above
Geographic Information Systems are large scale data intensive scientific
applications requiring creation of knowledge from distributed data sources provided by
autonomous heterogeneous data and computation resources.
6.1.2. Interoperability Cost – Common Data Model
Using semi-structured common data model enables interoperability and inter-
service communication. XML‟s emergence as the de facto standard for encoding tree-
oriented, semi-structured data has brought significant interoperability and standardization
benefits to distributed computing. On the other hand, performance has been still a
persistent concern for large scale applications, because of the size issues and processing
overheads (Lu, Chiu, & Pan, 2006). The processing is detailed as parsing and
differentiating (separating) the core-data from the attributes and other tags to create
required application specific data formats.
GML is the data modeling language for OGC specifications. GML carries content
and the presentation tags together with the core data. This enables the data sources to be
queried and displayed together (i.e., map images interactively query-able through
interactive map tools). Querying and displaying data in the GML format requires parsing
Page 125
111
and rendering tools to extract requested tag elements such as geometry elements to draw
map features or non-geometry elements to answer content-related queries.
Structured data representations enable adding some attributes and additional
information (annotations) to the data. Those resulting XML representations of data tend
to be significantly larger than binary representations of the same data. The larger
document size means that the greater bandwidth is required to transfer the data, as
compared to the equivalent binary representations.
In addition, due to the architectural features (integration of autonomous
resources), the system spends a lot of time on query/response transformations for
relational database-to-GML mappings. WFS enable mediation of autonomous databases
and serving the data in common data model through the standard service interfaces and
message formats. However, it is often time consuming because of the requirements for
query and response conversions (getFeature to SQL and relational tables to GML). In
summary, the advantages of using structured, annotated data come with its costs.
6.1.3. Tough Data Characteristics
Geo-data is described and queried with its location attribute. A location in a 2-
dimensional plain/surface is formulated as (x, y) coordinates. Based on the location
attribute, geo-data is unevenly distributed (consider human populations, earthquakes, and
temperature distributions) and variably sized. In addition, geo-data collected from sensors
are dynamically changed and/or updated over time.
Because of these stringent characteristics and dynamic nature of data, it is not
easy to perform efficient load balancing and parallel processing over the unpredictable
Page 126
112
workload. Figure 29 illustrates this problem. The work is decomposed into independent
work pieces, and the work pieces are of highly variable-sized.
6.2. Extending OGC Standards with Streaming Data Transfer
Capabilities
NaradaBrokering is a message oriented middleware (Tran, Greenfield, & Gorton,
2002) system that facilitates communications between entities through the exchange of
messages. This also allows us to receive individual results and publish them to the
messaging substrate instead of waiting for the whole result set to be returned. In case of
using streaming, the standard Web Service interfaces are used for handshaking, and the
actual data transfer is done between subscriber and publisher deployed in proposed GIS
Web Service components respectively. Besides giving better performance in general, the
streaming data transfer technique enables data rendering and processing even on partially
returned data. It can even be applied to the real-time data rendering.
The OGC‟s initial standard WMS and WFS specifications are based on HTTP
GET/POST methods, but this type of services have several limitations such as the amount
of data that can be transported, the rate of the data transportation, and the difficulty of
R3
R2 R1
R4
(c,d)
(a,b) ((a+c)/2, b)
(a,b)
(c,d)
(c, (b+d)/2) (c, (b+d)/2)
((a+c)/2, b)
(b)Point data
(a) LineStrings/polygons data
Figure 29: Problem illustration with two different types of data sets
Page 127
113
orchestrating multiple services for more complex tasks. Web Services help us overcome
some of these problems by providing standard interfaces to the tools and applications we
develop.
Our experience shows that although we can easily integrate several GIS services
into complex tasks by using Web Services, providing high-rate transportation capabilities
for large amounts of data remains a problem because the pure Web Services
implementations rely on SOAP (Gudgin et al., 2007) messages exchanged over HTTP.
This conclusion has led us to an investigation of topic-based publish-subscribe messaging
systems for exchanging SOAP messages and data payload between Web Services. We
have used NaradaBrokering (Pallickara & Fox, 2003), which provides several useful
features such as streaming data transport, reliable delivery, ability to choose alternate
transport protocols, security and recovery from network failures. This allows us to
provide higher level qualities of service in GIS services.
NaradaBrokering is a message oriented middleware (MoM) (Tran et al., 2002)
system that facilitates communications between entities through the exchange of
messages. This also allows us to receive individual results and publish them to the
messaging substrate instead of waiting for whole result set to be returned.
Transferring the GML data in the form of an XML String type causes some
problems related to the performance when the GML is larger than some amount of size.
Since the WFS returns the resulting XML document as an <xsd:string>, this has to be
constructed in memory and the size will depend on several parameters such as the system
configuration and memory allocated to the Java Virtual Machine etc. Consequently there
will be a limit on the size of the returned XML documents. For these reasons we have
Page 128
114
investigated alternative ways for data transport and researched the use of topic based
publish-subscribe messaging systems for streaming the data. Our research on
NaradaBrokering shows that it can be used to stream large amount of data between nodes
without significant overhead. Additional capabilities such as reliable messaging and
support for different transport protocols already inherent in NaradaBrokering show that it
is a powerful yet easy to integrate messaging infrastructure. For these reasons we have
developed a novel Web Map Service and Web Feature Service (developed by Galip -
(Aydin, 2007)) that integrate OGC specifications with Web Service-SOAP (Gudgin et al.,
2007) calls and NaradaBrokering messaging system. Architecture is shown in Figure 30.
Figure 30: Streaming data transfer using NaradaBrokering publish-subscribe topic
based messaging middleware.
topic-ip-port
(A)WMS
Server WFS Server
Narada
Brokering
Server
UDDI
client server
registry
GML GML
3
2 1
getFeature
(topic, IP, port) Publisher Subscriber
w s d l
w s d l
DB
Web Services‟
publish-find-bind
triangle
Page 129
115
Connection lines 1 and 2, and UDDI (Universal Description, Discovery and
Integration) (Clement et al., 2004) service are displayed in the figure for showing classic
publish-find-bind triangle of the Web Service based Service Oriented architecture. We do
not go into details of these interactions and UDDI registry service in this document but
these can be summarized as following. WFS services publish their existence and service
providing with their WSDL service description files (line-1). Clients (such as WMS) find
appropriate WFS by searching UDDI registries (line-2). After finding appropriate service,
clients are bind to that service by creating their client stubs. In case of that client knows
what WFS provides the requested data, client can directly communicate with the services
without need for UDDI registry service.
After finding a WFS capable of providing the requested data, WMS (as a client)
make the getFeature request (wrapped in SOAP envelope) to WFS‟s standard service
interface (line-3). As a response, WMS gets the topic (publish-subscribe for a specific
data), IP and port to which WFS streams requested data. The standard Web Service
interface is used for handshaking actual data transfer is done between subscriber and
publisher deployed in WMS and WFS respectively.
Streaming data transfer through publish-subscribe based messaging middleware
enable map rendering even in the case of partially returned data. This depends on the
WMS‟s internal implementation.
Table 1 gives a comparison of the streaming and non-streaming data access
approaches for the different data sizes. These values are obtained by applying the
proposed framework on Pattern Informatics (PI) (Tiampo, Rundle, Mcginnis, & Klein,
2002) Geo-science application using earthquake seismic data records. These are GML
Page 130
116
data access times including query conversion at WFS, result set conversion from database
to GML and transfer times from WFS to federator or WMS.
As the test setup Figure 30 is used. The performance response times are shown in
Table 1 and Figure 31. The values are measured end-to-end times in which one end is DB
and the other end is WMS. NaradaBrokering agent, WMS and WFS are deployed in
Local Area Network (LAN) in Indiana University Community Grids Labs. In local area
network we have used the lab‟s “gridfarm” machines from gf12.ucs.indiana.edu to
gf19.ucs.indiana.edu. These machines have 2 Quad-core Intel Xeon processors running at
2.33 GHz with 8 GB of memory and operating Red Hat Enterprise Linux ES release.
Table 1: Data access times (from federator or WMS) while using (1) streaming and (2) non-streaming
data transfer techniques.
Streaming Non-Streaming
Data
Size
(KB)
Average Time
for Streaming
Transfer
Average
Response
Time
Standard
deviation
Average
Time Non-
Streaming
Average
Response
Time
Standard
deviation
10 31.3 2425 38 1518.8 3912.5 77
30 100 2661 27 1356.1 3917.1 38
100 320.1 2945 50 1473.8 4098.7 71
300 826.7 3405 48 1835.7 4414 39
1000 2414.2 4570 360 3506.8 5662.6 31
Page 131
117
Figure 31: Comparisons of Streaming vs. Non-Streaming data response timings from source to
federator or WMS.
We can deduce from the table that for the larger data sets when using streaming
our gain is about 25%. But for the smaller data sets this gain becomes about 40%, which
is mainly because in the traditional Web Services the SOAP message has to be created,
transported and decoded the same way for all message sizes which introduces significant
overhead.
Besides giving better performance in general, streaming data transfer technique
enables data rendering and processing even on partially returned data. It can even be
applied to the real-time data rendering.
0
1,000
2,000
3,000
4,000
5,000
6,000
0 200 400 600 800 1000 1200
Tim
e -
mse
cs
GML Data Size -KB
Average Response TimesStreaming vs. Non-Streaming GML Data Capturing
Streaming
Non-Streaming
Page 132
118
6.3. Application of Pull Technique for GML Parsing and
Rendering
There are two well-known and commonly used paradigms for processing XML
data, the Document Object Model (DOM) and the Simple API for XML (SAX). DOM
builds a complete object representation of the XML document in memory. This can be
memory intensive for large documents and entails making at least two passes through the
data. SAX operates at one level lower. Rather than actually constructing a model in
memory, it informs the application of elements through callbacks. This also requires at
least two passes through the data. These are all expensive and resource (such as CPU and
memory) consuming processes and they don‟t provide enough performance for the large-
scale applications.
Proposed system includes data rendering and filtering tasks assigned to Web-
based Map Services to create comprehensible data representations derived from the semi-
structured common data (GML). These comprehensible representations are called maps.
Regarding the rendering of large GML data and creating map images we use parsers.
There are three general parsing techniques proposed for processing XML
structured data. These are document model, push model and pull model. There are also
other hybrid alternatives built on these main approaches. In order to process data in XML
structured common data model we use the pull-parsing technique.
Pull parsing, as exemplified by the XML Pull Parser (Slominski, 2005), is an
efficient paradigm similar to SAX in that it does not build a complete object model in
memory. It differs in that the tags and content are returned directly to the application
from calls to the parser, rather than indirectly in the form of callbacks. The pull approach
Page 133
119
of this parsing model results in a very small memory footprint (no document state
maintenance required, in contrast to DOM) and very fast processing (fewer unnecessary
event callbacks - compared to SAX).
A pull parser only parses what is asked for by the application rather than passing
all events up to the client application as SAX parsing does. For a comparison of pull
parsing with other leading Java based XML parsing implementations, see (Sosnoski,
2001).
Pull parsing does not provide any support for validation. This is the main reason
that it is faster than its competitors. Since all the services are OGC compatible and
created in Web Service principles, validation is not necessarily needed. In OGC, services
describe themselves by capability document and servers know each other by exchanging
these document. If one has external validation mechanisms, or if the validation errors are
not catastrophic to the system, or one can trust validity of the capabilities document of the
contacted server, then using XML Pull Parsing gives the highest performance results. For
example in communication between WFS and WMS, since it is known that WFS
provides feature data in OGC‟s GML format (Cox et al., 2003), it is very advantageous
skipping validation and using pull parsing.
For the application specific comparison of Pull parsing and DOM see Table 2 and
Figure 32. The performance values are measured in milliseconds, and data sizes are in
MBs. Performance test is done with a 1GB allocated JAVA Virtual Machine. The Figure
32 illustrates the timing values for the data size less than 100MB of GML data. Above
this threshold value for the Virtual Machine allocated 1GB memory, DOM become
useless.
Page 134
120
Test case: For the XML data we use earthquake seismic data records encoded in
GML. Each earthquake seismic record has some attributes and some geometry elements.
In our tests we will parse the GML data in XML documents and extract the geometry
elements. In case of DOM, parsing and extraction are done separate as it is shown in two
columns in Table 2. In case of pull parsing, geometry data is extracted from GML with
parsing and extraction applied all together.
Results for the DOM and pull approach are obtained by using dom4j and xpp
respectively. Xpp is developed in Indiana University Extreme Labs. The experiment
performed in a single computer, utilizing Pentium 4 CPU operating at 3.4GHz with 1.00
GB of memory.
Table 2: The performance values of DOM and Pull parsing (Xpp) over GML data. Dashed-line
values imply memory exception.
Average Timings
DOM (dom4j) Pull (Xpp)
Data Parsing + Data Total Data Data Total
(KB) Validation Plotting Rendering Extraction Plotting Rendering
1 469.22 0.00 469.22 15.59 0.00 15.59
10 494.06 3.00 497.06 72.81 3.00 75.81
100 625.54 15.33 640.87 183.06 15.33 198.39
1,000 760.20 83.11 843.31 270.47 83.11 353.58
5,000 1,422.91 153.67 1,576.58 671.74 153.67 825.41
10,000 3,557.44 828.50 4,385.94 1,025.67 828.50 1,854.17
Page 135
121
100,000 ---- ---- ---- 7,059.72 3738.25 10,797.97
The dashed lines in Table 2 represent insufficient memory exceptions. It means
the system does not have enough memory for completing its work with 1GB of allocated
virtual memory in JAVA virtual machine. Since there is extreme performance difference
between using DOM and pull parsing techniques, we plot their values in Figure 32 for
less than 10MB of GML data.
Table 3: Standard deviations of average timings for total rendering
Data Size Total Rendering
(KB) DOM-dom4j Pull-(Xpp)
1 21.32 0.87
10 20.87 7.41
100 28.04 23.25
1,000 41.58 65.09
5,000 72.66 121.05
10,000 126.51 116.49
Page 136
122
Figure 32: Performance comparison of two XML data processors, pull parsing and Document Object
Model by using dom4j.
6.4. Adaptive load-balancing and Parallel Query
Optimization
A federator inherently makes workload sharing by fetching the different data
layers from separate resources to create multi-layered map image. We call this as vertical
load balancing. This is a natural load balancing and parallel processing resulting from the
architectural features.
In addition to the inherent layer-based, load balancing, a layer (in the multi-
layered map image) itself can be split into smaller bounding box tiles and each tile can be
farmed out to a worker WFS/WMS. Layer-based partitioning is based on attribute-based
query decomposition in which the attribute is the bounding box defining the requested
data‟s range in a rectangular shape. See the sample range query as a rectangle at the right-
0
500
1,000
1,500
2,000
2,500
3,000
3,500
4,000
4,500
5,000
0 2000 4000 6000 8000 10000 12000
Tim
e -
mse
cs
Data Size -KB
GML renderingby using DOM vs. Xpp
dom4j
Xpp
Page 137
123
top corner of Figure 33. This section focuses on individual layer partitioning and
proposes a novel data access/query optimization technique.
We illustrate the partitioning and parallel processing in Figure 33. A sample main
query range [Range] is partitioned into 4 smaller sub-regions as set of [R1, R2, R3 and
R4] and queried in parallel.
Figure 33: Architectural comparisons of parallel fetching with straightforward single thread fetching
Page 138
124
In the following chapters we present enhancement techniques to reduce the
negative effects of time-consuming query and data conversions and data transfer
latencies. We focus on the issues at the upper level of data handling. We are not
proposing enhancement over query and/or response conversions at the autonomous
resources integrated through mediators (WFS). We take them as black boxes. Our
enhancement approaches are at the federator-level and based on the approximation of
unpredictable query workloads.
6.4.1. Problem Definition
Optimal partitioning of geo-data is difficult to achieve because polygons, line-
strings, points etc. are neither distributed uniformly nor of similar sizes. In addition, the
load they impose varies, depending on the size and location of the query. Since query
location is not known in advance, it is difficult to develop a partitioning strategy that is
optimal for all range queries. This problem is illustrated in Figure 33. The main query
range is partitioned into R1, R2, R3 and R4 through equal size binary cut to query data in
parallel and gain performance. However, with this naïve method, the expected
performance gain from the parallel query can‟t be achieved due to the characteristics of
geo-data mentioned earlier. Moreover, in data warehousing, data sets can be very large.
Answering aggregate queries exactly can be computationally expensive.
“Multiple extraction technique for informative sentences” (Metis) (A. L. Mitchell
et al., 2005) and “Guided self-scheduling for parallel super computers” (Polychronpouos
& Kuck, 1987) are the two techniques developed for the similar kinds of problems. These
techniques solve the same problem for the previously known problem sizes. In contrast,
in our case, the query size and distribution characteristics of the data according to varying
Page 139
125
ranges are not known earlier. We solve actually the query approximation problem to
partition and share the workload among the worker nodes. In order to optimize the load
balancing and parallel queries, the data dense/sparse regions should be taken into
considerations and approximated before partitioning (de-clustering) the actual query.
Please see Figure 29 for the illustration of the problem.
6.4.2. Workload Estimation Table for Two-dim Range Queries
The aim is cutting the two-dimensional ranges (bounding boxes) into the smaller
pieces with approximately equal loads (range query decomposition), and the most
efficient load balancing for the parallel queries.
Our solution approach is based on utilization of workload estimation table (WT).
The WT is representation of distribution of data characteristics (kept in databases as
relational tables) in the form of list of small ranges whose query sizes are relatively close
to each other. Due to the dynamic nature of data, WT is created once and
synchronized/refined at some time intervals to reflect the changes in database.
Workload Estimation Table (WT) aims for efficient load balancing over the
unpredictable workload by utilizing the locality (Denning, 2005; Denning & Schwartz,
1972) and nearest neighborhood (Dasarathy, 1991) principles. By the “locality principle,”
we mean that if a region has a high volume of data, then the regions in close
neighborhood are also expected to have high volume of data. The human population data
across the earth can be given as an example: Obviously urban areas have higher human
population than the rural areas. Differentiating dense data regions from sparse regions
enables us to find the most efficient number of partitions for parallel processing and
Page 140
126
reduces the overhead timings for handling an unnecessary number of partitions.
Clustering techniques (Buyya, 1999; Pfister, 1998) provides a more precise way for
determining this if one has access to data, but in our architecture we must treat the data
servers as black boxes.
Algorithm: Our aim is partitioning a region (R) defined in two-dimensional
ranges into sub-regions in a way that the sub-regions‟ corresponding query sizes are as
much equal as possible. The size differences between the partitions (fluctuation) are
controlled by the error rate parameter (er). The recursive algorithm to create/refine WT
is;
PT: Main routine creating/refining workload estimation table (WT)
PTInBalance: Sub-routine to find the most efficient partition according to the given er
and t.
R: Overall range covering all the data in the database. Format: (minx, miny, maxx, maxy)
t: Threshold data size (allowable maximum query size of each partition)
getData: Remote data access routine.
R = R1 + R2 => R1:bbox1 and R2:bbox2
er = Maximum allowable query size difference between partitions obtained from binary
cut.
Page 141
127
For example, if larger partition query size is 10MB and er =.20 the smaller
partition query size can be minimum 8MB.
PT(R, t, er) is a routine to recursively partition the region R into two sub-regions
whose corresponding query sizes are less than t. In order to make balanced partitions, at
every iteration, it calls PTInBalance sub-routine with parameter er. When the algorithm is
done, workload estimation table (WT) will be created to enable optimized parallel queries
for the specific data. In the WT, there won‟t be any partition whose query size is larger
than any other partition more than 1+er times except for the last partitions.
Figure 34: The recursive binary partitioning routine
Page 142
128
The routine getData in PTInBalance is for getting the query size information for
the corresponding ranges via remote data access. It is actual WFS‟s XML-based standard
getFeature routine to query the data (Figure 39).
PTInBalance(R, er) does not take threshold data size as parameter because its task
is only cutting the given region into two equal query sizes based on given error rate er. At
every iteration, the algorithm interacts with the remote data server and makes test queries
with newly calculated ranges. According to the results of the query sizes, it adapts the
ranges and repeat same thing with newly calculated queries. It keeps doing it until the
query sizes for the partitions get close to each other based on predefined er. If er is
defined as 0, it means both query sizes for the partitions will be equal. In that case all the
partitions will be equal size which is equal to threshold data size t.
Figure 35: The routine to find out the best partition cut point according to given error rate
Page 143
129
There are two types of PTInBalance routine, one is for vertical cuts and the other
is for horizontal cuts. Above figure presents the one for the vertical cut along the x-
coordinate. In case of horizontal cut the changes will be as below
- minx -> miny
- maxx -> maxy
- gml1 = getData(minx, miny, maxx, mp)
- gml2 = getData(minx, mp, maxx, maxy)
Sample scenario and output WT:
Let‟s say we have point data set (not necessarily but for test purposes) the total
query size is 32MB (32 point data; each one is 1mb) as shown in Figure 36-a, threshold
partition size is 5MB, and error rate = .20.
For this sample scenario:
- maximum partition query size will be 5MB (threshold size)
- minimum partition size will be 4MB (due to the threshold size and error rate)
Figure 36: Sample query and corresponding partitions in WT. total query size 32MB and
threshold data size 5MB, and error rate .20
Page 144
130
6.4.3. Utilizing WT for Range Query Optimization
There are three stages: (1) The main query range is decomposed by positioning it
in up-to-date workload estimation table; (2) The sub-queries are created for the partitions
in WT overlapping with main query, (3) The queries are assigned to separate threads and
the results are merged to get final response for the main query. .
Decomposing the main query by positioning on WT
Let‟s illustrate this with a sample scenario (Figure 37). The sample main query
with range R is positioned in WT. R overlaps with: p5, p6, p7, p8, p9, and p10. The set of
ranges on which parallel queries are going to be done are p5, p6, p7, p8, r1 and r2. r1 and r2
are calculated from partially overlapped partitions p9, and p10 respectively.
Creating sub-queries correspond to the partitions
Figure 37; Illustration of query decomposition
with a sample scenario
Page 145
131
After having partitions in small bounding boxes, each partition is assigned to a
separate thread of work, and the results to partitions are merged to create a final response
for the main query. The partitions are assigned to threads in a round-robin fashion.
The sub-queries inherit all the attributes from the main query. The only difference
is the range attribute defined as bbox. (Figure 39)
Main query range = sum of sub-queries‟ ranges
Query range
Bbox-1
Bbox-2
Bbox-3
Bbox-4
Bbox-5
GetFeature-1
GetFeature-2
GetFeature-3
GetFeature-4
GetFeature-5
Creating queries for sub-regions defined in bbox
Decomposing the “Query range” into the set of bboxes
Figure 38: Example scenario of the partitioning a region into 5 sub-regions
Page 146
132
Figure 39: A sample “GetFeature’ query for global hotspot (earthquake seismic data) sent to WFS
for a specific range defined in bbox-i.
Assigning the partitions/sub-queries workers
The technique presented here ensures that each worker node gets as much equal
as possible number of partitions. The sub-queries are assigned to separate threads to
capture the GML data from WFS and process the corresponding map pieces. Partitions
Bbox-i
-i
Page 147
133
are assigned to worker nodes through separate thread of works in round-robin fashion
(Tanenbaum, 2008).
Let‟s say PN is the partition number and WN is the number of WFS worker
nodes.
Share is the number of partitions each worker node is supposed to get.
If there is no remaining (rmg = 0), every worker node is assigned share number of
partitions. If rmg is different from the number 0 then partitions are assigned to worker
nodes as below:
The first rmg #of WN is assigned share+1 number of partitions and
remaining WN are assigned share number of partitions.
Figure 33 illustrates the algorithm over a case of four partitions and three WFS
worker nodes. So, the algorithm‟s parameters would be
share = base (4/3) = 1 and rmg = 4 – (1*3) = 1;
So WFS-1 is assigned 2 (share+1) partitions; WFS-2 and WFS-3 are assigned
1(share) partitions.
Page 148
134
6.4.4. Performance Evaluation
The proposed query optimization technique is evaluated based on its application
to the extended OGC compatible streaming GIS Web Services. Extended GIS Web
Services and the streaming data transfer architecture are given in earlier chapters
(Chapter 3 and Chapter 6.2).
Test setup:
Performance is evaluated with earthquake seismic data kept in relational tables in
MySQL database. Servers/nodes are deployed on 2 (Quad-core) processors running at
2.33 GHz with 8 GB of RAM.
We basically find the answers to the below questions with the evaluation tests.
- How do the number of WFS and #of partitions together affect the
performance?
- How is the number of partitions (for a specific size of query) affected by the
WT‟s pre-defined threshold query size?
Figure 40: Streaming Data fetching through publish/subscribe based messaging middleware
Page 149
135
- When the WFS number is kept same, how does the partition-threshold size in
WT affect the performance?
Table 4: Parallel data access/query times based on (1) changing threshold query size used for
building WT and (2) the #of worker nodes -WFS.
Threshold 1WFS 2WFS 4WFS Avg #of
query size Avg StDev Avg StDev Avg StDev Parallel Qry
NO-Prt 64.51 0.28 65.06 0.28 65.06 0.28 1
6 MB 48.85 0.79 34.23 0.56 34.12 0.45 2.2
4 MB 49.82 0.62 26.2 0.79 19.65 0.56 4.6
2 MB 52.2 0.96 27.33 0.88 15.77 0.78 8.5
1 MB 55.94 1.03 28.57 1.22 14.59 1.15 16.9
0.5 MB 61.73 0.95 32.4 0.59 17.9 0.7 31.3
Table values are in seconds.
The values in the table are obtained by running the tests on 10 different regions
(ranges) correspond to 10MB of GML data. If there is no partition and parallel querying
(NO-prt in table) 10MB of query fetch takes average 65.06 seconds. This is shown as
first row in the table.
The average number of parallel queries is defined by region‟s data distribution
characteristics, the parameters used to build WT (threshold query size and error rate), and
Page 150
136
actual main query size. WT built with different threshold query sizes (the first column)
give different #of partitions for the same query ranges (the last column).
Figure 41: Parallel query optimization performance results
The speed-up (performance gain from parallel querying) increases as the partition
number increases. After a threshold value, the ratio of the performance gain starts
decreasing. You can see that pattern for each line in the figure. For example, in case of
using 4 WFS (red-line), the threshold value for the partition size is 2MB.
The initial increase is due to improved load balance by reducing the effect of
fluctuation in partitions‟ loads, and the decrease is due to the non-parallelizable
Page 151
137
overheads and limited number of clusters. In addition, success of parallel access/query is
based on how well we share the workload with worker nodes.
Table 4 shows in last column that the average numbers of parallel queries are
increasing linearly according to the increased threshold partition size used to build WT.
As the error rate is decreased, the workload sharing balance increases and gives
better average query response times. On the other hand, WT refinement takes longer time
but it does not affect the actual query time at the application run time.
As the number of processors serving the parallel queries increases the
performance increase. As the threshold query size decreased (sensibility of data sharing),
the fluctuation in query sizes between the partitions decreases and the degree of equal
workload sharing increases.
Overhead times
We have done this test to see if the overhead times stemming from partitioning
and parallel processing is in tolerable amount. There are two overhead times compared to
straightforward single process work. These are partitioning and sub-query creation. Since
the federator overlap IO and CPU bound jobs, it doesn‟t affect the performance negative
– asynchronous run.
Calculating overlapped partitions: The main query range (bbox) is positioned in
WT and overlapped ranges are extracted. The main query range is decomposed according
to that set of ranges.
Sub-query creation: For each overlapped partitions corresponding sub-queries are
created. These queries are actually XML-based getFeature query (see APPENDIX G).
Page 152
138
After having created the queries, they are assigned to separate threads and query the data
sources in parallel.
Table 5: Overhead times based on number of partitions to be applied
Partition
Partitioning: Calculating
overlapped partitions
Creating Sub-Queries
for partitions Total overhead time
Number Average StDev Average StDev Average StDev
5 70.67 12.74 48.05 14.01 118.72 26.75
10 81.58 15.16 96.10 16.67 177.68 31.83
15 121.75 19.74 136.15 21.72 257.90 41.46
20 137.08 21.75 192.20 22.92 329.28 44.67
25 159.34 24.98 244.25 21.58 403.59 46.57
30 170.92 29.04 276.30 26.75 447.22 55.79
Table values (Table 6) are in milliseconds.
Graph shows the pattern of changes in overhead times according to the changing
partition numbers, and their relative weights in total overhead. Because of the overhead
times, if we do unnecessary number of partitioning then there is not going to be a
performance gain for less than a threshold-data size but we see from the figure that it is
less than some small amount that does not affect the overall performance considerably.
Page 153
139
Figure 42: Overhead times coming from parallel query optimization
6.5. Just-in-time Map Rendering
This chapter analysis on-demand rendering of GML data illustrated as phase-2
(B) in Figure 46. Our motivation is to see how much time is spent on rendering a GML
data, and compare it with the data access/query times presented in Chapter 6.4. XML-
based GML data rendering is consisted of three successive tasks. These are
- Parsing and extraction geometry elements
- Plotting geometry elements as layer object
- Converting layer object into specified image type (such as JPEG, PNG, etc.)
Page 154
140
These processing steps to create a map image layer from a GML are illustrated in
Figure 43.
For the first step, we use the pull-parsing technique. Its performance evaluations
are given in Chapter 6.3. Creation of a layer object and plotting geometry elements on it
are achieved by using JAVA Graphics2D and Abstract Windowing Toolkits (AWT)
libraries. For the test purposes we have used GML representations of earthquake seismic
data. For the simplicity, multi-layered map images and layer overlaying issues are not
taken into considerations.
Figure 43: Map rendering process steps
Table 6 shows performance values for the map rendering steps illustrated in
Figure 43.
Table 6: Average timing values for map image processing steps
Data Data Data JAVA Image Layer
(KB) extraction plotting to JPEG Creation
1 15.59 0.00 25.43 41.02
Page 155
141
10 72.81 3.00 25.43 101.24
100 183.06 15.33 25.43 223.82
1,000 270.47 83.11 25.43 379.01
5,000 671.74 153.67 25.43 850.84
10,000 1,025.67 828.50 25.43 1,879.60
100,000 7,059.72 3,738.25 25.43 10,823.40
Table time values are in milliseconds.
Figure 44: Average timings for map-image creation steps
As sown in Figure 44, sub-tasks to create a binary map image from GML data
takes linear time with increasing data size. Compared to the remote data fetching times
0
200
400
600
800
1,000
1,200
1,400
1,600
1,800
0 2000 4000 6000 8000 10000 12000
Tim
e -
mse
cs
Data Size -KB
Map Image Creation steps and their timings(for JPEG 400X400 pixel image size)
data extraction
data plotting
image conversion
total response time
25.43
Page 156
142
given in Chapter 6.4.4, plotting is scalable with data size and has good enough
performance results.
The values for “Image conversion time‟ shown in Figure 44 do not change with
the GML data size. For 400x400 pixel JPEG map image creation its value is steady-state
and 25.43 msecs. Image object to JPEG conversion time changes with the requested
map‟s pixel sizes (see Figure 45). The map size is a request parameter defined by the
user. In order to see the affects of map sizes in overall map rendering performance, see
Table 7 and Figure 45. The figure presents conversion times in case of converting to
mime/JPEG for different map sizes in pixel values.
Table 7: Average timings and standard deviation values of object to image/JPEG conversion
Resolution
Average
(msec) StdDev
200x200 19.24 8.53
400x400 25.43 9.29
600x600 46.38 10.42
800x800 71.58 16.70
1000x1000 131.67 17.24
Page 157
143
Figure 45: Image conversion timings based-on pixel resolution values
6.6. Overall System Evaluation
6.6.1. Data and Process Flow
As shown in Figure 46 overall system evaluations are measured in three points.
These are tagged as A, B and C:
A. Fetching GML data (Chapter 6.4)
B. Creation of a layer from GML data (Chapter 6.5)
C. Displaying the requested data at user-end (Overall response time)
0
10
20
30
40
50
60
70
80
200x200 400x400 600x600 800x800
Tim
e m
sec
Resolution in Pixels
Java Image Object to JPEG conversionfor different map sizes
conversion time
25.43
Page 158
144
(A) and (B) were analyzed in detail in Chapter 6.4 and Chapter 6.5 respectively.
Here, we present the overall response time from the end users‟ point of view. It is
formulated as
C = A + B + Image transfer
Figure 46: Test setup for Federator-oriented enhancement analysis and evaluations
The Measured response time can be further detailed as below (see Figure 46
simultaneously):
C = time(measured) = time(map is displayed) – time(client makes request).
- [time(client makes request).] Client makes requests through the interactive smart map tools.
- The federator (actually WMS) parse and render requests and define set of actions
required based on the requests and its capabilities file.
Page 159
145
- WMS creates the map image (from the returned datasets) and returns them to the
clients. This step is also detailed as below:
o Defines the set of WFS and WMS to communicate with to build the response
in accordance with its capability file and client provided parameters.
o Creates requests for WFS and other WSM
o Invokes WFSs‟ getFeature Web Service interfaces for vector data encoded in
Geographic Markup language (GML) (Cox et al., 2003).
o Streaming GML transfer through Naradabrokering messaging middleware
from WFS to Federator/WMS
o Parsing and rendering returned GML data sets
o Aggregating and overlaying layers according to the request and capability file.
o Sending the map images to the WMS Client.
[time(map is displayed)] Client shows the returned maps on his browser
6.6.2. Test Case Scenario
Analysis and evaluations of the system will be done on three-layered map images.
The federator federates three different data from three separate servers. The first one is
NASA satellite map images, the second one is earthquake seismic data, and the third one
is States‟ boundary lines data. These are the datasets actually used in real Geo-science
applications named Pattern Informatics (Chapter 5.2) and Virtual California (Chapter
5.3). The NASA satellite map images provided by OnEarth project‟s WMS at JPL (Jet
Propulsion Labs) in California. The earthquake seismic data sets are provided by WFS at
Indiana University Community Grids Labs ("CGL," 2001) in Indiana. The States‟
Page 160
146
boundary lines data sets are provided by WFS at USGS (United States Geological
Surveys) ("USGS," 2008) in Colorado.
Figure 47: Test-case scenario - test setup
The ucs.indiana.edu machines (used for event-based dynamic map tools and
federator) have 2 Quad-core Intel Xeon processors running at 2.33 GHz with 8 GB of
memory and operating Red Hat Enterprise Linux ES release.
After giving the system‟s test setup and end-to-end process flow, we make a base-
line performance tests (Chapter 6.6.3), and later, we evaluate the adaptive parallel query
optimization technique‟s contribution (Chapter 6.6.4) to the end-to-end response time by
comparing with the base-line performance test results.
Page 161
147
6.6.3. Base-line System Test
Base-line system tests shows the response times when the straightforward
sequential data access and rendering approaches are used. In that approach, each data is
accessed and rendered sequentially to create multi-layer map images whose layers are
provided by geographically distributed standard data services.
The access/query times for satellite map images, earthquake seismic data and state
boundaries data are given in Table 8 and illustrated in Figure 48.
Table 8: The average response times for straightforward sequential data access
Data Data access/query Data Image Response
Size (MB) satellite seismic boundary Overlay Transfer Time client
1 0.986 7.229 10.528 0.171 0.075 18.989
2 0.931 14.038 22.111 0.135 0.072 37.288
4 0.848 26.531 42.519 0.138 0.080 70.116
8 0.794 50.114 83.765 0.161 0.143 135.178
The table values are in seconds.
Table 9: The standard deviations for the average response times given in Table 8
Data Data access/query Data Image Response
Size (MB) satellite seismic boundary Overlay Transfer Time client
1 0.162 0.197 0.200 0.090 0.042 0.368
2 0.320 0.127 0.214 0.035 0.039 0.373
4 0.142 0.654 0.477 0.028 0.031 0.772
Page 162
148
8 0.130 0.180 1.805 0.069 0.156 1.683
In Figure 48, x-coordinate values are data sizes in MB. Each column shows total
response time to access/query three set of data. One of them is satellite map image and
other two are GNL data sets. X-coordinate values represent data size for each GML data
sets, earthquake seismic and state boundaries data. For example for the last column, 8MB
of earthquake seismic data and 8MB of state boundaries data are accesses/queried. Total
data size fetched is 16MB + size of satellite map image for the corresponsing bounding
box parameter.
Figure 48: The overall (end-to-end) average response times - straightforward sequential data access
to data sources.
Page 163
149
From the figure we see that for the small data payloads (less than 2MB – second
bar in Figure 48) the response time is acceptable. However for larger data payloads the
performance gets worse and the response time gets relatively longer. On the other hand,
scientific applications require handling (transferring, parsing, rendering and displaying)
large scale data. We enhance these baseline performance results by using federator and
optimized parallel data access and query technique presented earlier.
6.6.4. Performance Enhancement with Federation and Parallel Query
Optimization through WT tables
This chapter shows the performance enhancements from (1) federator‟s
characteristic features such as accessing the separate data sources in parallel and (2) for
an individual data set, applying attribute-based query decomposition and accessing in
parallel through WT tables. This technique is explained earlier in Chapter 6.4 as
“adaptive parallel query optimization”.
1) Access/query of data sources in parallel – federator’s architectural
properties:
Here, we show how much performance gain we obtain by fetching the data sets
parallel for the test case scenario given in Figure 47.
Table values are in seconds.
Page 164
150
Table 10: Average Response times - parallel data access through the federator.
Data Parallel Data Image Response
Size (MB) Data Fetch Overlay Transfer Time Client
1 10.60 0.14 0.12 10.87
2 22.61 0.17 0.13 22.91
4 42.75 0.14 0.12 43.01
8 83.91 0.15 0.15 84.21
Table 11: Standard deviations for the average values given in Table 10
Data Parallel Data Image Response
Size (MB) Data Fetch Overlay Transfer Time Client
1 0.206 0.034 0.181 0.261
2 0.491 0.116 0.130 0.507
4 0.454 0.085 0.173 0.497
8 1.957 0.050 0.118 1.560
Page 165
151
Figure 49: Average response times - parallel data access through the federator
The data source with the slowest response time defines the overall parallel data
access time. As it is shown in Table 10 and Figure 49, state boundaries data from USGS
in Colorado (see Figure 47) is the slowest server responding and it dominates the overall
response time. The performance gain from parallel access through federator increases as
the response time differences between the data sets decreases.
In order to get rough approximation of performance gain, compare this figure
with Figure 48 which gives total response time by sequential data access. For example,
the last column shows that parallel data access for the test case scenario is two times
faster than the sequential access.
Page 166
152
2) Further enhancement by accessing individual data sets in parallel
We use optimized parallel query technique given in Chapter 6.4 to access
individual data set. This technique is called workload estimation table (WT).
The performance values change depending on the partitions‟ threshold query size
and error rate given to the algorithm to build WT. These issues analyzed and evaluated in
Chapter 6.4 and specifically in Figure 41. Here we apply the technique to the given test
case (Figure 47) and compare the results with the baseline test results (Figure 48).
Here are the parameters given to WT for the individual data sets earthquake
seismic data and state boundaries data:
• WT parameters for state boundaries:
• Partition size=2MB
• Error rate=1.0
• Data sources: frameworkwfs.usgs.gov and gridfarm18.ucs.indiana.edu
• WT for earthquake seismic data:
• Partition size=1MB
• Error rate=0.2
• Data sources: gridfarm12.ucs.indiana.edu and gf.17.ucs.indiana.edu
When we use these WT tables for those data sets and fetch the data parallel we get
the optimized performance results given in Table 12 and shown in Figure 50. Table
values are in seconds.
Page 167
153
Table 12: Average Response times - parallel data access through the federator and WT tables
Data Parallel Data Image Response
Size (MB) Data Fetch Overlay Transfer Time Client
1 8.651 0.143 0.125 8.928
2 15.843 0.171 0.132 16.145
4 27.029 0.140 0.120 27.285
8 41.792 0.152 0.153 42.094
Table 13: Standard deviations for the values given in Table 12
Data Parallel Data Image Response
Size (MB) Data Fetch Overlay Transfer Time Client
1 0.167 0.034 0.181 0.383
2 0.109 0.116 0.130 0.355
4 0.131 0.085 0.173 0.390
8 0.924 0.050 0.118 1.092
Page 168
154
Figure 50: Average response times - parallel data access through the federator and WT tables
Figure 50 shows the improved performance results from using WT to make
parallel data access/query. As you realize the slowest individual data access dominate the
overall performance. In this test case scenario the slowest data source is state boundaries
data provided by WFS from SDSC at Colorado. The blue-bars in the figure actually
represent the access/query times of the state boundary data. The performance gain from
parallel data access/query increases as the response time difference between data sets
decreases compared to synchronous data access/query.
Page 169
155
3) Comparison of performances of optimized parallel data access via WT
(Figure 50) with sequential access (Figure 48):
Table values are in seconds.
Table 14: Comparison of average response times - optimized parallel data access with sequential
access
Data Response Times Standard Deviation
Size (MB) Sequential Optmzd Parallel Sequential Optmzd Parallel
1 18.989 8.916 0.368 0.383
2 37.288 16.143 0.373 0.355
4 70.116 27.280 0.772 0.390
8 135.178 42.093 1.683 1.092
Figure 51 shows that we gain a lot of performance by accessing data sources in
parallel with the adaptive optimization technique based on WT. We can also conclude
that (1) as the data size increase the performance gain increases, and (2) if the individual
data access/query times get closer to each other, then the performance gain from the
parallelization of these data sets increases. To be more specific, for the total size 16MB
the overall performance gain from the parallelization through WT is about four times
better than the one from the sequential data access.
Page 170
156
Figure 51: Comparison of the average response times of the straightforward and optimized parallel
query approaches.
Besides the data characteristics, different data types such as point data, linearRing
data, lineStrings etc. affects the performance gain from parallelization. Sometimes
queried objects cannot be decomposed perfectly because of the queried objects‟
continuity properties. In case of fetching discrete objects, it is possible that some objects
will be fetched multiple times and that degrades the system performance gain.
Page 171
157
CHAPTER 7
ABSTRACTION OF THE FRAMEWORK FOR THE
GENERAL DOMAINS
Our experiences with GIS have shown that a federated, service-oriented, GIS-
style information model can be generalized to many application areas and scientific
domains. We call this generalized framework Application Specific Information System
(ASIS), and provide a blueprint architecture in terms of principles and requirements (see
Figure 52). Developing such a framework requires first defining a core language (such as
GML) expressing the primitives of the domain; second, key service components, service
interfaces and message formats defining services interactions; and third, the capability
file requirements (based on core-language) enabling inter-service communications to link
the services for the federation.
Page 172
158
7.1. Generalization Framework
GIS is a mature domain in terms of information system studies and experiences. It
has standards bodies defining interoperable online service interfaces and data models
such as OGC ISO/TC211, but many other fields do not have this. In order to see the
applicability of the GIS-style information model given in Chapter 4, we have surveyed
two science domains (Astronomy and Chemistry). Table 15 presents the results briefly in
terms of service counterparts (ASIS vs. science domains).
Astronomy has a standards body, the International Virtual Observatory Alliance
(IVOA) ("IVOA," 2004), for defining data formats and online services that are somewhat
analogous to the OGC standards. FITS (Flexible Image Transfer), Images and VOTable
(Williams et al., 2002) are the data models. SkyNodes are database servers with an
ADQL (Astronomy Distributed Query Language) based SOAP interfaces that return
VOTable-encoded results. VOPlot (Kale, Navelkar, Hegde, Kembhavi, & Kulkarni,
2004) and TopCat (Clifton, Cooley, & Rennie, 2004) are two services to visualize the
astronomy data in the format of VOTable (Ochsenbein, 2008), FITS (Wells, Greisen, &
Harten, 1981) and images. VOResource and Unified Content Descriptors (UCD) are the
metadata definition and standards for the service descriptions (Yasuda et al., 2004).
Chemistry, although a vastly different field, does provide a common data model
(CML (G. L. Holliday et al., 2006)) that can be used to build up Web Services. Although
many research groups have investigated service architectures for chemistry and chemical
informatics, the field has (to our knowledge) no Web Service standards-defining body
equivalent to the OGC or IVOA. There has been work to define "chemical spaces"
Page 173
159
(Kirkpatrick & Ellis, 2004) that are analogous to geographic spaces, although the
number of dimensions may be greater. In this case, our approaches to GIS information
retrieval could probably be extended to cover chemical information.
This chapter presents a high level architecture that consists of abstract
components and explains their data flow and components interactions. In this section, we
focus on the principles and requirements to generalize GIS-like architecture to any other
information system domains. It should be noted that this abstract architecture is intended
to be domain-specific. That is, it may be realized in chemistry or astronomy, for
example, but we are not suggesting cross-domain interoperability.
ASIS is a proposed solution to heterogeneous data integration. This solution
enables inter-service communication through well-defined service interfaces, message
formats and capabilities metadata. Data and service integration is done through capability
federation of these services, which are implemented in Web Services. In ASIS approach,
Figure 52: Application Specific Information System (ASIS)
Page 174
160
there are two general groups of services. These are Application Specific Feature Service
(ASFS) and Application Specific Visualization Service (ASVS), and each service is
described by corresponding generic metadata descriptions that can be queried through
Web Service invocations. In addition to allowing service discovery, this approach also
enables at least three important qualities of services. First, services of the same type that
provide a subset of the request can be combined into a “super-service” that spans the
query space and has the aggregate functionality of its member services. Second, the
capability metadata can be used to determine how to combine services into filter chains
with interconnected input-output ports. Third (and building on the previous two),
capabilities of super-services can be broken into smaller, self-contained capabilities that
can be associated with specific services. This enables performance gains through load-
balancing.
ASIS must consist of filter-like Web Services components (ASFS and ASVS)
having common interfaces and communicating with each other through a capability
metadata exchange. Being a Web Service enables filter services to publish their
interfaces, locate each other and chain together easily. Filters have inter-service
capabilities and are chainable. If the filter is capable of communicating and obtaining
data from other filters, and updates (or aggregates) its capability metadata with these data
(after capability files exchange), then it can claim that it serves these data. Filter Services
are information/data services that enable distributed data/information access, querying
and transformation through their predictable input/output interfaces defined by capability
document. Filter located in the same community network can update their capability
metadata dynamically through “getCapabilities” service interface of the filters.
Page 175
161
Dynamically updating capabilities of filters enable removal of obsolete data or down
filters.
7.2. Standard Service Interfaces and Mediators
As it is illustrated in Figure 52, inter-service communication is achieved through
common service interfaces and capability metadata exchange. The standard service
interfaces can be grouped into three types: a) capability metadata exchange: inter-service
communication (set-up stage); b) interactive data display: selecting layer composition and
bounding box regions; and c) querying of data itself over the display, getting further
information about the data content and attributes.
As mentioned before, capability helps clients make valid requests for its
successive queries. Capability basically provides information about the data sets and
operations available on them with communication protocols, return types, attribute based
constraints, etc. Each domain has different set of attributes for the data and it is defined in
ASL common data model. For example, in GIS domain, attributes might be bounding box
values (defining a range query for data sets falling in a rectangular region) and coordinate
reference system.
Standard requests/query instances for the standard service interfaces are created
according to the standard agreed-on request schemas. These must be defined by open
standards bodies in corresponding domains. The request instances contain format and
attribute constraints related to the ASL common data model. For example in the GIS
domain, getMap request defines a map images‟ return format (JPEG, PNG, SVG, etc.),
height, width, bounding box values, and so on. Format, height and width are related to
Page 176
162
display, but bounding box values are related to the attributes of the data defined in its
ASL representation provided by ASFS. In this specific example of the getMap request,
ASVS must both visualize information through the getMap service interface and provide
a way of navigating ASFS services and their underlying database. ASVS make
successive queries to the related ASVSs to get the ASL data and render it to create final
display for its clients.
In ASIS, the task of mediators is to translate requests to the standard service
interfaces to those of the information/data sources‟, and transform the results provided by
the information source back to the ASIS‟s standard formats. For ASFS, the returned data
is ASL, and for ASVS the returned results can be any kind of display format such as
images.
The mediators-wrappers (in Figure 52) enable data sources integrated to the
system conform to the global data model (ASL) but enable the data sources to maintain
their internal structure. At the end, this whole mediator system provides a large degree of
autonomy. Instead of actual physical data federation, system makes distributed querying
and response composition on the fly.
7.3. Components Abstraction – ASFS and ASVS
In ASIS, there are two groups of filter services, ASVS and ASFS, which
correspond to the OGC‟s WFS and WMS, respectively. Since they have different service
APIs and provided data, they have different schema of capabilities. The capability
metadata defines service and data attributes, and their constraints and limitations to
enable clients to make valid queries and get expected results. Capabilities metadata and
Page 177
163
Application Specific Language (ASL) are closely related to each other. One defines the
domain-specific data and other defines the query and response constraints over the
service and data provided.
ASVS must visualize information and provides a way of navigating ASFS and
their underlying database. ASVS must provide human readable information such as text
and graphs (scalable vector graphic (SVG) or portable network graphic (PNG)) images.
An ASFS is an annotation service providing heterogeneous data in common data model
with an attribute-based query capability. ASFS serves data in ASL, which must be
realized as a domain specific XML-encoded common data model containing content and
representation tags. Heterogeneity in queries and data formats is handled through
resource specific mediators.
User defined services in ASIS (see Figure 52) provide application specific data
and services. These can include transformations, reasoning, event-detection, and data-
mining tools for extraction knowledge from the feature data provided by ASFS in ASL
format.
Page 178
164
Table 15: Components and common data model matching for generalization of GIS to ASIS. Two
selected domains are Astronomy and Chemistry.
Page 179
165
CHAPTER 8
CONCLUSION AND FUTURE WORK
8.1. Summary and Conclusions
We have presented a service-oriented architecture for understanding and
managing the production of knowledge from the distributed observation, simulation and
analysis data through integrated data-views in the form of multi-layered map images. The
infrastructure is based on a common data model, standard GIS Web-Service components,
and a federation service. The federator integrates GIS data service components and
enables unified data access and query over integrated data-views through event-based
interactive display tools. Integrated data-views are defined in the federator‟s capability
metadata, which consists of composition of layers provided by standard GIS Web-
Services. The framework applies just-in-time (late-binding) federation in which the data
Page 180
166
is kept in its originating sources all the time. This enables autonomy and ease of data
maintenance.
Creating a GIS in accordance with OGC and Web Services standards, and the
compatibility nature of open standard GIS services and their capability definitions,
inspired us to develop an information system enabling both unified data access/query and
display from a single access point. Open standards and Web Service technologies also
enable integrating the third party geospatial functionality and data into the custom
applications easily.
We have developed a framework for federating service-oriented Geographic
Information Systems and have addressed interoperability issues by integrating Web
Services with Open Geographic Standards. This enables us to provide interoperability at
data, service and application levels, and to integrate Geo-data sources into Geo-science
Grid applications seamlessly. We have also enhanced the standard Web Map Service
with the streaming data-transfer and rendering capability by using a publish/subscribe-
based messaging middleware.
The federator architecture inherently enables workload sharing by fetching the
different data layers from separate resources to create a multi-layered map image. This is
natural load balancing and parallel processing resulting from the architectural features.
However, we can take this general idea further. In addition to layer-based load-balancing,
a layer (in the multi-layered map image) itself can be split into smaller bounding box tiles
and each tile can be farmed out to a worker Web Feature Servers and Web Map Servers.
Layer-based partitioning is based on attribute-based query decomposition.
Page 181
167
We have introduced novel load balancing and parallel processing technique with
attribute-based query partitioning for unevenly distributed, variable-sized data processing
and rendering. We applied it to distributed map rendering from the federator‟s point of
view. This is basically an adaptive query optimization technique that is applicable to the
range queries for getting numerical values.
In such a framework built over common data model and standard service
interfaces according to standard specifications, repeated XML validations are not crucial
and impede performance. In such cases, using pull parsing approach for handling XML-
encoded data models give the best performance results in data rendering compared to
other XML data handling approaches such as Document Object Model (DOM) and the
push approach (ex. Simple API for XML -SAX).
Regarding the system software contribution, we have developed streaming and
non-streaming versions of the Open Geospatial Consortium‟s Web Map Server (WMS)
with Web Service principles. We have also developed a federation service supporting
performance-enhancing techniques such as adaptive load balancing and parallel
processing over distributed GIS Web Services. We have also developed generic
browser/event-based interactive map tools for data access, query and display enhanced
with AJAX technologies.
Although our framework has been developed for GIS, we have also defined the
principles for generalizing our approach to other science domains. We call this
generalization ASIS – Application Specific Information Systems. ASIS is a blueprint
architecture for generalizing GIS-like federated information systems. We have defined
two general service types of services (ASFS and ASVS) with prescribed service
Page 182
168
interfaces that enable metadata exchange and data querying. Data flows from databases to
users through ASFS and then ASVS. Due to the domain specific data heterogeneity, each
domain should define its own ASL and corresponding queries.
8.2. Summary of Answers to Research Questions
1. How to integrate Web Service principles with some features (data and rendering
services) of GIS to enable fine-grained dynamic information presentation?
- Incorporating widely accepted Open GIS Standards with Web Services
The Web Map Service (WMS) and the Web Feature Service (WFS) are two major
services defined by OGC for creating a basic GIS framework enabling information
rendering of heterogeneous data sources as map images. WMS is the key service to the
information rendering/visualization in GIS domain. WMS produces maps from the
geographic data in GML provided by WFS. It also enables attribute and feature-based
data querying over data display by its standard service interfaces
We have demonstrated that the common Open Geographic Standards can be
developed with WSDL-SOAP based Web Services. We have used these services in
several Geo-science applications and have demonstrated the usability of these services.
This is described in detail in Chapter 5.
In order to incorporate widely accepted OGC standards, we have created XML-
based standard query schemas from the standard HTTP GET/POST based query
definitions which are actually attribute-value pairs. We have also defined standard
services as Web Service in Web Service Description Language (WSDL) based on the
services/functions provided. For WMS see Chapter 3.3.2 and for WFS see (Aydin, 2007).
Page 183
169
2. How to merge Asynchronous Java Script and XML (AJAX) with Web Services
client stubs for event and browser-based interactive map tools?
- Mediating HTTP-based AJAX tools with SOAP-based GIS Web Services
AJAX uses HTTP GET/POST requests (through JavaScript‟s XMLHttpRequest)
for the message transfers. Web Services use Simple Object Access Protocol (SOAP) to
communicate. In order to be able to integrate these two different message protocols, we
must convert the message formats into a common format or make them interoperable.
Integration is based on coupling AJAX actions with the Web Services
invocations, and synchronizing the request and response objects from the point of end
users (or browser). In order to do that, we introduced an intermediary service explained in
Chapter 3.3.3.2.
AJAX and Web Services are XML based structures and this property allows
developers to utilize their advantages together. The proposed system enables AJAX based
high performance web application to be able to invoke/interact with Web Services. If
Web Service based applications have web based user interface for end users, then, using
this framework makes displaying much faster. Users do not need to wait whole data to be
received to render and display the results. Partial displaying is possible without refreshing
the whole page. Instead of making request for whole page, only the interested part will be
requested. This also reduces the workload of the network traffic.
3. How to make attribute based federated query over distributed heterogeneous
geo-data sources?
- Capability metadata aggregation of standard GIS Web Services
Page 184
170
- Unified data access/query from a single access point (with the help of
federator’s aggregated capability metadata)
The OGC defined standard data services (Web Map Server and Web Feature
Server) provide data in standard formats (common data models) with the corresponding
capability metadata (about the data+services) with the standard service API. These
properties of the services and standardization make them compos-able. Compos-ability
nature of the standard GIS data services inspired us developing a federated information
system framework enabling first, application-based hierarchical data definitions, and
second, high performance designs based on load balancing and parallel processing.
We have introduced a federator (extended from Web Map Server –WMS, see
Chapter 4.3.1.1. and 4.3.1.2) which federates the standard GIS Web Services components
through aggregation of their capabilities metadata and presents a single database image to
the user which is defined in its aggregated capability metadata. This enables application-
based compositions of data sets and corresponding services and unified data
access/query/display from a single access point.
4. How to generalize the domain-specific federation framework (proposed for
GIS) to general science domains such as Astronomy and Chemistry?
- Defining architectural requirements
- Analyzing constraints and limitations
Our experiences with GIS have shown that federated, service-oriented, GIS-style
information model can be generalized to many application areas such Chemistry and
Astronomy. We call this generalized framework Application Specific Information System
Page 185
171
(ASIS) and give blueprint architecture in terms of principles and requirements (Chapter
7). Developing such a framework requires first defining a core language (such as GML)
expressing the primitives of the domain, second, key service components, service
interfaces and message formats defining services interactions, and third, the capability
file (based on core-language) enabling inter-service communications to link the services
for the federation.
GIS is a mature domain in terms of information system studies and experiences. It
has standards bodies defining interoperable online service interfaces and data models
such as OGC ISO/TC211, but many other fields do not have this. In order to see the
applicability of the GIS-style information model given in Chapter 4, we have surveyed
two science domains (Astronomy and Chemistry). Table 15 presents the results briefly in
terms of service counterparts (ASIS vs. science domains).
5. How to make responsive data access/query over the data defined and queried by
range attributes?
- Sharing an unpredictable workload ( whose load changes by range query) to
the workers in a most efficient way
- Adaptive load balancing and unpredictable workload estimation
- Parallel data access/query via attribute-based query decomposition
Federator inherently makes workload sharing by fetching the different data sets
from separate resources to create multi-layered map image. This is a natural load
balancing and parallel processing resulting from the architectural features.
Page 186
172
A layer (in the multi-layered map image) itself can be split into smaller bounding
box tiles and each tile can be farmed out to slave WFS/WMS. Layer-based partitioning is
based on attribute-based query decomposition in which the attribute is the bounding box
defining the requested data‟s range in a rectangular shape. This is presented in Chapter
6.4.
In order to estimate the main query workload and partition it into the most
efficient number, we propose a data structure used by the federator called as Workload
Estimation Table (WT). It is created once and synchronized with the remote database
routinely to reflect the data characteristics in database (data dense sparse regions based
on range-location).
6. How to apply pull-parsing technique to GML data rendering, and analyzing the
limitations of the other parsing techniques
There are two well-known and commonly-used paradigms for processing XML
data, the Document Object Model (DOM) and the Simple API for XML (SAX). DOM
builds a complete object representation of the XML document in memory. This can be
memory intensive for large documents, and entails making at least two passes through the
data. SAX operates at one level lower. Rather than actually constructing a model in
memory, it informs the application of elements through callbacks. This also requires at
least two passes through the data. These are all expensive and resource (such as CPU and
memory) consuming processes and they don‟t provide enough performance for the large
scale applications.
Page 187
173
In such a framework built over common data model and standard service
interfaces according to standard specifications, the repeated data validations are not
crucial. In such cases, using pull parsing approach for handling XML-encoded data
models give the best performance results in data rendering compared to other XML data
handling approaches such as Document Object Model (DOM) and push approach (ex.
Simple API for XML -SAX).
8.3. Future Research Directions
In this thesis we have outlined our research and implementations to build
geophysical data Grid architecture enabling fine-grained information/knowledge
presentations in multi-layered map images through novel federator architecture based on
common data model, standard GIS Web-Service components and a federation service.
We addressed several issues related to archival data access and processing from a single
access point, and investigated high-performance design techniques to support responsive
Geographic Information Systems.
The work presented in this thesis was aimed towards problems in Geo-science,
and we believe it can be adopted for other scientific domains if those domains‟ data can
be spatially defined. The data space may be real space (such as astronomy), or it may be
in a parameter space (such as chemical spaces). However the effects of domain specific
requirements are not well understood. We think that it is important to explore how the
common data standards such as GML and service standards such as WFS or WMS can be
adapted to these different domains. Our initial discussion for that is given in Chapter 7.
More detailed future researches might be listed as below:
Page 188
174
Integrating dynamic/adaptable resources discovery and capability aggregation
service to federator: In the proposed federated GIS system, we use a static approach to
create application specific hierarchical data layers in federator‟s aggregated capability
metadata. Federated capabilities that define the data and corresponding data sources are
not allowed to be changed or updated after the application runs. It would be useful for the
system to automatically create, deploy, and update the required layers and to add the
corresponding services dynamically.
Applying distributed hard-disk approach to handle large scale workload
estimation tables: In case of creation of WT for relatively large data sets (i.e. larger than
the local server‟s physical storage capacity), the system might fail. This challenge can be
overcome by utilizing distributed hard disk approach. Apache Hadoop (ex. Hadoop)
("The Hadoop Project," 2008) can be given as a good example distributed hard disk
implementation for data intensive distributed applications. It enables applications to work
with thousands of nodes and petabytes of data.
Extending the system with Web2.0 (Shuen, 2008) standards: The term "Web 2.0"
describes the changing trends in the use of World Wide Web technology and web design
that aim to enhance creativity, communications, secure information sharing, collaboration
and functionality of the web. It would be useful to see to see if our proposed framework
can be extended with Web2.0 and what kind of outcomes can be obtained.
Layered WT for different zoom levels and handling/optimizing multiple range
queries: In order to avoid from unnecessary number of parallel queries (for relatively
higher zoom levels)), introducing the layered Workload Estimation Tables (WT) would
be very efficient. This approach is similar to Google Map‟s tiling approach for map
Page 189
175
images for different zoom (resolution) levels. Moreover, in case of using range queries
having multiple different range variables, the gain from the optimization might not be as
good as expected. It would be useful to be able to use combination of multiple WTs.
Page 190
176
APPENDICES
APPENDIX A: Sample Request Instances to standard WMS Service
Interfaces
i. GetCapability Request Instance
Page 191
177
ii. GetMap Request Instance
Page 192
178
iii. GetFeatureInfo Request Instance
Page 193
179
APPENDIX B: A Template Capabilities.xml File for WMS.
Page 194
180
APPENDIX C: A Sample WMS Capabilities.xml Instance
<?xml version="1.0" encoding="UTF-8"?> <!--Sample XML file generated by XMLSPY v2004 rel. 4 U (http://www.xmlspy.com)--> <WMS_Capabilities xmlns="http://www.opengis.net/wms" xmlns:xlink="http://www.w3.org/1999/xlink" xmlns:xsi="http://www.w3.org/2001/XMLSchema-instance" xsi:schemaLocation="http://www.opengis.net/wms C:\capabilities_1_3_0.xsd" version="1.3.0" updateSequence="String"> <Service> <Name>WMS</Name> <Title>Pervasive WMS</Title> <Abstract>wms reference implementation</Abstract> <KeywordList> <Keyword >pervasive</Keyword> <Keyword >wms</Keyword> </KeywordList> <OnlineResource xmlns:xlink="http://www.w3.org/1999/xlink" xlink:type="simple" xlink:href="http://toro.ucs.indiana.edu:8086/WMSServices.wsdl"/> <!-- the following service information is optional --> <ContactInformation> <ContactPersonPrimary> <ContactPerson>Ahmet Sayar</ContactPerson> <ContactOrganization>Pervasive Tech Lab</ContactOrganization> </ContactPersonPrimary> <ContactPosition>Research Assistant</ContactPosition> <ContactAddress> <AddressType>XXXX</AddressType> <Address>501 N. Morton St. Rm 222</Address> <City>Bloomington</City> <StateOrProvince>IN</StateOrProvince> <PostCode>47404</PostCode> <Country>USA</Country> </ContactAddress> <ContactVoiceTelephone>1(812)8560752</ContactVoiceTelephone> <ContactFacsimileTelephone>1(812)8567972</ContactFacsimileTelephone> <ContactElectronicMailAddress>[email protected] </ContactElectronicMailAddress> </ContactInformation> </Service> <Capability> <Request> <GetCapabilities> <Format>application/vnd.ogc.wms_xml</Format> <DCPType> <!-- Currently there is just one DCPT supported HTTP. In the near future there will be web services support by the Open-GIS. Whenever they update their standard schemas, I will update my capabilities document.--> <HTTP><Get><OnlineResource /></Get>
<Post> <OnlineResource /></Post> </HTTP>
Page 195
181
</DCPType> </GetCapabilities> <GetMap> <Format>image/gif</Format> <Format>image/png</Format> <Format>image/jpg</Format> <Format>image/tif</Format> <Format>image/bmp</Format> <Format>image/svg+xml</Format> <DCPType> <HTTP><Get><OnlineResource /></Get>
<Post> <OnlineResource /></Post> </HTTP>
</DCPType> </GetMap> </Request> <Exception> <Format>application/vnd.ogc.se_xml</Format> <Format>application/vnd.ogc.se_inimage</Format> <Format>application/vnd.ogc.se_blank</Format> </Exception> <Layer queryable="0" cascaded="1" opaque="0" noSubsets="0" fixedWidth="1" fixedHeight="1"> <Name>pervasive WMS-demo Layers</Name> <Title>pervasive WMS-demo Layers</Title> <Abstract>pervasive WMS-demo Layers</Abstract> <KeywordList> <Keyword>pervasive</Keyword> <Keyword>WMS</Keyword> <Keyword>layer</Keyword> </KeywordList> <CRS>EPSG:4326</CRS> <EX_GeographicBoundingBox> <westBoundLongitude>-150</westBoundLongitude> <eastBoundLongitude>100</eastBoundLongitude> <southBoundLatitude>30</southBoundLatitude> <northBoundLatitude>50</northBoundLatitude> </EX_GeographicBoundingBox> <MinScaleDenominator>0</MinScaleDenominator> <MaxScaleDenominator>100000000</MaxScaleDenominator> <!-- WORLD SEISMIC --> <Layer queryable="0" cascaded="1" noSubsets="0"> <Title>World_Seismic</Title> <Abstract>Seismic data for the world</Abstract> <CRS>EPSG:4326</CRS> <Layer queryable="1" cascaded="1" noSubsets="0" fixedWidth="0" fixedHeight="0"> <Name>Nasa:Satellite</Name> <Title>Nasa:Satellite</Title> <EX_GeographicBoundingBox> <westBoundLongitude>-150</westBoundLongitude> <eastBoundLongitude>-100</eastBoundLongitude>
Page 196
182
<southBoundLatitude>30</southBoundLatitude> <northBoundLatitude>50</northBoundLatitude> </EX_GeographicBoundingBox> <BoundingBox CRS="EPSG:26986" minx="189000" miny="834000" maxx="285000" maxy="962000" resx="1" resy="1" /> <MinScaleDenominator>0</MinScaleDenominator> <MaxScaleDenominator>100000000</MaxScaleDenominator> </Layer> <Layer queryable="1" cascaded="1" noSubsets="0" fixedWidth="0"
fixedHeight="0">
<Name>Google:Map</Name> <Title>Google:Map</Title> <EX_GeographicBoundingBox> <westBoundLongitude>-150</westBoundLongitude> <eastBoundLongitude>-100</eastBoundLongitude> <southBoundLatitude>30</southBoundLatitude> <northBoundLatitude>50</northBoundLatitude> </EX_GeographicBoundingBox> <BoundingBox CRS="EPSG:26986" minx="189000" miny="834000" maxx="285000" maxy="962000" resx="1" resy="1" /> <MinScaleDenominator>0</MinScaleDenominator> <MaxScaleDenominator>100000000</MaxScaleDenominator> </Layer> <Layer queryable="1" cascaded="1" noSubsets="0" fixedWidth="0" fixedHeight="0"> <Name>Google:Satellite</Name> <Title>Google:Satellite</Title> <EX_GeographicBoundingBox> <westBoundLongitude>-150</westBoundLongitude> <eastBoundLongitude>-100</eastBoundLongitude> <southBoundLatitude>30</southBoundLatitude> <northBoundLatitude>50</northBoundLatitude> </EX_GeographicBoundingBox> <BoundingBox CRS="EPSG:26986" minx="189000" miny="834000" maxx="285000" maxy="962000" resx="1" resy="1" /> <MinScaleDenominator>0</MinScaleDenominator> <MaxScaleDenominator>100000000</MaxScaleDenominator> </Layer> </Layer> </Layer> </Capability> </WMS_Capabilities>
Page 197
183
APPENDIX D: A Sample Instance of WFS Capabilities file
Page 200
186
APPENDIX E: A Simplified WMS Web Services Service Definition file
(WSDL)
<?xml version="1.0" encoding="UTF-8"?> <wsdl:definitions targetNamespace="http://services.wms.ogc.cgl"
xmlns:apachesoap="http://xml.apache.org/xml-soap" xmlns:impl="http://services.wms.ogc.cgl" xmlns:intf="http://services.wms.ogc.cgl" xmlns:soapenc="http://schemas.xmlsoap.org/soap/encoding/" xmlns:wsdl="http://schemas.xmlsoap.org/wsdl/" xmlns:wsdlsoap="http://schemas.xmlsoap.org/wsdl/soap/" xmlns:xsd="http://www.w3.org/2001/XMLSchema">
<!--WSDL created by Apache Axis version: 1.2RC2 Built on Dec 08, 2004 (12:13:10 PST)--> <wsdl:message name="getFeatureInfoResponse"> <wsdl:part name="getFeatureInfoReturn" type="xsd:string"/> </wsdl:message> <wsdl:message name="getMapResponse"> <wsdl:part name="getMapReturn" type="xsd:anyType"/> </wsdl:message> <wsdl:message name="getCapabilityResponse"> <wsdl:part name="getCapabilityReturn" type="xsd:string"/> </wsdl:message> <wsdl:message name="getMapRequest"> <wsdl:part name="request" type="xsd:string"/> </wsdl:message> <wsdl:message name="getFeatureInfoRequest"> <wsdl:part name="request" type="xsd:string"/> </wsdl:message> <wsdl:message name="getCapabilityRequest"> <wsdl:part name="request" type="xsd:string"/> </wsdl:message> <wsdl:portType name="WMSServices"> <wsdl:operation name="getMap" parameterOrder="request"> <wsdl:input message="impl:getMapRequest" name="getMapRequest"/> <wsdl:output message="impl:getMapResponse" name="getMapResponse"/> </wsdl:operation> <wsdl:operation name="getCapability" parameterOrder="request"> <wsdl:input message="impl:getCapabilityRequest" name="getCapabilityRequest"/> <wsdl:output message="impl:getCapabilityResponse" name="getCapabilityResponse"/> </wsdl:operation> <wsdl:operation name="getFeatureInfo" parameterOrder="request"> <wsdl:input message="impl:getFeatureInfoRequest" name="getFeatureInfoRequest"/> <wsdl:output message="impl:getFeatureInfoResponse" name="getFeatureInfoResponse"/> </wsdl:operation> </wsdl:portType> <wsdl:binding name="WMSServicesSoapBinding" type="impl:WMSServices"> <wsdlsoap:binding style="rpc" transport="http://schemas.xmlsoap.org/soap/http"/>
Page 201
187
<wsdl:operation name="getMap"> <wsdlsoap:operation soapAction=""/> <wsdl:input name="getMapRequest"> <wsdlsoap:body encodingStyle="http://schemas.xmlsoap.org/soap/encoding/"
namespace="http://services.wms.ogc.cgl" use="encoded"/>
</wsdl:input> <wsdl:output name="getMapResponse"> <wsdlsoap:body encodingStyle="http://schemas.xmlsoap.org/soap/encoding/"
namespace="http://services.wms.ogc.cgl" use="encoded"/>
</wsdl:output> </wsdl:operation> <wsdl:operation name="getCapability"> <wsdlsoap:operation soapAction=""/> <wsdl:input name="getCapabilityRequest"> <wsdlsoap:body encodingStyle="http://schemas.xmlsoap.org/soap/encoding/"
namespace="http://services.wms.ogc.cgl" use="encoded"/>
</wsdl:input> <wsdl:output name="getCapabilityResponse"> <wsdlsoap:body encodingStyle="http://schemas.xmlsoap.org/soap/encoding/"
namespace="http://services.wms.ogc.cgl" use="encoded"/>
</wsdl:output> </wsdl:operation> <wsdl:operation name="getFeatureInfo"> <wsdlsoap:operation soapAction=""/> <wsdl:input name="getFeatureInfoRequest"> <wsdlsoap:body encodingStyle="http://schemas.xmlsoap.org/soap/encoding/"
namespace="http://services.wms.ogc.cgl" use="encoded"/>
</wsdl:input> <wsdl:output name="getFeatureInfoResponse"> <wsdlsoap:body encodingStyle="http://schemas.xmlsoap.org/soap/encoding/"
namespace="http://services.wms.ogc.cgl" use="encoded"/>
</wsdl:output> </wsdl:operation> </wsdl:binding> <wsdl:service name="WMSServicesService"> <wsdl:port binding="impl:WMSServicesSoapBinding" name="WMSServices"> <wsdlsoap:address location="http://localhost:8080/wmsstream/services/WMSServices"/> </wsdl:port> </wsdl:service> </wsdl:definitions>
Page 202
188
APPENDIX F: A Simplified WFS Web Services Service Definition file
(WSDL)
Page 205
191
APPENDIX G: Sample GetFeature Request for WFS - for earthquake
fault data
Page 206
192
APPENDIX H: Sample Simplified GML Document for Earthquake
Fault data.
Page 207
193
APPENDIX I: Sample GetFeature Response
Page 208
194
REFERENCES
Adler, M., Boutell, T., Bowler, J., Brunschen, C., Costello, A. M., Crocker, L. D., et al.
(2003). Portable Network Graphics Specification (PNG) (No. REC-PNG-
20031110 ))
Allcock, W. (2003). Protocol extensions to FTP for the Grid (GGF Document Series-
GFD No. GFD-R.020). Los Alamos, USA: Argonna National Labs.)
Andersson, O., & others. (2003). Scalable Vector Graphics (SVG) Specification Version
1.1 (Standard Specification): World Wide Web Consortium (W3C))
ANL. (2008). Argonne National Labaratories Retrieved 02/12/2008s, 2008, from
http://www.anl.gov/
Apache Tomcat Project. (2008). Retrieved 03/10/2008, from http://tomcat.apache.org/
Apparao, V., Byrne, S., Champion, M., Isaacs, S., Jacobs, I., Hors, A. L., et al. (1998).
Document Object MOdel (DOM) Version1.0 (specification No. TR/REC-DOM-
Level-1): W3C)
Atkinson, M., DeRoure, D., Dunlop, A., Fox, G., Henderson, P., Hey, T., et al. (2005).
Web Service Grids: An Evolutionary Approach Concurrency & Computation:
Practice&Experience, 17(Number 2-4, February/April 2005), 377-389.
Aydin, G. (2007). Service Oriented Architecture for Geographic Information Systems
Supporting Real Time Data Grid. Unpublished Doctoral dissertation, Indiana
University, Bloomington.
Page 209
195
Aydin, G., Aktas, M. S., Fox, G. C., Gadgil, H., Pierce, M., & Sayar, A. (2005).
SERVOGrid Complexity Computational Environments (CCE) Integrated
Performance Analysis. Paper presented at the 6th IEEE/ACM International
Workshop on Grid Computing (Grid'05). from
http://grids.ucs.indiana.edu/ptliupages/publications/gwpap243.pdf
Aydin, G., Sayar, A., Gadgil, H., Aktas, M. S., Fox, G. C., Ko, S., et al. (2008). Building
and Applying Geographical Information Systems Grids. Concurrency and
Computation: Practice and Experience (To appear).
Beaujardiere, J. d. l. (2004). OGC Web Map Service Interface (Report No. 03-109r1):
Open GIS Consortium Inc. (OGC))
Berman, F., Fox, G., & Hey, T. (2003). Grid Computing: Making the Global
Infrastructure a Reality. Chichester, England: John Wiley & Sons.
Bhata, K., Menon, A., Zaslavsky, I., Seber, D., & Baru, C. (2003). CREATING GRID
SERVICES TO ENABLE DATA INTEROPERABILITY: AN EXAMPLE
FROM THE GEON PROJECT (Annual Meeting Report No. Paper No. 124-6).
Seattle: Geological Society of America (GSA))
Boag, S., Chamberlin, D., Fernández, M. F., vandenBerg, J., Robie, J., & Siméon, J.
(2007). XQuery 1.0: An XML Query Language (No. REC-xquery-20070123/ ).
(W. C. Recommendation )
Booth, D., Haas, H., McCabe, F., Newcomer, E., Champion, M., Ferris, C., et al. (2004).
Web Services Architecture [Electronic Version], from http://www.w3.org/TR/ws-
arch/
Page 210
196
Bowler, J., Brown, C., Capsimalis, M., Cohn, R., Cole, L., Deweese, T. E., et al. (2001).
SVG (Specification No. REC-SVG-20010904))
Bush, B. (2004). NISAC Interdependent Energy Infrastructure Simulation System (No.
LA-UR-04-7700): Los Alamos National Labs)
Bush, B., & others. (2003). NISAC ENERGY SECTOR: Interdependent Energy
Infrastructure Simulation System (IEISS) (Nisac Capabilities Workshop No. LA-
UR-03-1159). Portland,OR: Los Alamos National Labs)
Buswell, S., Devitt, S., Diaz, A., Ion, P., Miner, R., Poppelier, N., et al. (1999).
Mathematical Markup Language (MathML) version 1.01 (Standard
Specification): World Wide Web Consortium (W3C))
Buyya, R. (1999). High Performance Cluster Computing: Architectures and Systems
(Vol. 1). NJ, USA: Prentice Hall PTR.
Cao, P., & Wan, M. (2008, December 10, 2008). The HDF5-iRODS Module: A Data
Grid System for Object Level Access. Paper presented at the 4th IEEE
International Conference on e-Science, Indianapolis IN, USA.
CGL. (2001). Community Grids Laboratory Retrieved 07/25/2008, 2008, from
http://grids.ucs.indiana.edu/ptliupages/
Chen, A., Donnellan, A., McLeod, D., Fox, G., Parker, J., Rundle, J., et al. (2003).
Interoperability and Semantics for Heterogeneous Earthquake Science Data.
Paper presented at the (ISWC'03) International Workshop on Semantic Web
Technologies for Searching and Retrieving Scientific Data.
Page 211
197
Christensen, E., Curbera, F., Meredith, G., & Weerawarana, S. (2001). Web Services
Description Language (WSDL) (No. NOTE-wsdl-20010315 ): World Wide Web
Consortium (W3C))
Chu, K.-D., Di, L., & Thornton, P. (2006). Introduction of Grid Computing Application
Projects at the NASA Earth Science Technology Office Lecture Notes in
Computer Science (LNCS), 3947, 289-298.
Clark, J. (1999). XSL Transformations (XSLT) (No. REC-xslt-19991116): W3C)
Clark, J., & DeRose, S. (1999). XML Path Language (XPath) Version 1.0 (Specification
No. REC-xpath-19991116 ))
Clement, L., Hately, A., Riegen, C. v., & Rogers, T. (2004). Universal Description,
Discovery and Integration (UDDI) Version 3.0.2 (Technical Committee
Specification): OASIS)
Clifton, C., Cooley, R., & Rennie, J. (2004). data mining for topic identification in a text
corpus. IEEE Transactions on Knowledge and Data Engineering, 16, 949-964.
Committee, O. (2001). OpenGIS Implementation Specification: Grid Coverage (Report
No. Document 01-004): Open GIS Consortium Inc (OGC))
Cox, S., Daisey, P., Lake, R., Portele, C., & Whiteside, A. (2003). OpenGIS® Geography
Markup Language (GML) Encoding Specification (No. 02-023r4): Open
Geospatial Consortium (OGC))
crisisgrids. (2006). GIS Research at Indiana University Community Grids Lab.
Retrieved 03/10/2008, 2008, from http://www.crisisgrid.org
Page 212
198
Crockford, D. (2006). The application/json Media Type for JavaScript Object Notation
(JSON) (No. RFC 4627))
Dasarathy, B. V. (1991). Nearest Neighbor (NN) Norms: NN Pattern Classification
Techniques: IEEE Computer Society Press
Deegree. (2001). Retrieved 03/28/2008, 2008, from http://deegree.sourceforge.net/
Delaney, J. (2007). Geographical Information Systems, An Introduction (2nd ed.). New
York: Oxford University Press.
Denning, P. J. (2005). The locality principle. Communications of the ACM 48(7), 19-24.
Denning, P. J., & Schwartz, S. C. (1972). Properties of the working-set model.
Communications of the ACM, 15(3), 130.
Di, L., Chen, A., Yang, W., & Zhao, P. (2003, June 24, 2008). The Integration of Grid
Technology with OGC Web Services (OWS) in NWGISS for NASA EOS Data.
Paper presented at the 8th Global Grid Form (GGF8) & 12th High Performance
Distributed Computing (HPDC12) Seattle, USA.
Doherty, M., Blanshard, L., & Manandhar, A. (2003, September 2003). Implementing
and Using SRB. Paper presented at the e-Science All Hands Meeting (AHM
2003), Nottingham, UK.
Donnellan, A. (2004). QuakeTables Fault Database for Southern California (No. CL#04-
1973): NASA Jet Propulsion Labs (JPL))
Donnellan, A., Fox, G., Rundle, J., McLeod, D., Tullis, T., & Grant, L. (2003).
Numerical Simulations for Active Tectonic Processes: Increasing Interoperability
and Performance. Retrieved. from
Page 213
199
http://grids.ucs.indiana.edu/ptliupages/publications/Abstract_Donnellanjapanmar0
3.pdf.
ECMA. Retrieved 03/12/2008, from http://www.ecmainternational.org/
ECMAScript Language. (1999). (Standard specification))
Erl, T. (2005). Service-Oriented Architrecture (SOA): Concepts, Technology and Design.
Upper Saddle River: Prentice Hall Ptr.
ESRI. (2007). Retrieved March 23, 2008, from http://www.esri.com/index.html
Esri. (2004). ArcIMS (White Paper No. j-8694). (esri )
Evans, J. D. (2003). Web Coverage Service (WCS), Version 1.0.0 (OpenGIS® Standard
Specification No. 03-065r6))
Fielding, R. T., & Taylor, R. N. (2002). Principled design of the modern web
architecture. ACM Transactions on Internet Technology, 2(2), 115-150.
Foster, I., & Kesselman, C. (1996). Globus: A Metacomputing Infrastructure Toolkit. The
International Journal of Supercomputer Applications and High Performance
Computing, 11(2), 115-128.
Foster, I., & Kesselman, C. (2004). The Grid 2: Blueprint for a new Computing
Infrastructure. San Francisco, USA: Elsevier
Fox, G. C. (2004). Grids of Grids of Simple Services. Computing in Science and
Engineering, 6(4), 84-87.
Page 214
200
Gadgil, H., Fox, G., & Pallickara, S. (2005). HPSearch for Managing Distributed
Services. Paper presented at the IEEE/ACM Cluster Computing and Grid
Conference (CCGrid 2005).
Gadgil, H., Fox, G., Pierce, M., & Pallickara, S. (2005). HPSearch: Service Management
& Administration Tool. Paper presented at the 1st VLAB Workshop.
Google Map. (2005). Google maps Application Programming interface Retrieved
08/18/2008, 2008, from http://code.google.com/apis/maps/
Graham, S., Karmarkar, A., Mischkinsky, J., Robinson, I., & Sedukhin, I. (2006). Web
Services Resource Framework (WS-Resource), Version 1.2 (Standar
Specification): Organization for the Advancement of Structured Information
Standards (OASIS))
Granat, R. A. (2003, June 2003). A Method of Hidden Markov Model Optimization for
Use with Geophysical Data Sets. Paper presented at the International Conference
on Computational Science (ICCS 2003), Saint Petersburg, Russia.
Gray, J., Szalay, A. S., Thakar, A. R., Kunszt, P. Z., Stoughton, C., Slutz, D., et al.
(2002). Data Mining the SDSS SkyServer Database (Technical Report -TR No.
MSR TR 02 01): Microsoft)
group, I. V. W. (2005). IVOA SkyNode Interface (No. 2005-05-10): International Virtual
Observatory Alliance (IVOA))
GT4. (2008). Retrieved 06/12/2008, from http://www.globus.org/toolkit/docs/4.0/
Page 215
201
Gudgin, M., Hadley, M., Mendelsohn, N., Moreau, J.-J., Nielsen, H. F., Karmarkar, A., et
al. (2007). SOAP Version 1.2 Part 1: Messaging Framework (Standard
Specification))
The Hadoop Project. (2008, 01/29/2009). Retrieved 02/21/2009, 2009, from
http://hadoop.apache.org/core/
Hedges, M., Hasan, A., & Blanke, T. (2007, 10 December 2007). Curation and
Preservation of Research Data in an iRODS Data Grid. Paper presented at the
Third IEEE International Conference on e-Science and Grid Computing.
Holliday, G. L., Murray-Rust, P., & Rzepa, H. S. (2006). Chemical markup, XML, and
the world wide web. 6. CMLReact, an XML vocabulary for chemical reactions.
Journal of chemical information and modeling, 46, 145-157.
Holliday, J. R., Chen, C.-c., Tiampo, K. F., Rundle, J. B., Turcotte, D. L., & Donnellan,
A. (2005). A RELM Earthquake Forecast Based on Pattern Informatics. Paper
presented at the American Geophysical Union (AGU) - fall meeting. from
http://www.relm.org/Holliday.pdf
ISO. (2008). International Standards Organization Retrieved 03/27/2008, 2008, from
http://www.isotc211.org/
IVOA. (2004). International Virtual Observatory Alliance Retrieved 12/23/2007, 2007,
from http://www.ivoa.net/
JAG. (1999). Joint Advisory Group Retrieved 03/27/2008, from
http://www.isotc211.org/organizn.htm#jag
JMF. (2008). Java Media Framework Retrieved 09/01/2008, 2008
Page 216
202
Kale, S., Navelkar, A., Hegde, H., Kembhavi, A., & Kulkarni, P. (2004). VOPlot: A
Toolkit for Scientific Discovery using VOTables. Astronomical Data Analysis
Software and Systems 314, 350.
Kesteren, A. v. (2008). The XMLHttpRequest Object (W3C Working Draft No. WD-
XMLHttpRequest-20080415): W3C)
Khare, B. R., & Taylor, R. N. (2004, May 2004). Extending the Representational State
Transfer (REST) Architectural Style for Decentralized Systems. Paper presented
at the 26th International Conference on Software Engineering (ICSE'04),
Edinburgh, Scotland.
Kirkpatrick, P., & Ellis, C. (2004). Chemical Space. Nature, 432, 823–865.
Kirtland, M. (2001). A Platform for Web Services (Tech Report): Microsoft)
Kolodziej, K. (2004). OpenGIS Web Map Server Cookbook (Implementation
Specification No. 03-050r1): Open Geospatial Consortium Inc. (OGC))
Koontz, L. D. (2003). Geographic Information Systems: Challenges to Effective Data
Sharing (No. GAO-03-874T). Washington, DC)
Kreger, H. (2001). Web Services Conceptual Architecture (WSCA 1.0): IBM)
LAITS. (2008). Retrieved 03/19/2008, 2008, from http://grid.laits.gmu.edu
LANL. (2007). Los Alamos National Laboratories Retrieved 08/23/2008, 2008, from
http://www.lanl.gov/
Page 217
203
Lansing, J. (2002). OWS1 Coverage Portrayal Service (CPS) (Interoperability Program
Report-Engineering Specification No. 2002-02-29): Open Geospatial Consortium
(OGC))
Little, M., Newcomer, E., & Pavlik, G. (2007). Web Services Context Specification (WS-
Context), Version 1.0 (Standard Specifications): Organization for the
Advancement of Structured Information Standards (OASIS))
Lu, W., Chiu, K., & Pan, Y. (2006). A Parallel Approach to XML Parsing. Paper
presented at the 7th International Conference on Grid Computing, Barcelona,
Spain.
Ludäscher, B., Altintas, I., Berkley, C., Higgins, D., Jaeger, E., Jones, M., et al. (2006).
Scientific Workflow Management and the Kepler System. Concurrency and
Computation: Practice and Experience, 18(10), 1039-1065.
MCAT. (1998, May 11, 1998). Retrieved 02/20/2009, 2009, from
http://www.sdsc.edu/srb/index.php/MCAT
Means, S., & Bodie, M. (2001). The Book of SAX: The Simple API for XML San
Francisco: Starch Press.
Melamed, R., & Keidar, I. (2004, 09/01/2004). A scalable reliable multicast system for
dynamic environments Paper presented at the Network Computing and
Applications (NCA).
Meyer, E. A. (2006). CSS: The Definitive Guide, Third Edition (3rd ed.).
Meyer, T. W., Davidson, J. W., Resnick, I. G., III, R. C. G., Bush, B. W., Unal, C., et al.
(2003). The Los Alamos Center for Homeland Security. Los Alamos Science, 28.
Page 218
204
Mitchell, A. L., Divoli, A., Kim, J.-H., Hilario, M., Selimas, I., & Attwood, T. K. (2005).
METIS: multiple extraction techniques for informative sentences. Bioinformatics,
21(22), 4196-4197.
Mitchell, T. (2005, 08/10/2005). Build AJAX-Based Web Maps Using ka-Map. O'Reilly
xml.com.
Nanjo, K. Z., Holliday, J. R., Chen, C.-c., Rundle, J. B., & Turcotte, D. L. (2006).
Application of a modified pattern informatics method to forecasting the locations
of future large earthquakes in the central Japan. Tectonophysics, 424, 351-366.
Newcomer, E., & Lomow, G. (2005). Understanding SOA with Web Services: Addison
Wesley.
Novotny, J., Russell, M., & Wehrens, O. (2004, 08/31/2004). GridSphere: An Advanced
Portal Framework. Paper presented at the 30th EUROMICRO Conference.
Ochsenbein, F. (2008). VOTable Format Definition (No. Version 1.20): International
Virtual Observatory Alliance)
OGC. (1994, 06/12/2008). The Open Geospatial Consortium, Inc Retrieved 02/14/2008,
from http://www.opengeospatial.org/
OGC Schema. (2008). Retrieved 09/14/2008, 2008, from http://schemas.opengis.net/
OnEarth. (2007, 12/08/2007). Retrieved 03/15/2008, from http://onearth.jpl.nasa.gov
Pallickara, S., & Fox, G. (2003). NaradaBrokering: A Distributed Middleware
Framework and Architecture for Enabling Durable Peer-to-Peer Grids. Paper
presented at the ACM/IFIP/USENIX. from
http://grids.ucs.indiana.edu/ptliupages/publications/NB-Framework.pdf
Page 219
205
Peng, Z.-R., & Tsou, M.-H. (2003). Internet GIS: Distributed Geographic Information
Services for the Internet and Wireless Networks. New Jersey, USA: John Wiley &
Sons.
Pfister, G. F. (1998). In Search of Clusters. Upper Saddle River, NJ, USA Prentice-Hall,
Inc.
Plale, B., Gannon, D., Brotzge, J., Droegemeier, K., Kurose, J., McLaughlin, D., et al.
(2006). CASA and LEAD: Adaptive Cyberinfrastructure for Real-Time
Multiscale Weather Forecasting. IEEE Computer, 39(11), 56-64.
Plale, B., Ramachandran, R., & Tanner, S. (2006, January 2006). Data Management
Support for Adaptive Analysis and Prediction of the Atmosphere in LEAD. Paper
presented at the 22nd Conference on Interactive Information Processing Systems
for Meteorology, Oceanography, and Hydrology (IIPS), Entebbe, Uganda.
Polychronpouos, C. D., & Kuck, D. J. (1987). Guided self-scheduling: A practical
scheduling scheme for parallel supercomputers. IEEE Transactions on Computers,
36(12), 1425 - 1439
Purger, N., Budav´ari, T. a., Szalay, A. S., Thakar, A., & Csabai1, I. a. (2004). Build
Your Own SkyNode! Astronomical Data Analysis Software and Systems, 314(2),
201.
Rabiner, L. R. (1989). A Tutorial on Hidden Markov Models and Selected Applications
in Speech Recognition. IEEE, 77(2), 257-286.
Rajasekar, A., Wan, M., & Moore, R. (2002, July 24, 2002). MySRB & SRB:
Components of a Data Grid. Paper presented at the Proceedings of the 11th IEEE
Page 220
206
International Symposium on High Performance Distributed Computing,
Washington.
Ramamurthy, M. K., & Droegemeier, K. K. (2008). Linked Environments for
Atmospheric Discovery (LEAD): A Cyberinfrastructure for Mesoscale
Meteorology Research and Education. Geophysical Research Abstracts, 10.
Rao, A., Percivall, G. S., & Enloe, Y. (2000, 07/27/2000). Overview of the OGC catalog
interface specification. Paper presented at the International Geoscience and
Remote Sensing Symposium IGARSS'00.
Redmond, F. E. (1997). Dcom: Microsoft Distributed Component Object Model with
Cdrom (1st edition ed.). Foster City, USA: IDG Books Worldwide, Inc.
Rew, R. K., & Davis, G. P. (1990, February 1990). The Unidata netCDF: Software for
Scientific Data Access. Paper presented at the Sixth International Conference on
Interactive Information and Processing Systems for Meteorology, Oceanography,
and Hydrology, Anaheim, CA, USA.
RMI [Electronic. (2004). Version]. Java Remote Method Invocation Specification.
Retrieved June 2008, from http://java.sun.com/j2se/1.4.2/docs/guide/rmi/
Rundle, J. B., Klein, W., Martins, J., Tiampo, K. F., Donnellan, A., & Kellogg, L. H.
(2002). GEM plate boundary simulations for the Plate Boundary Observatory:
Understanding the physics of earthquakes on complex fault systems. Pure and
Appl. Geophysics, 159(10), 2357-2381.
Page 221
207
Rundle, J. B., Turcotte, D. L., Shcherbakov, R., Klein, W., & Sammis, C. (2003).
Statistical physics approach to understanding the multiscale dynamics of
earthquake fault systems. Geophysics, 41(4).
Sayar, A., Pierce, M., & Fox, G. (2005a). Developing GIS Visualization Web Services
for Geophysical Applications. Paper presented at the ISPRS Spatial Data Mining
Workshop from
http://grids.ucs.indiana.edu/ptliupages/publications/isprs_asayar.pdf
Sayar, A., Pierce, M., & Fox, G. (2005b). OGC Compatible Geographical Information
Services (Tecchnical Report No. TR610). Bloomington: Indiana University)
Sayar, A., Pierce, M., & Fox, G. (2006). Integrating AJAX Approach into GIS
Visualization Web Services. Paper presented at the IEEE, International
Conference on Internet and Web Applications and Services, ICIW'06.
Serrano, N., & Aroztegi, J. P. (2007). Ajax Frameworks in Interactive Web Apps. IEEE
Software, 24(5), 12-14.
Shuen, A. (2008). Web 2.0: A Strategy Guide (First Edition ed.). Sebastopol, CA:
O'Reilly Media Inc.
Siegel, J. (1996). CORBA 3. Fundamentals and Programming (Omg): Verlag John Wiley
& Sons.
Slominski, A. (2005, 03/22/2005). XML Pull Parser (Xpp). Retrieved 02/19/2008, from
http://www.extreme.indiana.edu/xgws/xsoap/xpp/xpp2/index.html
Sonnet, J. (2005). Web Map Context Documents (WMC) (Standard specs No. 05-005):
Open Geospatial Consortium Inc. (OGC))
Page 222
208
Sosnoski, D. (2001). XML and Java technologies: A look at features and performance of
XML document models in Java: IBM)
Tanenbaum, A. S. (2008). Modern Operating Systems (Third ed.). NJ, USA: Pearson
Prentice Hall.
Tiampo, K. F., Rundle, J. B., Mcginnis, S. A., Gross, S., & Klein, W. (2002).
Eigenpatterns in southern California seismicity. Journal of Geophysical Research,
107(B12), 2354.
Tiampo, K. F., Rundle, J. B., Mcginnis, S. A., & Klein, W. (2002). Pattern Dynamics and
Forecast Methods in Seismically Active Regions Pure and Applied Geophysics,
159(10), 2429-2467.
Tran, P., Greenfield, P., & Gorton, I. (2002). Behavior and performance of message-
oriented middleware systems. Paper presented at the International Conference on
Distributed Computing Systems Workshops, ICDCSW.
Turi, D., Missier, P., Goble, C., Roure, D. D., & Oinn, T. (2007). Taverna Workflows:
Syntax and Semantics Paper presented at the 3rd IEEE International Conference
on e-Science and Grid Computing (e-Science'07), Bangalore, India.
USGS. (2008). United States Geological Surveys Retrieved 09/12/2008, 2008, from
http://www.usgs.gov/
Vretanos, P. A. (2001). Filter Encoding Version 1.0.0 (Implementation Specification No.
01-067): Open Geospatial Consortium Inc. (ogc))
Vretanos, P. A. (2002). Web Feature Service Implementation Specification (Reference
Document No. 02-058))
Page 223
209
Wells, D., Greisen, E., & Harten, R. (1981). FITS - a Flexible Image Transport System.
Astronomy and Astrophysics Supplement Series, 46, 363.
Williams, R., Ochsenbein, F., Davenhall, C., Durand, D., Fernique, P., Giaretta, D., et al.
(2002). VOTable: A Proposed XML Format for Astronomical Tables (Standard
Specification): US National Virtual Observatory)
WS-I. (2002). Web Service Interoperability Retrieved 03/23/2008, 2008, from
http://www.ws-i.org/
XSL. (1999). Retrieved 01/25/2008, 2008, from http://www.w3.org/Style/XSL/
Yasuda, N., Mizumoto, Y., Ohishi, M., O‟Mullane, W., Budav´ari, T. a., Haridas, V., et
al. (2004). Astronomical Data Query Language: Simple Query Protocol for the
Virtual Observatory. Paper presented at the Astronomical Data Analysis Software
and Systems XIII. ASP Conference Series, ASP Conf. Series. from
http://www.adass.org/adass/proceedings/adass03/reprints/P3-10.pdf
Youn, C., Baru, C., Bhatia, K., Chandra, S., Lin, K., Memon, A., et al. (2007).
GEONGrid portal: design and implementations. Concurrency and Computation:
Practice & Experience 19(12), 1597 - 1607.
Zaslavsky, I., & Memon, A. (2004, August 2004). GEON: Assembling Maps on Demand
from Heterogeneous Grid Sources. Paper presented at the International ESRI
Users Conference, San Diego, CA.
Page 224
210
Glossary
ASFS (Application Specific Feature Service) is the correspondence of Web Feature
Service (WFS) in ASIS.
ASIS (Application Specific Information Service): Abstracted GIS for general science
domain
ASL (Application Specific Language): Domain specific language. It is the
correspondence of GML in ASIS.
ASVS (Application Specific visualization Service): is the correspondence of Web Map
Service (WMS) in ASIS.
Bbox (Bounding box) (OGC-defined): is a geo-data attribute to define 2-dimensional
ranges in rectangular shapes (minx,miny maxx,maxy).
Capability metadata: is a metadata about the data and services together. It includes
information about the data and corresponding operations with the attribute-based
constraints and acceptable request/response formats.
COM (Common Object Model): Microsoft's windows object model, which is being
extended to distributed systems and multi-tiered architectures.
CORBA (Common Object Request Broker Architecture): An approach to cross-platform,
cross-language distributed objects developed by a broad industrial group, the
OMG. CORBA specifies basic services (such as naming, trading, persistence)
and the protocol IIOP used by communicating ORBS.
CPS (Coverage Portrayal Service): OGC-defined service standards enabling map display
of coverage data provided by WCS (Web Coverage Services).
Page 225
211
CSS (Cascading Style Sheet) is a stylesheet language used to describe the presentation of
a document written in a markup language
DCOM (Distributed Component Object Model) is a Microsoft proprietary technology for
software components distributed across several networked computers to
communicate with each other.
GIS (Geographic Information Systems) is an information system for capturing, storing,
analyzing, managing and presenting data which are spatially referenced.
GML (Geographic Markup Language) is the XML grammar defined by OGC to express
geographical features. GML serves as a modeling language for geographic
systems as well as an open interchange format for geographic transactions on the
Internet.
HTTP (Hyper Text Transport Protocol): A stateless transport protocol allowing control
information and data to be transmitted between web clients and servers.
JPEG (Joint Photographic Expert Group) is an image file format. It is also a commonly
used method of compression for photographic images
JSP (Java Server Pages) may be viewed as a high-level abstraction of servlets and allows
software developers to dynamically generate HTML, XML or other types of
documents in response to a Web client request
NASA (National Aeronautics and Space Administration) is an agency of United States
government, responsible for the nation‟s public space program.
OGC (Open Geospatial Consortium) is a non-profit, international, voluntary consensus
standards organization that is leading the development of standards for geospatial
and location based services.
Page 226
212
PI (Pattern Informatics) is an earthquake Geo-science application developed at UC-
Davis. It defines method using observational data to identify the existence of
correlated regions of seismicity.
SOA (Service Oriented Architecture) A Service-oriented Architecture is essentially a
collection of services. These services communicate with each other. The
communication can involve either simple data passing or it could involve two or
more services coordinating some activity. Some means of connecting services to
each other is needed.
SOAP (Simple Object Access Protocol) SOAP is a lightweight protocol for exchange of
information between Web Services in a decentralized, distributed environment. It
is an XML based protocol that consists of three parts: an envelope, a set of
encoding rules for expressing instances of application-defined data types, and a
convention for representing remote procedure calls and responses.
SVG (Scalable Vector Graphics) is an XML specification and file format for describing
two-dimensional vector graphics, both static and animated.
UDDI (Universal Description Discovery and Integration) is a platform-independent,
XML-based registry. It is an open industry initiative, sponsored by OASIS,
enabling businesses to publish service listings and discover each other and define
how the services or software applications interact over the Internet
VC (Virtual California) is a Geo-science application. It is an earthquake simulation
model for the California. The simulation takes into account the gradual movement
of faults and their interaction with each other
Page 227
213
Web Services: A Web Service is a software system identified by a URI, whose public
interfaces and bindings are defined and described using XML. Its definition can
be discovered by other software systems. These systems may then interact with
the Web Service in a manner prescribed by its definition, using XML based
messages conveyed by Internet protocols.”
WFS (Web Feature Service) provides an interface allowing requests for geographical
features (geo-data) across the web using platform-independent calls.
WSDL (Web Service Description Language) is an XML-based language that provides a
model for describing Web Services.
XML (Extensible Markup Language): A W3C-proposed recommendation. Like HTML,
XML is based on SGML, an International Standard (ISO 8879) for creating
markup languages.
XPP (XML Pull Parser) is a way of parsing/manipulating XML documents. XML Pull
Parsing refers to the process of parsing XML as a stream rather than building a
tree (DOM) or pushing events out to client code (SAX).
XSL (Extensible Stylesheet Language) is a family of recommendations for defining
XML document transformation and presentation. It consists of three parts. These
are XSLT, XPath and XSL-FO.
XSLT (XSL Transformations) is a language for transforming XML
XPath (XML Path Language) is an expression language used by XSLT to access or refer
to parts of an XML document.
Page 228
214
WMS (Web Map Service) (OGC-defined): Produces maps of spatially referenced data
dynamically from geographic information. This international standard defines a
„map” to be a portrayal of geographic information as a digital image file suitable
for display on a computer screen
WS-I (Web Service Interoperability Organization) is an open industry organization
chartered to establish practices for Web Services interoperability, for selected
groups of Web Services standards, across platforms, operating systems and
programming languages.
Page 229
Vitae
Name of Author: Ahmet Sayar
Date of Birth: July 2, 1973
Place of Birth Golcuk, TURKEY
Degrees Awarded:
January 2009 Ph.D. in Computer Science,
Indiana University
Bloomington, IN, U.S.A
July 2001 M.S. in Computer & Information Science
Syracuse University
Syracuse, NY, U.S.A
July 1997 B.S. in Management Engineering
Istanbul Technical University
Istanbul, TURKEY