Page 1
1
High Performance Work Systems, Industrial Relations
and
Pay Settings in Europe.
Carlo Dell’Aringa*
Paolo Ghinetti*#
Claudio Lucifora*
*: Istituto di Economia dell´Impresa e del Lavoro
Università Cattolica del S. Cuore, Milano
#: corresponding author ([email protected] or [email protected] )
Page 2
2
High Performance Work Systems, Industrial
Relations and Pay Settings in Europe
Abstract
The present study uses data for ten European countries to investigate the
characteristics of new regimes of work organisation and system of remuneration.
In the first part we briefly outline the characteristics of the firms adopting new
work practices and the main features of employees’ direct participation schemes
as well as their relationships with the traditional industrial relations system. The
second part describes innovations that are taking place in payment systems and
their determinants. We find that flexible pay schemes are more likely to be
introduced where new work practices are in place, but the effect depends on the
scheme considered. The pressure of workers representatives in establishment
where unions are powerful is found to reduce the likelihood of flexible pay, while
the effect of direct participation on its own is negligible.
Page 3
3
1. Introduction
In recent years, a growing body of literature has been concerned with the
analysis of the characteristics of “high involvement” and “high performance”
work systems and of their impacts on firm’s performance, wage structure and
labour costs. The argument behind this area of research has been twofold: on the
one side, the recognition that rigid and vertically integrated organisation of work
are no longer compatible with globalised and more competitive markets, which
demand to compete on the basis of quality, innovation and customisation and, as a
consequence, require more flexible arrangements both of production and work; on
the other side, the focus has been on the consequences of the use of new
technologies which requires a more flexible and skilled workforce (Brjsholfsoon
& Hitt, 1995 and 1998). In this context, firms became progressively horizontally
integrated, with less hierarchical levels and more connections between different
task and functions (Caroli et al., 1999; Lindbeck & Snower, 1996a and 1996b).
The importance of these changes in the organisation of work for the
improvement of employment performance and working conditions has been also
recognised by the European Union. In 1997 the EU published the “Green Paper –
Parthership for a new Organisation of Work”, with the aim to “stimulate a
European debate on new forms of organisation of work”, which is recognised to
be a “demanding change”, and on its relationships with the industrial relation
context and with the firm environment.
While there is no single interpretation of the term “new organisation of work”,
most industrial relations scholars (especially in the US) seem to stress the degree
to which workers participate in decisions related to their own work, thus
Page 4
4
increasing workers involvement and responsibility (Batt, 1999; Ichinowsky et al.,
1997; Osterman, 1994 and 2000). Individual specialised work has been
progressively substituted by collective work team and worker’s involvement
groups functions.
Following the Green Paper, the firms adopting those innovative work systems that
Osterman (1994 and 2000) called the “High Performance Work Organisations”
(HPWO) are characterised by “a shift from fixed systems of production to a
flexible process of organisational development […] based on a more productive,
participative and learning organisation of work. This new concept of a process
leading to a better organisation of work at the workplace is described as the
“flexible firm”. This transformation can be explained by three factors,
representing change: human resources, markets, and technology ” (Green Paper,
1997).
For what directly concerns human resources the Green Paper states that:
“The new flexible firm is a demanding form of work organisation. That goes for
the introduction of a new work organisation and the development of IR”.
With regard to the core characteristics of the new work organisation, the
Green Paper underlines that “workers perform a variety of tasks, rather than pass
the job on from one to another. The skill structure is changing: good skills (higher
and broader) in numeracy and literacy, the ability to interact with computers are
becoming more and more important ”.
With reference to the IR system, “IR will require, in a new organisation of
work, to be built on a basis of co-operation […] and new forms of IR have to be
developed, including greater participation by employees, since efficient
production requires enhanced levels of both trust and commitment in firms.”
Page 5
5
With only few exceptions1, little work has been done to understand how
the industrial relation setting interacts with the new system of work organisation
and how pay determination within firms is likely to be affected.
As discussed in the Green Paper, it is important to understand “how to
change wage systems along to the organisational structures on which they are
based”2. Reconciling work requirements and pay represent an important policy
challenge because “is a critical issue on which social partners have to face up”
(see also Kessler, 1995 on this point).
The term “pay systems” refers here to the methods used to pay employees.
In contrast to the “old” pay systems, incorporating job-evaluated grade structures,
payments by time and seniority, the concept of “new” pay is based on the notion
of a “fit” between rewards and the strategy of the firm leading to a greater
individualisation of wage, by which rewards are more based on skill,
competencies and productivity (Metcalf, 1993). In this context, wages can vary by
skills and according to the performance of employees.
Anecdotal evidence suggests that innovative firms have experienced
significant changes in wage determination, yet little is known to the relationship
between the use of new forms of work organisation and the implementation of
more flexible and performance-based pay policies.
The present study aims at describing and investigating the characteristics
of high-performance work practices and flexible pay methods.
Its focus is on the analysis of the determinants of new regimes of work
organisation and system of remuneration. In order to provide an empirical support
to the thesis outlined in the Green Paper, we shall scrutinise how and how much
payment systems are changing in Europe, what innovations are taking place and
Page 6
6
whether a single firm pay policies are determined by any particular features of
both work organisation and institutional setting, as well as looking at the effects of
different levels of workers participation and representation on pay flexibility.
The paper is organised as follows. In section 2 we briefly describe the
structure and main features of the data used. Section 3 discusses the descriptive
evidence on the diffusion of flexible pay systems, on the adoption of new work
arrangements and on their interactions. Section 4 analyses in more detail the
determinants of the adoption of flexible wage structure and presents the main
results of the econometric analysis. The last section concludes.
2. The Epoc Survey
The data used in this study is the EPOC (Employee direct Participation in
Organisational Change) survey carried out by the European Foundation for the
Improvement of Living and Working Conditions in 1996.
It covers workplaces with more than 20 employees in non-agricultural
sectors in ten EU countries, namely Denmark, France, Germany, Ireland, Italy, the
Netherlands, Portugal, Spain, Sweden and UK.
The survey was administered to general managers who were asked to
answer questions concerning the establishment for which they were responsible.
In larger countries (Fra, Ger, Ita, Spa, UK) the gross sample covers 5,000
workplaces while it is 2,500 in medium countries (Den, Neth, Swe) and 1,000 in
the smaller ones (Irl, Port).
Page 7
7
As the main focus of the EPOC is on employer characteristics, it covers a
wide range of personnel management and industrial relations (IR) features. It
provides a vast amount of information concerning employee representation,
unions presence and union behaviour, the existence of collective agreements, and
schemes for direct employee participation. On the remuneration and work
organisation side, information are available on pay systems (like the presence of
bonus schemes, pay for skill, pay for productivity of profit sharing) and in work
practices (job rotation, team work, multitasking, flattening in organisational
structure) and adoption of innovative technologies (ICT). In addition to IR and
human resource management variables, the survey provides additional controls for
firm size, sector, skill intensity, training, firm’s market structure (profit/noprofit,
independent/owned), degree of competition3.
Table 1 reports the composition of the sample (by country) by the number
of establishment sampled (for which was returned a valid questionnaire) and using
country weights by employment shares.
The first two columns of Table 1 report the composition of gross sample (of
establishments) by country, whilst in the last column we report the result of
multiplying the original percentage of workplaces with the weighting factor. It can
be seen that, from the original population, some countries are over represented,
other are under represented. For these reasons weights are always used in the
empirical analys is.
3. Flexible pay systems and High Performance Work Organisation: some
aggregate evidence
Page 8
8
The role of new work practices and new IR in stimulating changes in the
firm’s wage systems is taken in great consideration by the Green Paper. In
particular, it asks:
- to further analyse which firms experienced these changes in payments systems
and
- if these innovations are taking place by means of IR and changes in work
organisation.
From a theoretical point of view, Lindbeck & Snower (1996b) showed that in
presence of organisational changes, like multitasking and job rotation, a fix grid of
wages resulting from centralised bargaining becomes increasingly inefficient
since it “prevents firms from offering their employees to the incentives to perform
the appropriate mix of tasks”.
In the following part of this section we will try to shed light on the intensity of
these phenomena and on the relationships existing between them. First of all, we
will investigate which are the characteristics of the “High Performance Work
Organisation” and whether, as several studies seem to suggest, changes in the
organisation of work are adopted jointly in clusters (Milgrom & Roberts, 1990).
Then, we will analyse the main features of employees’ direct participation
schemes and the relationships of these schemes with the more traditional
industrial relations system based on representative bodies. At the end of the
section we will analyse how and how much new work arrangements, direct
participation and traditional industrial relations interact with the adoption of
flexible pay schemes and which is the significance of these relationships.
Page 9
9
3.1. New work organisation practices: patterns of adoption
For what concerns the set of new work arrangements, it is difficult to find
variables and indicators that describe in a single way the variety and complexity
of practices effectively implemented, as well as being “highly informative” of
firm’s conditions (Snower, 1999). The EPOC Survey contains a rich set of
information about the use of these practices, including those commonly used in
recent empirical studies analysing the characteristics of HPWO and the
consequence of their use on firm’s performance (Black & Lynch, 1997 and 2000;
Cappelli & Neumark, 2001; Osterman, 1994, 2000). In particular, the survey
specifically asked to state which of the following practices were adopted at the
establishment :
− flat structure of management (flat_str)
− presence of work teams (teams)
− job rotation of workers across different tasks (job_rot)
− high levels of work involvement in different task (multitask)
The analysis of work organisation issues presents a number of limitation as
sectoral composition, firm size, the degree of unionisation, and also further
unobservable characteristics are likely to affect the aggregate results. In table 2 we
present patterns of adoption by sector and by size. The values in the first four
columns are the percentages of establishments adopting the related practice. In the
last row, we present the mean value, which is the percentage of establishments
adopting the practice in the whole sample. In the last column, we report the value
Page 10
10
of an index that we have created in order to capture the “intensity” in the use of
these new work arrangements (int_wp). The index is obtained as the sum of the
number of practices implemented, and, then, its value ranges from 0 to 4.
The sectors considered are:
- Manufacturing,
- transport&communications,
- Construction,
- Wholesale&trade,
- Bank&insurance,
- Professional services,
- other services,
- public sector4
while firm size ranges from 20-50 to over 1000.
For what concerns their overall diffusion, the mostly adopted practices are
multitasking (64 percent of establishments adopting it), the flattening of
hierarchical structure (33 percent) and the use of teams (28 percent). Less
common is the introduction of job rotation (12 percent). The mean value of the
index measuring the intensity of adoption is 1.35, and this means that, at least at
an aggregate level, the evidence doesn’t seem to suggest the existence of clus ters
in the adoption of these practices.
Looking at the influence of firm size on the proportion of firms adopting
the set of new work practices, table 2 shows that, with the exception of
multitasking (and, by some extent, of work team), there is a clear size-effect in
favour of large firms both in the percentage and in the intensity of adoption of
practices.
Page 11
11
On inspection of Table 2, it appears that the diffusion of flat managerial
structures is evenly distributed across sectors. Job rotation is more likely to be
introduced in the manufacturing sector, where also the use of work teams plays a
role. Construction seems to be less influenced by organisational changes.
Wholesale&trade and private services (in general) shows intensities close to the
average. However, while job rotation is poorly adopted among professionals, the
opposite its true in the “other services”. Public sector reforms designed to
introduce additional degrees of flexibility and to foster productivity generated
significant changes in the organisation of work, especially in the form of work
teams (32 percent) and multitasking (71 percent)5. The last column of table 2
(where is reported the intensity of adoption) reveals that the existence of clusters
in the implementation of new work practices doesn’t seem to be a crucial feature
in any sector, in particular for construction, communication and wholesale&trade,
where the index ranges from 1.15 to 1.27 only.
Looking at the percentage of establishments by number of practices
adopted, table 3 shows that, on average, 17 percent of workplaces don’t use
innovative forms of work organisation while 40 percent only one 6. Two practices
are adopted by 27 of firms and three only by 13. Only 3 percent adopt the whole
set of practices. Again, the “cluster hypothesis” doesn’t seem to be fully supported
by this evidence. In addition, great differences emerge between sectors. For
example, the manufacturing sector shows a sort of “polarisation”.
Wholesale&trade, the public sector and construction are at an intermediate
position (but the latter performs better at the higher levels of adoption’s intensity),
while Transport&communication shows percentages above the mean in the lowest
classes (0 and 1).
Page 12
12
3.2. Direct Participation and the industrial relations context
As discussed at the beginning of this section, the Green Paper states that
employees’ direct participation (DP) is the complement of new work organisation
in the management of human resources in the so-called “flexible firm”.
The EPOC Survey underlines the existence of two types of DP: consultative and
delegative. In the first one, workers (individually or in groups) are asked to report
their opinions on a range of issues on which they are regularly consulted by the
managers. In the second one, workers (individually or as a group) can make
decisions concerning how their own work is performed without reference to
managers. Therefore, four different forms of direct participation are recognised:
individual and/or group consultation; individual and/or group delegation.
Direct participation is commonly diffused in each country (the percentages
of implementation are above 50 percent for each form of DP) and consultation is
more likely to occur than delegation. Almost 50 percent of workplaces adopt
simultaneously the whole set (4) of forms of DP, while only 5 percent don’t use
any form (0)7.
Differently from other studies (for example Bordogna & Pedersini, 2001)
sector affiliation and firm size don’t seem to affect in any relevant way the
percentage of DP initiatives implemented.
The EPOC survey also allows to analyse in more detail the relationships
between “advanced” industrial relation practices (based on consultation and
involvement of employees on decision-making) and the “traditional” IR systems
(based on collectivism and representative bodies).
Page 13
13
A priori it is not clear whether worker representatives favour or oppose the
introduction of new work practices and DP. On the one side, it could be possible
that participation is more likely where representation is not, both because the first
could make up for the absence of the second, and because unions in general
oppose the introduction of a direct link between managers and workers (where
discussing problems related to working conditions). On the other side, DP could
be considered a complement of union action, in the light of an increase of the
employees “control” on their working conditions.
Four different forms of employee representation (ER) are considered: The
first three are the existence of union representatives, of representatives elected to a
work council and of representatives to an advisory committee established by
managers. The fourth is whether the establishment is covered by a collective
agreement, as in pluralistic industrial relations systems is also important to take
into consideration the effectiveness of the representation. Bringing together these
four dimensions of collective representation, we created an index for the intensity
of IR (int_ir)8 also ranging from 0 to 4. A similar index (int_dp, i. e. intensity of
adoption of DP) has been calculated adding, for each establishment, the number of
direct participation schemes adopted. Using the values of these two indexes, Table
4 shows the relationships between the number of forms of collective
representation and the number of forms direct participation implemented (each
value is the percentage of establishments in each cell).
High levels of DP are more likely to occur where the intensity of
traditional IR is higher. This evidence is in line with the results of Freeman &
Lazear (1995), who show that both local unions and, especially, work councils
have an incentive to create more co-operative labour relations, since by improving
Page 14
14
communications between workers and managers, (by assuming that firms use
worker-provided information to benefit labour as well as the firm) an
improvement of social output results.
Therefore, the observed pattern of IR doesn’t seem to impede the
introduction of DP, which is more likely to be introduced in establishments where
the industrial relations context is more developed and articulated.
Still, it should be recognised that this descriptive evidence impede to
ascertain whether this double presence means: a conflict between the two
dimensions, simple co-existence or the development of a co-operative approach to
reform the IR system between firms, employees and their traditional
representatives9.
3.3. Flexible pay schemes, industrial relations and work organisation
The EPOC Survey provides detailed information on firm’s pay policies.
Respondents are asked to answer about the adoption of six flexible pay practices.
These are:
- pay for skill (skill_pay)
- bonuses related to workers attitude (bonus)
- pay for individual output (ind_out)
- pay for team output (team_out)
- profit-sharing (prof_share)
- share of ownership (share_own)
In the literature, very different forms of individualisation of pay are often
analysed jointly. Here, we separate out traditional methods (bonuses, pay for skill)
Page 15
15
from more innovative methods (profit sharing, share of ownership, pay for
individual output, pay for team output). Traditional methods group those schemes
which convey a greater individualisation of pay, while innovative methods group
those schemes in which the payment is conditioned by the results (Bonatti, 2001).
Within the innovative methods, we can further distinguish between forms of
financial participation (profit sharing and share of ownership) and productivity-
related pay (pay for individual output and pay for team output)10.
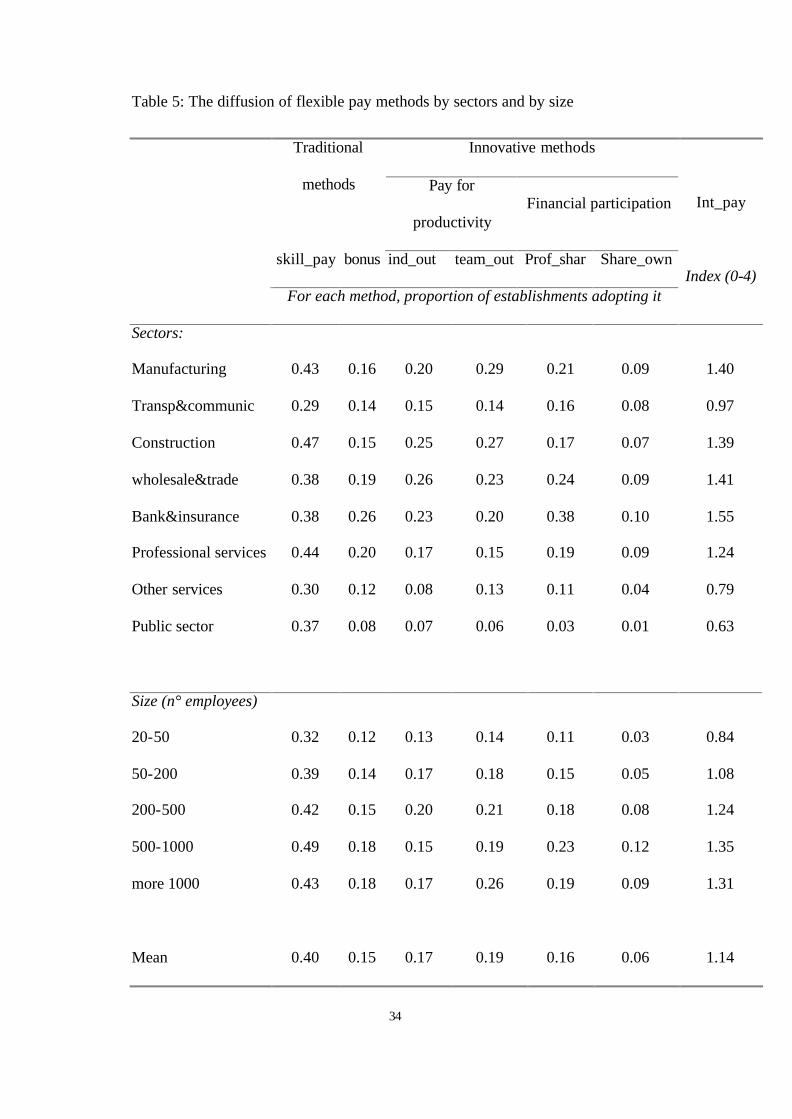
The descriptive evidence concerning the adoption of flexible pay schemes
is summarised in table 5. In the first six columns we report the percentages of
establishments adopting the corresponding pay practice. For a comparison, the last
row reports the mean value, i. e. the percentage of establishments using each
scheme in the whole sample. In the last column we look at the intensity of
adoption of flexible pay methods. For this purpose, we construct a sort of index
(int_pay) obtained by summing up the number of schemes adopted by each
workplaces and re-arranging the scale (originally from 0 to 6) assigning the higher
value (4) to those firms adopting from 4 up to 6 schemes
Table 5 shows that, as in previous studies (Millward, 1994; Poole &
Jenkins, 1998), larger firms are more likely to adopt all schemes simultaneously
and, in particular, those that are more innovative. If we analyse the differences
between sectors, the picture however is rather mixed. In particular, it seems that
skill- intensive sectors (like bank&insurance and professional services) are more
likely to adopt the whole set of new pay schemes, while, there are other sectors
with more specific patterns: for example, in the manufacturing sector the
percentage of firms adopting flexible pay is above the average, but with the
exclusion of financial participation. In addition, there are sectors, like “Other
Page 16
16
services” and, by some extent, Transport&communications, where the
introduction of more flexibility in the determination of pay isn’t very diffused. For
what concerns the public sector, from one side, as noted by many authors (Elliot
& Duffus, 1996; Marsden & Richardson, 1994), there are many sign of increasing
convergence to the private sector, from the other side some normative restrictions
don’t allow the development of pay for performance and financial participation
schemes as in the private sector. Results from the last column shows that also the
intensity increase with the plant size and that the number of innovative methods is
higher in the finance and in the wholesale sector.
After analysing the patterns of adoption of new pay schemes, we
investigate the relationships between new forms of pay, new work practices and
industrial relations system.
We investigate these interactions by looking at coefficients of correlation between
the intensity of adoption of pay schemes (int_pay), of new work practices
(int_wp), of direct participation (int_dp) and traditional industrial relations
(int_ir). These are all indexes ranging from 0 to 4.
From the inspection of Table 6, which shows the sign and the level of significance
of the correlation, we observe that, differently from what is stated in the Green
Paper, DP doesn’t appear necessarily a strong complement of organisational
changes, as the coefficient is not statistically significant.
The relationship between the number of work practices in place and the
index measuring the intensity of adoption of flexible pay practices is positive and
statistically significant.
If we consider the relationships between the number of forms of DP and the
number of flexible pay schemes adopted, a number of studies (most recently
Page 17
17
Freeman et al., 2000; Conyon & Freeman, 2001), mainly for the UK, reported that
the probability to adopt variable pay and pay for performance schemes (especially
in the form of financial participation) increases when the workers directly
participate to the decision-making process or are consulted by the management on
work-related issues.
However, from table 6 we report that, at least at this aggregate level and
with these indexes, the adoption of pay practices does not depend to the number
of forms of DP used. Therefore, the existence of a positive relationships between
these two aspects does not emerge here.
Table 6 shows also that the “traditional” IR context has a negative and (by
some extent) significant relationship with number of pay practices adopted11. As a
consequence, it seems that firms reporting high levels of flexibility in wage
determination are more likely to have an “informal” system or IR12.
Conversely, we find that traditional industrial relations are positively related to
both new work practice and direct participation.
Summarising the results of the descriptive evidence, we could observe that the
relationships between new pay policies and both IR systems and work
organisations are not straightforward and does not always reflect the predictions
of the Green Paper. On the contrary, the picture seems rather mixed and
articulated. As a consequence, a further and more disaggregate investigation
seems to be appropriate to shed more light on these phenomena.
4. The determinants of flexible pay schemes
Page 18
18
We turn now to study the determinants of the pay policies introduced by the
so-called “flexible firm” (see section 2 for a definition), i. e. the firm adopting
HPWO.
For what concerns the dependent variable, we assume that it (called payflex) can
take values from zero to three according to these rules:
0 = no forms of pay flexibility (which has been used as the comparison
group).
1 = only traditional forms of pay flexibility (bonuses and/or pay-for-skill)
2 = presence of pay-for-productivity schemes (pay for individuals product
and/or pay for team product.) but not profit-related-pay schemes (profit
sharing and/or share of ownership).
3 = presence of profit-related-pay schemes (profit sharing and/or share of
ownership)13.
For what concerns the set of explanatory variables, the EPOC Survey provides
very detailed information on firm’s characteristics. In addition to controls for
country, sector and size, we can use also information on the firm’s structure and
the adoption of new technologies. For what concerns the market structure, we can
control for the ownership of the workplace (independent, domestic owner, foreign
owner), for the degree of competition (no competition, only domestic, domestic
and little foreign, both domestic and foreign), for the activity in the profit or in the
non-profit sector, and for the use of formal training. A dummy variable controls
for the introduction of ICT.
The set of HPWO practices contains five variables for new work organisation
(flattening in the structure of management, job rotation, multitasking and team
work and the intensity of adoption of new practices) and five for DP (individual
Page 19
19
consultation, group consultation, individual delegation, group delegation and the
intensity of DP).
The set of industrial relation variables is composed by six variables: presence
of trade union representatives, a work council, an advisory committee, union
density (continuous variable) and a dummy variable for coverage (that equals one
if the establishment is covered by a collective agreement).
Given that the dependent variable is categorical and discrete and that the
categories are unordered, to analyse the effects of our set of explanatory variables
(and especially of HPWO and IR) on pay policies we use a multinomial logistic
model, where cross-section data are obtained by pooling observations from
different countries. In addition, we use sample weights to control (as far as
possible) for sample distortions and (robust) estimates are clustered by country [i.
e. observations are not independent within a single cluster (country)].
For simplicity, we report only the result for the set of variables of interest.
Results are presented in table 7, col. (1), (3), (5)14.
Firm size plays a crucial role but only for the adoption of innovative pay
methods, and, as found by Poole & Jenkins (1998) for the UK and Bordogna &
Pedersini (2001) for Italy, there is virtually no size effect for traditional schemes.
The firm’s market structure matters only for innovative methods: in particular, the
probability to adopt these schemes increases along with the competitive pressure
(compet). Training and the use of ICT have a positive effect for the adoption of
the whole set of flexible pay schemes, and the effect is stronger when we move
from traditional to innovative methods.
Looking now more closely into the effect of IR and HPWO, the adoption of
bonus or pay for skill does not seem to be affected by the use of new work
Page 20
20
practices (only multitasking (mltask) matters in some way). Conversely, when we
consider innovative pay schemes, the probability to adopt pay-for-performance
increases when flat managers structures (flatstr), teams and, especially, job
rotation (jobrot) are in place. However, coefficients are not statistically significant
at the usual level of confidence. Multitasking shows a (weakly significant)
negative effect. This could reflect the fact that, when workers perform a great
variety of task, it is difficult to observe their output (productivity), so schemes
more related to individual characteristics or to participation at firm results may be
preferred.
The analysis of the determinants of financial participation shows positive and
significant coefficient s for flat management structures, and, especially, job
rotation and multitasking (with the higher value). The implementation of work
teams has a positive effect but the coefficient is not statistically significant.
We could then argue that, in general, the use of new work practices plays a role
especially in the adoption of innovative pay schemes15.
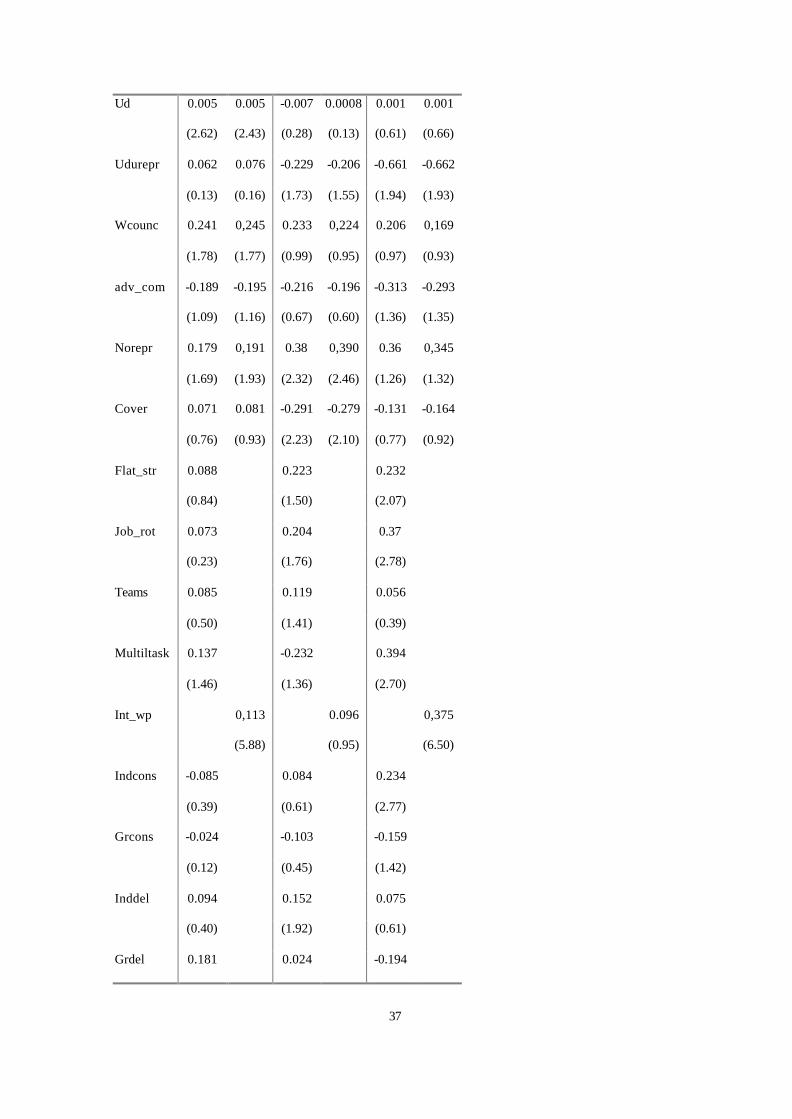
From the analysis of the influence of DP on pay flexibility, no clear
patterns emerges. Differently from many other (especially UK) studies (see
Conyon & Freeman (2001) for a review), we basically found no relationships
between direct participation and pay policies. On the opposite, Conyon &
Freeman (2001) results shows that this relationships is positive for the whole set
of innovative methods they consider(team-based performance-related pay,
individual-performance related pay, and profit-sharing) and particularly
significant for financial participation schemes. Moreover, the authors underline
that evidence of team based pay increasing the likelihood of firms us ing
consultation and information sharing is also consistent with the prediction of the
Page 21
21
incentive theory. Our results shows that, with specific reference to innovative pay
methods, when the coefficient is statistically significant, individual DP (incons
and indel) increases the probability of adoption. For what concerns group DP
(grcons and grdel), the effect is generally negative but never statistically
significant.
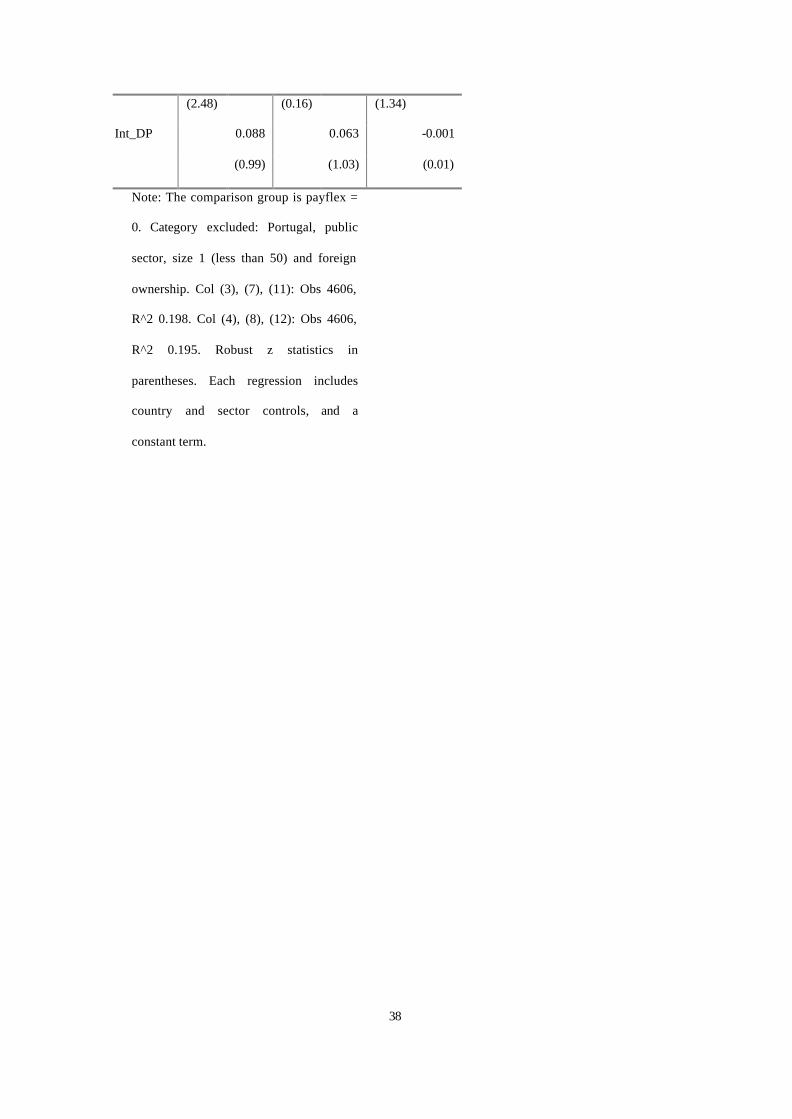
From the column (2), (4), e (6), where we introduce the variables that
capture the intensity of adoption of HPWO, we see that, while an increase in the
use of new work practices (Ind_wp) has a positive effect on flexible pay schemes,
there aren’t significant differences between firms using none as well as the whole
set of DP schemes (int_DP). Therefore, we can conclude that, differently from
what stated by the Green Paper, DP doesn’t play a crucial role (is not “strategic”)
in firm’s pay policies.
Interesting results emerge from the observation of IR variables. The
absence of employees representatives (norepr) has, as expected, a positive effect
on the probability to implement variable pay schemes, and the coefficient is
higher for innovative methods. At the same time, the presence of union
representatives (urepr) has a positive, and significant effect on the probability to
introduce variable pay schemes, even in the form of financial participation, and in
particular for what concerns the introduction of innovative pay schemes. So, in
principle, unions do not seem to oppose the introduction of degrees of flexibility
in the wage systems. However, when we interact the existence of union
representatives with the union density (udurepr), we obtain a negative coefficient
that, especially in the case of forms of financial participation, more than
compensate the effect of the former. In other words, union presence by itself does
not lower the probability of more flexibility in pay systems (at the opposite, the
Page 22
22
effect is positive and significant), still unions appear to be against flexible pay
schemes as bargaining power increases. Another form used by unions to express
opposition to innovation in wage systems has to do with collective contracts.
While there is no effect of coverage on traditional forms of flexibility, being
covered by a collective agreement lower the probability to adopt innovative pay
schemes, especially in the form of pay for performance.
5. Concluding remarks
In this paper we have investigated the effects of organisational changes in
work patterns and industrial relations on firms’ pay policies. We compare the
“old” pay systems implying job-evaluated grade structures, and payments by time
and seniority, to the “new” pay systems grounded on rewards and greater
individualisation by skill, competencies and productivity.
Using a cross country comparable ‘establishment- level’ data set (the EPOC
survey), we have tried to sketch the main patterns which characterise pay systems
in Europe, focusing both on work organisation features as well as country’s own
institutional setting.
The analysis of work organisation has revealed the existence of patterns of
adoption by sector and size. Furthermore mostly adopted practices appeared to be
multitasking, flattening of the hierarchical structure and the use of teams, whilst
less common is the introduction of job rotation. Similarly, direct participation of
workers – in either forms: consultative and delegative – in the new industrial
relations setting appear to be more diffused in the so-called the “High
Page 23
23
Performance Work Organisations”. The descriptive evidence concerning the
adoption of flexible pay schemes seem to indicate that larger firms are more likely
to adopt most schemes simultaneously and, in particular, those that are more
innovative, though a significant heterogeneity across sectors is detectable.
Finally, we studied the determinants of the pay policies associated to the
“flexible firm”, that is firms adopting HPWO. The econometric analysis showed
the importance of firm size and firm’s market structure for the adoption of
innovative pay methods, that is the probability to adopt these schemes increases
along with the competitive pressure and market share. Conversely, there seems to
be virtually no effect for traditional pay schemes. Training and the use of ICT
have a positive effect on the adoption of the whole set of flexible pay schemes,
and the effect is stronger when we move from traditional to innovative methods.
The analysis of the determinants of financial participation also proved to
be relevant when flat management, job rotation and multitasking are in place.
From the analysis of the influence of DP on pay flexibility, no clear patterns
emerges, that is no significant relationships between direct participation and pay
policies was detected. When the IR setting and climate is considered, it appears
that the absence of employees representatives increases the probability to
implement flexible pay schemes, while the presence of union representatives has a
positive impact on the probability to introduce innovative pay schemes. However,
while it appears that unions representatives are associated to higher degrees of
flexibility in the wage systems, still union density and the interaction between the
two convey the usual picture that as bargaining power increases opposition to
flexible pay schemes rises too. This is also confirmed by recognition for collective
agreement as it lowers the probability to adopt innovative pay schemes.
Page 25
25
References
Batt, R. (1999) “Work Organisation, Technology, and Performance in Customer
Service and Sales”. Industrial and labour Relation Review, 52(4), 539-559.
Black S. and Lynch L. (1997) “How to compete: The Impact of Workplace
Practices and Information Technology on Productivity ”. NBER Working Paper,
n. 6120.
Black S. and Lynch L. (2000) “What’s Driving the New Economy: The Benefits
of Workplace Innovation”. NBER Working Paper, 7479.
Blanchflower, D. G. and Oswald, A. J. (1988) “Profit-related Pay: Prose
Discovered?”. The Economic Journal, 98, 720-730.
Bonatti, J. (2001) “Nuove forme di organizzazione del lavoro: l’evidenza
empirica”. Quaderni del Dipartimento i Economia, Istituzioni e Territorio
dell’Università degli Studi di Ferrara, 17.
Bordogna, L. and Pedersini, R. (2001) “Between the “Black hole” of innovative
labour relations and HRM practices in small size enterprises”. Quaderni del
Dipartimento di Studi Sociali dell’Università degli Studi di Brescia, 8.
Page 26
26
Brynjolfsson E. and Hitt L. (1995) “Information Technology As a Factor of
Production: the Role of Differences Among Firms”. Economics of Innovation and
New Technology, 3, 183-199.
Brynjolfsson E. and Hitt L. (1998) “Beyond computation: Information
technology, Organisational transformation and Business Performance”. mimeo.
Brown, W. and Walsh, J. (1991) “Pay determination in Britain in the 1980s: the
anatomy of decentralisation”. Oxford Review of Economic Policy, 7 (1), 44-59.
Cappelli P. and Neumark D. (2001) “Do “High-Performance” Work Practices
Improve Establishment-Level Outcomes?”. Industrial and Labor Relations
Rewiew, 54(4), 737-75.
Caroli E. (1999) “New Technology, Organisational Change and the Skill Bias: a
Go into the Black Triangle” in Petit P. and Soete L. (eds), Employment and
Economic Integration, London: Edward Elgar.
Caroli E., Greenan N. and Guellec D. (1997) “Organisational Change and Human
Capital Accumulation”. CEPREMAP Working Paper, 9719.
Cooke, W. N. (1990) “Employee Participation Programs, Group-based incentives
and Company Performance: A Union and non-union Comparison”. Industrial and
Labor Relations Review, 43 (5), 597-603.
Page 27
27
Conyon, M. J. and Freeman, R. B. (2001) “Shared modes of Compensation and
Firm Performance: UK Evidence”. Paper Presented at the International
Conference on Organisational Design, Management Styles and Firm
Performance, University of Bergamo, June 22-23, 2001.
Elliott, R. F. and Duffus, K. (1996) “What has been happening to pay in the
public-service sector of the British economy? Developments over the period
1970-92”. British Journal of Industrial Relations, 34, 51-85.
European Commission (1997) Green Paper – Partnership for a new Organisation
of work (COM(97)128). Brussels: European Commission.
European Foundation (1997). New Forms of Work Organisation. Can Europe
realise its potential? EF/97/46/EN. Luxembourg: Office for the Official
Publications of the European Communities.
Freeman, R. B. and Lazear, E. P. (1996) “An economic analysis of work
councils”. In J. Rogers and W. Streeck (eds.), Works Councils: Consultation,
Representation and Cooperation in Industrial Relations. Chicago: University of
Chicago Press.
Kessler, I. (1995). “Reward Systems”. In J. Storey (ed.), Human Resource
Management: A Critical Text. London: Routledge, 254-79.
Page 28
28
Ichniowsky C., Shaw K. and Prennushi G. (1997) “The Effects of Human
Resource Management Practices on Productivity: A Study of Steel Finishing
Lines”. American Economic Review, 87(3), 291-313.
Lindbeck, A. and Snower, D. J. (1996a) “Reorganisation of Firms and Labour-
Market Inequality”. American Economic Review, 86(2), 315-321.
Lindbeck, A. and Snower, D. J. (1996b) “Centralized Bargaining, Multi- tasking
and Work Incentives ”. CEPR Working Paper, 1563 .
Marsden, D. and Richardson, R. (1994) “Performing for Pay? The effects of
“merit pay” on motivation in the public service”. British Journal of Industrial
Relations, 32, 241-61.
Metcalf, D. (1993) “Industrial Relations and Economic Performance”. British
Journal of Industrial Relations, 31, 255-83.
Milgrom, P. and Roberts, J. (1990) “The Economics of Modern Manufacturing:
Technology, Strategy, and Organization”. American Economic Review, 80(3),
511-528.
Millward, N. (1994) The New Industrial Relations?. London: Policy Studies
Institute.
OECD, (1999) Employment Outlook 1999, OECD, Paris
Page 29
29
Osterman, P. (1994) “How Common Is Workplace Transformation and Who
Adopt Is?”. Industrial and Labour Relations Review, 47(2), pp. 173-188.
Osterman, P. (2000) “Work reorganisation in an Era of Restructuring: Trends in
Diffusion and Effects on Employee Welfare”. Industrial and Labor Relations
Review, 53(2), 179-196
Poole, M. and Jenkins, G. (1998) “Human Resource Management and the Theory
of Rewards: Evidence from a National Survey”. British Journal of Industrial
Relations, 36(2), 227-247.
Smith, I. (1992) “Reward management and HRM”. In P. Blyton and P. Turnbull
(eds), Reassessing Human Resource Management. London: Sage.
Snower, D. (1999) “The Reorganisation of Work”. Paper presented at the 1999
EALE Conference, Regensburg, Germany.
Page 30
30
Table 1: Composition of the sample by country
Gross sample Weighted
sample
Country Obs. Percent (*)
Netherlands 452 8.40 4.84
Germany 734 13.63 26.08
Spain 411 7.63 8.64
Denmark 641 11.91 1.99
Ireland 371 6.89 0.91
France 533 9.90 15.96
Italy 465 8.64 15.39
Portugal 270 5.01 3.30
Sweden 732 13.60 3.19
UK 775 14.39 19.71
Total 5384 100.00 100.00
Note: (*): Percentage resulting after
applying to the original sample the
weighting factor, which is the share of
employees with respect to the total number
of employees in the EU. Some countries are
over represented, other are under
represented. For these reasons weights are
always used in the empirical analysis.
Page 31
31
Table 2: Establishment’s adoption of innovative work practices by sector and by
size
Flat_str Job_rot Teams Multitask Int_wp
For each practice,
proportion of establishments adopting it
Index (0-4)
sectors
Manufacturing 0.32 0.15 0.31 0.50 1.35
Transp&communic 0.33 0.12 0.26 0.51 1.25
Construction 0.29 0.06 0.17 0.70 1.15
wholesale&trade 0.29 0.11 0.24 0.63 1.27
Bank&insurance 0.27 0.25 0.33 0.67 1.56
Professional services 0.29 0.08 0.28 0.73 1.42
Other services 0.32 0.20 0.19 0.61 1.41
Public sector 0.27 0.09 0.29 0.71 1.43
Size (n° employees)
20-50 0.20 0.10 0.18 0.70 1.22
50-200 0.26 0.11 0.26 0.61 1.31
200-500 0.30 0.12 0.30 0.58 1.37
500-1000 0.40 0.13 0.27 0.62 1.43
more 1000 0.43 0.13 0.35 0.66 1.55
Mean 0.30 0.12 0.28 0.62 1.35
Page 32
32
Table 3: Number of work practices adopted by sector
Number of new work practices adopted
0 1 2 3 4
Sectors
Manufacturing 0.22 0.33 0.25 0.15 0.05
Transp&communic 0.23 0.39 0.24 0.12 0.01
Construction 0.17 0.52 0.23 0.07 0.01
wholesale&trade 0.16 0.46 0.25 0.11 0.02
Bank&insurance 0.12 0.38 0.27 0.18 0.05
Professional services 0.13 0.44 0.30 0.12 0.01
Other services 0.19 0.30 0.33 0.16 0.02
Public sector 0.13 0.40 0.29 0.15 0.02
Mean 0.17 0.40 0.27 0.13 0.03
Note: proportions of establishments adopting: none or 1 or 2 or 3 or 4 work organisation practices.
Row values are shares calculated dividing the number of establishments in each cell by the number
of establishments in each row. Row’s total = 1.
Page 33
33
Table 4: Direct participation and the traditional system of industrial relations
Number of forms of DP implemented
0 1 2 3 4
Number of forms of
collective representation
0 0,08 0,08 0,23 0,23 0,39
1 0,07 0,09 0,20 0,22 0,42
2 0,04 0,07 0,18 0,23 0,48
3 0,03 0,05 0,15 0,23 0,53
4 0 0,03 0,10 0,25 0,62
Mean 0,05 0,07 0,18 0,23 0,46
Pearson chi2(16) = 67.5686 Pr = 0.000
Note: proportions of establishments by score. Row values are shares calculated dividing the
number of establishment in each cell by the number of establishments in each row.
Page 34
34
Table 5: The diffusion of flexible pay methods by sectors and by size
Innovative methods
Traditional
methods Pay for
productivity Financial participation
skill_pay bonus ind_out team_out Prof_shar Share_own
For each method, proportion of establishments adopting it
Int_pay
Index (0-4)
Sectors:
Manufacturing 0.43 0.16 0.20 0.29 0.21 0.09 1.40
Transp&communic 0.29 0.14 0.15 0.14 0.16 0.08 0.97
Construction 0.47 0.15 0.25 0.27 0.17 0.07 1.39
wholesale&trade 0.38 0.19 0.26 0.23 0.24 0.09 1.41
Bank&insurance 0.38 0.26 0.23 0.20 0.38 0.10 1.55
Professional services 0.44 0.20 0.17 0.15 0.19 0.09 1.24
Other services 0.30 0.12 0.08 0.13 0.11 0.04 0.79
Public sector 0.37 0.08 0.07 0.06 0.03 0.01 0.63
Size (n° employees)
20-50 0.32 0.12 0.13 0.14 0.11 0.03 0.84
50-200 0.39 0.14 0.17 0.18 0.15 0.05 1.08
200-500 0.42 0.15 0.20 0.21 0.18 0.08 1.24
500-1000 0.49 0.18 0.15 0.19 0.23 0.12 1.35
more 1000 0.43 0.18 0.17 0.26 0.19 0.09 1.31
Mean 0.40 0.15 0.17 0.19 0.16 0.06 1.14
Page 35
35
Table 6: Correlation between flexible pay schemes, new work practices,
direct participation and industrial relations
int_wp int_dp int_ir
int_pay (+)** (/) (-)*
int_wp (+) (+)**
int_dp (+)**
Note: (+) positive correlation; (-) negative correlation;
(/) no correlation.** = 5% significance level.
* = 10% significance level
Page 36
36
Table 7: The determinants of pay flexibility
Traditional
pay flexibility
Innovative pay flexibility
pay for
productivity
financial
participation
(1) (2) (3) (4) (5) (6)
size2 0.098 0.073 0.097 0,079 0.485 0,459
(0.26) (0.18) (0.43) (0.44) (3.67) (4.10)
size3 0.096 0.097 0.1798 0,222 1.041 0,656
(0.70) (0.42) (1.17) (1.29) (2.99) (2.82)
size4 0.089 0,084 0.170 0,2333 1.024 0,674
(0.49) (0.42) (1.60) (1.62) (2.68) (2.56)
size5 0.161 0,1437 1.009 1.073 1.265 1.278
(0.57) (0.47) (3.10) (3.04) (7.54) (9.02)
Indep -0.130 -0.151 0.169 0,1520 -0.476 -0.547
(0.39) (0.45) (0.84) (0.75) (1.88) (2.05)
Domown 0.095 0.080 0.077 0.099 0.198 0,189
(0.30) (0.25) (0.28) (0.23) (1.13) (1.33)
Compet 0.1152 0,118 0.1576 0,167 0.231 0,25
(2.41) (2.40) (4.70) (5.62) (6.76) (7.86)
Profit -0.171 -0.157 0.463 0,452 0.173 0,20
(0.81) (0.69) (2.97) (2.73) (0.41) (0.45)
ICT 0.24 0,220 0.4472 0,4409 0.391 0,331
(3.38) (2.64) (3.26) (3.23) (4.65) (3.57)
Train 0.4104 0,406 0.467 0,495 0.605 0,575
(7.06) (8.10) (1.87) (2.03) (4.60) (4.02)
Urepr 0.14 0,131 0.465 0,459 0.42 0,384
(0.82) (0.79) (3.38) (3.23) (2.08) (1.86)
Page 37
37
Ud 0.005
(2.62)
0.005
(2.43)
-0.007
(0.28)
0.0008
(0.13)
0.001
(0.61)
0.001
(0.66)
Udurepr 0.062 0.076 -0.229 -0.206 -0.661 -0.662
(0.13) (0.16) (1.73) (1.55) (1.94) (1.93)
Wcounc 0.241 0,245 0.233 0,224 0.206 0,169
(1.78) (1.77) (0.99) (0.95) (0.97) (0.93)
adv_com -0.189 -0.195 -0.216 -0.196 -0.313 -0.293
(1.09) (1.16) (0.67) (0.60) (1.36) (1.35)
Norepr 0.179 0,191 0.38 0,390 0.36 0,345
(1.69) (1.93) (2.32) (2.46) (1.26) (1.32)
Cover 0.071 0.081 -0.291 -0.279 -0.131 -0.164
(0.76) (0.93) (2.23) (2.10) (0.77) (0.92)
Flat_str 0.088 0.223 0.232
(0.84) (1.50) (2.07)
Job_rot 0.073 0.204 0.37
(0.23) (1.76) (2.78)
Teams 0.085 0.119 0.056
(0.50) (1.41) (0.39)
Multiltask 0.137 -0.232 0.394
(1.46) (1.36) (2.70)
Int_wp 0,113 0.096 0,375
(5.88) (0.95) (6.50)
Indcons -0.085 0.084 0.234
(0.39) (0.61) (2.77)
Grcons -0.024 -0.103 -0.159
(0.12) (0.45) (1.42)
Inddel 0.094 0.152 0.075
(0.40) (1.92) (0.61)
Grdel 0.181 0.024 -0.194
Page 38
38
(2.48) (0.16) (1.34)
Int_DP 0.088 0.063 -0.001
(0.99) (1.03) (0.01)
Note: The comparison group is payflex =
0. Category excluded: Portugal, public
sector, size 1 (less than 50) and foreign
ownership. Col (3), (7), (11): Obs 4606,
R^2 0.198. Col (4), (8), (12): Obs 4606,
R^2 0.195. Robust z statistics in
parentheses. Each regression includes
country and sector controls, and a
constant term.
Page 39
39
Appendix
Table A1: Summary statistics and data description
Variable Description Mean Std. Dev. Min Max
Flexible pay schemes
Skill_pay Pay for skill 0.3998886 0.4899207 0 1
Bonus Bonus 0.1476597 0.3547953 0 1
Ind_out Pay for individual output 0.1706909 0.3762736 0 1
Team_out Pay for team output 0.1922363 0.3940943 0 1
Prof_share Profit sharing 0.1638187 0.3701454 0 1
Share_own Share of ownership 0.0653789 0.2472162 0 1
Int_pay Intensity of adoption of flexible
pay schemes
1.602721 1.515368 0 4
payflex Pay flexibility 1.301263 1.123554 0 3
Country dummies
netherl Netherlands 0.0839525 0.2773423 0 1
germany Spain 0.1363299 0.3431704 0 1
spain Germany 0.0763373 0.2655617 0 1
denmark Denmark 0.1190565 0.323885 0 1
ireland Ireland 0.0689079 0.2533209 0 1
france France 0.098997 0.2986858 0 1
italy Italy 0.086367 0.2809313 0 1
port Portugal 0.0501486 0.2182717 0 1
sweden Sweden 0.1359584 0.3427762 0 1
uk Uk 0.143945 0.3510666 0 1
Sector dummies
manufac Manufacturing 0.2754926 0.4468008 0 1
transp Transp&communication 0.0722433 0.2589128 0 1
constr Construction 0.1038714 0.30512 0 1
Page 40
40
sale_tr Wholesale&trade 0.0757 0.2645403 0 1
Bankins Bank&insurance 0.0402696 0.1966079 0 1
profser Professional services 0.0988113 0.2984362 0 1
pubsect Public Sector 0.2360871 0.424713 0 1
othserv Other services 0.0349119 0.1835724 0 1
Firm size and Firm characteristics
size1 Size 20_50 0.1582467 0.365006 0 1
size2 Size 50_200 0.3909437 0.488004 0 1
size3 Size 200_500 0.2180535 0.4129623 0 1
size4 Size 500_1000 0.0963967 0.295162 0 1
size5 Size more1000 0.1071694 0.3093572 0 1
indep Independent 0.4573384 0.4893894 0 1
domown Domestic ownership 0.3693674 0.4622728 0 1
forown Foreign ownership 0.1732942 0.3554169 0 1
compet Level of competition(*) 2.820046 1.112124 1 4
profit Profit sector 0.6900074 0.4625331 0 1
ICT ICT 0.4556092 0.4980718 0 1
train Training 0.2290119 0.4202359 0 1
Employee representation and IR
urepr Union representatives 0.4248185 0.4943582 0 1
udurepr Union representatives * Density
(interaction)
0.2125093 0.3626403 0 1
ud Union density 0.4633432 0.3978442 0 1
wcounc Work council 0.3432423 0.4748326 0 1
advcom Advisory committee 0.1261666 0.3320657 0 1
norepr No representatives 0.2283097 0.4197795 0 1
Int_ir N. forms of collective
representation
1.167552 0.8079129 0 4
cover Coverage 0.7786033 0.4152255 0 1
Page 41
41
HPWO
New work practices
Flat_str Flat structure of management 0.305958 0.4732761 0 1
Job_rot Job rotatation 0.123328 0.3687901 0 1
teams Team work 0.27789 0.4528217 0 1
mulitask Multitasking 0.6235736 0.4789877 0 1
Int_wp Intensity of adoption of new work
practices
1.35208 10.021562 0 4
Direct Participation
indcons Individual consultation 0.8617227 0.3452212 0 1
grcons Group consultation 0.7921519 0.4058038 0 1
inddel Individual delegation 0.6437262 0.478941 0 1
grdel Group delegation 0.655267 0.4753246 0 1
Int_dp Intensity of adoption of DP 20.988199 10.183304 0 4
Note: (*): 1 = low competition; 2 = only domestic; 3 = domestic and little foreign; 4 = mainly
foreign.
Page 42
42
Notes
1 For example the works of Poole (1990), Poole & Jenkins (1998) and Smith (1992).
2 Traditional pay systems “provided only for payment for a specific job in a hierarchical
organisation with a rigid division of labour”, while innovative wage systems includes “broader job
descriptions” and “higher valuation of new job requirements, such as co-operation, responsibility,
decision-making, problem solving” and should be “the financial expression of organisational
structures within a company” (Green Paper, 1997).
3 The survey also provides the weights (by sector, size, country) to correct for possible distortion
in the sampling procedure due to attrition and non respondent. The overall response rate was
approximately 18 per cent – with a range between 9 per cent (Spain) and 39 percent (Ireland). We
cannot exclude that some of the non response is systematically related to some establishment
characteristics (such as size, sector, location). For more details about the Survey, see OECD
(1999) and European Foundation (1997).
4 The Public sector includes public administration, public utilities, (public) heath and social
welfare, education. Therefore, the definition of Public sector includes also education as a whole, as
it is impossible from the data to separate public from private schools.
5 The dimension, the organisation and also the nature of the public sector differ a lot between
countries. However, further investigations (not reported here) shows that, for each country, the
pattern of the public sector follows quite closely the behaviour of the economy as a whole.
6 Osterman (2000) find that about 15 percent of establishment adopted none of the four practices
investigated (quality circles, teams, job rotation, TQM) and about 50 percent two or three.
7 The exact percentages are: 5.3 percent for none form; 7.2 percent for one; 18.5 percent for two;
22 percent for three and 46 percent for four. These percentages are higher that those reported by
Guest (1995), who find that the 31 percent of firms covered by WIRS introduced DP practices, but
quite close to those reported by Freeman et al., (2000), where the 52 percent of firms with more
than 25 employees use more than one program of DP and the 31 percent only one.
8 For what concerns the distribution of the index values, only 1.2 percent of establishment adopted
the full set of collective representation dimensions, in 12 percent there are three, in the 47 percent
of cases two, in the 32 percent one and, finally, in the 6 percent none.
Page 43
43
9 Guest (1995) reports that the introduction of DP does not seem to be particularly supported or
opposed by the system of firm’s industrial relations or by the presence of unions, which could
favour DP initiatives only as a strategy of survival and development.
10 For what concerns financial participation, Smith (1992) and Brown & Walsh (1991) argued that
changes in pay practices may be more ad hoc than strategic and, stimulated by political
intervention more than by work characteristics. Nevertheless, existing studies on profit-sharing
and employee participation show that the effects of work arrangements and industrial relations on
pay schemes, even in the form of shared compensation, is not negligible (see Kruse, 1993).
11 Many authors analysed the relationships between the adoption of flexible pay policies and the
climate of IR. For example, Blanchflower & Oswald (1988) find no relationships between the
quality of IR and the existence of share ownership, profit sharing or a bonus scheme, while, for the
US, Cooke (1990) finds that the union presence lower the probability to adopt forms of financial
participation.
12 These values could be also influenced by the composition of the industrial relations’ index.
Indeed, compared to the classes from 0 to 3, only a small number of observation belong to the
class 4 (which, with only 63 obs. out of 5384 is numerically very small). On the other hand, both
qualitative and quantitative results does not change if we rescale the index from 0 to 3, adding the
observations that originally were in class 4 to those in class 3.
13 Many critics can be made on how we construct this variable. For example, one can say that this
combination of answers is not consistent and do not capture what is really involved in the decision
to adopt flexible pay schemes; that to address these issues we should need other question and other
data; and so on. However, this is the first time that this type of analysis has been conduced, so we
need a basis to begin. The big amount of preliminary analysis, where we tried a lot of
specifications and test a lot of aggregation, suggest that, within the limitations due to the nature of
our survey data, result are robust to changes in the specification and that the measures adopted
here make most sense in data as well as conceptual framework developed here.
14 As our HPWO and IR regressors may be correlated, the estimates may be distorted and
inconsistent. To control for these potential bias, first, we estimated the model only with the set on
IR regressors (in addition to the set of control). As the inclusion of both union density and
Page 44
44
coverage in establishment-level estimates could affect the results, we tested both the joint
significance and the equality of coefficients, reporting satisfactory results. Then, we introduced the
work organisation variables and, at last, we included also DP. As our results don’t seem to be
heavily affected by the introduction of the new variables, we report only the results for the
complete equation. Also the F-test for the individual and joint significance of coefficients reports
satisfactory results.
15 As underlined by Poole & Jenkins (1998) for the UK only “there are many significant
relationships in the hypothesized direction (in particular for what concern profit related pay and
payment by result/performance-related pay), but little of the variance can be explained by HRM
variables”.