The 4th International Symposium - Supercritical CO2 Power Cycles September 9-10, 2014, Pittsburgh, Pennsylvania (Style ‘Event Detail’) HIGH PRESSURE THERMOPHYSICAL GAS PROPERTY TESTING, UNCERTAINTY ANALYSES, AND EQUATION OF STATE COMPARISON FOR SUPERCRITICAL CO2 COMPRESSION APPLICATIONS Brandon L. Ridens Research Engineer Southwest Research Institute San Antonio, Texas, USA [email protected]Klaus Brun Program Director R&D Southwest Research Institute San Antonio, Texas, USA [email protected]Brandon L. Ridens is a research engineer with the Pipeline Simulation Section of the Fluids and Machinery Engineering Department at Southwest Research Institute. Mr. Ridens has performed pulsation analyses of both reciprocating and centrifugal compressors and piping system to maintain high performance and minimize horsepower losses due to acoustic pulsation and mechanical vibration. Mr. Ridens currently heads the high pressure gas property testing performed at SwRI; providing thermo-physical gas properties including speed of sound, density and specific heat for various gases in the high-pressure, supercritical regime. Dr. Brun is the Program Director of the Machinery Program at Southwest Research Institute. His experience includes positions in engineering, project management, and management at Solar Turbines, General Electric, and Alstom. He holds six patents, authored over 150 papers, and published two textbooks on gas turbines. Dr. Brun won an R&D 100 award in 2007 for his Semi-Active Valve invention and ASME Oil & Gas Committee Best Paper awards in 1998, 2000, 2005, 2009, 2010, and 2012. He was chosen to the "40 under 40" by the San Antonio Business Journal. He is the past chair of the ASME-IGTI Board of Directors and the past Chairman of the ASME Oil & Gas Applications Committee. He is also a member of the API 616 and 692 Task Forces, the Middle East Turbomachinery Symposium, the Fan Conference Advisory Committee, and the Supercritical CO2 Conference Advisory Committee. Dr. Brun is the Executive Correspondent of Turbomachinery International Magazine and an Associate Editor of the ASME Journal of Gas Turbines for Power. 1. ABSTRACT With the installation of supercritical pipelines and a need to transport larger volumes of natural gas and CO2 with varying compositions, there has been growing interest from various compressor manufacturers and pipeline companies in finding more accurate gas property data. While a large body of work is available comparing the results from different Equation of State (EOS) models, little to no data is available to verify the results from the various EOS calculations from the range of pressures, temperatures and gas compositions relevant to pipeline operations (especially those operating at the supercritical regime). Thus, the users of EOS (end users, operators, and manufacturers) have no precise data to determine which EOS model gives the most accurate results when predicting compressor and pipeline performance. Accurate gas property prediction is a necessary component for proper sizing and selection of 1
Transcript
The 4th International Symposium - Supercritical CO2 Power Cycles September 9-10, 2014, Pittsburgh, Pennsylvania (Style ‘Event Detail’)
HIGH PRESSURE THERMOPHYSICAL GAS PROPERTY TESTING, UNCERTAINTY ANALYSES, AND EQUATION OF STATE COMPARISON FOR SUPERCRITICAL CO2 COMPRESSION
APPLICATIONS
Brandon L. Ridens Research Engineer
Southwest Research Institute San Antonio, Texas, USA [email protected]
Klaus Brun Program Director R&D
Southwest Research Institute San Antonio, Texas, USA
Brandon L. Ridens is a research engineer with the Pipeline Simulation Section of the Fluids and Machinery Engineering Department at Southwest Research Institute. Mr. Ridens has performed pulsation analyses of both reciprocating and centrifugal compressors and piping system to maintain high performance and minimize horsepower losses due to acoustic pulsation and mechanical vibration. Mr. Ridens currently heads the high pressure gas property testing performed at SwRI; providing thermo-physical gas properties including speed of sound, density and specific heat for
various gases in the high-pressure, supercritical regime.
Dr. Brun is the Program Director of the Machinery Program at Southwest Research Institute. His experience includes positions in engineering, project management, and management at Solar Turbines, General Electric, and Alstom. He holds six patents, authored over 150 papers, and published two textbooks on gas turbines. Dr. Brun won an R&D 100 award in 2007 for his Semi-Active Valve invention and ASME Oil & Gas Committee Best Paper awards in 1998, 2000, 2005, 2009, 2010, and 2012. He was chosen to the "40 under 40" by the San Antonio Business Journal. He is the past chair of the ASME-IGTI Board of Directors and the past Chairman of the ASME Oil & Gas Applications Committee. He is also a member of the API 616 and 692 Task Forces, the Middle East Turbomachinery Symposium, the Fan Conference Advisory Committee,
and the Supercritical CO2 Conference Advisory Committee. Dr. Brun is the Executive Correspondent of Turbomachinery International Magazine and an Associate Editor of the ASME Journal of Gas Turbines for Power.
1. ABSTRACT
With the installation of supercritical pipelines and a need to transport larger volumes of natural gas and CO2 with varying compositions, there has been growing interest from various compressor manufacturers and pipeline companies in finding more accurate gas property data. While a large body of work is available comparing the results from different Equation of State (EOS) models, little to no data is available to verify the results from the various EOS calculations from the range of pressures, temperatures and gas compositions relevant to pipeline operations (especially those operating at the supercritical regime). Thus, the users of EOS (end users, operators, and manufacturers) have no precise data to determine which EOS model gives the most accurate results when predicting compressor and pipeline performance. Accurate gas property prediction is a necessary component for proper sizing and selection of
1
equipment, improving overall efficiency, making accurate predictions, and reducing operating costs.
Southwest Research Institute® (SwRI®) has developed high-accuracy test methods for density and speed of sound determination for these supercritical regimes for a variety of gas mixtures. This paper will discuss results from these high pressure gas property tests performed using specialized anti-corrosion, high pressure, institute-designed test fixtures. The analyzed gas mixtures include high CO2, hydrocarbon, and natural gas mixtures. These results were used to compare experimental data of specified gas properties with varying EOS model predictions. Uncertainty limits and bounds for primary direct measurements and reference conditions are calculated based on data from each gas mixture, test condition and equipment uncertainties. Recommendations are made for selected EOS models for the specific mixtures and conditions from model and test measurement comparisons.
2. INTRODUCTION
There have been increased motivations to reduce gas emissions throughout the oil and gas industry from both consumer voices and growing government regulations. With international standards that require lowering the acceptable release limits of mono-nitrogen oxides (NOx) and other greenhouse gases, non-traditional means of sequestration and compression are being investigated. In an attempt to reduce the release of these greenhouse gases that involve CO2, sequestration of CO2 from Integrated Gasification Combined Cycle (IGCC), Oxy-Fuel, and Pulverized Coal (PC) power plants have been explored. The primary objective of this paper is to study the characteristics of gases as the result of novel CO2 compression concepts to boost the pressure of CO2 to pipeline pressures with a minimal amount of energy required.
Additionally, with the installation of supercritical pipelines and a need to transport larger volumes of natural gas and CO2 with varying compositions, there has been growing interest from various compressor manufacturers and pipeline companies in finding more accurate gas property data. While a large body of work is available comparing the results from different Equation of State (EOS) models, a minimal amount of data is available to verify the results from the various EOS calculations from the range of pressures, temperatures and gas compositions relevant to pipeline operations at the supercritical regime. Accurate gas property prediction is a necessary component for proper sizing and selection of equipment, improving overall efficiency, making accurate predictions, and reducing operating costs.
High-accuracy test methods developed by Southwest Research Institute® (SwRI®) for density and speed of sound were implemented for three different CO2 gas mixtures at supercritical regimes. The gas mixtures tested in this campaign include process impurities commonly seen in CO2 separation such as methane, argon, oxygen, and nitrogen.
3. CHARACTERIZATION OF REPRESENTATIVE GAS MIXTURES
In order to determine the representative carbon dioxide gas mixtures which are likely to be produced from the various commercially available separation processes for fossil-fuel based power plants (namely pulverized coal, NGCC, IGCC and oxy-fuel cycles). A technical literature review of measured and modeled CCS processes and interviews with DOE and industry personnel was conducted to determine adequate recommendations for the mixture compositions.
The mixture constituents for CO2 gases are likely to be derived by processes that result in hydrocarbons and coal / natural gas impurities such as sulfur compounds, hydrogen sulfide, nitrogen, and argon. This task was accomplished by a thorough technical paper review of previous studies and modeling efforts in addition to consultation with leading technical experts
2
and separation equipment manufacturers. The task included the formulation of multiple mixtures to represent S-CO2 power generation cycle with expected impurities.
The following is a result of a literature review from multiple sources including experimental reports, theses, technical papers, and journal articles from both the industry and academia. Power plants using coal, NGCC, IGCC, and oxy-fuel cycles were reviewed.
A paper by the Department of Energy and Foster Wheeler [1] reviews a conceptual novel process for CO2 sequestration that utilizes an oxygen-fired pulverized coal (PC) boiler with a Rankine steam cycle to form a high efficient, seemingly zero emission, stackless power station. An oxidizer consisting of a mixture of O2 and flue gas, containing primarily CO2 gas, is utilized with a coal fired boiler. The flame temperature is controlled with the recycled flue gas in the boiler furnace to maintain acceptable waterwall temperatures. With the use of combustion staging and reburning and char reduction, NOx emissions are minimized in the flue gas and effectively all of the flue gas heat energy is recovered. This leaves the plant with virtually pure CO2 to compress, condense, and provide to a separate site for sequestration. Based upon membrane separation, the cold flue gas exiting the wet-end economizer contains primarily CO2 (over 90% by mass) and small amounts of 02 and H20. For testing purposes, the mixture to represent this flue gas was defined as being 94.74 %mol CO2 and 5.26 %mol O2.
An article by Dresden University of Technology [2] provided a technological and economic evaluation of an oxyfuel lignite-fired power plant with advanced supercritical steam parameters and CO2 capture. This process is based on a design developed with the same boundary conditions and conventional power plant equipment of lignite-fired power plants with efficiencies close to 50%. The presented flue gas composition in the oxyfuel process before compression is 82.2 %vol CO2, 9.2 %vol N2, 4.4 %vol O2, 0.6 %vol Ar, 3.7 %vol H2O, and 0.03 %vol SO2. For testing purposes, the mixture to represent this flue gas was defined as being 85.42 %mol CO2, 9.38 %mol N2, 5.21 %mol O2.
The “CO2 Impurity Design Parameters – Quality Guidelines for Energy Systems Studies” [3] provides a guideline and recommended impurity limits for CO2 stream components for use in studies of CO2 carbon capture, utilization, and storage systems. This guideline, developed by the National Energy Technology Laboratory and the U.S. Department of Energy, is based on information collected from various studies and arranged by component and application. The recommended maximum of CO2 impurities for enhanced oil recovery or saline reservoir carbon capture and sequestration applications is presented as 95 %vol(min) CO2, 4 %vol N2, 4 %vol O2, 4 %vol Ar, 4 %vol CH4, 4 %vol H2, and smaller to trace amounts (in ppmv) of other constituents. For testing purposes, the mixture to represent pipeline grade CO2 is condensed down to 95.96 %mol CO2, 2.02 %mol N2, 1.01 %mol Ar, and 1.01 %mol CH4.
The list of gas mixture compositions with their respected labels for the following test campaign is presented in Table 3-1.
Table 3-1. Campaign Gas Mixture Compositions
Mixture CO2 %mol N2 %mol O2 %mol Ar %mol CH4 %mol Description
A 94.74 0 5.26 0 0 Membrane Separation
B 85.42 9.38 5.21 0 0 Oxy-Comb Lignite-Fired
3
C 95.96 2.02 0 1.01 1.01 Pipeline CO2
All thermophysical property data sets (for each mixture) will utilize five pressure points and three temperatures spanning the range from 100-10,000 psi and from 100-300 °F. A majority of the test points will be within the supercritical regime, above the critical temperature and pressure of CO2 of roughly 88°F and 1057 psi, respectively. These pressure and temperature points will cover the foreseeable range for carbon capture and sequestration activities (separation, compression, transport and re-injection) and turbomachinery designs for closed S-CO2 loops for power generation.
4. TEST DESCRIPTION AND METHODOLOGY
This paper discusses the results from the thermophysical gas property test program for high pressure gas mixtures performed at the Southwest Research Institute® (SwRI®). The testing utilized the Mixed Gas Laboratory in the Turbomachinery Research Faciltiy, SwRI Building 278. All test procedures adhere to the Standard Operating Procedures for SwRI Building 278 and specialized test methods developed for density and speed of sound property measurements. The testing utilized three certified gas mixtures, which were routinely ordered from a gas supply company as needed to complete the test runs.
Based on the range of test pressures within this program campaign and for accuracy purposes, two test fixtures were required. A high pressure, concentrated volume autoclave designed for precision scale measurements was utilized for density calculations at elevated pressures.Figure 4-1 displays the closed cylinder used for the density measurements, rated for 10,000 psi operation, accompanied by two pressure taps for a Type K thermocouple, pressure transducer and fill line. The autoclave is placed vertically on the high precision scale to take the mass measurements. A high pressure fixture, composed of high pressure tubing/piping is used for the speed of sound measurements, see Figure 4-2. By design, to determine the response frequency, there are multiple high-pressure fittings along the fixture’s length for dynamic pressure (using an internal acoustic-to-electric transducer), static pressure, temperature, and fill line purposes using similar equipment as the test setup for the density measurements.
4
Figure 4-1. High Pressure Test Fixture for Density Measurements
Figure 4-2. High Pressure Test Fixture for Speed of Sound Measurements
The test program was performed in a pressure space equipped with gas detectors tied to a safety control system. The laboratory test space is humidity and temperature controlled for assurance of instrumentation calibration standards.
Gas density (specific volume) was measured using separate measurements of gas mass and internal volume of the test fixture. The masses of the gas mixture and test fixture were measured using a precision industrial laboratory mass comparator scale with a precision of 0.001 gram. The mass comparator scale was calibrated by a specialized technician in place at SwRI. The test fixture was disconnected fully from the gas filling line and the mass
5
measurement was recorded once the steady condition had been reached. Before and after each run, the test fixture gas was released and then the vacuum pump was used to remove all remaining trace amounts of gas. Tare weight measurements were taken in the vacuum state.
The natural acoustic resonance of a pipe with two closed ends can be used to determine speed of sound. Fundamental acoustic theory states that a pipe with two open or two closed ends will resonate at a frequency corresponding to the half-wave mode of the pipe. A high power speaker is used to introduce a standing wave into the test fixture while a high frequency acoustic-to-electric transducer is used to measure the frequency content of this standing wave. Through a performed frequency sweep, a peak amplitude and associated frequency is recorded, see Figure 4-3, and used to calculate the speed of sound.
Figure 4-3. Example Peak Amplitude at Resonant Frequency
5. UNCERTAINTY ANALYSIS
The test uncertainty was calculated for the primary direct measurements and reference condition (pressure, temperature, EOS model prediction, and gas mixture uncertainty) at each test condition. The test uncertainty is a function of the sensor measurement uncertainty and additional uncertainties in the test geometry (length and internal volume). The instrument uncertainty estimate is described for the pressure, temperature, density, and speed of sound measurement below. Additional contributions to test uncertainty include the gas mixture variation based on a 1% or 2% uncertainty in each gas component per the certified mixture and the equation of state model uncertainty for the reference condition.
Prior to determining a test uncertainty, it is important to know whether the measured variables in the test are independent or dependent. This aids in determining which method of calculating uncertainty must be employed. If the measured variables in an experiment are truly found to be independent, then the method to determine total uncertainty is simply an addition of all individual measurement uncertainties, as seen in the equation below.
The two gas property values involved independent measurements of at least two quantities and, therefore, required an analysis of contributing uncertainties. In the case of density, these direct
6
measurements are gas volume and mass. In the case of speed of sound, these are the test fixture length and the resonant frequency. The most accurate analysis to determine total uncertainty of dependent variable measurement systems is the perturbation method, which is based on the actual function F and does not require any linearity assumptions, as seen in the equation below.
∑=
∆+−=
∆+−+∆+−+∆+−+∆+−=
∆∆+∆∆+∆∆+∆∆=∆
n
iiii
nnn
n
xxFxF
xxFxFxxFxFxxFxFxxFxFxFxFxFxFF
1
333222111
321
)()(
)()(...)()()()()()()(...)()()(
The perturbation method is implemented by sequentially perturbing (or altering) the input values, such as temperature and pressure, by their respective uncertainties and recording the effects on the calculated output quantity (density and speed of sound). Using the perturbation method, the influence of each test parameter uncertainty can be directly evaluated for the particular gas mixture at the pressure and temperature condition selected for the iteration. The NIST REFPROP [4] program is used for all EOS model predictions and to evaluate the gas mixture uncertainty, pressure uncertainty, and temperature measurement uncertainty on the measured properties (density and speed of sound). To find the final test uncertainty, the root sum square addition is used to represent a true superposition of all positive and negative uncertainties. The individual contributions are squared, added together, and then the total test uncertainty is determined by the square root of the sum, seen in the equation below.
Pressure and temperature variations due to the instrumentation precision uncertainties were modeled in NIST REFPROP to determine the effect on the gas property at the temperature and pressure condition for each run. The uncertainty in each gas component was reported to be either 1% or 2% based on the certification supplied by the gas supplier. This effect was modeled in the NIST REFPROP software by considering the analytical uncertainty effect on the primary constituent. This method used allowed the uncertainty to be customized for the specific gas mixture and pressure/temperature condition of interest. The amount of additional uncertainty due to the gas components varied by mixture.
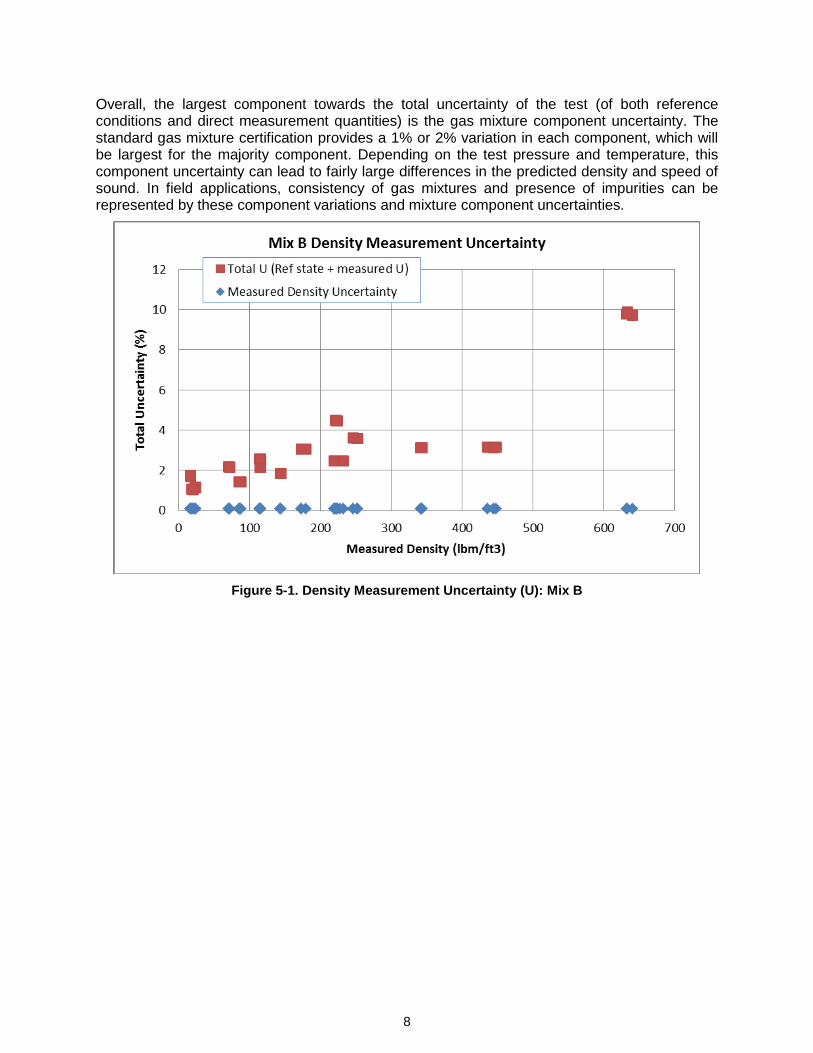
In some cases, the contribution of each test variable towards the total uncertainty varies significantly. The temperature and pressure uncertainties in combination with gas mixture uncertainties have larger effects on the gas property near the critical point. This can be seen in Figure 5-1 through Figure 5-4, with the non-linear “spikes” in the uncertainty curves. For Mix A, the density and speed of sound uncertainties could not be calculated at the pressure and temperature combination of 1250 psi and 100 °F due to an error reported in REFPROP where the “liquid density iteration did not converge.” Similarly, the density and speed of sound uncertainties due to the gas composition for Mix B could not be calculated at 1800 psi and 100 °F due to the same error. For these points, the average of all of the uncertainties due to gas composition variations for the gas mixture was used for that uncertainty point. Such deviations may explain why there was considerably more difference in the measured speed of sound compared to the model predictions for Mix A and B. The test conditions near the critical point for carbon dioxide are shown on the Pressure-Enthalpy diagram to highlight proximity to the critical point of pure CO2, in Figure 5-5.
7
Overall, the largest component towards the total uncertainty of the test (of both reference conditions and direct measurement quantities) is the gas mixture component uncertainty. The standard gas mixture certification provides a 1% or 2% variation in each component, which will be largest for the majority component. Depending on the test pressure and temperature, this component uncertainty can lead to fairly large differences in the predicted density and speed of sound. In field applications, consistency of gas mixtures and presence of impurities can be represented by these component variations and mixture component uncertainties.
Figure 5-1. Density Measurement Uncertainty (U): Mix B
8
Figure 5-2. Density Measurement Uncertainty (U): Mix C
Figure 5-3. Speed of Sound Measurement Uncertainty (U): Mix B
9
Figure 5-4. Speed of Sound Measurement Uncertainty (U): Mix C
Figure 5-5. Pressure-Enthalpy Diagram for CO2
10
6. TEST CAMPAIGN RESULTS
To reduce test uncertainties and verify repeatability, a minimum of three iterations were performed for the density measurements while a minimum of four iterations were performed for the speed of sound measurements.
A portion of the test results are presented in Figure 6-1 through Figure 6-4. The graphs display the measured gas property and measured pressure for the three different temperature points.
The reference state uncertainty varied from 1-7% depending on the test condition and gas mixture. Total uncertainties, therefore, varied from 1.0% to 7.2% considering all contributions including the gas mixture uncertainty. The driving factor in the reference state uncertainty was the gas mixture component uncertainty of upwards of 2% on each component per the certification from the gas supplier.
The comparison of the GERG and default NIST equation of state model predictions and experimental results is discussed further in Section 0. In general, the GERG and NIST model predictions matched the experimental data within +/- 4% for most mixtures and test conditions. Higher deviations were notable for Mix A and B for the density measurements and most mixtures at lower temperatures for the speed of sound measurements.
A notable trend with the speed of sound measurement is present in both Mix A and B at lower temperatures. At elevated temperatures, those at 300 °F, change in pressure has relatively little effect on the speed of sound for the gas mixtures below 4000 psi. As temperature decreases to 200 °F, a slightly downward trend is noticed with the increase of pressure, resulting in lower speed of sound values. This slope changes around 1500 psi where the speed of sound begins to increase as the pressure rises. At the 100 °F temperature range, lower speed of sound values are present, following a similar trend as the 200 °F and 300 °F temperature ranges. A sharp increase in the speed of sound is measured as the pressure surpasses 1500 psi at 100 °F, displaying a distinctly greater slope than those of the higher temperatures, seen in Figure 6-3. This trend could be a result of the gas mixture approaching the critical point of CO2, the point at which CO2 begins to display characteristics of both a gas and a liquid. This phenomenon could explain why there is a relatively large and sharp increase of the speed of sound as the gas mixture crosses into the critical and supercritical regions. When the gas is heated to 200 °F and 300 °F, the mixture is no longer near the critical point throughout the pressure range, resulting in a less extreme trend.
11
Figure 6-1. Density Measurement Results: Mix A
Figure 6-2. Density Measurement Results: Mix C
12
Figure 6-3. Speed of Sound Measurement Results: Mix A
Figure 6-4. Speed of Sound Measurement Results: Mix C
13
7. CONCLUSIONS
To compare the experimental test data with EOS model predictions, the measured temperature and pressure conditions were used to predict the density and speed of sound values according to the GERT and default NIST equation of state. All modeling was performed using NIST REFPROP software, which provides both EOS model outputs.
Although some variation in test results is noted due to the test uncertainty, there are specific trends which are notable for the mixtures and particular test conditions. The following observations can be made regarding the use of the GERG or default NIST EOS model for mixtures similar to those in this test campaign.
The GERG and default NIST EOS models predict similar density and speed of sound values for all of the mixtures for most test points. The largest deviation for density predictions between the two EOS models is 0.54% kg/m3 for Mix A, 1.72% kg/m3 for Mix B, and 0.21% kg/m3. Generally, the GERG EOS model predicted slightly lower density values for pressure points of 200 psi and 2500 psi among all temperatures for Mix A and B when compared to the NIST EOS model. For Mix C, the GERG EOS model predicted slightly higher density values for the majority of test points when compared to the NIST EOS Model. The largest deviation for speed of sound predictions between the two EOS models is 0.28% ft/s for Mix A, 0.03% ft/s for Mix B, and 0.19% ft/s for Mix C. Overall, the GERG EOS model predicted both slightly lower and higher speed of sound values equally across all of the mixtures and pressure and temperature points.
The GERG and default NIST EOS models match the experimental data for density within +/- 4% for the majority of test runs. For Mix A at lower pressures (200 psi) in the test runs, the EOS models exceeded the measurements close to 7% at the maximum for temperatures at 200 °F and 300 °F. At higher pressures, those within the supercritical regime, the EOS models predicted relatively lower values of density than what were experimentally calculated for both Mix A and B. For Mix C, measured values of density match those of the EOS model predictions within the total uncertainty for all pressures at 100 °F and 200 °F. For the 300 °F test runs, the EOS models predicted notably lower values of density than what were measured for all of the tested pressures of Mix C. In general, the deviation between EOS model predictions and test measurements increased with pressure; with the EOS models predicting lower values of density as the pressure increased across all tested temperatures with Mix A and B.
The GERG and default NIST EOS models match the experimental data for speed of sound within +/- 5% for Mix A with the greatest deviations presented in the 100 °F and 200 °F ranges. Similar results are seen for Mix B, with the greater deviations of the EOS models from the measured values present in the 100 °F and 200 °F ranges with the greatest difference of roughly 5%. For Mix C, the GERG and default EOS models match the experimental data for speed of sound within +/- 8% with the greatest deviations presented in the 100 °F and 200 °F ranges, similar to the other mixtures tested. Based upon the test performed, the EOS models predicted notably lower values of speed of sound than the experimental value for the majority of test points for all three mixtures. Similarly to the density measurements, the speed of sound measurements deviate the least from the EOS models for the 300 °F test points for all three mixtures, within the total uncertainties of the measurements.
8. REFERENCES
[1] Fan, Z., Fout, T., Seltzer, A. H.: An Optimized Oxygen-Fired Pulverized Coal Power Plant for CO2 Capture. International Pittsburgh Coal Conference, Pittsburgh, PA, Sept. 12-15, 2005.
[2] Gampe, U., Hellfritsch, S.: Modern Coal-Fired Oxyfuel Power Plants with CO2 Capture-Energetic and Economic Evaluation. ENERDAY Workshop on Energy Economics and Technology. Dresden, 2007.
14
[3] Huber M.L., Lemmon, E.W., McLinden, M.O. (2010): REFPROP (Reference Fluid Thermodynamic and Transport Properties). NIST Standard Reference Database 23, Version 9.0.
[4] National Energy Technology Laboratory, U.S. Department of Energy. Quality Guidelines for Energy System Studies: CO2 Impurity Design Parameters (January 2012): COE/NETL-341/011212.


![PRESSURE ACTIVATED LEAF SEAL TECHNOLOGY …sco2symposium.com/papers2014/turbomachinery/22-Grondahl.pdfRegarding gas turbine high pressure packing (HPP) labyrinth seals Johnston [7]](https://static.documents.pub/doc/80x56/607c34bf102f8b4dd64a7ecd/pressure-activated-leaf-seal-technology-regarding-gas-turbine-high-pressure-packing.jpg)