High pulse drain impact on CR2032 coin cell battery capacity By Kjartan Furset, Strategic Applications Manager, Nordic Semiconductor Peter Hoffman, Energizer ® ABSTRACT Ultra low power wireless connectivity is being added to an ever-greater number of coin cell battery-powered applications. Calculating the battery lifetime of such a product is always important, but how is the capacity of the battery affected by the usage pattern? This article shows how the high peak, but short duration pulsed loads typical of ultra low power wireless applications affect Energizer ® CR2032 coin cell batteries and how your design and operation affects the battery life time you can expect in your application. Introduction Wireless communication is a feature that is added to an ever-greater number of battery-powered applications. The use of Wi-Fi ™ to interface with Internet servers and cloud services are now a default option for most consumer electronics products. Extending wireless connectivity to offer sensor and user input/feedback on Internet-enabled devices, as well as to new applications where Internet connectivity improves the usability and/or reduces maintenance needs are happening at an ever- increasing rate. That this is a rapidly growing market segment is also clearly visible through the several open standards and special interest groups that have recently made additions to their standards to address the needs for small, lower complexity and especially lower power, wireless network solutions. ANT+ ™ , Bluetooth ® v4.0, ZigBee ® and Wi-Fi ™ are all wireless standards with either a specific focus on– or recent additions addressing–simpler but low power or ultra low power wireless technologies. The different technologies can roughly be split into the following categories: Low power (average current consumption in a node 5-50+ mA): • Wi-Fi ™ direct • ZigBee ® • Bluetooth ® versions prior to v4.0. Ultra low power (average current consumption <1 mA) • ANT+ ™ • Bluetooth ® v4.0 (which includes Bluetooth ® low energy as a hallmark feature). In the 1-5 mA range there is an overlap since a low power standard can operate in this range if the activity/data throughput is low enough while the ultra low power standards will enter it if data throughput is maximised. This segmentation also roughly corresponds to the applications that can use the different standards. Due to the limited data transfer capacity, ultra low power standards are mainly used in applications where the data throughput demand is low (< 100 kbps) such as in sensor & actuator networks, user control input and for limited size file transfers. Lithium coin cell batteries, traditionally used for watches and other extremely low power applications, are the battery technology of choice for most of these ultra low power wireless
Transcript
High pulse drain impact on CR2032 coin cell battery capacity
Ultra low power wireless connectivity is being added to an ever-greater number of coin cell battery-powered applications. Calculating the battery lifetime of such a product is always important, but how is the capacity of the battery affected by the usage pattern?
This article shows how the high peak, but short duration pulsed loads typical of ultra low power wireless applications affect Energizer® CR2032 coin cell batteries and how your design and operation affects the battery life time you can expect in your application.
Introduction
Wireless communication is a feature that is added to an ever-greater number of battery-powered applications. The use of Wi-Fi™ to interface with Internet servers and cloud services are now a default option for most consumer electronics products. Extending wireless connectivity to offer sensor and user input/feedback on Internet-enabled devices, as well as to new applications where Internet connectivity improves the usability and/or reduces maintenance needs are happening at an ever-increasing rate.
That this is a rapidly growing market segment is also clearly visible through the several open standards and special interest groups that have recently made additions to their standards to address the needs for small, lower complexity and especially lower power, wireless network solutions. ANT+™, Bluetooth® v4.0, ZigBee® and Wi-Fi™ are all wireless standards with either a specific focus on–or recent additions addressing–simpler but low power or ultra low power wireless technologies.
The different technologies can roughly be split into the following categories:
Low power (average current consumption in a node 5-50+ mA):
• Wi-Fi™ direct • ZigBee® • Bluetooth® versions prior to v4.0.
Ultra low power (average current consumption <1 mA)
• ANT+™ • Bluetooth® v4.0 (which includes Bluetooth® low energy as a hallmark feature).
In the 1-5 mA range there is an overlap since a low power standard can operate in this range if the activity/data throughput is low enough while the ultra low power standards will enter it if data throughput is maximised.
This segmentation also roughly corresponds to the applications that can use the different standards. Due to the limited data transfer capacity, ultra low power standards are mainly used in applications where the data throughput demand is low (< 100 kbps) such as in sensor & actuator networks, user control input and for limited size file transfers.
Lithium coin cell batteries, traditionally used for watches and other extremely low power applications, are the battery technology of choice for most of these ultra low power wireless
applications today. These batteries are simple to fit in small enclosures and replacements are easily accessible for the end user.
But to be able to operate with an acceptable battery lifetime, even the ultra low power standards, ANT+™ and Bluetooth® low energy, must be implemented with some care.
The basic equation for battery life is:
Battery lifetime (h) = Battery capacity (mAh) / Average current consumption (mA)
Everyone involved with ultra low power wireless solutions commonly spends a lot of time making sure the average current consumption in their application is as low as possible. But, focusing only on the average current assumes that the battery capacity found in a battery data sheet is fixed for all conditions.
Unlike traditional coin cell applications, which continuously draw a stable current, a wireless application subjects the battery to a very different usage pattern. When the radio circuitry is activated it can draw anywhere from 10-80 mA, depending on technology, vendor and implementation. This drain far exceeds the rated drain current condition (~200 uA for a CR2032) for which the battery capacity is stated in the battery data sheet.
This article shows how high peak, but short duration pulsed loads affect Energizer® CR2032 coin cell batteries. (The CR2032 is the most commonly used lithium coin cell in ultra low power wireless applications.) For this article Energizer®’s Application Support Team, in cooperation with Nordic Semiconductor, has conducted tests on Energizer® CR2032 coin cells using relevant scenarios typical of ANT+™ and Bluetooth® low energy applications. As the article will show, these effects are essential to include when estimating battery lifetime and to decide if a CR2032 indeed is the correct battery size for the application. The goal of this article is to make you aware of how lithium coin cell batteries perform in wireless applications. (For help with your specific application please contact Energizer®’s Application Support Team. Email [email protected].)
Let us first take a look at the lithium coin cell battery technology and the important battery parameters you need to be familiar with.
Lithium coin cell technology
A battery is a device that converts chemical energy into electrical energy. The lithium coin battery (for example, a CR2032) has a lithium metal anode and a manganese dioxide (MnO2) cathode. The battery has a polypropylene separator and an electrolyte comprised of a lithium salt compound in an organic solvent. The chemical reaction is Li + MnO2 -> LiMnO2. The cross section view of a CR2032 in figure 1 shows how coin cells are typically constructed. The Li/MnO2 chemical system generates a nominal voltage of 3V.
Figure 1: Lithium coin cell cross section
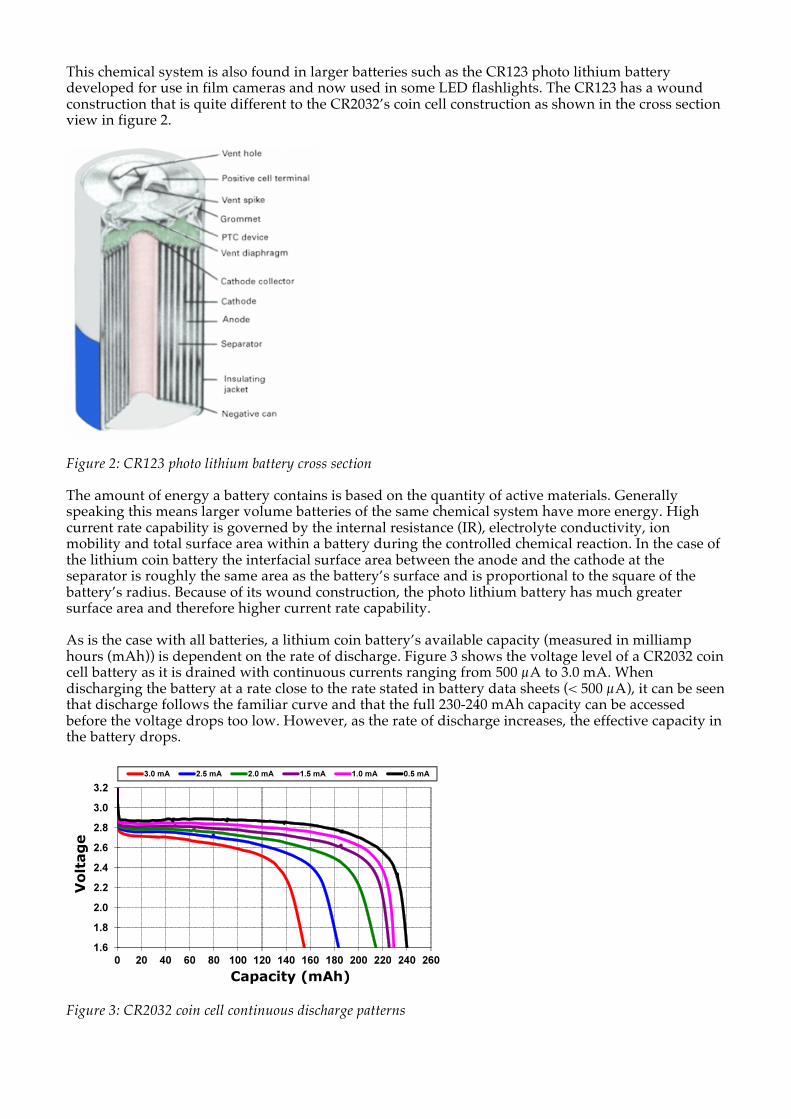
This chemical system is also found in larger batteries such as the CR123 photo lithium battery developed for use in film cameras and now used in some LED flashlights. The CR123 has a wound construction that is quite different to the CR2032’s coin cell construction as shown in the cross section view in figure 2.
The amount of energy a battery contains is based on the quantity of active materials. Generally speaking this means larger volume batteries of the same chemical system have more energy. High current rate capability is governed by the internal resistance (IR), electrolyte conductivity, ion mobility and total surface area within a battery during the controlled chemical reaction. In the case of the lithium coin battery the interfacial surface area between the anode and the cathode at the separator is roughly the same area as the battery’s surface and is proportional to the square of the battery’s radius. Because of its wound construction, the photo lithium battery has much greater surface area and therefore higher current rate capability.
As is the case with all batteries, a lithium coin battery’s available capacity (measured in milliamp hours (mAh)) is dependent on the rate of discharge. Figure 3 shows the voltage level of a CR2032 coin cell battery as it is drained with continuous currents ranging from 500 µA to 3.0 mA. When discharging the battery at a rate close to the rate stated in battery data sheets (< 500 µA), it can be seen that discharge follows the familiar curve and that the full 230-240 mAh capacity can be accessed before the voltage drops too low. However, as the rate of discharge increases, the effective capacity in the battery drops.
The accessible capacity–referred to as the Functional End Point (FEP)–will also be dependent on the voltage level. This is the minimum voltage level the electronic circuitry can operate at and is therefore a parameter you decide when choosing active components for your application. Let’s assume that your application has an FEP of 2.0V. As seen in Figure 3, at 500 µA a CR2032 can deliver its full capacity of 240 mAh before reaching this FEP. But if the battery is drained at 2.5 mA, the FEP is reached after 175 mAh of the battery capacity is used.
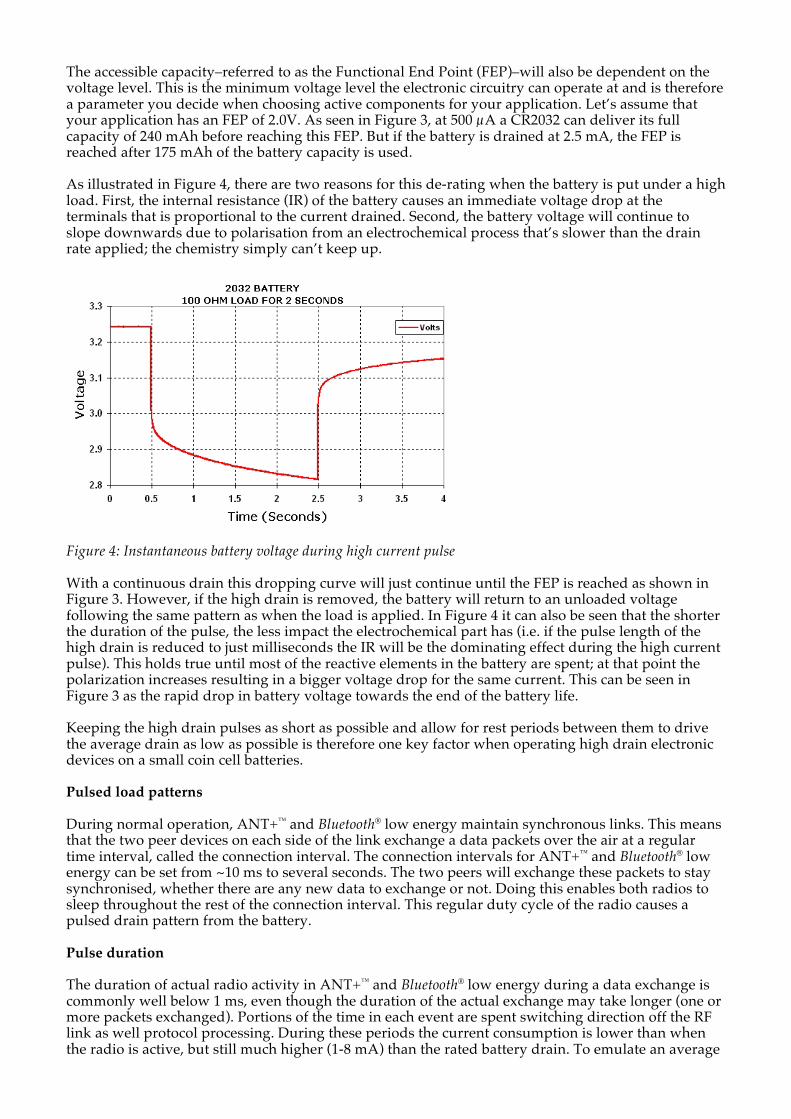
As illustrated in Figure 4, there are two reasons for this de-rating when the battery is put under a high load. First, the internal resistance (IR) of the battery causes an immediate voltage drop at the terminals that is proportional to the current drained. Second, the battery voltage will continue to slope downwards due to polarisation from an electrochemical process that’s slower than the drain rate applied; the chemistry simply can’t keep up.
Figure 4: Instantaneous battery voltage during high current pulse
With a continuous drain this dropping curve will just continue until the FEP is reached as shown in Figure 3. However, if the high drain is removed, the battery will return to an unloaded voltage following the same pattern as when the load is applied. In Figure 4 it can also be seen that the shorter the duration of the pulse, the less impact the electrochemical part has (i.e. if the pulse length of the high drain is reduced to just milliseconds the IR will be the dominating effect during the high current pulse). This holds true until most of the reactive elements in the battery are spent; at that point the polarization increases resulting in a bigger voltage drop for the same current. This can be seen in Figure 3 as the rapid drop in battery voltage towards the end of the battery life.
Keeping the high drain pulses as short as possible and allow for rest periods between them to drive the average drain as low as possible is therefore one key factor when operating high drain electronic devices on a small coin cell batteries.
Pulsed load patterns
During normal operation, ANT+™ and Bluetooth® low energy maintain synchronous links. This means that the two peer devices on each side of the link exchange a data packets over the air at a regular time interval, called the connection interval. The connection intervals for ANT+™ and Bluetooth® low energy can be set from ~10 ms to several seconds. The two peers will exchange these packets to stay synchronised, whether there are any new data to exchange or not. Doing this enables both radios to sleep throughout the rest of the connection interval. This regular duty cycle of the radio causes a pulsed drain pattern from the battery.
Pulse duration
The duration of actual radio activity in ANT+™ and Bluetooth® low energy during a data exchange is commonly well below 1 ms, even though the duration of the actual exchange may take longer (one or more packets exchanged). Portions of the time in each event are spent switching direction off the RF link as well protocol processing. During these periods the current consumption is lower than when the radio is active, but still much higher (1-8 mA) than the rated battery drain. To emulate an average
of typical data exchanges in ANT+™ and Bluetooth® low energy, a pulse length of 1ms is used in the tests described below.
Pulse period
To find a relevant pulse period for the tests we must look at how the two standards operate in different modes.
When two peer devices have established a connection, the period of the pulsed load depends on the connection interval used. For ANT+™ and Bluetooth® low energy standards, suitable connection intervals are outlined in the device profile specifications. Common connection intervals (= pulse periods) for sensors are 100 – 1000 ms and for user interface devices the connection interval is in the 10-50 ms range.
If the two peer devices don’t have a synchronous link, they must establish it before data can be exchanged. This means one device must start transmitting a beacon to tell the other it is there. The peer must listen (radio on in receive mode) to see if another device is sending a beacon. This beacon/listening action must be repeated until the two devices are ‘on’ on the same frequency channel and at the same moment in time, enabling them to exchange data.
ANT+™ link establishment:
• The peripheral device (usually the small coin cell powered accessory) starts sending beacons on the predefined connection interval rate (i.e. link up = connection);
• The central device (device collecting the sensor data) enters a search mode. It listens for about 1 ms every 10 ms, giving a pulse period of 10 ms.
Bluetooth® low energy link establishment:
• The peripheral device sends beacons every 20-30 ms; o If the peripheral can’t find a peer within 30 s, it changes to sending a beacon every 1–
2.5 s; • The central device will listen with a duty cycle of 50-100 % for 30 s. No particular directions
are given in the standard for pulse duration and period; o After 30 s it will also go down to listen only once every 1–2.5 s.
During a normal lifetime of a product the radios in each device will switch between the described modes as they need to:
• Setting up a connection; o User has just turned the system on;
• Normal communication; • Re-establish a lost connection;
o User have brought the peer devices out of range; o User have turned off one of the devices; o Strong interference from other wireless products breaks the link.
As the devices changes between these modes, the radio activity changes too. Running a wireless link with connection intervals of 500 ms gives a much longer pulse period and lower average current drain than sending beacons every 20-30 ms.
What impact will changing between these modes have on the battery life?
Battery capacity vs. pulse duty cycle
The graphs in Figure 5 show the average drain rates of CR2032 cells when subjecting them to pulse drains of 30 mA with different pulse periods.
Figure 5: Battery drain vs. Pulse duty cycle for CR2032
Here we can clearly see the difference in battery voltage when the battery is subjected to the 30 mA pulse (Vload) and the voltage between the pulses (Vidle). Figure 5(A) shows that if the battery is subject to a 30 mA pulse load every 10 ms (similar to the shortest connection intervals for ANT+™ and Bluetooth® low energy) it has a severe impact on the likely battery capacity. Following the Vload curve in Figure 5(A) it can be see that during the pulses a 2.0 V FEP will be reached after approximately 125 mAh of the battery capacity is spent, essentially halving the nominal CR2032 battery capacity specified in the data sheet.
The continuous current curve in Figure 5(A) shows the battery drain curve of a continuous current similar to the average drain current of the pulsed load. And as is evident this high drain current severely limits the battery capacity whether the drain is continuous or pulsed.
Interestingly, the Vidle curve follows the continuous drain, meaning that between the pulses the battery will recover to a voltage similar to what the battery will give if it’s subjected to a continuous current similar to the average current. But only up to a point, because as the chemistry in the battery is spent the battery will no longer be able to keep up the high drain during the pulses and the Vload drops off rapidly due to increased polarisation in the battery. The Vidle voltage will follow Vload because the lack of active materials in the battery also affects the recovery speed between pulses. While the battery voltage with the pulsed load drops off, the continuous current can drain the battery for longer. This shows the impact of loading the battery with high pulses rather than a continuous load even though the average current of the pulsed and continuous drain are the same.
As the pulse period is extended in Figures 5(B) and (C) the average current consumption drops and more battery capacity can be utilised. But as the battery capacity approaches 200 mAh, the battery is no longer able to keep up with the high peak current, and once this limit is reached, extending the pulse period further actually doesn’t give increased battery capacity. Figure 5(D) shows that even with a further extended pulse period, the average capacity is actually slightly lower than in Figure 5(C).
Figure 6: Standard deviation envelope of 25 ms and 75 ms pulse periods on CR2032
This may seem counter-intuitive as lower average current should give more capacity; but looking at the deviation across the tests, shown in Figure 6, it can be seen that the deviation in drain curves of the different batteries tested at 25 and 75 ms pulse periods overlap to a large degree. From this it can be concluded that the battery-to-battery variation in ‘end of life’ performance when subjecting the cells to relatively high loads are significant.
So, what does this mean for your application?
Beyond the clear fact that subjecting any CR2032 to a ‘too high’ average (or continuous) drain will reduce the battery capacity (as already established in Figure 3), the high current in the pulses adds a further drop in the battery capacity than might otherwise be expected. There is one more observation that can be done. Let’s go back to the application with an FEP of 2.0 V and assume that 150 mAh of battery capacity has been spent operating in a connected link draining a low average current of 0.5 mA or less (pulse >75 ms).
Figure 7: CR2032 Battery voltage during 30 mA pulse load
Following the 75 ms curve in Figure 7 shows that at 150 mAh, the battery voltage during load is still at 2.2V, and there is still about 25 mAh capacity left. But if the wireless device needs to enter link up mode or other circuitry (for example, an LED) is turned on, the pulse interval may suddenly be reduced; the drain characteristic will now follow one of the shorter pulse period curves. To illustrate the point, let’s assume the application changes to a 10 ms pulse period. After 150 mAh of capacity has been drained, the battery won’t be able to sustain this current increase. The 10 ms curve in Figure 7 shows that the battery is beyond the 2.0 V FEP when supplying a pulse every 10 ms, and the application will fail/reset.
Therefore, the shortest pulse period encountered by the application is the one that must be used for battery lifetime estimates.
Battery capacity vs. peak currents
The other contributor to the battery drain is the peak current during the pulses. Since the maximum capacity of the battery can be achieved with pulse periods of 25 ms or longer, this test was run with a pulse period of 25 ms and varying peak drains. The maximum peak current is dependent on the peak current drawn by the wireless application as well as other ‘high current’ devices (for example, LEDs, LCDs and sensors) used in the application.
Figure 8: Battery drain patterns vs. Peak current level for CR2032
Figure 8(A) shows the drain curves when subjecting the battery to an 80 mA pulsed drain. With this peak current it can be clearly seen the battery is challenged by both the high peak current and the high average current. The 2.0 V FEP is reached after approximately 70 mAh. As the peak current drops in Figure 8(B) and further in (C) it can be seen that the capacity increases towards the 180-200 mAh also observed in the previous test. If the peak current drops further, as shown in Figure 8(D), the 2.0 V FEP creeps closer to 200 mAh , but even at 10 mA the peak drain is still too high for the battery to be able to deliver the full 240 mAh capacity specified in the data sheet.
Figure 9: Pulse magnitude impact on battery capacity for CR2032
Figure 9 shows that, as long as the application can be designed with a FEP of 2 V or lower, and peak currents lower than 30 mA, the battery capacity loss is ‘manageable’, providing around 175-185 mAh. But if the FEP is higher (> 2.0V), the impact from the higher peak current rapidly increases. For example, if the application has a FEP = 2.4 V the battery can still deliver 175 mAh when the peak current is restricted to around 10 mA, but the capacity drops to 100 mAh if the peak current is around 30 mA.
Therefore, when designing for coin cell operation it is important to choose active devices (ICs) with as low peak current and FEP as possible. Note that this applies to all devices in the application not only the wireless device. If the design includes a device with a minimum supply voltage of 2.4 V, that device determines the FEP, regardless of the minimum supply voltage of the wireless device. This also applies if the 2.4 V device is IDLE during the wireless operation (the pulse) because configurations in the 2.4 V device may be lost if the supply voltage drops too low.
Once components have been selected, it’s critical to control when each of them is active. An application may have several devices drawing currents in the mA range (for example, the RF chip, LEDs, LCD backlights and sensor ICs). Since the drain from the battery will always be the sum of all devices, not controlling when each of them loads the battery may quickly bring the total pulse load up to 50-80 mA (as shown in Figure 8(A) and (B)).
It’s important to remember that good power management has an effect on performance as well. As shown above (Figure 4) there is an instantaneous transient on the supply voltage when a ‘high peak current device’ turns ON or OFF. Analogue functionality like sensor front ends and, indeed, the radio itself may be sensitive to large transients on the power supply at the wrong time. A large transient on the power supply while the radio is receiving a packet may corrupt the reception, and if it happens regularly it will show itself as poor and unstable range in the wireless application. This can be remedied by proper decoupling, but removing the problem through good design will produce a better product and a lower bill of material (BoM).
Battery IR
To estimate the impact of the pulse period and peak current in an application using the IR of the battery to calculate the battery voltage during load is a good first approximation. But since the IR is found through measuring Vload and Vidle for a specific current it is influenced by a range of battery parameters, so how stable is it?
In Figure 5 and Figure 8 the equivalent IR of the batteries in each test are plotted. The IRs found in these tests as well as the IR from the pulse example (6.8 mA peak, 2 s pulse length, 12 times/day) in the Energizer® CR2032 data sheet are summarised in Figure 10.
Figure 10: CR2032 IR
As the graph shows, the IR stays quite consistent across pulse periods and peak currents. The IR found in these tests is generally lower than the one given in the data sheet. This is as expected with the shorter pulses and consequently less polarization in the battery. Given the consistent IR across these tests it can be assumed that a similar IR also holds for other ANT+™ and Bluetooth® low energy use cases.
Summary
When designing for operation from lithium coin cells it is important to know the strengths and weaknesses of the battery and design accordingly. Coin cells can deliver very high peak currents, but not without a drop in supply voltage and consequently a lower margin to the FEP and resulting degradation of available battery capacity.
When designing for coin cell battery operation:
1. Know that the battery capacity you find in a battery data sheet will change depending on the drain pattern to which it is subjected;
2. Actions to maximise your battery lifetime: a. Maximise your FEP margin:
i. Choose active devices (ICs) that have as low minimum supply voltage as possible;
b. Minimise your current drain: i. Choose devices with the lowest peak current;
ii. Design your power management to prevent multiple high drain devices (RF chip, LEDs, LCDs etc.) loading the battery at the same time;
3. Identify the worst case drain in the application: a. In which mode of operation is the activity highest and therefore the battery drain the
highest? b. Search (wireless) IC data sheets for average currents during normal operation and link
up to get an early idea; c. If the high current modes can be entered at any time during the lifetime of the battery,
this is the mode that must be used for battery lifetime estimates; 4. Use the test results in this article as a reference to estimate your corrected battery capacity; 5. Using this corrected battery capacity and the application’s highest average current
consumption to estimate the worst case battery lifetime according to the following formula:
Battery life (h) = Corrected battery capacity (mAh) / IAVERAGE MAX (mA)
a. Note that as long as your application can stay in a mode with a lower average current consumption it will be able to operate longer, but depending on how much battery capacity is left, it may fail once it enters a mode with higher average current consumption;
6. Finally, remember that these rules apply for any high peak but pulsed battery load, not only wireless/RF circuitry. The high peak pulsed loads could also be from any combination of LEDs, vibrating motors, piezoelectric buzzers, LCD backlights and so on.
APPENDIX A Lithium Coin Ingestion J. Eager Revised: September 14, 2011 Energizer® is working with others in the industry to increase awareness of an important safety issue with regards to lithium coin cell batteries. These coin-sized button batteries can lodge in the throats of children when swallowed and cause serious harm, and even death. The saliva immediately triggers an electrical current that causes a chemical reaction that can severely burn the esophagus in as little as two hours. As more electronic devices using lithium coin cell batteries become a part of daily life, the number of severe injuries resulting from accidental ingestions of these batteries by young children is increasing. Energizer®, working with the battery industry, has supported the National Capital Poison Center to gain an understanding of the batteries’ reaction when accidentally swallowed. Energizer® is also reaching out to electronics designers and manufacturers to share information on the risks and ways that they can help address this problem. The main recommendation for device manufacturers is to secure the battery compartment to deter small children from gaining access to these batteries. Safe Kids USA and Energizer® are also forming a critical partnership to help educate consumers on the risks and the steps they can take to protect children. For further information regarding this topic and recommendations for designing the battery compartments, please contact Joe Kelling of Energizer® Application Support at [email protected]. --- Kjartan Furset can be contacted on [email protected]
Energizer® and other marks are trademarks of Eveready Battery Company, Inc. ANT+™ is a registered trademark of ANT Wireless, a division of Dynastream Innovations Inc. Wi-Fi™ is a registered trademark of the Wi-Fi Alliance. ZigBee® is a registered trademark of the ZigBee Alliance. Bluetooth® is a registered trademark of the Bluetooth SIG