42
High-R Walls for New Construction Structural Performance: Integrated Rim Header Testing A. DeRenzis, V. Kochkin, and J. Wiehagen NAHB Research Center January 2013

High-R Walls for New Construction Structural Performance: Integrated Rim Header Testing A. DeRenzis, V. Kochkin, and J. Wiehagen NAHB Research Center
January 2013

NOTICE
This report was prepared as an account of work sponsored by an agency of the United States government. Neither the United States government nor any agency thereof, nor any of their employees, subcontractors, or affiliated partners makes any warranty, express or implied, or assumes any legal liability or responsibility for the accuracy, completeness, or usefulness of any information, apparatus, product, or process disclosed, or represents that its use would not infringe privately owned rights. Reference herein to any specific commercial product, process, or service by trade name, trademark, manufacturer, or otherwise does not necessarily constitute or imply its endorsement, recommendation, or favoring by the United States government or any agency thereof. The views and opinions of authors expressed herein do not necessarily state or reflect those of the United States government or any agency thereof.
Available electronically at http://www.osti.gov/bridge
Available for a processing fee to U.S. Department of Energy and its contractors, in paper, from:
U.S. Department of Energy Office of Scientific and Technical Information
P.O. Box 62 Oak Ridge, TN 37831-0062
phone: 865.576.8401 fax: 865.576.5728
email: mailto:[email protected]
Available for sale to the public, in paper, from: U.S. Department of Commerce
National Technical Information Service 5285 Port Royal Road Springfield, VA 22161 phone: 800.553.6847
fax: 703.605.6900 email: [email protected]
online ordering: http://www.ntis.gov/ordering.htm
Printed on paper containing at least 50% wastepaper, including 20% postconsumer waste

iii
High-R Walls for New Construction Structural Performance: Integrated Rim Header Testing
Prepared for:
The National Renewable Energy Laboratory
On behalf of the U.S. Department of Energy’s Building America Program
Office of Energy Efficiency and Renewable Energy
15013 Denver West Parkway
Golden, CO 80401
NREL Contract No. DE-AC36-08GO28308
Prepared by:
A. DeRenzis, V. Kochkin, and J. Wiehagen
NAHB Research Center
400 Prince George’s Blvd.
Upper Marlboro, MD 20774
NREL Technical Monitor: Stacey Rothgeb
Prepared under Subcontract No. KNDJ-0-40335-00
January 2013

iv
[This page left blank]

v
Contents List of Figures ............................................................................................................................................ vi List of Tables .............................................................................................................................................. vi Definitions .................................................................................................................................................. vii Executive Summary ................................................................................................................................. viii 1 Problem Statement ............................................................................................................................... 1
1.1 Introduction ..........................................................................................................................1 1.2 Background ..........................................................................................................................2 1.3 Relevance to Building America’s Goals ..............................................................................2 1.4 Cost Effectiveness ................................................................................................................2 1.5 Tradeoffs and Other Benefits ...............................................................................................2
2 Experiment ............................................................................................................................................ 4 2.1 Research Questions—Rim Header ......................................................................................4 2.2 Technical Approach—Rim Header ......................................................................................4
2.2.1 Specimen Construction ............................................................................................6 2.3 Measurements—Rim Header .............................................................................................13
2.3.1 Test Setup and Protocol .........................................................................................13 2.4 Equipment—Rim Header ...................................................................................................14
3 Analysis ............................................................................................................................................... 19 3.1 Analysis of Results ............................................................................................................19
3.1.1 Stage 1 Results .......................................................................................................19 3.1.2 Stage 2 Results .......................................................................................................19 3.1.3 Stage 3 Results .......................................................................................................23 3.1.4 Stage 4 Results .......................................................................................................27
3.2 Example Design Calculation ..............................................................................................27 4 Conclusions ........................................................................................................................................ 28 References ................................................................................................................................................. 29 Appendix A ................................................................................................................................................ 30

vi
List of Figures Figure 1. Stage 1 specimen construction and test set-up ...................................................................... 9 Figure 2. Lower portion of a typical Stage 2, 3 and 4 test specimen ................................................... 11 Figure 3. Typical Stage 2 and 4 test specimen ...................................................................................... 12 Figure 4. Typical Stage 2 and 4 test set-up ............................................................................................ 15 Figure 5. Typical Stage 3 test set-up ....................................................................................................... 16 Figure 6. Stage 1 test setup ..................................................................................................................... 17 Figure 7. Stage 2 test setup ..................................................................................................................... 18 Figure 8. Stage 1 test results ................................................................................................................... 19 Figure 9. Stage 2 rough opening top member midspan deflections (exterior face) .......................... 20 Figure 10. Stage 2 rough opening top member midspan deflections (interior face) ......................... 20 Figure 11. Stage 2 average movement of joist hangers relative to rim header .................................. 21 Figure 12. Stage 2 bearing deformations of top plate (exterior edge) ................................................. 22 Figure 13. Stage 2 bearing deformations of top plate (interior edge) ................................................. 22 Figure 14. Bearing deformations and simplified stress distribution at king stud-to-top plate
interface ............................................................................................................................................... 23 Figure 15. Stage 3 rough opening top member midspan deflections (exterior face) ........................ 24 Figure 16. Stage 3 rough opening top member midspan deflections (interior face) ......................... 24 Figure 17. Stage 3 average movement of joist hangers relative to rim header .................................. 25 Figure 18. Stage 3 bearing deformations of top plate (exterior edge) ................................................. 26 Figure 19. Stage 3 bearing deformations of top plate (interior edge) ................................................. 26 Unless otherwise indicated, all figures were created by NAHB. List of Tables Table 1. Individual Hanger Testing Matrix ................................................................................................ 5 Table 2. Rim Header System Testing Matrix ............................................................................................ 5 Table 3. Individual Hanger Construction Materials ................................................................................. 7 Table 4. Rim Header System Testing Construction Materials ................................................................ 7 Table 5. Nailing Schedule—Rim Header ................................................................................................... 8 Table 6. Load Levels for Stage 2 Tests—Rim Header ........................................................................... 13 Table 7. Load Levels for Stage 3 Tests—Rim Header ........................................................................... 13
Unless otherwise indicated, all tables were created by NAHB.

vii
Definitions
2 × 4 Nominal 2 in. wide by 4 in. depth framing lumber dimension
2 × 6 Nominal 2 in. wide by 6 in. depth framing lumber dimension
Advanced framing An optimized framing system to reduce extraneous framing members while maintaining structural integrity with the goals of increased thermal performance and lower cost
Cb Bearing area factor, used in design of wood structural members
Ci Incising factor for dimensional lumber, used in design of wood structural members
Cm Wet service factor, used in design of wood structural members
Ct Temperature factor, used in design of wood structural members
DL Dead load
Fcperp Reference compression design value perpendicular to grain
Fcperp ‘ Adjusted compression design value perpendicular to grain
High-R wall Reference to wall systems generally having an R-value of 1.5 to 2.5 times that of current energy code requirements for a given climate zone
IRC International Residential Code
Joist hanger Steel hardware designed to provide attachment of floor joist to perpendicularly framed structural member
King stud Full height structural framing member adjacent to an opening that supports the structural rim header member above.
L/360 Code specified deflection limit for structural members supporting live load only, expressed as a fraction of the span length, L.
L/240 Code specified deflection limit for structural members supporting total design load, expressed as a fraction of the span length, L
LL Live load
LMPT Linear motion position transducer
OSB Oriented strand board
Pg Ground snow load
plf Pounds per linear foot
psf Pounds per square foot
SPF Spruce-Pine-Fir—lumber species
TJI Joist Structural wood framing member having an I-shaped cross section, manufactured by Weyerhaeuser.
viii
Executive Summary
The Building America Program takes two prominent approaches to construct higher R-value walls: larger dimension framing and exterior rigid foam insulation. These have had some success; however, for many production builders the cost of changing framing systems is high, so the changes have been slowly realized. Also, recent building code changes have raised some performance issues for exterior sheathing and raised heel trusses, for example, that indicates a need for continued performance testing of wall systems. Furthermore, some material use survey data have shown that often when builders are switching to 2 × 6 framing members, they commonly use of 16-in. o.c. spacing. The opportunity to (1) encourage the use of thicker framing systems for much higher R-value walls; (2) construct wall systems that optimize the framing use to reduce thermal breaks; and (3) extract opportunities to reduce costs, all remain high priorities for the Building America program, the NAHB Research Center Industry Partnership, and builders. Similarly for the use of exterior rigid sheathing, builders and researchers have investigated alternative bracing techniques to eliminate the use of wood structural sheathing in lieu of foam board sheathing. Structural characteristics, especially in the direction perpendicular to the sheathing, have been reevaluated for the building codes. These include pressure equalization issues across multiple layers of the wall system.
The combination of these issues, including limiting cost increases when switching to higher R-value wall systems, has prompted the need for structural testing and optimized wall framing designs. This report focuses primarily on laboratory testing that evaluates the structural performance of rim headers. This research and test activity will help to facilitate the designs of load-bearing wall systems that minimize or eliminate the use of traditional headers within the wall plane and considers dead and live loads as well as roof and floor loading. Overall goals are to develop framing system designs based on 2 × 6 framing members that simplify and limit cost increases when builders and remodelers switch from traditional 2 × 4 framing methodologies.
The testing methodology presented here evaluates structural rim header designs over openings up to 6 ft wide and applicable to one- and two-story homes. Roof loading is also considered, including snow depths in cold climate zones.
The integrated rim header system design successfully maintained window serviceability throughout typical residential service load levels from the floor, wall, and roof systems. No decrease in window operability was observed at any tested load levels, under either roof or floor loading. The rim header system also provided a continuous vertical load path for roof loading through the bearing walls above and into the rim member. Approximately 8% of the imposed roof load was transposed to the adjacent floor framing and joist hangers attached to the rim header. This load can easily be accounted for in the sizing of the joist hangers.

1
1 Problem Statement
1.1 Introduction The NAHB Research Center Building America industry team high-R wall system research focuses primarily on increasing the wall’s thermal performance and maintaining current constructability and affordability features. High-R wall system designs for residential construction have centered on reducing the framing factor of the wall system to allow more area for insulation materials. The ultimate goal is to promote options to substantially increase wall insulation by cost-effectively upgrading from 2 × 4 to 2 × 6 advanced framing.
Advanced framing techniques such as turn-stud corners and ladder blocking are the most common techniques for decreasing the framing factor, as they maintain the structural performance characteristics. More complex methods, such as the use of in-line (or stack) framing, facilitate 24-in. o.c. stud spacing. These advanced framing techniques are designed to reduce the lumber member count and the overall area of the wall that is made up of solid wood components (which have a much lower insulating value) by a factor of three or more. Although some of these techniques can apply to 2 × 4 framing, some (such as 24-in. o.c. stack framing) may require 2 × 6 framing members.
The switch to 2 × 6 framing to encourage use of 24-in. o.c. stud spacing has been an important part of high performance wall system design. A review of lumber use data for home construction1 indicates that the switch to 2 × 6 appears to be increasing; however, advanced framing techniques do not appear to be implemented as the increase is primarily with 2 × 6, 16-in. o.c. framing. The NAHB Research Center recognized this phenomenon, coupled with anecdotal evidence that some builders hesitate to switch to advanced 2 × 6 framing, and embarked on an effort to achieve a much higher level of optimization when switching to advanced framing designs. This effort was undertaken to minimize the cost increase in switching to advanced 2 × 6 framing and to increase the wall system’s energy performance level beyond new energy code requirements.
As part of the 2 × 6 advanced framing, framing might be reduced and insulation increased via an innovative rim header design that uses the rim joist member that is already present in a typical home as a structural member to support and transfer vertical loads around openings. This eliminates the need for structural headers within the wall plane. When combined with 2 × 6 framing, this advanced detail reduces the framing around openings without increasing the cost of framing materials.
This report summarizes research and technical findings that support advanced framing methods to increase opportunities for high-R walls to be used as a much more common construction method. It focuses primarily on testing an integrated rim header system for gravity loading, which addresses vertical load path and serviceability limits. Integrated rim headers will reduce framing factors that degrade the wall system’s thermal performance.
1 NAHB Research Center proprietary Builder Practices Survey based on data analyzed across multiple years for wall framing materials and spacing.

2
1.2 Background Research has been conducted into increasing wall insulation as a response to high performance homes and stricter energy codes (NAHBRC 2009-2, Straube 2011). The use and applicability of structural rim headers in residential construction are currently limited to individually engineered systems for each home, whereby the builder is required to bring a professional designer into the building process to design—and approve—the rim header system. This results directly from the lack of a prescriptive method in the current building codes for the use of rim header systems. Therefore, the NAHB Research Center, through the Building America program, embarked on an effort to validate design calculations to transfer the design loads without negative effects on the window opening. The evaluation was performed in conjunction with a national builder, K. Hovnanian, to incorporate the advanced header design option for one of its models. The results are summarized in a previous Building America deliverable (NAHB 2009-1). However, the initial evaluation focused primarily on the structural capacities of the rim member in the design of the specific prototype home.
1.3 Relevance to Building America’s Goals By providing the necessary testing and research to ultimately develop a prescriptive Builders’ Guide to Advanced Framing for 2 × 6 frame walls, the results of this research will provide necessary inroads to reducing the barriers to more energy-efficient, high-R wall systems that are available in the residential building industry. Rather than the typical engineered system approach that is common when optimizing framing designs, this testing will lead to more standardized approaches that can be prescriptively used in building codes. It is envisioned that the guide will facilitate and accelerate the adoption of 2 × 6 wall framing packages by builders across all types of homes and climate zones. The use of 2 × 6 wall framing packages will provide opportunities for increasing insulation from reduced framing materials within and reduced framing factors for the walls, both of which lead directly to higher R-value wall systems.
1.4 Cost Effectiveness The current trend of advanced framing toward the use of 2 × 6 framing at 16-in. o.c. inevitably results in a higher material cost of construction than that of 2 × 4 framing. This research will provide an alternative framing system with 24-in. o.c. stud spacing, headers in rim areas only, reduced jack and cripple members, and offset interior wall framing that will reduce the framing cost of the current 2 × 6 framing techniques by reducing the lumber count and eliminating header material. Perhaps more importantly, this research will reduce design and labor costs associated with switching to, and implementing, current advanced framing methods. Reductions in design costs will result from the builder’s ability to apply prescriptive solutions without hiring additional design professionals, and labor costs will decrease because framing will decrease, both in the greater stud spacing and in the removal of the headers in the wall framing.
1.5 Tradeoffs and Other Benefits This research focuses primarily on providing builders and remodelers with a more robust opportunity to construct higher R-value walls and to provide a basis for a range of wall system performance levels when various types of insulation are considered. This effort seeks to combine an increase in wall cavity thermal values with a decrease in thermal shorts that degrade the thermal performance. Consistent with Building America goals, this research also includes opportunities to reduce construction costs through material and labor savings. Labor savings result as much from the reduced structural elements that must be handled as from simplifying the

3
installation of products such as insulation and wiring. This research is also intended to result in a wall design that can be implemented with minimal additional training and has a strong connection to prescriptive methodologies already established in the building codes.
4
2 Experiment
This individual measure laboratory testing focused on integrating rim header designs into standard framing methodologies. Specific results detail the laboratory testing that measured the performance of integrated rim header system under gravity loading with a specific focus on (1) the load path through the members of the assembly and (2) the window serviceability limit states. The results address areas where engineering design principles are ambiguous or non-applicable to the integrated rim header system (e.g., system-effect contributions to deflection performance) and are intended to be used to develop prescriptive designs and details for the integrated rim header system.
2.1 Research Questions—Rim Header This testing is intended to provide results of rim header performance spanning a window opening to as much as 6 ft, and that may be applicable to a broad range of design parameters. Specifically, it addresses the following questions pertaining to the use of an integrated rim header system at the floor and spanning a 6-ft opening with 2 × 6 wall stud framing:
• What proportion of roof gravity load is imposed on the adjacent floor framing and joist hangers and what is the magnitude of the additional deflection, if any, on the top sill plate of the opening?
• How much deflection occurs in the top sill plate of the window opening as a result of floor gravity load at service load levels?
• How much can the top sill plate of the opening deflect before causing serviceability issues in the window?
• What is the bearing behavior at the king stud to top plate interface with a single top plate? 2.2 Technical Approach—Rim Header The testing methodology is organized by component and system and was conducted in four stages:
• Stage 1: Component testing of the floor joist/floor truss hangers. This was designed to isolate and evaluate the stiffness behavior of different types of hangers that can be used to connect floor framing members to rim member connections. The deflection behavior of each hanger type was evaluated and the hanger with the lowest stiffness (worst case) was selected for subsequent system testing (Stages 2–4).
• Stage 2: System testing of integrated rim header assembly with windows installed under roof/wall load. This evaluated the vertical load path from roof and walls supported by the integrated rim header, including the effect of the eccentricity in the load path at the second story wall-to-rim header interface. The distribution of the bearing load through the top plate and into the supporting king studs below was also evaluated. Finally, service load deflections were benchmarked and the window functionality under service loads was evaluated.

5
• Stage 3: System testing of integrated rim header assembly with windows installed under floor load. This established the deflection behavior of the joist hangers and rough opening top member subjected to floor gravity loads only. Combining the results from Stage 2 and Stage 3 testing provides the expected behavior of an in-situ rim header system (see Section 3). Again, the functionality of installed windows was evaluated at various service load levels.
• Stage 4: System testing of integrated rim header assembly under roof/wall load to failure. This provided the ultimate load capacity of the tested system.
Table 1 and Table 2 summarize the testing matrices.
Table 1. Individual Hanger Testing Matrix
Stage Joist Hanger Hanger Type
No. of Nails per Hanger
No. of Tests Purpose
1 IUS 2.06/11.88
Face-mounted 10 2 Compare stiffness
characteristics for different hanger types connecting floor
joists to the rim member. Results used to select hangers
for system testing.
1 ITS 2.37/11.88
Top-mounted 4 2
1 ITS 3.56/11.88
Top-mounted 4 2
1 MIU 3.56/11 Face-mounted 10 2
Table 2. Rim Header System Testing Matrix
Stage Load Test Label
Sample Size
Previous Load to
Specimen
Interior Gypsum
Max Test
Loads Purpose
2
Roof and wall load
A 1 Only
preload level
No Service
Evaluate load path between integrated
rim header and 2 × 6 wall framing. Also,
observe serviceability limits for windows in
combination with integrated rim header
system.
B 2 Full
loading protocol
No Service
Same as above but with previously tested specimen to evaluate the effects of repeated
loading
C 1 Full loading Yes Service Same as above but
with gypsum installed

6
Stage Load Test Label
Sample Size
Previous Load to
Specimen
Interior Gypsum
Max Test
Loads Purpose
protocol
3 Floor load
A 2 Only
preload level
No Service
Evaluate deflection of sill plate under floor
loading. Also, observe serviceability limits for windows in
combination with integrated rim header
system.
B 2 Full
loading protocol
No Service
Same as above but with previously tested specimen to evaluate the effects of repeated
loading
C 1 Full
loading protocol
Yes Service Same as above but with gypsum installed
4
Roof and wall load
C 1 Full
loading protocol
Yes Failure
Determine the ultimate capacity of the integrated rim
header system
2.2.1 Specimen Construction Table 3 and Table 4 summarize the materials used in specimen construction; Table 5 provides the nailing and connections schedule. The integrated rim member and supporting wall framing were designed to resist the loads at the first floor level of a 20-ft wide, 2-story home with a center bearing wall and a ground snow load (Pg) of 50 psf. This configuration represents the maximum loading scenario that an integrated rim header system with a single 1¼-in. by 11⅞-in. The TimberStrand LSL rim member can support over a span of 6 ft. A double rim member is required for greater roof/floor spans and/or greater. For this testing, a single rim header member configuration (versus a double member) was selected because the smaller associated reaction load-bearing area, along with the greater eccentricity of the single rim relative to the 2 × 6 framing above, create a conservative situation for evaluating the distribution of vertical roof and wall loads and deflection performance of the integrated rim header system. The results of this testing, however, will be applicable to the design of both the single and double rim member systems in terms of deflection and reaction load-bearing behavior.

7
Table 3. Individual Hanger Construction Materials
Member Construction Materials
Rim Joist 1¼-in. × 11⅞-in. TimberStrand LSL (1.3E product)
Joist Hangers
Simpson IUS 2.06/11.88 face-mounted hangers Simpson ITS 2.37/11.88 top-mounted hangers Simpson ITS 3.56/11.88 top-mounted hangers Simpson MIU 3.56/11 face-mounted hangers
Floor Framing Members
TJI 210 × 11⅞-in. I-joist TJI 230 × 11⅞-in. I-joist TJI 560 × 11⅞-in. I-joist
12 in. Deep floor truss with 2 × 4 SPF* #2 members
Joist Hangers to Rim Member Nailing
10d common (1.5 in. × 0.148 in.) installed per the test matrix and Simpson Strong-Tie Wood Construction
Connectors Catalogue
Table 4. Rim Header System Testing Construction Materials
Member Construction Materials Rim Joist 1¼-in. × 11⅞-in. TimberStrand LSL (1.3E product)
Floor Joists TJI 560 × 11⅞ I-joists, spaced 24-in. on center Joist Hangers Simpson ITS 3.56/11.88 top-mounted hangers
Floor Sheathing ¾-in. T&G OSB, split down the center with a T&G joint
Wall Framing
2 × 6 SPF stud grade in-line framing at 24-in. o.c. 2 × 6 SPF #2 grade plate material, single top plate
(2) king studs at each end of opening Single member at top of rough opening with infill
framing above Interior Wall Sheathing
(Stage 4 Only) ½-in. gypsum
Windows (2) Double-hung, vinyl windows for a rough opening of 6 ft wide × 3 ft tall, premulled together by manufacturer

8
Table 5. Nailing Schedule—Rim Header
Location Nailing Schedule Floor Sheathing to
Framing To rim: 8d (2.5-in. × 0.131-in.) nails at 6 in. o.c.
To floor joist: 8d (2.5-in. × 0.131-in.) nails at 12 in. o.c.
Interior Wall Sheathing to Framing (Stage 4 Only)
#6 drywall screws at 12 in. o.c., first row of screws started 8 in. from top of wall, no screw to top plate (floating joint
at top) Joist Hangers to Rim
Member (4) 10d common (1.5-in. × 0.148-in.) per Simpson Strong-
Tie Wood Construction Connectors Catalogue
Floor Joist to Wall Top Plate
(2) 8d (2.5-in. × 0.113-in.) face nails through bottom flange (per iLEVEL Rim Board Specifier’s Guide TJ-
8000) Wall Bottom Plate to Rim
Member Below 16d (3.5-in. × 0.135-in.) nails at 12 in. o.c.
Rim Member to Top Plate 10d (3-in. × 0.128-in. toe nails at 6 in. o.c. Rough Opening Top
Member to King Studs (2) 16d (3.5-in. × 0.135-in.) end nails
Wall Top and Bottom Plates to Studs (2) 16d (3.5-in. × 0.135-in.) end nails
Double King Studs 10d box (3-in. × 0.128-in.) face nails at 6 in. o.c., staggered
Figure 1 through Figure 3 provide the specimen construction for the various stages of testing.
A typical Stage 1 test specimen consisted of 16-in. long sections of rim members, spaced approximately 20 in. apart. The two rim sections were connected by a single section of floor joist (or floor truss) supported by joist hangers attached to the rim members.

9
Figure 1. Stage 1 specimen construction and test set-up
The lower portions of the Stage 2, 3, and 4 test specimens were identical (see Figure 2), and consisted of two side-by-side, 8-ft long × 4-ft, 3-in. high wall sections 24 in. apart. This configuration provided symmetrical loading and stability during testing. One of the two wall sections in each specimen included a 6-ft wide × 3-ft high rough opening in the center.
For tests labeled A or B, the wall sections were unsheathed on both the interior and exterior faces in accordance with the test matrix (see Table 2). For tests with label C, the interior face of the wall containing the rough opening was sheathed with a single sheet of gypsum wallboard placed horizontally and routed out around the interior edge of the opening.
All walls were constructed of 2 × 6 lumber spaced at 24 in. o.c. Floor framing was TJI joists also spaced at 24 in. o.c. Based on the results of Stage 1 testing (see Section 3), a 3½-in. wide, top-

10
mounted joist hanger was selected to support the floor joists at either end. Specimens were constructed with in-line framing, per the requirements of Section R602.3.2 of the 2009 International Residential Code for One and Two-Family Dwellings (2009 IRC) for a single top plate. Each test specimen also included two, 3-ft wide vinyl windows installed into the 6-ft rough opening. The windows were premulled together by the manufacturer. The windows were anchored with #10 pan head screws through every hole of the nailing flange, per the manufacturer’s instructions.
For the Stage 2 and Stage 4 testing, additional 2-ft high wall sections of 2 × 6 framing at 24 in. o.c. were added above the floor framing to provide a realistic in-situ loading mechanism to transfer roof load to the rim member (see Figure 3).

11
Figure 2. Lower portion of a typical Stage 2, 3 and 4 test specimen

12
Figure 3. Typical Stage 2 and 4 test specimen

13
2.3 Measurements—Rim Header 2.3.1 Test Setup and Protocol Specimens for the integrated rim header system were tested in a Universal Testing Machine with an automated programmable computer control. Load was applied at an approximate rate of 0.1 in./min of displacement. Specimens tested in Stage 1 were loaded continuously to failure. Specimens in Stages 2 and 3 were loaded in increments. Table 6 and Table 7 summarize the load levels that were applied to the specimen during Stages 2 and 3. The Stage 4 test specimen was loaded continuously to failure.
Load levels for Stage 2 testing represent increments of service roof loads in a typical 20-ft wide, 2-story house. Load levels for Stage 3 testing represent increments of service floor loads at typical floor span lengths in residential construction. The last load level of the Stage 2 and Stage 3 testing protocols (Load Level 4 and Load Level 3, respectively) exceed the design load levels for the tested integrated rim header system, but were included to investigate the deflections at loads exceeding service load levels.
At each load level, the target load was held for 5 min so the specimen could be visually inspected and the functionality of the installed windows could be evaluated. Window functionality was determined by three separate individuals manually opening and closing the windows while the target load was supported by the specimen.
Table 6. Load Levels for Stage 2 Tests—Rim Header
Load Level Load to Integrated Rim Headera
Equivalent Roof/Wall Load Condition
Preload 348 plf DL only 1 497 plf 0.5 × Pg = 25 psf 2 645 plf Pg = 30 psf 3 850 plf Pg = 50 psf 4 1,063 plf Pg = 70 psf
DL ≡ dead load Pg ≡ ground snow load a Equivalent roof and wall load conditions assume the following: Dead load of roof framing = 20 psf; Dead load of wall framing = 12 psf; unbalanced snow load condition for Pg as noted; Load Combination of D + S
Table 7. Load Levels for Stage 3 Tests—Rim Header
Load Level Load to Integrated Rim Headera Floor Span
Preload 50 plf DL only 1 200 plf 10 ft 2 360 plf 18 ft 3 480 plf 24 ft
a Equivalent floor load conditions assume the following: Dead load of floor framing = 10 psf; Live load of floor = 30 psf; Load Combination of D + L

14
2.4 Equipment—Rim Header A summary of the integrated rim header test locations for deformations measured in each stage of testing follows:
• Stage 1
o Movement of the bottom of joist relative to the rim member
• Stages 2 and 3
o Movement of the bottom of joist relative to the rim member at each hanger
o Movement of the wall top plate relative to the rim member at each hanger
o Movement of the wall top plate relative to the top of the king studs at the bearing surface interface (both interior and exterior edges of the plate)
o Midspan deflection of the rough opening top member (at both the interior and exterior faces) relative to the support studs
• Stage 4
o Midspan deflection of the rough opening top member (at both the interior and exterior faces) relative to the support studs
A data acquisition system integrated with the proprietary control software (Partner software by Instron) was used to record instrument readings, including load and deflection measurements.
Refer to Figure 1 for loading and instrumentation of Stage 1 test specimens. Figure 4 and Figure 5 provide schematics of the Stage 2 and Stage 3 loading conditions and instrumentation locations. The Stage 4 test specimen was tested using the same loading configuration as those tested in Stage 2. Figure 6 and Figure 7 provide photos of the Stage 1 and Stage 2 testing setups, respectively.

15
Figure 4. Typical Stage 2 and 4 test set-up

16
Figure 5. Typical Stage 3 test set-up

17
Figure 6. Stage 1 test setup
18
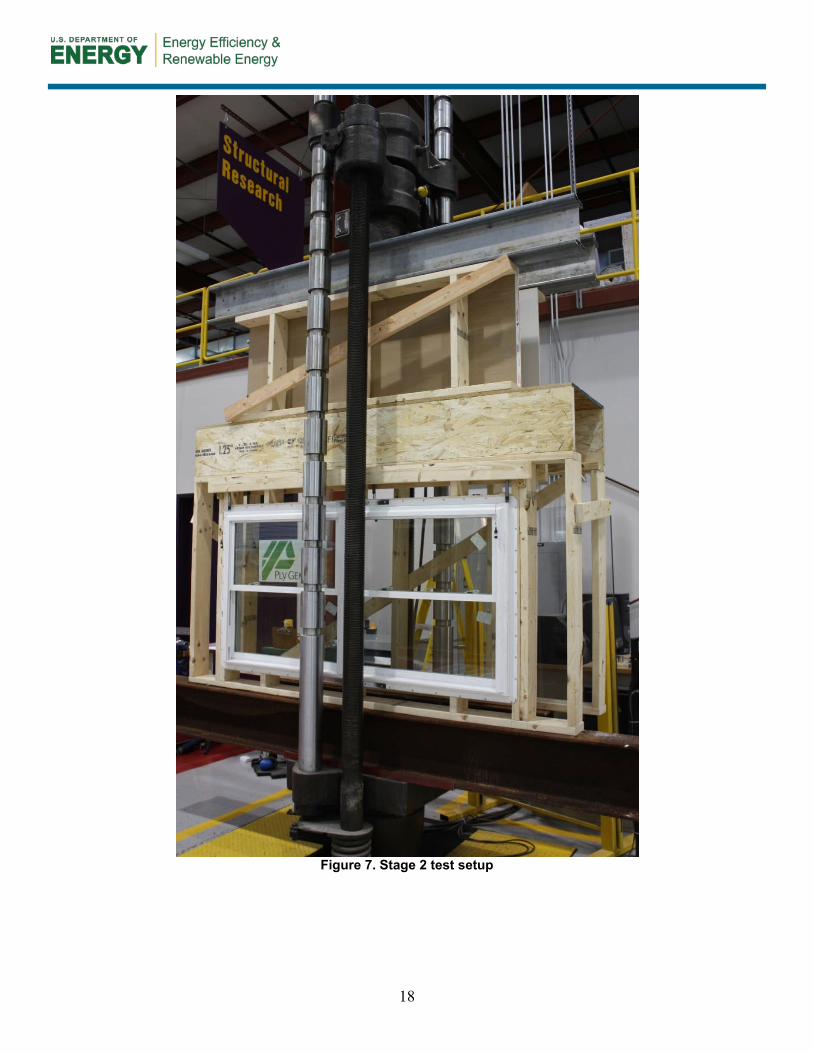
Figure 7. Stage 2 test setup

19
3 Analysis
3.1 Analysis of Results 3.1.1 Stage 1 Results Figure 8 shows the load-deformation behavior of the various individual joist or floor truss hangers tested. Deflection was calculated as the average movement of the floor joist (or truss) relative to the rim header at the four measured locations (see Figure 1). Results of the Stage 1 testing show that the wider, top-mounted joist hanger (ITS3.56-11.88) exhibited the highest deformation within the range of design floor loads evaluated during Stage 3 testing (400 lb/hanger–960 lb/hanger). Therefore, the ITS3.56-11.88 joist hanger was used in the Stage 2, Stage 3 and Stage 4 system testing to evaluate the worst-case scenario in terms of deflection performance.
Figure 8. Stage 1 test results
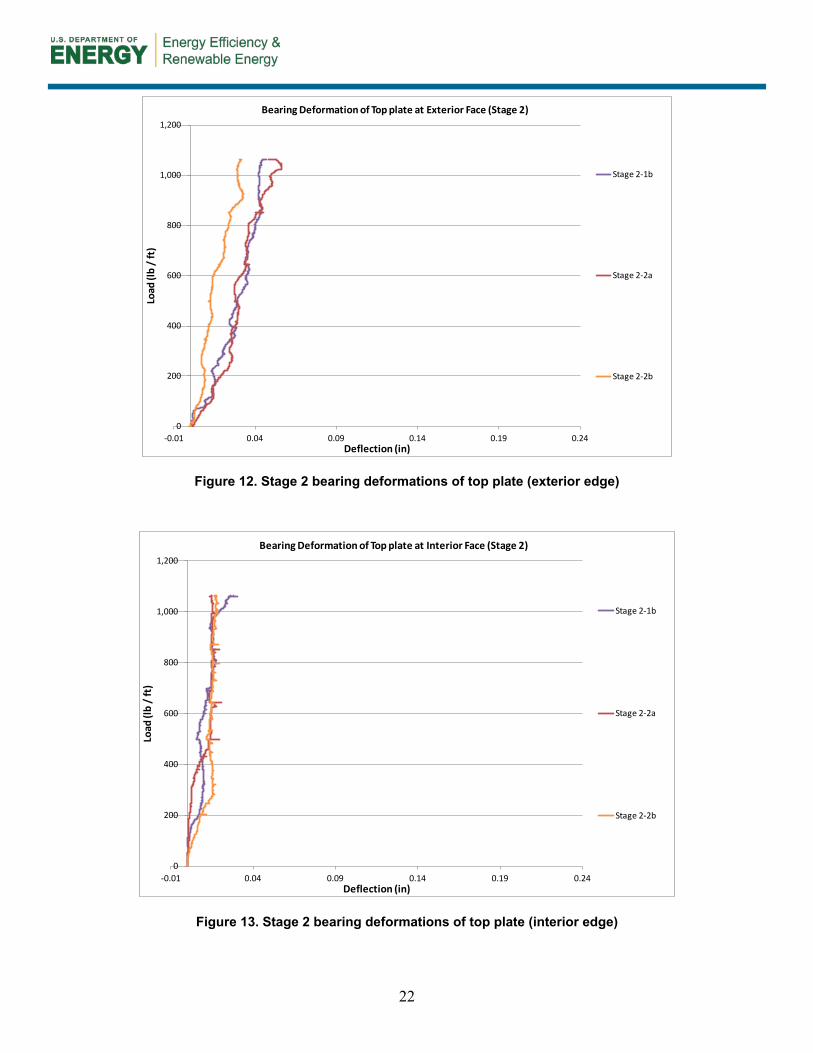
3.1.2 Stage 2 Results Figure 9 and Figure 10 provide the load versus deflection plots for the movement of the rough opening top member relative to the king studs during Stage 2 testing (roof loading), measured at the exterior and interior faces of the sill, respectively. Figure 11 provides the load versus deflection plots for the average movement of the joist hangers relative to the rim during Stage 2 testing. Figure 12 and Figure 13 provide the load versus deflection plots for the average movement at the bearing locations between the supporting king studs and the wall top plates exterior and interior faces, respectively. In all cases, load is presented in pounds per linear foot (plf) along the opening.
0
200
400
600
800
1,000
1,200
0 0.05 0.1 0.15 0.2 0.25
Load
(lb
/ han
ger)
Deflection (in)
Individual Joist Hanger Tests
ITS3.56-11.88 - 1
ITS3.56-11.88 - 2
ITS2.37-11.88 - 1
ITS2.37-11.88 - 2
IUS2.06-11.88 - 1
IUS2.06-11.88 - 2
MIU3.56-11 - 1
MIU3.56-11 - 2

20
Figure 9. Stage 2 rough opening top member midspan deflections (exterior face)
Figure 10. Stage 2 rough opening top member midspan deflections (interior face)
0
200
400
600
800
1,000
1,200
-0.01 0.04 0.09 0.14 0.19 0.24
Load
(lb
/ ft)
Deflection (in)
Window Sill Mid-Span Deflection Exterior Face (Stage 2)
Stage 2-1b
Stage 2-2a
Stage 2-2b
Stage 2-2c
Predicted
0
200
400
600
800
1,000
1,200
-0.01 0.04 0.09 0.14 0.19 0.24
Load
(lb
/ ft)
Deflection (in)
Window Sill Mid-Span Deflection Interior Face (Stage 2)
Stage 2-1b
Stage 2-2a
Stage 2-2b
Stage 2-2c
Predicted

21
The integrated rim header system successfully limited deflections and maintained window serviceability throughout all tested load levels. Plots of the midspan deflection of the window top sill show that the interior face deflected approximately 2.5 times more than the exterior face. This difference is most likely attributable to the support provided by the window flange attached to the exterior face of the window top sill. A plot of predicted midspan deflection caused by roof load is included in Figure 9 and Figure 10 for comparison with the measured values. This predicted deflection plot is calculated using the load applied to the rim member and the rim header deflection equation per the manufacturer’s literature, with the addition of the predicted movement of the joist hangers relative to the rim header member. Refer to Appendix A for further explanation and derivation of deflection design equations. Figure 9 and Figure 10 show that all the Stage 2 tests exhibited less deflection than predicted, indicating that the design methodology for calculating deflections caused by roof loading proposed herein is conservative.
Figure 11. Stage 2 average movement of joist hangers relative to rim header
The integrated rim header system also successfully provided a complete vertical load path through the rim header member. Some movement of the joist hangers within the system during Stage 2 testing (roof loading) was observed (see Figure 11), indicating the load transferred slightly between the load-bearing walls above and the floor framing. Comparing the movement of the joist hanger in the Stage 2 testing and deformation measured at the same load from the individual hanger tests (Stage 1) yields an approximate load of 160 lb being transferred to each hanger at the maximum roof design load, or 8% of the total roof load on a per-hanger basis. This load can be accounted for in the sizing of the joist hangers and should have no adverse effect on the overall design of the system.
0
200
400
600
800
1,000
1,200
-0.01 0.04 0.09 0.14 0.19 0.24
Load
(lb
/ ft
)
Deflection (in)
Movement of Joist Relative to Rim (Stage 2)
Stage 2-1b
Stage 2-2a
Stage 2-2b
22
Figure 12. Stage 2 bearing deformations of top plate (exterior edge)
Figure 13. Stage 2 bearing deformations of top plate (interior edge)
0
200
400
600
800
1,000
1,200
-0.01 0.04 0.09 0.14 0.19 0.24
Load
(lb
/ ft
)
Deflection (in)
Bearing Deformation of Top plate at Exterior Face (Stage 2)
Stage 2-1b
Stage 2-2a
Stage 2-2b
0
200
400
600
800
1,000
1,200
-0.01 0.04 0.09 0.14 0.19 0.24
Load
(lb
/ ft
)
Deflection (in)
Bearing Deformation of Top plate at Interior Face (Stage 2)
Stage 2-1b
Stage 2-2a
Stage 2-2b

23
Test measurements of the wall top plate deformations at the king stud bearing locations show a difference in the crushing deformations between the interior and exterior edges of the top plate; the crushing at the exterior edge of the top plate is approximately 2.4 times greater than at the interior edge. This is the result of the eccentricity between the center of the rim joist and the center of the stud. The eccentricity leads to a non-uniform loading distribution at the stud-to-plate interface. Based on the magnitudes of the measured deformations, and assuming that deformation is proportional to stress, the bearing stress distribution at the stud-to-plate interface is trapezoidal (Figure 14a); the interior edge of the plate is at approximately half the stress of the exterior edge. For design purposes, this stress distribution can be conservatively reduced to a triangular distribution across the king stud (Figure 14b).
Figure 14. Bearing deformations and simplified stress distribution at king stud-to-top plate interface
The tested configuration also performed acceptably in terms of the magnitude of the observed bearing deformation; the average deformation was <0.04 in. at the greatest test design load (see Table 6). The 0.04-in. threshold is the basis for establishing the referenced design values for wood compression perpendicular to the grain (NDS). The NDS also notes that this deformation limit “…has been shown by experience to provide adequate service in typical wood frame construction” (AF&PF 2005). Therefore, bearing deformations and more specifically any minor contribution that they may have to the overall midspan deflections of the system need not be included in design.
3.1.3 Stage 3 Results Figure 15 and Figure 16 provide the load versus deflection plots for the window top sill relative to the king studs under floor loading (Stage 3) measured at the exterior and interior faces of the sill, respectively. Figure 17 provides the load versus deflection plots for the average movement of the joist hangers relative to the rim during Stage 3 testing. Figure 18 and Figure 19 provide the load versus deflection plots for the average movement at the bearing locations between the

24
supporting king studs and the wall top plates exterior and interior faces, respectively. In all cases, load is presented in pounds plf along the opening.
Figure 15. Stage 3 rough opening top member midspan deflections (exterior face)
Figure 16. Stage 3 rough opening top member midspan deflections (interior face)
0
200
400
600
800
1,000
1,200
-0.01 0.04 0.09 0.14 0.19 0.24
Load
(lb
/ ft)
Deflection (in)
Window Sill Mid-Span Deflection Exterior Face (Stage 3)
Stage 3-1a
Stage 3-1b
Stage 3-2a
Stage 3-2b
Stage 3-2c
Predicted
0
200
400
600
800
1,000
1,200
-0.01 0.04 0.09 0.14 0.19 0.24
Load
(lb
/ ft
)
Deflection (in)
Window Sill Mid-Span Deflection Interior Face (Stage 3)
Stage 3-1a
Stage 3-1b
Stage 3-2a
Stage 3-2b
Stage 3-2c
Predicted

25
Midspan deflection results for the rough opening top member in Stage 3 testing show an even greater disparity between the interior and exterior faces; the interior face exhibits on average 4 times more deflection. This increase is attributable to the load transfer through the floor joists, which leads to greater joist hanger deformations (see Figure 17). The midspan deflection at either face is again lower than that predicted by design calculations. Figure 15 and Figure 16 include the predicted deflection behavior plot for comparison. Predicted deflections are calculated using the same methodology that was used in the Stage 2 results analysis, except that the full floor loading (which is being transferred to the rim header member through the joist hangers) is now used in conjunction with the individual hanger test results to determine additional hanger movement relative to the rim. The better-than-predicted performance of the integrated rim header system again indicates that the proposed deflection calculation methodology is conservative and appropriate for use in further design methodologies.
Figure 17. Stage 3 average movement of joist hangers relative to rim header
0
200
400
600
800
1,000
1,200
-0.01 0.04 0.09 0.14 0.19 0.24
Load
(lb
/ ft)
Deflection (in)
Movement of Joist Relative to Rim (Stage 3 Loading)
Stage 3-1
Stage 3-1b
Stage 3-2
Stage 3-2b

26
Figure 18. Stage 3 bearing deformations of top plate (exterior edge)
Figure 19. Stage 3 bearing deformations of top plate (interior edge)
0
200
400
600
800
1,000
1,200
-0.01 0.04 0.09 0.14 0.19 0.24
Load
(lb
/ ft
)
Deflection (in)
Bearing Deformation of Top plate at Exterior Face (Stage 3)
Stage 3-1a
Stage 3-1b
Stage 3-2a
Stage 3-2b
0
200
400
600
800
1,000
1,200
-0.01 0.04 0.09 0.14 0.19 0.24
Load
(lb
/ ft
)
Deflection (in)
Bearing Deformation of Top plate at Interior Face (Stage 3)
Stage 3-1a
Stage 3-1b
Stage 3-2a
Stage 3-2b

27
The crushing deformations of the wall top plate also correspondingly changed (see Figure 18 and Figure 19). The movement of the interior and exterior faces of the plate was nearly equal, indicating that the full bearing surface (i.e., the full 1½-in. × 5½-in.) of the king stud was engaged and equally loaded. This result further confirms that the use of a simplified triangular stress distribution in the bearing capacity design of the king stud-to-top plate interface is conservative.
3.1.4 Stage 4 Results Stage 4 testing concluded with the integrated rim header specimen tested to failure under the roof load case. The specimen failed at 4,540 plf of load applied to the integrated rim header, with no damage to the integrated rim header system or window. The primary failure mode was the walls supported by the rim header assembly (capacity of the integrated rim header was not reached) lost stability. After the load was released, the installed windows showed little to no decrease in operability, even though the rough opening top member was subjected to a >¾-in. midspan deflection, further indicating the integrated rim header system exceeds the minimal acceptable performance.
3.2 Example Design Calculation Provided is an example design calculation of midspan rough opening top member deflections of the integrated rim header system configuration tested during this research project. Deflections caused by the roof and floor loadings are calculated separately in accordance with the design methodologies previously outlined that account for the additional deflections caused by joist hanger movement relative to the rim. Deflections from each loading are additive and are summed to calculate total deflections within the system.
The deflections were calculated for live load only and live plus dead load, and total load deflections when supporting the loads at the first floor level of a typical 20-ft wide, 2-story home with a center bearing wall and a ground snow load of 50 psf. Refer to Appendix A for the specific design equations and calculations.
The predicted midspan deflection of the system at the rough opening top member when resisting live load only was 0.1275 in. The predicted deflection of the system when resisting the total design load was 0.2211 in. These correspond to L/565 and L/326 deflections, respectively, given the 6-ft opening, and both exceed the code specified deflection limits of L/360 and L/240 for header members.

28
4 Conclusions
Based on the results of this testing, the following conclusions can be drawn about the performance of the integrated rim header system:
1. The integrated rim header system successfully maintains window serviceability throughout typical residential service load levels. No decrease in window operability was observed at any tested load levels, under either roof or floor loading.
2. The rim header system also successfully provides a continuous vertical load path for roof loading through the bearing walls above and into the rim member. Approximately 8% of the imposed roof load is imposed on the adjacent floor framing and joist hangers. This load can be accounted for in the sizing of the joist hangers.
3. The joist hangers moved relative to the rim header member under both load scenarios (albeit significantly less under roof loads) and contributed to deflection of the top sill plate of the opening.
4. Appropriate design calculations for the rough opening top member within the rim header system encompass the published deflection equations for the rim member as well as additional deflections caused by the movement of the joist hangers. Comparison between test results and predicted deflection behavior using this methodology shows that the integrated rim header system consistently exhibits better than expected deflection performance, indicating the presence of a system effect factor. Results indicate that it is appropriate to use published rim header deflection equations in conjunction with the hanger deflection contribution methods described in this report to design an integrated rim header system.
5. Wood-bearing capacity design assumes uniform stress distribution calculating bearing area of the king stud to top plate interface. Crushing deformations measured during testing indicated that although the entire face of the king stud was engaged in bearing, the stress distribution was not uniform and varied by approximately 50% from inside face to outside face of the top plate. For simplicity, a triangular stress distribution is suggested when evaluating the bearing capacity of the king stud to top plate interface. Crushing deformations were also less than the 0.04-in. threshold used to establish referenced wood bearing design values.
6. Testing of the system to failure yielded an ultimate test load of 4,540 plf and a primary failure mode of loss of stability of the walls supported by the rim header assembly. Therefore, the ultimate capacity of the integrated rim header system is greater than the observed ultimate test load. Also, the installed windows showed little to no decrease in operability after the test load was released, even though the rough opening top member underwent a >¾-in. midspan deflection.

29
References
AF&PF 2005, National Design Specification for Wood Construction (NDS)—2005 Edition, ANSI / AF&PS NDS-2005, January 2005. IRC 2009, 2009 International Residential Code for One- and Two-family Dwellings, International Code Council, Inc., 2009. NAHB Research Center (2009-1), “Gate 1B - System Evaluations & Specifications: Advanced Header Framing Design for High-R Wall Systems”, Deliverable Number 4.2.1.2, NREL Subcontract Number AXL-9-99208-01, December 2009. NAHB Research Center (2009-2), “Summary of Code and Standard Barriers to the Implementation of High Performance Home Systems Designs”, Deliverable Number 4.2.2.1, NREL Subcontract Number AXL-9-99208-01, December 2009. Straube, J. (2011). “High R-value Enclosures for High Performance Residential Buildings in All Climate Zones.” Research Report 1005. Building Science Corporation, Sommerville, MA.

30
Appendix A
Example Design Calculation
20-foot wide house, Pg = 50-psf, 2-story house, center bearing wall
Span Length: 6 ft
Rim Member Properties:
b: 1.25 in.
d: 11.875 in.
E: 1,300,000 psi
Loads to the Integrated Rim Header System
Applicable Load Combo: D+0.75L+0.75S
Roof Dead Load + Wall Dead Load (Droof): 348 plf
Floor Dead Load (Dfloor): 50 plf
Roof Snow Load (S): 502 plf
Floor Live Load (L): 150 plf
Midspan Deflection Equations:
Δ = Δrim + Δhanger-rim (Eq. 1)
Δrim = per iLevel ESR Report (ESR 1387)
= [(270 wL4) / (Ebd3)] [(28.8wL2) / (Ebd)] (Eq. 2)
Where:
w: Load to member (plf)
L: Span length (ft)
E: Material modulus of elasticity (psi)
b: Member width (in)

31
d: Member depth (in)
Δhanger-rim = P × M (Eq. 3)
Where:
Proof = w × A × 8% (Eq. 4a)
Where:
w: Load to member (plf)
A: Trib. area to single hanger
8%: is the amount of roof load transferred to a single hanger, derived from results of Stage 2 testing in this report
OR
Pfloor = w × A (Eq. 4b)
Where:
w: Load to member (plf)
A: Trib. area to single hanger
M: 0.000135 in./lb (The slope of the load versus deflection behavior from the individual hanger testing)
Live Load Deflection at Top Sill Plate
Roof Loading Condition
Δroof = Δrim + Δhanger-rim
= [(270)(0.75 × 502 plf)(6’)4 / (1.3 × 10⁶ psi)(1.25-in.)(11.875-in.)3]
+ [(28.8)(0.75 × 502 plf)(6’)2 / (1.3 × 10⁶ psi)(1.25-in.)(11.875-in.)]
+ [(0.75 × 502 plf)(2’)(0.08)(0.000135-in./lb)
= 0.0768 in.

32
Floor Loading Condition
Δfloor = Δrim + Δhanger-rim
= [(270)(0.75 × 150 plf)(6’)4 / (1.3 × 10⁶ psi)(1.25-in.)(11.875-in.)3]
+ [(28.8)(0.75 × 150 plf)(6’)2 / (1.3 × 10⁶ psi)(1.25-in.)(11.875-in.)]
+ [(0.75 × 150 plf)(2’)(0.000135-in./lb)
= 0.0508 in.
System Deflection
Δsystem = Δroof + Δfloor
= 0.0768 in. + 0.0508 in.
= 0.1276 in. or L/565
Total Load Deflection at Top Sill Plate
Roof Loading Condition
Δroof = Δrim + Δhanger-rim
= [(270)(348 plf + 0.75 × 502 plf)(6’)4 / (1.3 × 10⁶ psi)(1.25-in.)(11.875-in.)3]
+ [(28.8)(348 plf + 0.75 × 502 plf)(6’)2 / (1.3 × 10⁶ psi)(1.25-in.)(11.875-in.)]
+ [(348 plf + 0.75 × 502 plf)(2’)(0.08)(0.000135-in./lb)
= 0.1477”
Floor Loading Condition
Δfloor = Δrim + Δhanger-rim
= [(270)(50 plf + 0.75 × 150 plf)(6’)4 / (1.3 × 10⁶ psi)(1.25-in.)(11.875-in.)3]
+ [(28.8)(50 plf + 0.75 × 150 plf)(6’)2 / (1.3 × 10⁶ psi)(1.25-in.)(11.875-in.)]
+ [(50 plf + 0.75 × 150 plf)(2’)(0.000135-in./lb)
= 0.0734 in.

33
System Deflection
Δsystem = Δroof + Δfloor
= 0.1477 in. + 0.0734 in.
= 0.2211 in. or L/326

DOE/GO-102013-3595 ▪ January 2013 Printed with a renewable-source ink on paper containing at least 50% wastepaper, including 10% post-consumer waste.


