High-resolution historical records from Pettaquamscutt River basin sediments:2. Pb isotopes reveal a potential new stratigraphic marker
ANA LÚCIA LIMA,1,* BRIDGET A. BERGQUIST,2 EDWARD A. BOYLE,2 MATTHEW K. REUER,2,† FRANCIS O. DUDAS,2
CHRISTOPHER M. REDDY,1 and TIMOTHY I. EGLINTON1
1Department of Marine Chemistry and Geochemistry, Woods Hole Oceanographic Institution, Woods Hole, MA 02543, USA2Department of Earth, Atmospheric and Planetary Sciences, Massachusetts Institute of Technology, Cambridge, MA 02139, USA
(Received January 27, 2004; accepted in revised form October 14, 2004)
Abstract—A high-resolution record of Pb deposition in Rhode Island over the past 250 yr was constructedusing a sediment core from the anoxic Pettaquamscutt River basin. The sedimentary Pb concentration recordshows the well-described maximum associated with leaded gasoline usage in the United States. DiminishedPb variability during recorded periods of local industrial activity (1735 to 1847) supports the greaterimportance of regional atmospheric lead transport vs. local inputs. The Pb isotopic composition at this siteshows a clear maximum in anthropogenic 206Pb/207Pb in the mid-1800s. Similar peaks have also beenobserved in sediments from Chesapeake Bay and the Great Lakes, suggesting a common source. Possiblecauses for this event include mining and smelting of Pb ores in the Upper Mississippi Valley district, whichaccounted for almost all Pb production in the United States in that period. The timing of this event can providean important stratigraphic marker for sediments deposited in the past 200 yr in the Northeastern United States.The downcore profile of anthropogenic 206Pb/207Pb provides a classic example of how changes in the mixtureof ores for production of tetraethyl lead caused a regional-scale shift in the sedimentary record, and suggests
Anthropogenic lead has been introduced into the environ-ment since refinement of lead-bearing sulfide ores and produc-tion of silver by cupellation were developed �5000 yr BP(Settle and Patterson, 1980). Natural processes like volcaniceruptions and rock weathering release Pb to the environment(Nriagu, 1978), but are insignificant compared to high-temper-ature processes such as utilization of leaded gasoline additives,nonferrous metal smelting, coal combustion, steel and ironmanufacturing, and cement production (Nriagu and Pacyna,1988). Because the main mechanism of Pb dispersion in theenvironment is atmospheric transport, anthropogenic Pb con-tamination is widely distributed and has been detected in polarice caps (Hong et al., 1994; Rosman et al., 1997), peat bogs(Shotyk et al., 1998; Weiss et al., 1999), remote ponds (Shira-hata et al., 1980), corals (Shen and Boyle, 1987) and aquaticsediments (Graney et al., 1995). Since crustal material is, ingeneral, more radiogenic than coals and ores, studies com-monly rely on the difference in isotopic composition amongsources to discern the influence of natural and anthropogenicinputs to a site. While variations in Pb isotopic ratios arefrequently used to apportion sources, the concentration profileof anthropogenic Pb has been used as a relative marker tocorroborate sediment chronologies. Determination of accumu-lation rates and subsequent dating of sediments is vital inreconstructing historical records. Depending on the timescaleof interest, the natural radionuclides 14C (half-life � 5730 yr),210Pb (22.3 yr), 228Th (1.9 yr) or 234Th (24 d) can be used in
* Author to whom correspondence should be addressed ([email protected]).†
Present address: Environmental Science Department, Colorado Col-lege, Colorado Springs, CO 80904
1813
determining sedimentation rates in freshwater and marine en-vironments (Koide et al., 1973; Robbins and Edgington, 1975;Anderson et al., 1988; Spliethoff and Hemond, 1996; Shotyk etal., 1998; Fuller et al., 1999). Lead-210 chronology is the mostwidely used technique for dating recent (100–200 yr) sedi-ments for contamination studies, although it becomes impreciseafter �100 yr. To validate 210Pb dates, independent chrono-logical evidence is used whenever possible. Radionuclides de-rived from nuclear weapons testing (e.g., 137Cs, 239 � 240Pu) arethe most reliable markers since their widespread depositionfollows the well-documented history of atmospheric fallout(Anderson et al., 1988; Spliethoff and Hemond, 1996), butother chronological markers can also be employed. For exam-ple, the increase in abundance of ragweed (Ambrosia) pollengrains is interpreted to define the period when deforestation,agricultural development, or intense urbanization took place(Bruland et al., 1975). However, since this transition occurredat different times in different regions, the depth-age relation-ship is only valid within a narrow geographic area. In contrast,the appearance of certain organic contaminants (e.g., polychlo-rinated byphenyls [PCBs]) and the peak in Pb utilization oc-curred simultaneously in most of the United States and both canbe used as relative markers in sediments from a variety ofregions (Latimer and Quinn, 1996; Van Metre et al., 2000).Unfortunately, as with 137Cs (peak in 1963), these chemicalmarkers are only useful for sediments deposited in the last 60yr (Latimer and Quinn, 1996). There is, therefore, a hiatus inchronological markers for records that span between 100 to200 yr.
In this paper, we report a large mid-19th-century peak in206Pb/207Pb ratio in anoxic sediments from the PettaquamscuttRiver, Rhode Island, and note that a similar feature was ob-served in sediments from the Great Lakes (Graney et al., 1995),
Chesapeake Bay (Marcantonio et al., 2002), and possibly in
1814 A. L. Lima et al.
corals from Bermuda (Reuer et al., 2003). We argue that themost likely source of radiogenic Pb during that period wasmining and smelting of lead ores in the Upper MississippiValley district and suggest that this event could be useful as astratigraphic marker for sedimentary records from the North-eastern United States that span between 100 and 200 yr.
2. EXPERIMENTAL
2.1. Study Area
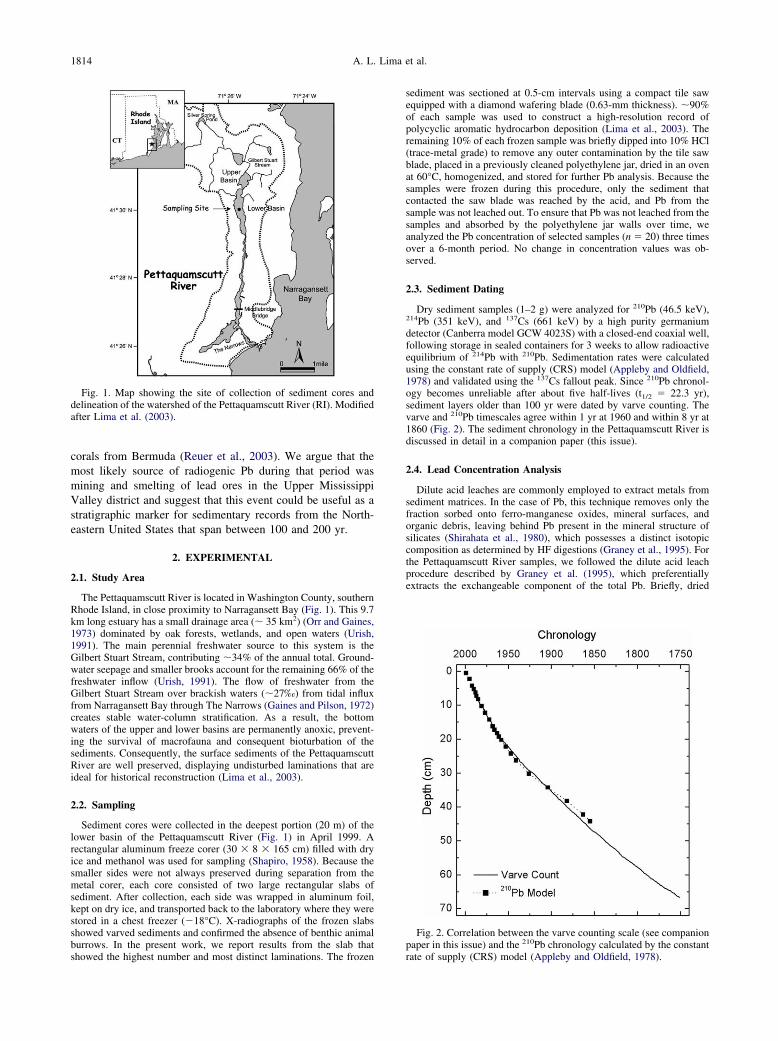
The Pettaquamscutt River is located in Washington County, southernRhode Island, in close proximity to Narragansett Bay (Fig. 1). This 9.7km long estuary has a small drainage area (� 35 km2) (Orr and Gaines,1973) dominated by oak forests, wetlands, and open waters (Urish,1991). The main perennial freshwater source to this system is theGilbert Stuart Stream, contributing �34% of the annual total. Ground-water seepage and smaller brooks account for the remaining 66% of thefreshwater inflow (Urish, 1991). The flow of freshwater from theGilbert Stuart Stream over brackish waters (�27‰) from tidal influxfrom Narragansett Bay through The Narrows (Gaines and Pilson, 1972)creates stable water-column stratification. As a result, the bottomwaters of the upper and lower basins are permanently anoxic, prevent-ing the survival of macrofauna and consequent bioturbation of thesediments. Consequently, the surface sediments of the PettaquamscuttRiver are well preserved, displaying undisturbed laminations that areideal for historical reconstruction (Lima et al., 2003).
2.2. Sampling
Sediment cores were collected in the deepest portion (20 m) of thelower basin of the Pettaquamscutt River (Fig. 1) in April 1999. Arectangular aluminum freeze corer (30 � 8 � 165 cm) filled with dryice and methanol was used for sampling (Shapiro, 1958). Because thesmaller sides were not always preserved during separation from themetal corer, each core consisted of two large rectangular slabs ofsediment. After collection, each side was wrapped in aluminum foil,kept on dry ice, and transported back to the laboratory where they werestored in a chest freezer (�18°C). X-radiographs of the frozen slabsshowed varved sediments and confirmed the absence of benthic animal
Fig. 1. Map showing the site of collection of sediment cores anddelineation of the watershed of the Pettaquamscutt River (RI). Modifiedafter Lima et al. (2003).
burrows. In the present work, we report results from the slab thatshowed the highest number and most distinct laminations. The frozen
sediment was sectioned at 0.5-cm intervals using a compact tile sawequipped with a diamond wafering blade (0.63-mm thickness). �90%of each sample was used to construct a high-resolution record ofpolycyclic aromatic hydrocarbon deposition (Lima et al., 2003). Theremaining 10% of each frozen sample was briefly dipped into 10% HCl(trace-metal grade) to remove any outer contamination by the tile sawblade, placed in a previously cleaned polyethylene jar, dried in an ovenat 60°C, homogenized, and stored for further Pb analysis. Because thesamples were frozen during this procedure, only the sediment thatcontacted the saw blade was reached by the acid, and Pb from thesample was not leached out. To ensure that Pb was not leached from thesamples and absorbed by the polyethylene jar walls over time, weanalyzed the Pb concentration of selected samples (n � 20) three timesover a 6-month period. No change in concentration values was ob-served.
2.3. Sediment Dating
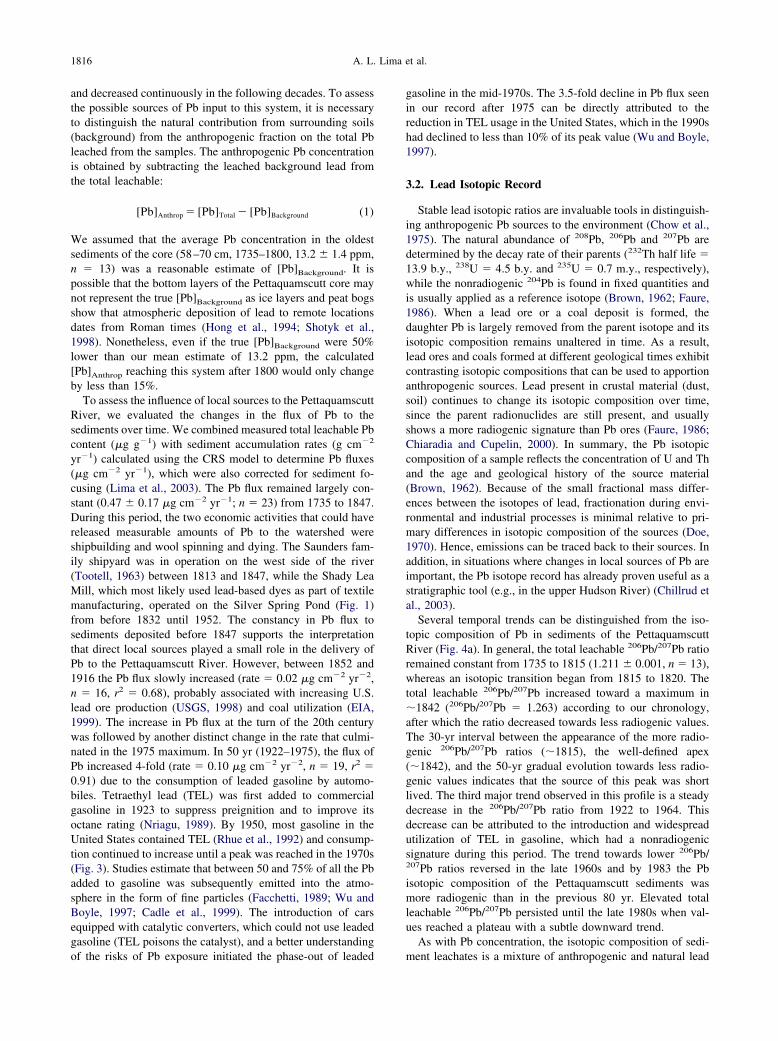
Dry sediment samples (1–2 g) were analyzed for 210Pb (46.5 keV),214Pb (351 keV), and 137Cs (661 keV) by a high purity germaniumdetector (Canberra model GCW 4023S) with a closed-end coaxial well,following storage in sealed containers for 3 weeks to allow radioactiveequilibrium of 214Pb with 210Pb. Sedimentation rates were calculatedusing the constant rate of supply (CRS) model (Appleby and Oldfield,1978) and validated using the 137Cs fallout peak. Since 210Pb chronol-ogy becomes unreliable after about five half-lives (t1/2 � 22.3 yr),sediment layers older than 100 yr were dated by varve counting. Thevarve and 210Pb timescales agree within 1 yr at 1960 and within 8 yr at1860 (Fig. 2). The sediment chronology in the Pettaquamscutt River isdiscussed in detail in a companion paper (this issue).
2.4. Lead Concentration Analysis
Dilute acid leaches are commonly employed to extract metals fromsediment matrices. In the case of Pb, this technique removes only thefraction sorbed onto ferro-manganese oxides, mineral surfaces, andorganic debris, leaving behind Pb present in the mineral structure ofsilicates (Shirahata et al., 1980), which possesses a distinct isotopiccomposition as determined by HF digestions (Graney et al., 1995). Forthe Pettaquamscutt River samples, we followed the dilute acid leachprocedure described by Graney et al. (1995), which preferentiallyextracts the exchangeable component of the total Pb. Briefly, dried
Fig. 2. Correlation between the varve counting scale (see companion210
paper in this issue) and the Pb chronology calculated by the constant
rate of supply (CRS) model (Appleby and Oldfield, 1978).
1815Pb isotope records reveal potential new stratigraphic marker
sediment samples were weighed into 1.5 mL polypropylene vials and 1mL of 1.75 N HCl–1 N HNO3 solution was added. The acid-sedimentmixtures were homogenized using a vortex mixer, placed in an ultra-sonic bath for 90 min, and allowed to react overnight to ensure efficientleaching of the samples. Subsequently, the leachates were separated bycentrifugation, and an aliquot of each sample was diluted with 5% HClfor Pb concentration measurements. Lead measurements from a previ-ous study on Pettaquamscutt River sediments were used as a baselinefor estimating dilutions (Goldberg et al., 1977). Lead content wasdetermined by isotope dilution ICP-MS using a VG Fisons Plasmaquad2� instrument and the well-characterized Oak Ridge National Labo-ratory 204Pb spike (Wu and Boyle, 1997). Analytical precision for thisinstrument is reported at better than 2% (Wu and Boyle, 1997), andreplicate analysis of one of the samples (depth � 27 cm) yield a 4%precision (2�, n � 28). The raw lead data were corrected for back-ground, procedural blank, and 204Hg interferences before Pb concen-trations were calculated. In general, the procedural blank accounted forless than 0.1% of the Pb concentration of all samples (0.006 � 0.003nM; n � 13) and 204Hg for less than 0.8% of the 204Pb counts.
2.5. Lead Isotopic Measurements
Elevated salinity and organic content, such as those present in thePettaquamscutt River samples (Gaines, 1975), can interfere with themeasurement of Pb isotopic ratios. To remove the organic carbonfraction (9 to 10%), between 20 and 150 �L of each HCl-HNO3
leachate was combusted overnight in an acid-cleaned quartz beaker at450°C. The samples were redissolved in 6 N HCl, transferred to a 3 mLSavillex PFTE beaker, reduced to dryness, and redissolved in 1.1 NHBr (Reuer et al., 2003). Lead was separated from the brackish matrix(pore water salinity � 27‰) using Teflon microcolumns loaded withEichrom AG-1�8 (chloride form, 200–400 mesh) anion exchangeresin (Reuer et al., 2003). Following the column separation with HBrand HCl, the eluted sample was dried, redissolved in 0.5 N HNO3, andlead isotope ratios were determined on the MIT Micromass IsoProbemultiple collector ICP-MS (MC-ICP-MS). The instrument operatingparameters, mass bias corrections, and tailing corrections are providedin Reuer et al. (2003). Briefly, MC-ICP-MS mass discrimination wasdetermined by addition of a lead-free thallium spike to each sample (25�L of 24 nM), and a secondary correction was calculated by repeatedanalysis of a 32 nM solution of National Institute of Standards and
Fig. 3. Downcore profile of total leachable Pb concentration (solid
circles) in the Pettaquamscutt River, and estimate of consumption of Pbin gasoline (solid line) in the United States (Nriagu, 1989).
Technology Standard Reference Material 981 (Natural Lead). Tailingcorrections were determined by daily analysis of the monoisotopic209Bi and although procedural blanks (n � 14) comprised less than0.4% of the signal intensity of even the oldest sample of the core, blankcorrections were included in the calculations. The uncertainty associ-ated with the MC-ICP-MS isotope ratio analysis is small (250 ppm for206Pb/207Pb, 2�) relative to the isotopic variability observed throughoutthe Pettaquamscutt River sediment core (73,000 ppm for total 206Pb/207Pb), and this measurement technique provides a consistent and rapidmethod for stratigraphic analyses.
3. RESULTS AND DISCUSSION
Both Pb content and isotopic ratios were evaluated in thePettaquamscutt River sediments. The record of Pb concentra-tions shows little evidence of extensive contributions fromlocal sources and excellent agreement with leaded gasolineusage in the United States (Fig. 3). The evaluation of the Pbisotopic record was divided into two periods: before and after1920 (Fig. 4). The earlier record shows a distinct increase in206Pb/207Pb values with peak in �1842, which correlates wellwith the highest production of Upper Mississippi Valley ore(the slight difference in the timing of these peaks is within theerror of our chronology). In comparison, the post-1920 recordfollows mostly the consumption of Pb in gasoline, with smallercontributions by coal combustion.
3.1. Lead Concentration
The total leachable Pb record for the Pettaquamscutt Riversediments (Fig. 3) correlates well with the consumption of Pbin gasoline in the United States (Nriagu, 1989). Lead concen-trations were constant and low (�20 �g g�1) throughout mostof the 18th century. Total leachable lead values began to
Fig. 4. Downcore profiles of (a) total leachable 206Pb/207Pb in thePettaquamscutt River (solid circles); (b) anthropogenic 206Pb/207Pb inthe Pettaquamscutt River, Chesapeake Bay (open triangles) (Marcan-tonio et al., 2002), Lake Erie (stars) (Graney et al., 1995), and Bermudacorals and seawater (solid squares) (Véron et al., 1994; Hamelin et al.,1997; Reuer et al., 2003). Note that we believe that the different ageestimated for the Lake Erie isotope peak is an artifact of the chrono-logical uncertainty in that record, and that both the PettaquamscuttRiver and Lake Erie isotope peaks represent the same event (with thePettaquamscutt River chronology preferred).
increase around 1830, reached a maximum in the late 1970s,
1816 A. L. Lima et al.
and decreased continuously in the following decades. To assessthe possible sources of Pb input to this system, it is necessaryto distinguish the natural contribution from surrounding soils(background) from the anthropogenic fraction on the total Pbleached from the samples. The anthropogenic Pb concentrationis obtained by subtracting the leached background lead fromthe total leachable:
[Pb]Anthrop � [Pb]Total � [Pb]Background (1)
We assumed that the average Pb concentration in the oldestsediments of the core (58–70 cm, 1735–1800, 13.2 � 1.4 ppm,n � 13) was a reasonable estimate of [Pb]Background. It ispossible that the bottom layers of the Pettaquamscutt core maynot represent the true [Pb]Background as ice layers and peat bogsshow that atmospheric deposition of lead to remote locationsdates from Roman times (Hong et al., 1994; Shotyk et al.,1998). Nonetheless, even if the true [Pb]Background were 50%lower than our mean estimate of 13.2 ppm, the calculated[Pb]Anthrop reaching this system after 1800 would only changeby less than 15%.
To assess the influence of local sources to the PettaquamscuttRiver, we evaluated the changes in the flux of Pb to thesediments over time. We combined measured total leachable Pbcontent (�g g�1) with sediment accumulation rates (g cm�2
yr�1) calculated using the CRS model to determine Pb fluxes(�g cm�2 yr�1), which were also corrected for sediment fo-cusing (Lima et al., 2003). The Pb flux remained largely con-stant (0.47 � 0.17 �g cm�2 yr�1; n � 23) from 1735 to 1847.During this period, the two economic activities that could havereleased measurable amounts of Pb to the watershed wereshipbuilding and wool spinning and dying. The Saunders fam-ily shipyard was in operation on the west side of the river(Tootell, 1963) between 1813 and 1847, while the Shady LeaMill, which most likely used lead-based dyes as part of textilemanufacturing, operated on the Silver Spring Pond (Fig. 1)from before 1832 until 1952. The constancy in Pb flux tosediments deposited before 1847 supports the interpretationthat direct local sources played a small role in the delivery ofPb to the Pettaquamscutt River. However, between 1852 and1916 the Pb flux slowly increased (rate � 0.02 �g cm�2 yr�2,n � 16, r2 � 0.68), probably associated with increasing U.S.lead ore production (USGS, 1998) and coal utilization (EIA,1999). The increase in Pb flux at the turn of the 20th centurywas followed by another distinct change in the rate that culmi-nated in the 1975 maximum. In 50 yr (1922–1975), the flux ofPb increased 4-fold (rate � 0.10 �g cm�2 yr�2, n � 19, r2 �0.91) due to the consumption of leaded gasoline by automo-biles. Tetraethyl lead (TEL) was first added to commercialgasoline in 1923 to suppress preignition and to improve itsoctane rating (Nriagu, 1989). By 1950, most gasoline in theUnited States contained TEL (Rhue et al., 1992) and consump-tion continued to increase until a peak was reached in the 1970s(Fig. 3). Studies estimate that between 50 and 75% of all the Pbadded to gasoline was subsequently emitted into the atmo-sphere in the form of fine particles (Facchetti, 1989; Wu andBoyle, 1997; Cadle et al., 1999). The introduction of carsequipped with catalytic converters, which could not use leadedgasoline (TEL poisons the catalyst), and a better understanding
of the risks of Pb exposure initiated the phase-out of leaded
gasoline in the mid-1970s. The 3.5-fold decline in Pb flux seenin our record after 1975 can be directly attributed to thereduction in TEL usage in the United States, which in the 1990shad declined to less than 10% of its peak value (Wu and Boyle,1997).
3.2. Lead Isotopic Record
Stable lead isotopic ratios are invaluable tools in distinguish-ing anthropogenic Pb sources to the environment (Chow et al.,1975). The natural abundance of 208Pb, 206Pb and 207Pb aredetermined by the decay rate of their parents (232Th half life �13.9 b.y., 238U � 4.5 b.y. and 235U � 0.7 m.y., respectively),while the nonradiogenic 204Pb is found in fixed quantities andis usually applied as a reference isotope (Brown, 1962; Faure,1986). When a lead ore or a coal deposit is formed, thedaughter Pb is largely removed from the parent isotope and itsisotopic composition remains unaltered in time. As a result,lead ores and coals formed at different geological times exhibitcontrasting isotopic compositions that can be used to apportionanthropogenic sources. Lead present in crustal material (dust,soil) continues to change its isotopic composition over time,since the parent radionuclides are still present, and usuallyshows a more radiogenic signature than Pb ores (Faure, 1986;Chiaradia and Cupelin, 2000). In summary, the Pb isotopiccomposition of a sample reflects the concentration of U and Thand the age and geological history of the source material(Brown, 1962). Because of the small fractional mass differ-ences between the isotopes of lead, fractionation during envi-ronmental and industrial processes is minimal relative to pri-mary differences in isotopic composition of the sources (Doe,1970). Hence, emissions can be traced back to their sources. Inaddition, in situations where changes in local sources of Pb areimportant, the Pb isotope record has already proven useful as astratigraphic tool (e.g., in the upper Hudson River) (Chillrud etal., 2003).
Several temporal trends can be distinguished from the iso-topic composition of Pb in sediments of the PettaquamscuttRiver (Fig. 4a). In general, the total leachable 206Pb/207Pb ratioremained constant from 1735 to 1815 (1.211 � 0.001, n � 13),whereas an isotopic transition began from 1815 to 1820. Thetotal leachable 206Pb/207Pb increased toward a maximum in�1842 (206Pb/207Pb � 1.263) according to our chronology,after which the ratio decreased towards less radiogenic values.The 30-yr interval between the appearance of the more radio-genic 206Pb/207Pb ratios (�1815), the well-defined apex(�1842), and the 50-yr gradual evolution towards less radio-genic values indicates that the source of this peak was shortlived. The third major trend observed in this profile is a steadydecrease in the 206Pb/207Pb ratio from 1922 to 1964. Thisdecrease can be attributed to the introduction and widespreadutilization of TEL in gasoline, which had a nonradiogenicsignature during this period. The trend towards lower 206Pb/207Pb ratios reversed in the late 1960s and by 1983 the Pbisotopic composition of the Pettaquamscutt sediments wasmore radiogenic than in the previous 80 yr. Elevated totalleachable 206Pb/207Pb persisted until the late 1980s when val-ues reached a plateau with a subtle downward trend.
As with Pb concentration, the isotopic composition of sedi-
ment leachates is a mixture of anthropogenic and natural lead
1817Pb isotope records reveal potential new stratigraphic marker
(not present in the mineral lattice), and these components mustbe differentiated to constrain anthropogenic sources. The iso-topic ratios of anthropogenic lead are calculated using themixing equation proposed by Shirahata et al. (1980):
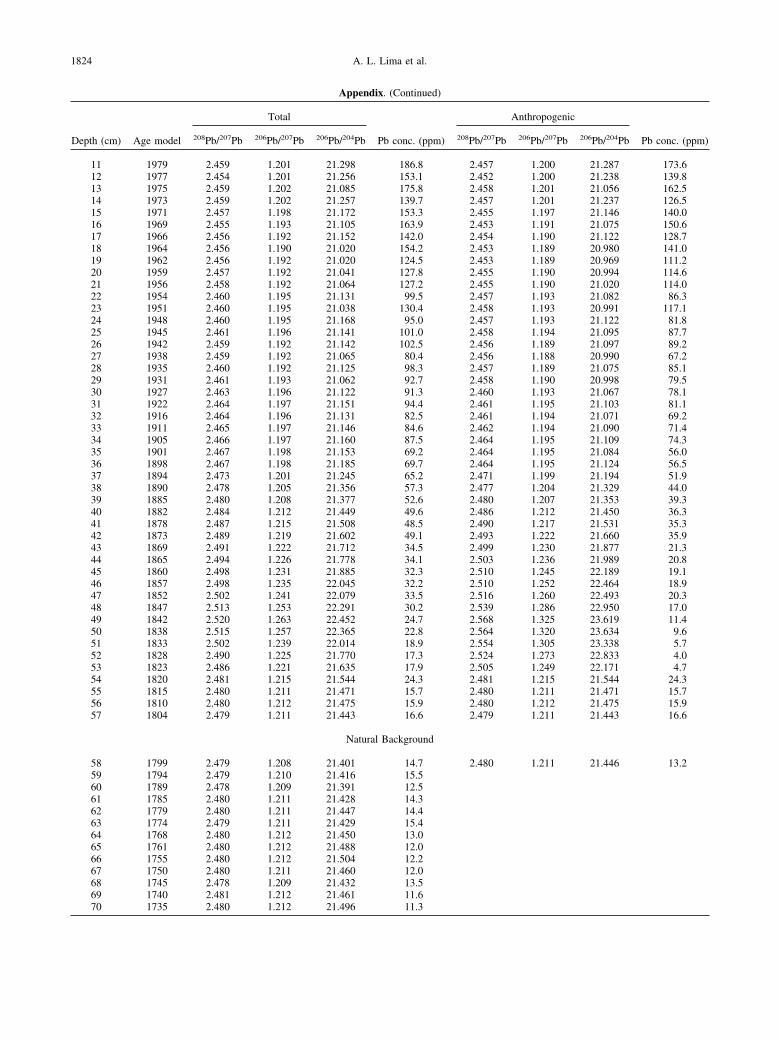
where R and C denote the isotopic ratio and concentration oftotal leachable, background, and anthropogenic lead. We as-sumed that the average Pb isotopic composition in the oldestsediments of the core (58–70 cm, 1735–1800, 206Pb/207Pb �1.211 � 0.001) was representative of the background naturalPb component, RBackground. Eqn. 2 shows the dependency ofthe anthropogenic isotopic ratio of Pb on concentration mea-surements. This is particularly critical when the total leachableand the background Pb are close in value. Sensitivity tests showthat if the [Pb]Background were 50% higher or lower than our13.2 ppm estimate, the 206Pb/207Pb isotopic composition of theanthropogenic Pb would change by only 0.001. An additionalline of support for the validity of the assumed RBackground is thatbetween 1735 and 1800 the average total 206Pb/207Pb remainedconstant at 1.211 � 0.001 (n � 13), a value that lies within therange accepted for upper continental crust (Othman et al.,1989). Therefore, the average isotopic composition of sedi-ments deposited before 1800 is a reasonable estimate of[Pb]Background. It is noteworthy that the anthropogenic 206Pb/207Pb profile in the Pettaquamscutt River sediments closelyresembles the total 206Pb/207Pb (Figs. 4a,b), confirming that themajority of the Pb present in this system was released byhuman activities. The Appendix lists values for [Pb]Total and[Pb]Anthrop for each sediment layer analyzed.
3.2.1. Constraints on the Sources of Pb before 1920
The large increase in 206Pb/207Pb ratio that occurred after1800 (Fig. 4a) is not unique to the Pettaquamscutt River. Whenthe anthropogenic component of the Pb present in Lake Erie(Graney et al., 1995) and the Chesapeake Bay (Marcantonio etal., 2002) are plotted against time of deposition, a peak inradiogenic 206Pb/207Pb is evident (Fig. 4b). Graney et al. (1995)also observed a high 206Pb/207Pb maximum of 1.34 at �1863in Lake Michigan and a 206Pb/207Pb peak of 1.65 at �1895 inLake Ontario, but these peaks are not as well defined as themaximum in Lake Erie.
The fact that unusually elevated 206Pb/207Pb values are ob-served in five separate locations suggests a common source. Itis widely accepted that atmospheric transport is the dominantpathway of anthropogenic Pb to the environment (Schaule andPatterson, 1981; Sturges and Barrie, 1989). The mean residencetime of Pb rich aerosols in the atmosphere is �10 d (Settle andPatterson, 1991), sufficient for Pb to be distributed over longdistances by prevailing winds (Sturges and Barrie, 1989). Theidentification of lead derived from mining and smelting oper-ations in distal repositories is quite common. For example,Rosman et al. (1997) observed diminished 206Pb/207Pb ratiobetween 600 B.C. and 300 A.D. in Greenland Ice, suggestingthe isotopic reduction resulted from contemporaneous Spanishmining operations. It is therefore possible that atmospheric
dispersion mechanisms are responsible for the appearance of
the mid-1800s maximum in radiogenic 206Pb/207Pb throughoutthe Northeastern United States.
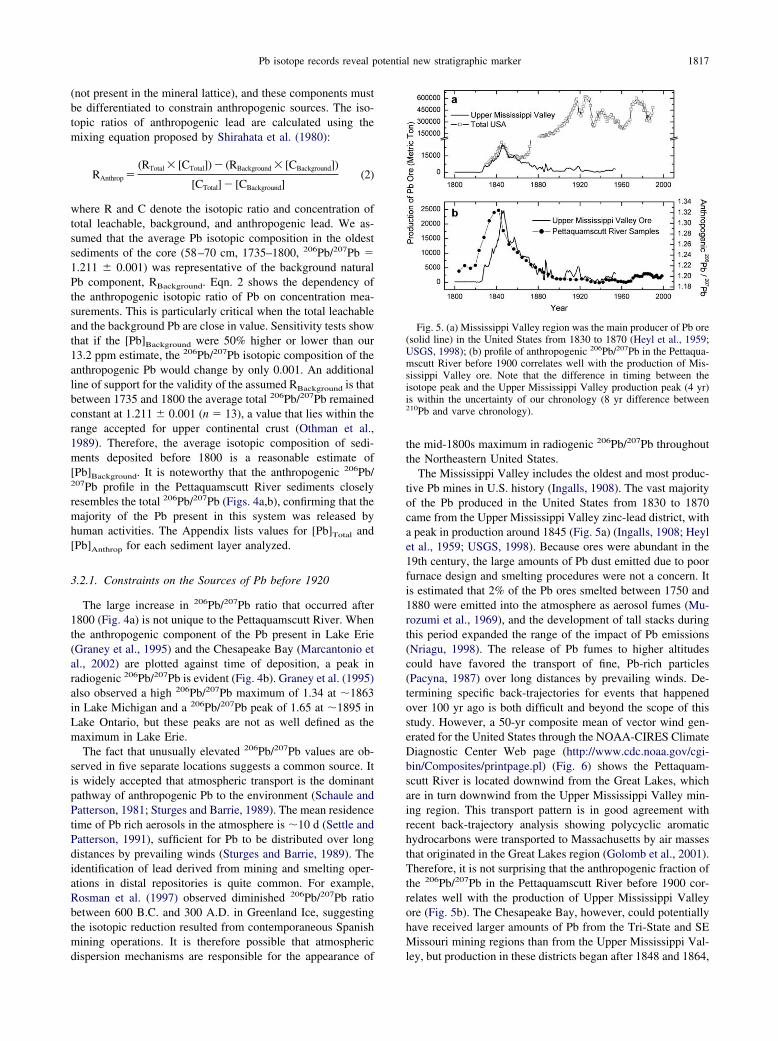
The Mississippi Valley includes the oldest and most produc-tive Pb mines in U.S. history (Ingalls, 1908). The vast majorityof the Pb produced in the United States from 1830 to 1870came from the Upper Mississippi Valley zinc-lead district, witha peak in production around 1845 (Fig. 5a) (Ingalls, 1908; Heylet al., 1959; USGS, 1998). Because ores were abundant in the19th century, the large amounts of Pb dust emitted due to poorfurnace design and smelting procedures were not a concern. Itis estimated that 2% of the Pb ores smelted between 1750 and1880 were emitted into the atmosphere as aerosol fumes (Mu-rozumi et al., 1969), and the development of tall stacks duringthis period expanded the range of the impact of Pb emissions(Nriagu, 1998). The release of Pb fumes to higher altitudescould have favored the transport of fine, Pb-rich particles(Pacyna, 1987) over long distances by prevailing winds. De-termining specific back-trajectories for events that happenedover 100 yr ago is both difficult and beyond the scope of thisstudy. However, a 50-yr composite mean of vector wind gen-erated for the United States through the NOAA-CIRES ClimateDiagnostic Center Web page (http://www.cdc.noaa.gov/cgi-bin/Composites/printpage.pl) (Fig. 6) shows the Pettaquam-scutt River is located downwind from the Great Lakes, whichare in turn downwind from the Upper Mississippi Valley min-ing region. This transport pattern is in good agreement withrecent back-trajectory analysis showing polycyclic aromatichydrocarbons were transported to Massachusetts by air massesthat originated in the Great Lakes region (Golomb et al., 2001).Therefore, it is not surprising that the anthropogenic fraction ofthe 206Pb/207Pb in the Pettaquamscutt River before 1900 cor-relates well with the production of Upper Mississippi Valleyore (Fig. 5b). The Chesapeake Bay, however, could potentiallyhave received larger amounts of Pb from the Tri-State and SEMissouri mining regions than from the Upper Mississippi Val-
Fig. 5. (a) Mississippi Valley region was the main producer of Pb ore(solid line) in the United States from 1830 to 1870 (Heyl et al., 1959;USGS, 1998); (b) profile of anthropogenic 206Pb/207Pb in the Pettaqua-mscutt River before 1900 correlates well with the production of Mis-sissippi Valley ore. Note that the difference in timing between theisotope peak and the Upper Mississippi Valley production peak (4 yr)is within the uncertainty of our chronology (8 yr difference between210Pb and varve chronology).
ley, but production in these districts began after 1848 and 1864,
respectively (Brockie et al., 1970; Snyder and Gerdemann,1970) and did not reach a maxima until the 1900s. Hence, weconclude that the small broad peak in anthropogenic 206Pb/207Pb observed in the Chesapeake sediments (Fig. 4b) is mostlikely derived from Upper Mississippi Valley ore particles thatreached mid-Atlantic states.
The difference in timing of the radiogenic 206Pb/207Pb peakamongst the Pettaquamscutt River, Chesapeake Bay and LakeErie sediments (Fig. 4b) is most likely due to sediment datinguncertainties. In this study, the 210Pb chronology was generatedfor laminated anoxic sediments and showed excellent agree-ment with a varve count timescale (Fig. 2, companion paper inthis issue). The resulting model age yields a historical record ofanthropogenic 206Pb/207Pb that mirrors the production of UpperMississippi Valley ore (Fig. 5b), asserting the validity of thePettaquamscutt chronology and the source of the radiogenic206Pb/207Pb peak. At 1860, the 210Pb and varve timescalesagree within 8 yr (Fig. 2), which is sufficient to match the�1845 peak in the Pettaquamscutt River sediments to theUpper Mississippi Valley ore production maxima. Similarly, ifwe consider that a relative chronological marker (Ambrosiapollen) was used to estimate the accumulation rate and age ofthe laminated sediments of the Chesapeake Bay depositedbefore the 1900s (Zimmerman and Canuel, 2000), then the 15yr that separate the appearance of the 206Pb/207Pb maxima andthe Upper Mississippi Valley production record (Figs. 4b and5b) are negligible. While a greater age difference separate theLake Erie 206Pb/207Pb from the Upper Mississippi Valley pro-duction record, little data are given by Graney and collaboratorson their chronology. We believe that all three isotope peaks aresynchronous and correspond the Upper Mississippi Valley pro-duction peak.
In the 1800s, coal combustion was another potential sourceof Pb to the atmosphere. The first record of usage of coal as anenergy source in the United States is noted in 1850 (EIA,2001). Coal contains measurable quantities of Pb and carriesdistinct isotopic signatures from lead ores, so we considered itin the source analysis for the �1842 peak. 206Pb/207Pb valuesfor several coal deposits and Pb ores mined in the United Stateswere gathered from the literature (Fig. 7) and any data pointwhose 206Pb/207Pb and 208Pb/207Pb ratios were higher than themost radiogenic value encountered in the Chesapeake Bay,
Fig. 6. Vector wind composite mean from January toReanalysis program (http://www.cdc.noaa.gov/cgi-bin/Colocated downwind from Lake Erie, while the ChesapeakeLocation of Tri-State, SE Missouri and Upper MississippiGerdemann (1970), and Heyl (1970), respectively.
Pettaquamscutt River, or Lake Erie sediments was selected as
a possible source candidate. Assuming the same origin for theanthropogenic 206Pb/207Pb peak in all three systems, UpperMississippi Valley ores are the most probable source. All coalsincluded in the analysis, even those from the Mississippi Valleyregion (Chow and Earl, 1972), were not radiogenic enough toproduce the �1842 Pb peak.
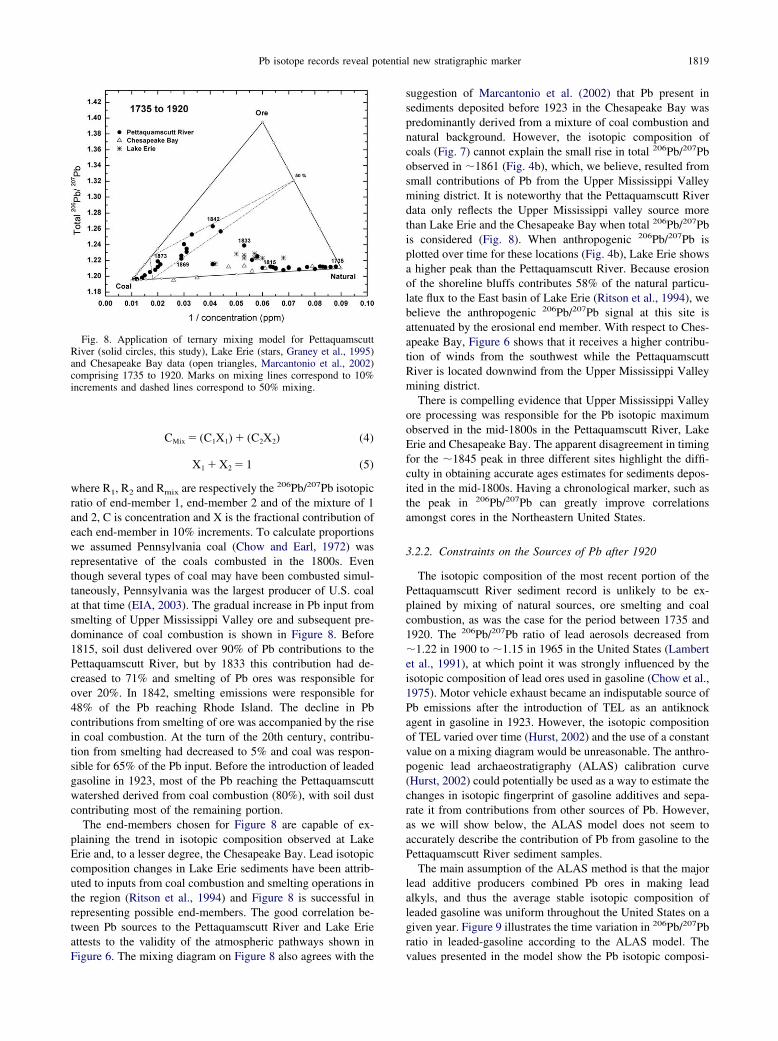
The relative importance of the Upper Mississippi Valleyregion and coal combustion as sources of lead to the Pettaqua-mscutt River in the 19th century can be addressed by means ofa ternary mixing model. The following equations were used tocalculate the mixing lines shown in Figure 8:
RMix �(R1C1X1) � (R2C2X2)
CMix
(3)
ber (1948 to 1998) calculated using the NCEP/NCARes/printpage.pl) shows that the Pettaquamscutt River iseives a higher contribution of winds from the southwest.districts were based on Brockie et al. (1970), Snyder and
Fig. 7. Isotopic composition of different coals (Chow and Earl, 1972)and Pb-producing regions in the United States (Russell and Farquhar,1960; Cannon et al., 1962; Brown, 1965, 1967; Heyl et al., 1966;Zartman and Stacey, 1971; Fletcher and Farquhar, 1982; Deloule et al.,1986; Ayuso and Foley, 1987; Thompson and Beaty, 1990; Wilber etal., 1990; Sanford, 1992; Goldhaber et al., 1995; Millen et al., 1995;Leach et al., 1998; Bouse et al., 1999; St. Marie and Kesler, 2000). Theareas defined by the highest values obtained for the Chesapeake Bay(solid triangle, Marcantonio et al., 2002), Pettaquamscutt River (solidcircle, this study) and Lake Erie sediments (solid squares, Graney et al.,
DecemmpositBay recmining
1995) delimit the possible sources of the �1842 maximum to theselocations.
1819Pb isotope records reveal potential new stratigraphic marker
CMix � (C1X1) � (C2X2) (4)
X1 � X2 � 1 (5)
where R1, R2 and Rmix are respectively the 206Pb/207Pb isotopicratio of end-member 1, end-member 2 and of the mixture of 1and 2, C is concentration and X is the fractional contribution ofeach end-member in 10% increments. To calculate proportionswe assumed Pennsylvania coal (Chow and Earl, 1972) wasrepresentative of the coals combusted in the 1800s. Eventhough several types of coal may have been combusted simul-taneously, Pennsylvania was the largest producer of U.S. coalat that time (EIA, 2003). The gradual increase in Pb input fromsmelting of Upper Mississippi Valley ore and subsequent pre-dominance of coal combustion is shown in Figure 8. Before1815, soil dust delivered over 90% of Pb contributions to thePettaquamscutt River, but by 1833 this contribution had de-creased to 71% and smelting of Pb ores was responsible forover 20%. In 1842, smelting emissions were responsible for48% of the Pb reaching Rhode Island. The decline in Pbcontributions from smelting of ore was accompanied by the risein coal combustion. At the turn of the 20th century, contribu-tion from smelting had decreased to 5% and coal was respon-sible for 65% of the Pb input. Before the introduction of leadedgasoline in 1923, most of the Pb reaching the Pettaquamscuttwatershed derived from coal combustion (80%), with soil dustcontributing most of the remaining portion.
The end-members chosen for Figure 8 are capable of ex-plaining the trend in isotopic composition observed at LakeErie and, to a lesser degree, the Chesapeake Bay. Lead isotopiccomposition changes in Lake Erie sediments have been attrib-uted to inputs from coal combustion and smelting operations inthe region (Ritson et al., 1994) and Figure 8 is successful inrepresenting possible end-members. The good correlation be-tween Pb sources to the Pettaquamscutt River and Lake Erieattests to the validity of the atmospheric pathways shown in
Fig. 8. Application of ternary mixing model for PettaquamscuttRiver (solid circles, this study), Lake Erie (stars, Graney et al., 1995)and Chesapeake Bay data (open triangles, Marcantonio et al., 2002)comprising 1735 to 1920. Marks on mixing lines correspond to 10%increments and dashed lines correspond to 50% mixing.
Figure 6. The mixing diagram on Figure 8 also agrees with the
suggestion of Marcantonio et al. (2002) that Pb present insediments deposited before 1923 in the Chesapeake Bay waspredominantly derived from a mixture of coal combustion andnatural background. However, the isotopic composition ofcoals (Fig. 7) cannot explain the small rise in total 206Pb/207Pbobserved in �1861 (Fig. 4b), which, we believe, resulted fromsmall contributions of Pb from the Upper Mississippi Valleymining district. It is noteworthy that the Pettaquamscutt Riverdata only reflects the Upper Mississippi valley source morethan Lake Erie and the Chesapeake Bay when total 206Pb/207Pbis considered (Fig. 8). When anthropogenic 206Pb/207Pb isplotted over time for these locations (Fig. 4b), Lake Erie showsa higher peak than the Pettaquamscutt River. Because erosionof the shoreline bluffs contributes 58% of the natural particu-late flux to the East basin of Lake Erie (Ritson et al., 1994), webelieve the anthropogenic 206Pb/207Pb signal at this site isattenuated by the erosional end member. With respect to Ches-apeake Bay, Figure 6 shows that it receives a higher contribu-tion of winds from the southwest while the PettaquamscuttRiver is located downwind from the Upper Mississippi Valleymining district.
There is compelling evidence that Upper Mississippi Valleyore processing was responsible for the Pb isotopic maximumobserved in the mid-1800s in the Pettaquamscutt River, LakeErie and Chesapeake Bay. The apparent disagreement in timingfor the �1845 peak in three different sites highlight the diffi-culty in obtaining accurate ages estimates for sediments depos-ited in the mid-1800s. Having a chronological marker, such asthe peak in 206Pb/207Pb can greatly improve correlationsamongst cores in the Northeastern United States.
3.2.2. Constraints on the Sources of Pb after 1920
The isotopic composition of the most recent portion of thePettaquamscutt River sediment record is unlikely to be ex-plained by mixing of natural sources, ore smelting and coalcombustion, as was the case for the period between 1735 and1920. The 206Pb/207Pb ratio of lead aerosols decreased from�1.22 in 1900 to �1.15 in 1965 in the United States (Lambertet al., 1991), at which point it was strongly influenced by theisotopic composition of lead ores used in gasoline (Chow et al.,1975). Motor vehicle exhaust became an indisputable source ofPb emissions after the introduction of TEL as an antiknockagent in gasoline in 1923. However, the isotopic compositionof TEL varied over time (Hurst, 2002) and the use of a constantvalue on a mixing diagram would be unreasonable. The anthro-pogenic lead archaeostratigraphy (ALAS) calibration curve(Hurst, 2002) could potentially be used as a way to estimate thechanges in isotopic fingerprint of gasoline additives and sepa-rate it from contributions from other sources of Pb. However,as we will show below, the ALAS model does not seem toaccurately describe the contribution of Pb from gasoline to thePettaquamscutt River sediment samples.
The main assumption of the ALAS method is that the majorlead additive producers combined Pb ores in making leadalkyls, and thus the average stable isotopic composition ofleaded gasoline was uniform throughout the United States on agiven year. Figure 9 illustrates the time variation in 206Pb/207Pbratio in leaded-gasoline according to the ALAS model. The
values presented in the model show the Pb isotopic composi-
1820 A. L. Lima et al.
tion of TEL relatively constant between 1923 and 1965 (1.165� 0.009), but increasing rapidly from the late 1960s to the late1980s due to the introduction of southeast Missouri Pb ores inthe mixture. The sharp increase in anthropogenic ratios ob-served in the ALAS records after 1968 reflects the introductionof southeast Missouri type Pb into gasoline additives (Fig. 8),a phenomena first observed in soils and aerosols of California(Chow et al., 1975; Shirahata et al., 1980). The high-resolutionsampling of the Pettaquamscutt River core is exceptional atrecording the rapid temporal increase in 206Pb/207Pb ratios after1970.
The systematic variation in isotopic composition of gasolineadditives described by the ALAS model can be observed insediments of the Pettaquamscutt River, Chesapeake Bay, and incorals from Bermuda (Fig. 9). However, there is not completeagreement between the records and ALAS. There is growingevidence that the isotopic values of TEL were not uniformthroughout the country (Kaplan, 2003) and, therefore, the ratiosreported in the model may not reflect the actual leaded gasolineinput signature to all locations. For example, the difference in206Pb/207Pb ratios between the Pettaquamscutt River sedimentsand the ALAS model suggests the presence of another impor-tant supply of Pb. Another logical source of anthropogenic Pbin the 20th century is the combustion of coal, which hasremained a major energy resource since its introduction in themid-1800s (EIA, 2000) and was considered the second largestsource of Pb emissions in 1968 (Chow and Earl, 1972). If weassume that TEL and coal emissions constituted the mostsignificant portion of the Pb input to Rhode Island until 1970,the fractional contribution of each source can be quantified bymeans of the following mixing equations (Gobeil et al., 1995;Weiss et al., 1999):
RAnthrop � (RgasXgas) � (RcoalXcoal) (6)
Fig. 9. Anthropogenic 206Pb/207Pb profile for the PettaquamscuttRiver (solid circles, this study), Chesapeake Bay (open triangles, Mar-cantonio et al., 2002) and Bermuda corals and surface water (solidsquares, Véron et al., 1994; Hamelin et al., 1997; Reuer et al., 2003).The solid line represents annual average 206Pb/207Pb values for indus-trial U.S. emissions according to the ALAS model (Hurst, 2002).
Xgas � Xcoal � 1 (7)
where R is the isotopic ratio for the coal source (Rcoal), theanthropogenic component measured in the sample (RAnthrop),and for leaded-gasoline (Rgas) as given by the ALAS model;and X is the fractional contribution of each source. To use theabove mixing equations, we calculated the most likely coalisotopic signature (Rcoal) for each horizon between 1924 and1970 taking into account the percent contribution of majorcoal-producing states (EIA, 2003) and 206Pb/207Pb ratios pub-lished in the literature (Chow and Earl, 1972). Until 1970,practically all of the coal production in the United States camefrom east of the Mississippi (EIA, 2001), with Pennsylvania,West Virginia, Kentucky and Illinois sharing the primary role.The Pb isotopic composition of coals is known to vary from1.183 (Illinois) to 1.252 (Kentucky), but when the percentcontribution from each state is considered (from EIA, 2003)values for coal emissions only vary between 1.202 (1920s) and1.207 (1970s). If we use this calculated isotopic composition ofcoal emissions and Rgas values from the ALAS model in Eqns.7 and 8, the result is coal combustion contributing more to thePb isotopic composition of the Pettaquamscutt River sediments(61.7 � 8.7% between 1927 and 1969) than Pb from automo-tive sources. This result contrasts sharply with the notion thatleaded gasoline combustion was an overwhelming source ofatmospheric lead aerosols during that period, with coal burningresponsible for the second largest emissions (Murozumi et al.,1969; Chow and Earl, 1972; Chow et al., 1975; Nriagu, 1989).To reconcile these different scenarios for anthropogenic Pbinputs to the Pettaquamscutt River between the 1920s and the1970s, the 206Pb/207Pb values used in the ALAS model wouldhave to be higher. The same reasoning can be extended to thediscrepancy between 206Pb/207Pb ratios in U.S. aerosols and theALAS curve (Hurst, 2003). While the ALAS model is a valu-able technique to age-date gasoline spills, it does not seem tofunction as a reliable end-member to apportion the contributionof leaded gasoline to environmental samples.
Lead isotope ratios have varied significantly since the elim-ination of alkyl lead from gasoline in the United States (Boll-höfer and Rosman, 2002). The introduction of unleaded gaso-line and the enforcement of stricter emission regulationsbrought about by the Clean Air Act of 1970 generated adecrease in emission of particulates and consequent lowering ofatmospheric Pb concentrations. As a result, the relative influ-ence of pollutant sources other than the previously overwhelm-ing leaded gasoline increased (Bollhöfer and Rosman, 2002).This change in relative proportions makes it challenging toidentify sources and produces greater isotopic unevenness ofthe signal. In addition, relatively new practice of smeltingrecycled materials, which can contain Pb from various sources,will render Pb isotope tracer studies even more problematical inthe future (Simonetti et al., 2004).
The variability existent after 1980 is well illustrated in Figure 9,which shows a good agreement between the anthropogenic 206Pb/207Pb profiles of the Pettaquamscutt River and the ChesapeakeBay, but a difference between those and the Bermuda coral record.The isotopic signature of the two continental sites remained in-variant from 1982 (1.204) to 1996 (1.201), indicating that indus-trial sources emitted Pb with a homogeneous signature. The Ber-muda corals, on the other hand, show a significant shift in 206Pb/207Pb values (1.199 in 1982 to 1.175 in 1996) that may be
explained by less radiogenic Pb transported from Europe and/or
1821Pb isotope records reveal potential new stratigraphic marker
Africa. Although the island of Bermuda acts as a small localsource of lead (Shen and Boyle, 1988a), the bulk of the contam-ination observed in the coral sampling site derives from seasonallong-range transport. Over the winter, predominantly North Amer-ican air masses reach Bermuda, while in the summer and early fallwestern Mediterranean/African easterlies dominate (Wolff et al.,1986; Véron et al., 1994; Huang et al., 1996). Before the phase-outof leaded gasoline in the United States in the early 1970s, atmo-spheric Pb concentrations in Bermuda air in the winter weresignificantly higher than in the summer (5.5 ng m�3 and 2.5 ngm�3, respectively for 1982–1983) (Wolff et al., 1986), suggestinga link between aerosol concentrations and Pb pollution in NorthAmerica. Since the drastic decrease of vehicle Pb emissions in theUnited States, Pb concentrations in Bermuda aerosols decreasedby an order of magnitude (Huang et al., 1996), and the relativeimportance of inputs by the easterly trade winds to surface watersof the Sargasso Sea increased from less than 10% in the early1980s to �50% in the early 1990s (Véron et al., 1998). Thischange in sources can also be seen in the evolution of 206Pb/207Pbprofiles at the JGOFS BATS (Joint Global Ocean Flux StudyBermuda Atlantic Time Series) station (Shen and Boyle, 1988b;Véron et al., 1993; Véron et al., 1998). Between 1984 and 1994the 206Pb/207Pb ratio in surface waters in the Sargasso Sea shiftedfrom 1.202 (Shen and Boyle, 1988b) to 1.178 (Véron et al., 1998),reflecting the less radiogenic isotopic signature of western Euro-pean industrial Pb emissions, instead of the more radiogenicMississippi Valley type ores used in the United States.
4. CONCLUSIONS
A high-resolution record of Pb contamination in the Pettaqua-mscutt River showed an unusual peak in 206Pb/207Pb ratios insediments deposited in the mid-1800s. Similar radiogenic signalsobserved for sediments from the Chesapeake Bay and Lake Eriewere evaluated for possible sources. Mining and smelting of Pbores in the Upper Mississippi Valley district dominated the U.S.production during that period, and were most likely responsible forthe observed isotopic signals. The 206Pb/207Pb peak provides threestratigraphic tie points for an age model—onset (�1815), maxi-mum (�1842), and termination (�1898)—and the timing of thisevent is such that it could become an important marker for sedi-ments deposited in the last 100 to 200 yr in the NortheasternUnited States. Also, the Bermuda coral record indicates that theinfluence of Pb production in the Upper Mississippi Valley districtcould potentially have reached the western North Atlantic Ocean(Fig. 4b) (Véron et al., 1994; Hamelin et al., 1997; Reuer et al.,2003). The coral record is not of adequate length to include the�1842 radiogenic 206Pb/207Pb peak, but the profile of Pb isotopiccomposition before 1900 follows closely the trend observed forthe Pettaquamscutt River. The good agreement between these tworecords could indicate that corals within the North Atlantic sub-tropical gyre were also affected by Pb contributions from miningin midwest North America, thus extending the estimated range ofthis anthropogenic source. In addition, the Pb isotopic compositionof the Pettaquamscutt River provides a classic example of how thechange in mixtures of ores in the production of TEL caused aregional-scale shift in 206Pb/207Pb in the sedimentary record, andsuggests that coal probably played a secondary role in Pb emis-
sions after 1920.
Acknowledgments—We wish to thank John King (GSO-URI) for assis-tance with core collection, John Andrews (WHOI) for performing the210Pb and 137Cs measurements, and Andrew Beet (Marine Policy Center-WHOI) for invaluable help with MatLab code to calculate the proportionof the sources of lead reaching the sampling site before 1920. The labo-ratory assistance of Rick Kayser and Barry Grant at MIT is also gratefullyacknowledged. This manuscript was greatly improved by comments fromthree anonymous reviewers. This work was supported by funds from theNational Science Foundation (CHE-889172 to T.I.E.) and (OCE-0002273to E.A.B.). A. L. Lima and B. A. Bergquist acknowledge fellowship fromthe Brazilian Council for Research (CNPq) and National Physical ScienceConsortium/LLNL, respectively. This is WHOI contribution No. 11322.
Associate editor: K. K. Falkner
REFERENCES
Anderson R., Bopp R., Buesseler K., and Biscaye P. (1988) Mixing ofparticles and organic constituents in sediments from the continentalshelf and slope off Cape Cod: SEEP-I results. Cont. Shelf Res. 8,925–946.
Appleby P. and Oldfield F. (1978) The calculation of lead-210 datesassuming a constant rate of supply of unsupported 210Pb to thesediment. Catena 5, 1–8.
Ayuso R. A. and Foley N. K. (1987) Source of lead and mineralizingbrines for Rossie-type Pb-Zn veins in the Frontenac Axis area, NewYork. Econ. Geol. 82, 489–496.
Bollhöfer A. and Rosman K. (2002) The temporal stability in leadisotopic signatures at selected sites in the Southern and Northernhemispheres. Geochim. Cosmochim. Acta 66, 1375–1386.
Bouse R. M., Ruiz J., Titley S. R., Tosdal R. M., and Wooden J. L.(1999) Lead isotope compositions of Late Cretaceous and EarlyTertiary igneous rocks and sulfide minerals in Arizona: Implica-tions for the sources of plutons and metals in porphyry copperdeposits. Econ. Geol. 94, 211–244.
Brockie D., Hare E. Jr., and Dingess P. (1970) The geology and oredeposits of the Tri-State district of Missouri, Kansas, and Okla-homa. In Ore Depositis of the United States, 1933–1967, Vol. 1 (ed.J. Ridge). pp. 400–429. American Institute of Mining, Metallurgi-cal and Petroleum Engineers.
Brown J. (1962) Ore leads and isotopes. Econ. Geol. 57, 673–720.Brown J. S. (1965) Oceanic lead isotopes and ore genesis. Econ. Geol.
60, 47–68.Brown J. S. (1967) Isotopic zoning of lead and sulfur in southeast
Missouri. Econ. Geol. Monogr. 3, 410–426.Bruland K., Koide M., Bowser C., Maher L., and Goldberg E. (1975)
Lead-210 and pollen geochronologies on Lake Superior sediments.Quat. Res. 5, 89–98.
Cadle S. H., Mulawa P. A., Hunsager E. C., Nelson K., Ragazzi R. A.,Gallagher G. L., Lawson D. R., Knapp K. T., and Snow R. (1999)Composition of light-duty motor vehicle exhaust particulate matterin the Denver, Colorado area. Environ. Sci. Technol. 33, 2328–2339.
Cannon R. S. Jr., Pierce A. P., Antweiler J. C. and Buck K. L. (1962)Lead isotope studies in the northern Rockies, USA. In PetrologicStudies: A Volume in Honor of A.F. Buddington (eds. A. E. J.Engel, H. L. James and B. F. Leonard), pp. 115–131. GeologicalSociety of America.
Chiaradia M. and Cupelin F. (2000) Behaviour of airborne lead andtemporal variations of its source effects in Geneva (Switzerland):Comparison of anthropogenic versus natural processes. Atmos. En-viron. 34, 959–971.
Chillrud S., Hemming S., Shuster E., Simpson H., Bopp R., Ross J.,Pederson D., Chaky D., Tolley L.-R., and Estabrooks F. (2003)Stable lead isotopes, contaminant metals and radionuclides in upperHudson River sediment cores: Implications for improved timestratigraphy and transport processes. Chem. Geol. 199, 53–70.
Chow T. J. and Earl J. L. (1972) Lead isotopes in North Americancoals. Science 176, 510–511.
Chow T. J., Snyder C., and Earl J. (1975) Isotope ratios of lead aspollutant source indicators. IAEA-SM, 191(4), 95–108.
1822 A. L. Lima et al.
Deloule E., Allegre C., and Doe B. R. (1986) Lead and sulfur isotopemicrostratigraphy in galena crystals from Mississippi Valley-typedeposits. Econ. Geol. 81, 1307–1321.
Doe B. (1970) Lead Isotopes. Springer-Verlag.EIA (Energy Information Administration). (1999) State energy data
report. Available at: http://www.eia.doe.gov/pub/state.data/pdf/ri.pdf. U.S. Department of Energy.
EIA (Energy Information Administration). (2000) Annual energy re-view. Available at: http://www.eia.doe.gov/emeu/aer/contents.html. U.S. Department of Energy.
EIA (Energy Information Administration). (2001) Annual energy re-view. U.S. Department of Energy.
EIA (Energy Information Administration). (2003) State coal profileindex map, Vol. 2003. U.S. Department of Energy.
Facchetti S. (1989) Lead in petrol: The isotopic lead experiment. Acc.Chem. Res. 22, 370–374.
Faure G. (1986) Principles of Isotope Geology. Wiley.Fletcher I. R. and Farquhar R. M. (1982) Lead isotopic compositions of
Balmat ores and their genetic implications. Econ. Geol. 77, 464–473.
Fuller C., Van Geen A., Baskaran M., and Anima R. (1999) Sedimentchronology in San Francisco Bay, California, defined by 210Pb,234Th, 137Cs and 239,240Pu. Mar. Chem. 64, 7–27.
Gaines A. (1975) Papers on the geomorphology, hydrography andgeochemistry of the Pettaquamscutt River estuary. Ph.D. thesis,University of Rhode Island.
Gaines A. G. J. and Pilson M. E. Q. (1972) Anoxic water in thePettaquamscutt River. Limnol. Oceanogr. 17, 42–49.
Gobeil C., Johnson W., MacDonald R., and Wong C. (1995) Sourcesand burden of lead in St. Lawrence estuary sediments: Isotopicevidence. Environ. Sci. Technol. 29, 193–201.
Goldberg E., Gamble E., Griffin J., and Koide M. (1977) Pollutionhistory of Narragansett Bay as recorded in its sediments. Estuar.Coastal Mar. Sci. 5, 549–561.
Goldhaber M. B., Church S. E., Doe B. R., Aleinikoff J. N., BrannonJ. C., Podosek F. A., Mosier E. L., Taylor C. D., and Gent C. A.(1995) Lead and sulfur isotope investigation of Paleozoic sedimen-tary rocks from the southern midcontinent of the United States:Implications for paleohydrology and ore genesis of the southeastMissouri lead belts. Econ. Geol. 90, 1875–1910.
Golomb D., Barry E., Fisher G., Varanusupakul P., Koleda M., andRooney T. (2001) Atmospheric deposition of polycyclic aromatichydrocarbons near New England Coastal waters. Atmos. Environ.35, 6245–6258.
Graney J. R., Halliday A. N., Keeler G. J., Nriagu J. O., Robbins J. A.,and Norton S. A. (1995) Isotopic record of lead pollution in lakesediments from the northeastern Unites States. Geochim. Cosmo-chim. Acta 59, 1715–1728.
Hamelin B., Ferrand J. L., Alleman L., Nicolas E., and Veron A. (1997)Isotopic evidence of pollutant lead transport from North America tothe subtropical North Atlantic gyre. Geochim. Cosmochim. Acta 61,4423–4428.
Heyl A. (1970) The Upper Mississippi Valley base-metal district. InOre Depositis of the United States, 1933–1967, Vol. 1 (ed. J.Ridge). pp. 2–77. American Institute of Mining, Metallurgical andPetroleum Engineers.
Heyl A. Jr., Agnew A., Lyons E., and Behre C. Jr. (1959) The geologyof the Upper Mississippi Valley zinc-lead district. ProfessionalPaper 309. U.S. Geological Survey.
Heyl A. V., Delevaux M. H., Zartman R. E., and Brock M. R. (1966)Isotopic study of galenas from the Upper Mississippi Valley, theIllinois-Kentucky and some Appalachian Valley mineral districts.Econ. Geol. 61, 933–961.
Hong S., Candelone J. P., Patterson C. C., and Boutron C. F. (1994)Greenland ice evidence of hemispheric lead pollution two millenniaago by Greek and Roman civilizations. Science 265, 1841–1843.
Huang S., Arimoto R., and Rahn K. A. (1996) Changes in atmosphericlead and other pollution elements at Bermuda. J. Geophys. Res.101, 21033–21040.
Hurst R. (2002) Lead isotopes as age-sensitive genetic markers inhydrocarbons. 3. Leaded gasoline, 1923–1990 (ALAS Model). En-
viron. Geosci. 9, 43–50.
Hurst R. (2003) Invited commentary on Dr. Isaac Kaplan’s paper “Agedating of environmental organic residues.” Environ. Forensics 4,145–152.
Ingalls W. (1908) Lead and Zinc in the United States. Hill.Kaplan I. (2003) Age dating of environmental organic residues. Envi-
ron. Forensics 4, 95–141.Koide M., Bruland K., and Goldberg E. (1973) 228Th/232Th and 210Pb
geochronologies in marine and lake sediments. Geochim. Cosmo-chim. Acta 37, 1171–1187.
Lambert C. E., Nicolas E., Véron A., Buat-Ménard P., KlinkhammerG., Corre P. L. E., and Morin P. (1991) Anthropogenic lead cyclein the northeastern Atlantic. Oceanol. Acta 14, 59–66.
Latimer J. S. and Quinn J. G. (1996) Historical trends and currentinputs of hydrophobic organic compounds in an urban estuary: Thesedimentary record. Environ. Sci. Technol. 30, 623–633.
Leach D. L., Hofstra A. H., Church S. E., Snee L. W., Vaughn R. B.,and Zartman R. E. (1998) Evidence for Proterozoic and LateCretaceous–Early Tertiary ore-forming events in the Coeur d’AleneDistrict, Idaho and Montana. Econ. Geol. 93, 347–359.
Lima A. L. C., Eglinton T. I., and Reddy C. M. (2003) High-resolutionrecord of pyrogenic polycyclic aromatic hydrocarbon depositionduring the 20th century. Environ. Sci. Technol. 37, 53–61.
Marcantonio F., Zimmerman A., Xu Y., and Canuel E. (2002) A Pbisotope record of mid-Atlantic U.S. atmospheric Pb emissions inChesapeake Bay sediments. Mar. Chem. 77, 123–132.
Millen T. M., Zartman R. E., and Heyl A. V. (1995) Lead isotopes fromthe Upper Mississippi Valley district—A regional perspective.USGS Bull. 2094-B, B1–B13.
Murozumi M., Chow T., and Patterson C. (1969) Chemical concentra-tions of pollutant lead aerosols, terrestrial dusts and sea salts inGreenland and Antarctic snow strata. Geochim. Cosmochim. Acta33, 1247–1294.
Nriagu J. O. (1978) Biogeochemistry of Pb in the Environment.Elsevier.
Nriagu J. (1989) The history of leaded gasoline. In Heavy Metals in theEnvironment (ed. J. Vernet), pp. 361–366. Page Brothers, Norwich.
Nriagu J. O. (1998) Tales told in lead. Science 281, 1622–1623.Nriagu J. O. and Pacyna J. M. (1988) Quantitative assessment of world
wide contamination of air, water and soils by trace metals. Nature333, 134–139.
Orr W. L. and Gaines A. G. J. (1973) Observations on the rate of sulfatereduction and organic matter oxidation in the bottom waters of anestuarine basin: The upper basin of the Pettaquamscutt River(Rhode Island). In Advances in Organic Geochemistry (eds. B.Tissot and F. Bienner), pp. 791–812. Technip.
Othman D., White W., and Patchett J. (1989) The geochemistry ofmarine sediments, island arc magma genesis and crust-mantle re-cycling. Earth Planet. Sci. Lett. 94, 1–21.
Pacyna J. (1987) Atmospheric emissions of arsenic, cadmium, lead andmercury from high temperature processes in power generation andindustry. In Lead, Mercury, Cadmium and Arsenic in the Environ-ment (eds. T. Hutchinson and K. Meema), pp. 69–87. Wiley.
Reuer M. K., Boyle E. A., and Grant B. C. (2003) Lead isotope analysisof marine carbonates and seawater by multiple collector ICP-MS.Chem. Geol. 200, 137–153.
Rhue R., Mansell R., Ou L., Cox R., Tang S., and Ouyang Y. (1992)The fate and behavior of lead alkyls in the environment—A review.Crit. Rev. Environ. Control 22, 169–193.
Ritson P., Esser B., Niemeyer S., and Flegal A. (1994) Lead isotopicdetermination of historical sources of lead to Lake Erie, NorthAmerica. Geochim. Cosmochim. Acta 58, 3297–3305.
Robbins J. and Edgington D. (1975) Determination of recent sedimen-tation rates in Lake Michigan using 210Pb and 137Cs. Geochim.Cosmochim. Acta 39, 285–304.
Rosman K. J. R., Chisholm W., Hong S., Candelone J. P., and BoutronC. F. (1997) Lead from Carthaginian and Roman Spanish minesisotopically identified in Greenland ice dated from 600 BC to 300AD. Environ. Sci. Technol. 31, 3413–3416.
Russell R. D. and Farquhar R. M. (1960) Lead Isotopes in Geology.Interscience.
Sanford R. F. (1992) Lead isotopic compositions and paleohydrology
of caldera-related epithermal veins, Lake City, Colorado. GSA Bull.104, 1236–1245.
1823Pb isotope records reveal potential new stratigraphic marker
Schaule B. K. and Patterson C. C. (1981) Lead concentrations in thenortheast Pacific: Evidence for global anthropogenic perturbations.Earth Planet. Sci. Lett. 54, 97–116.
Settle D. M. and Patterson C. C. (1980) Lead in albacore: Guide to leadpollution in Americans. Science 207, 1167–1176.
Settle D. M. and Patterson C. C. (1991) Eolian inputs of lead to theSouth Pacific via rain and dry deposition from industrial and naturalsources. Geochim. Cosmochim. Acta 285–294.
Shapiro J. (1958) The freeze-corer—A new sampler for lake sediments.Ecology 39, 74819.
Shen G. T. and Boyle E. A. (1987) Lead in corals: Reconstruction ofhistorical industrial fluxes to the surface ocean. Earth Planet. Sci.Lett. 82, 289–304.
Shen G. T. and Boyle E. A. (1988a) Determination of lead, cadmiumand other trace metals in annually-banded corals. Chem. Geol. 67,47–62.
Shen G. T. and Boyle E. A. (1988b) Thermocline ventilation ofanthropogenic lead in the western North Atlantic. J. Geophys. Res.93, 15715–15732.
Shirahata H., Elias R. W., Patterson C. C., and Koide M. (1980)Chronological variations in concenrations and isotopic composi-tions of anthropogenic atmospheric lead in sediments of a remotesubalpine pond. Geochim. Cosmochim. Acta 44, 149–162.
Shotyk W., Weiss D., Appleby P. G., Cheburkin A. K., Frei R., gloorM., Kramers J. D., Reese S., and Knaap W. O. V. D. (1998) Historyof atmospheric lead deposition since 12,370 14C yr BP from a PeatBog, Jura Mountains, Switzerland. Science 281, 1635–1640.
Simonetti A., Gariépy C., Banic C., Tanabe R., and Wong H. (2004) Pbisotopic investigation of aircraft-sampled emissions from the Hornesmelter (Rouyn, Québec): Implications for atmospheric pollution innortheastern North America. Geochim. Cosmochim. Acta 68, 3285–3294.
Snyder F. and Gerdemann P. (1970) Geology of the Southeast Missourilead district. In Ore Depositis of the United States, 1933–1967, Vol.1 (ed. J. Ridge). pp. 326–357. American Institute of Mining,Metallurgical and Petroleum Engineers.
Spliethoff H. and Hemond H. (1996) History of toxic metal dischargeto surface waters of the Aberjona watershed. Environ. Sci. Technol.30, 121–128.
St. Marie J. and Kesler S. E. (2000) Iron-rich and iron-poor MississippiValley–type mineralization, Metaline District, Washington. Econ.Geol. 95, 1091–1106.
Sturges W. T. and Barrie L. A. (1989) Stable lead isotope ratios inArctic aerosols: Evidence for the origin of Arctic air pollution.
Thompson T. B. and Beaty D. W. (1990) Geology and origin of oredeposits in the Leadville District, Colorado. Part II: Oxygen, hy-drogen, carbon, sulfur and lead isotope data and development of agenetic model. Econ. Geol. Monogr.7, 156–179.
Tootell L. (1963) Shipwright Saunders shipshape ships. In Ships,Sailors and Seaports, pp. 29–39. Pettaquamscutt Historical Soci-ety, Kingston, RI.
Urish D. (1991) Freshwater inflow to the Narrow River. Maritimes 35,12–14.
USGS (U.S. Geological Survey). (1998) Lead statistical compendium,Vol. 2003. U.S. Geological Survey.
Van Metre P., Mahler B., and Furlong E. (2000) Urban sprawl leavesits PAH signature. Environ. Sci. Technol. 34, 4064–4070.
Véron A. J., Church T. M., Flegal A. R., Patterson C. C., and Erel Y.(1993) Response to lead cycling in the surface Sargasso Sea tochanges in tropospheric input. J. Geophys. Res. 98, 18269–18276.
Véron A. J., Church T. M., Patterson C. C., and Flegal A. R. (1994) Useof stable lead isotopes to characterize the sources of anthropogeniclead in North Atlantic surface waters. Geochim. Cosmochim. Acta58, 3199–3206.
Véron A. J., Church T. M., and Flegal A. R. (1998) Lead isotopes in theWestern North Atlantic: Transient tracers of pollutant lead inputs.Environ. Res. Section A. 78, 104–111.
Weiss D., Shotyk W., Appleby P. G., Kramers J. D., and CheburkinA. K. (1999) Atmospheric Pb deposition since the industrial revo-lution recorded by five Swiss peat profiles: Enrichment factors,fluxes, isotopic composition and sources. Environ. Sci. Technol. 33,1340–1352.
Wilber J. S., Mutschler F. E., Friedman J. D., and Zartman R. E. (1990)New chemical, isotopic and fluid inclusion data from zinc-lead-copper veins, Shawangunk Mountains, New York. Econ. Geol. 85,182–196.
Wolff G., Ruthkosky M., Stroup D., Korsog P., Ferman M., Wendel G.,and Stedman D. (1986) Measurements of SOx, NOx and aerosolspecies on Bermuda. Atmos. Environ. 20, 1229–1239.
Wu J. and Boyle E. A. (1997) Lead in the western North AtlanticOcean: Completed response to leaded gasoline phaseout. Geochim.Cosmochim. Acta 61, 3279–3283.
Zartman R. E. and Stacey J. S. (1971) Lead isotopes and mineralizationages in Belt Supergroup rocks, northwestern Montana and northernIdaho. Econ. Geol. 66, 849–860.
Zimmerman A. R. and Canuel E. A. (2000) A geochemical record ofeutrophication and anoxia in Chesapeake Bay sediments: Anthro-pogenic influence on organic matter composition. Mar. Chem. 69,
Atmos. Environ. 23, 2513–2519. 117–137.
APPENDIX
Pb concentration, stable Pb isotope data and age model for the Pettaquamscutt River sediments.