.- NASA Technical Memorandum 100827 High-Resolution Liquid-Crystal Heat-Transfer Measurements on the End Wall of a Turbine Passage With Variations in Reynolds Number i Steven A. Hippensteele and Louis M. Russell Lewis Research Center Cleveland, Ohio Prepared for the 25th National Heat Transfer Conference sponsored by the American Society of Mechanical Engineers Houston, Texas, July 24-27, 1988 https://ntrs.nasa.gov/search.jsp?R=19890009293 2018-05-24T16:54:50+00:00Z
Transcript
.-
NASA Technical Memorandum 100827
High-Resolution Liquid-Crystal Heat-Transfer Measurements on the End Wall of a Turbine Passage With Variations in Reynolds Number
i
Steven A. Hippensteele and Louis M. Russell Lewis Research Center Cleveland, Ohio
Prepared for the 25th National Heat Transfer Conference sponsored by the American Society of Mechanical Engineers Houston, Texas, July 24-27, 1988
High-Resolution Liquid-Crystal Heat-Transfer Measurements on the End Wall of a Turbine Passage With Variations in Reynolds Number
Steven A. Hippensteele and Louis M. Russell National Aeronautics and Space Administration
Lewis Research Center Cleveland, Ohio
Abstract Local heat-transfer coefficients were experimentally mapped on the end-wall surface of a three-times turbine vane passage in a static, single-row cascade operated with room-temperature inlet air over a range of Reynolds numbers. The test surface was a composite of commercially available materials: a Mylar sheet with a layer of cholesteric liquid crystals, which change color with temperature, and a heater made of a polyester sheet coated with vapor-deposited gold, which produces uniform heat flux. After the initial selection and calibration ofthe com- posite sheet, accurate, quantitative, and continuous heat- transfer coefficients were mapped over the end-wall surface. The local heat-transfer coefficients (expressed as nondimen- sional Stanton number) are presented for inlet Reynolds numbers (based on vane axial chord) from 0.83X lo5 to 3 . 9 7 ~ io5.
Introduction
potential of using this method for obtaining heat-transfer coeffi- cients. Hippensteele et al. (ref. 2) reported quantitative, continuous heat-transfer coefficients on a model turbine-blade airfoil using this method and reported the same type of infor- mation for the turbine-vane airfoil used for this end-wall study (ref. 3).
Liquid crystals, by virtue of their property of changing color with temperature, provide a means of measuring continuous temperature and visualizing thermal patterns. By applying liquid crystals to a uniform heater and using a heat balance along with the measured electrical input power, the local heat- transfer coefficient and its distribution can be measured. The unique features of the composite sheet used for this report as stated by Hippensteele et al. (refs. 1 to 3) are its simplicity, its commercially available materials, and its ability to provide continuous, high-resolution heat-transfer coefficient maps. This composite was applied to the end wall (the floor) of the test section. The inlet air for these tests was at room temperature and pressure.
Quantitative, experimental heat-transfer coefficients were obtained on the end wall of a typical turbine-vane passage over a range of Reynolds numbers (based on axial chord) from 0 . 8 3 ~ 1 0 ' to 3 . 9 7 ~ 1 0 ' . Some typical examples of these results are presented along with an example that demonstrates the method's high-resolution capability and a novel way of presenting the heat-transfer data. Since in this study the vane end-wall surface was heated and the free stream was at room temperature, the direction of heat transfer was the opposite of what it would be in a real engine with its hot free stream. Areas of high heat transfer in this study resulted in lower surface temperatures.
A continuing objective in gas-turbine technology is higher engine efficiency. One method of obtaining higher efficiency is the use of higher engine operating temperatures. The result- ing higher turbine-inlet temperatures and pressure increase the importance of knowing the temperatures on the turbine passage surfaces. Also, more complex turbine cooling configurations are needed to provide acceptable metal temperatures and component life. The attainment of accurate metal temperature predictions and effectively cooled and durable parts requires accurate knowledge of high-resolution heat-transfer coeffi- cients. A common method of determining these coefficients is to use finite heater strips with thermocouples. This method, however, only provides average heat-transfer coefficients over discrete areas. In this study a liquid-crystal, heater-element composite sheet was used on the end-wall surface of a large- scale turbine-vane passage to determine high-resolution heat- transfer coefficients at near room-temperature conditions. The
Symbols A heated area, m2 (ft2)
h 0 heat flux. w (Btu/hr)
heat-transfer coefficient, W/m2 "C (Btu/hr ft2 O F )
I , \
investigation was conducted at relatively low cost compared with the normal thermocouple method. Inlet Reynolds numbers typical of high-temperature turbines (0.83 X lo5 to 3.97 X lo5)
Re inlet Reynolds number based on vane axial chord Sf Stanton number based On conditions .. -
were preserved. Hippensteele et al. (ref. 1) reported on the T temperature, "C (OF)
1
Subscripts: a air (recovery) e electrical power input I losses s test surface
Apparatus In the test facility (fig. 1) room-temperature air was drawn
through the tunnel, which, except for the inlet, was made of clear acrylic plastic and was 15.2 cm (6.0 in.) high and 68.58 cm (27.0 in.) wide. (The tunnel could handle up to 8.5 kg/sec (18.8 Ib/sec) of air with the test section installed for a maximum inlet velocity of 72.8 m/sec (239 ft/sec).) The maximum velocity used in the heat-transfer tests was about 56.4 m/sec (185 ft/sec). This velocity produced an inlet Reynolds number of 3.97 X lo5. The test section (fig. 2) consists of a six-vane, two-dimensional cascade that simulated a turbine-vane row. The vane profile was three times the size of an actual high-temperature turbine vane. Tailboards were used to assure periodicity at the vane row exit. The liquid- crystal, heater-element composite sheet was applied to the end wall (floor) of a center passage. An electrically supplied guard heater was attached to the underside of the floor to minimize conduction heat loss through the floor. The free-stream veloc- ity upstream of the vanes was measured with static- and total- pressure probes. The free-stream turbulence was also measured at this location.
A cross section of the complete liquid-crystal, heater-element composite is shown in figure 3. The liquid-crystal sheet was attached to the heater sheet with a double-coated adhesive material. The same type of adhesive material was used to attach the composite sheet to the end-wall test surface. The total thickness of the composite was 0.48 mm (0.019 in.). The liquid crystals were on transparent Mylar. A black plastic sealing material was used to allow the liquid-crystal colors to be seen. The overall thickness of the liquid-crystal sheet was 0.20 mm (0.008 in.). The heater sheet, commercially purchased, consisted of a vapor-deposited coating of gold on a 0.127-mm (0.005-in.) thick polyester sheet with a resistivity of 3.0 Wsquare (resistance of any square-shaped area). Copper foil bus bars were attached to the heater sheet at opposite edges along with a conductive silver paint to ensure good electrical contact. Electrical energy was supplied to the copper foil bus bars by a controllable electric power supply capable of supplying up to 30 V dc at 9 A.
The locations of the color bands on the end-wall surface were established by a set of grid lines drawn on the liquid-crystal Mylar surface with a black permanent marker pen. These lines formed 2.54 cm (1 .OO in.) squares. Although barely visible on the unheated surface, the lines showed up vividly on the heated, colored surface.
2
Procedure Experimental Heat-Transfer Coefficients
The end-wall heat-transfer coefficient was derived from an \ energy balance on the end-wall surface:
Q, - Q/ = W T s - To)
\ \
(1)
From the measured heat input Qe to the sheet (less heat losses Q,) with heated area A and the free-stream air recovery temperature To, the local heat-transfer coefficient h was calculated at the location of the calibrated-color band (an isotherm having a uniform heat-transfer coefficient). The total heat energy Q, supplied to the heater sheet was calculated from the measured voltage across the heater sheet and the current through a shunt resistor in series with the heater sheet (fig. 1). The heater current was calculated from the measured voltage across the shunt resistor of known resistance. The heat energy losses Ql are due to conduction through the end wall and radiation from the Mylar surface. The area A is the measured heated area of the heated sheet. The temperature of the test surface T, was calculated from the known liquid- crystal calibrated-color temperature and the temperature drop through the Mylar layer from its known thickness, thermal conductivity, and heat flux. The recovery temperature of the upstream, inlet free-stream air To was measured by a platinum resistance digital thermometer.
The heat-transfer coefficients are expressed as the nondimensional Stanton number based on inlet conditions.
Calibration
The liquid-crystal sheet was calibrated for correspondence between the yellow color and the temperature and for uniform- ity by immersing the sheet in a hot-water bath and observing and photographing the color changes as the water gradually cooled to room temperature. The water bath was stirred before the temperature measurement, and photographs were taken. The water temperature was measured by the same precision resistance digital thermometer. The blue color corresponded to the highest temperature and green, yellow, reddish-brown, and black to decreasing levels of temperature. The yellow color occurred over the narrowest temperature band; therefore, it was used as the calibration temperature. For the liquid-crystal sheet used in these tests, the calibration temperature was 40.9 “C (105.6 O F ) .
The accuracy of the heat-transfer coefficient depends on the uniformity of the heater-element sheet. For a detailed discussion on how the uniformity of the sheet was established, see reference 3. The uniformity of the portion selected for use is given in the “Results and Discussion” section.
Experience with liquid crystals has indicated that viewing angle and incident light angle have some effect on the resultant color. For angles between the camera-view and the strobe- aiming greater than 30°, the color shifts from yellow toward
/’
/
LTO ALTITUDE SURFACE
- T -VOLTMETER EXHAUST
TO TEST SURFACE
UJ - SHUNT
POWER SUPPLY
VOLTMETER 1
E
STAT IC
r L I Q U I D CRYSTAL AND HEATER- I ELEMENT COMPO: I c, ,ncr,rr
SITE TEST
FL& &g TOTAL PRESSURE,
/
PROBE -’
4 Figure 1 .-Schematic of test facility. Figure 2.-Cascade test section
blue, erroneously indicating a temperature greater than that of the calibrated-yellow color. For this reason, the tests for this study were conducted at included angles less than 30”.
Previous experience also has shown that the calibrated yellow- color temperature may drift with time. However, when a liquid- crystal sheet was attached to the vapor-deposited gold-on- polyester sheet (an airtight material) like the one used in this study, no calibration shift was measured 7 months later. Therefore, it is important to know whether the liquid crystals on the back of the transparent Mylar sheet are sealed and pro- tected from the long term damaging effects of air. It should be pointed out that ultraviolet light also damages liquid crystals, but acrylic plastic prevents ultraviolet light transmission.
Testing
Before the liquid-crystal heat-transfer tests were performed, the free-stream turbulence intensity levels were established. The measurements were made, both with and without a soda- straw flow straightener, with a hot wire anemometer at a free- stream velocity of 36.6 d s e c (120 ft/sec). The results of these tests will be given later.
Heat-transfer tests were made at four inlet free-stream Reynolds numbers, 0 . 8 3 ~ lo5, 1 . 4 6 ~ lo5, 2 . 6 9 ~ lo5, and 3.97x lo5. The procedure was to first bring the tunnel to the desired velocity as measured by the total- and static-pressure probes to produce the proper Reynolds number. Electric power was then supplied to the composite sheet, raising its temperature to the point at which the colors began to appear. The power input was fine tuned to obtain the desired calibrated- yellow color in the locations of interest. The location of the yellow band was varied over the air foil surface by changing the heat input while the free-stream velocity remained the same. The guard-heater electric power was adjusted so that its yellow band appeared on the bottom of the floor opposite the same general area of the test-surface yellow band.
Sufficient time had to be given to allow temperatures and the yellow band to stabilize. Typically, the first data point in a series of test runs was not taken until about 1 hr had elapsed at one combination of Reynolds number and electrical power input. Thereafter, data points were taken about every 20 to 30 min. Data were in the form of color transparencies (slides give consistent color-balance results) taken with a 35-mm camera with strobe lighting to record the locations of the yellow band and the simultaneous documentation of air inlet velocity, power input, and air temperature and pressure (fig. 1). The location of the yellow band was established by the grid-coordinate lines drawn on the liquid-crystal Mylar sheet covering the vane surface.
Results and Discussion Pressure Distribution
In order to define the flow field through the turbine passage, measurements were made of the static pressure distribution
around one of the vane airfoils at midspan and on the end-wall surface (ref. 3). A Scannivalve system was used. Pressurc:s around the airfoil were measured at 24 locations and at twil free-stream velocities, 19.8 and 36.6 m/sec (65 and 120 Wsec). A plot of the results at the higher velocity is shown in figure 4. The Re&s number (based on inlet velocity and axial chord) was 2 . 6 6 ~ lo5, and the vane-exit Mach number was 0.27.
Pressures on the end-wall surface were measured at 38 locations (fig. 5) at inlet Reynolds numbers of 0.85 X lo5, 1.58X lo5, 2.96x1O5, and 5 . 4 9 ~ 1 0 ~ . Typical results at 2 . 9 6 ~ lo5 are shown in figure 6. These plots were made by first digitizing the location and recording the numerical value of each pressure measurement. A computer program then interpolated these data to derive lines of constant pressure and to generate color contour plots. By using the color bar shown with the plot, pressures could be read at any location on the end wall. The colors used in this plot were arbitrarily assigned and are not related to the colors shown by the liquid crystals. Although two passages are shown in the plot, measurements were made in only one passage; the other is simply a duplicate. Similar plots were made at the other three inlet Reynolds
numbers. There was very little difference in the pattern of pressure distribution at the four Reynolds numbers tested. These results, along with those of the airfoil pressure distribution, would be useful in identifying some of the flow patterns. However, the end-wall pressure distribution did not match the heat-transfer patterns on the end-wall surface (as discussed in the “Experimental Heat-transfer Measurements” section).
, ,
Turbulence Intensity
The free-stream turbulence intensity was measured previously (ref. 3) at a location 19.0 cm (7.5 in.) upstream of the vane leading edge for an inlet velocity of 36.6 m/sec (120 ft/sec). When a soda-straw flow straightener section was installed, a periodic pattern in the turbulence intensity was present. This pattern was present as streaks in the liquid-crystal yellow isotherm bands on the end wall in this present study.
Figure 7 shows a comparison of results obtained with and without straws in the inlet section at flow conditions that were otherwise the same. The streaks shown in figure 7(b) clearly illustrate the capability of the liquid crystal to show small temperature variations. Since we did not want these small variations in the present study, the straw-straightener section was not used; however, a single screen was used. The average turbulence intensity was 1.4 percent without the straw- straightener section installed.
Boundary Layer Measurement
The end-wall boundary layer had been surveyed previously (Gaugler and Russell, ref. 4) and the experimental velocity profile is shown in figure 8. Included in the figure is the calculated theoretical line for a fully turbulent boundary layer. The survey was taken with a total-pressure probe at a point
4 ORIGINAL PAGE IS OF POOR QUALITY
,
1 .oo W CL 3 v) UJ W
E .98
s 0 I-
O I- .96 u c 4 c v)
B .94 E: .z I-
* 92 1 I 0 .2 . 4 .6 .8 1 .o
DIMENSIONLESS VANE SURFACE DISTANCE
Figure 4.-Measured pressure distribution around vane. Inlet free-stream velocity, 36.6 d s e c (120 ft/sec); Reynolds number, 2 . 6 6 ~ lo5; temper- ature, 23.6 "C (74.5 OF); pressure, 96.69 kPa (14.023 psia).
X
I x x ; x x x
x x x x x
Figure 5.-End-wall pressure tap locations.
INLET FLOW
t t
Figure 6.-End-wall pressure distribution. Reynolds number, 2.96 x 10⁵.
5
ORIGINAL PAGE COLOR PHOTOGRAPH
Figure 7.-Effect of straw straighteners on isotherm pattern. Reynolds number, 0.83 x 10⁵.
f DATA ERROR BAND
10 -
1 I I I I I I I I I I I I l l 1 I I 1 1 1 1 1 1 1 103
5 1 10 102
Y+ = fiwY/P
Figure 8.-Boundary layer profile at entrance to vanes, where p is density, I( is viscosity, u is velocity, rW is shear stress at wall, and y is distance from wall. Free stream velocity, 13.1 m/sec (43 ftlsec).
6
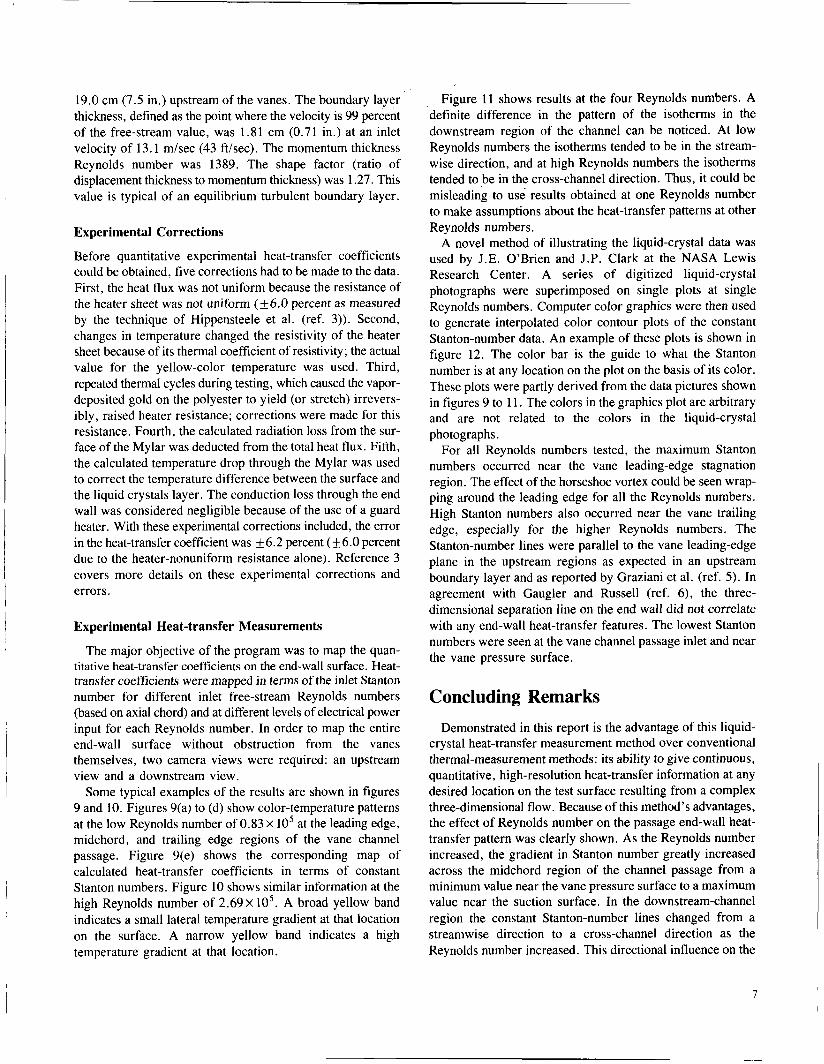
19.0 cm (7.5 in.) upstream of the vanes. The boundary layer thickness, defined as the point where the velocity is 99 percent of the free-stream value, was 1.81 cm (0.71 in.) at an inlet velocity of 13.1 m/sec (43 ft/sec). The momentum thickness Reynolds number was 1389. The shape factor (ratio of displacement thickness to momentum thickness) was 1.27. This value is typical of an equilibrium turbulent boundary layer.
Experimental Corrections
Before quantitative experimental heat-transfer coefficients could be obtained, five corrections had to be made to the data. First, the heat flux was not uniform because the resistance of the heater sheet was not uniform (f6.0 percent as measured by the technique of Hippensteele et al. (ref. 3)). Second, changes in temperature changed the resistivity of the heater sheet because of its thermal coefficient of resistivity; the actual value for the yellow-color temperature was used. Third, repeated thermal cycles during testing, which caused the vapor- deposited gold on the polyester to yield (or stretch) irrevers- ibly, raised heater resistance; corrections were made for this resistance. Fourth, the calculated radiation loss from the sur- face of the Mylar was deducted from the total heat flux. Fifth, the calculated temperature drop through the Mylar was used to correct the temperature difference between the surface and the liquid crystals layer. The conduction loss through the end wall was considered negligible because of the use of a guard heater. With these experimental corrections included, the error in the heat-transfer coefficient was +6.2 percent ( f6 .0 percent due to the heater-nonuniform resistance alone). Reference 3 covers more details on these experimental corrections and errors.
Experimental Heat-transfer Measurements
The major objective of the program was to map the quan- titative heat-transfer coefficients on the end-wall surface. Heat- transfer coefficients were mapped in terms of the inlet Stanton number for different inlet free-stream Reynolds numbers (based on axial chord) and at different levels of electrical power input for each Reynolds number. In order to map the entire end-wall surface without obstruction from the vanes themselves, two camera views were required: an upstream view and a downstream view.
Some typical examples of the results are shown in figures 9 and 10. Figures 9(a) to (d) show color-temperature patterns at the low Reynolds number of 0.83 x lo5 at the leading edge, midchord, and trailing edge regions of the vane channel passage. Figure 9(e) shows the corresponding map of calculated heat-transfer coefficients in terms of constant Stanton numbers. Figure 10 shows similar information at the high Reynolds number of 2.69 x lo5. A broad yellow band indicates a small lateral temperature gradient at that location on the surface. A narrow yellow band indicates a high temperature gradient at that location.
Figure 11 shows results at the four Reynolds numbers. A defitiite difference in the pattern of the isotherms in the downstream region of the channel can be noticed. At low Reynolds numbers the isotherms tended to be in the stream- wise direction, and at high Reynolds numbers the isotherms tended to be in the cross-channel direction. Thus, it could be misleading to use results obtained at one Reynolds number to make assumptions about the heat-transfer patterns at other Reynolds numbers.
A novel method of illustrating the liquid-crystal data was used by J.E. O’Brien and J.P. Clark at the NASA Lewis Research Center. A series of digitized liquid-crystal photographs were superimposed on single plots at single Reynolds numbers. Computer color graphics were then used to generate interpolated color contour plots of the constant Stanton-number data. An example of these plots is shown in figure 12. The color bar is the guide to what the Stanton number is at any location on the plot on the basis of its color. These plots were partly derived from the data pictures shown in figures 9 to 11. The colors in the graphics plot are arbitrary and are not related to the colors in the liquid-crystal photographs.
For all Reynolds numbers tested, the maximum Stanton numbers occurred near the vane leading-edge stagnation region. The effect of the horseshoe vortex could be seen wrap- ping around the leading edge for all the Reynolds numbers. High Stanton numbers also occurred near the vane trailing edge, especially for the higher Reynolds numbers. The Stanton-number lines were parallel to the vane leading-edge plane in the upstream regions as expected in an upstream boundary layer and as reported by Graziani et al. (ref. 5). In agreement with Gaugler and Russell (ref. 6), the three- dimensional separation line on the end wall did not correlate with any end-wall heat-transfer features. The lowest Stanton numbers were seen at the vane channel passage inlet and near the vane pressure surface.
Concluding Remarks Demonstrated in this report is the advantage of this liquid-
crystal heat-transfer measurement method over conventional thermal-measurement methods: its ability to give continuous, quantitative, high-resolution heat-transfer information at any desired location on the test surface resulting from a complex three-dimensional flow. Because of this method’s advantages, the effect of Reynolds number on the passage end-wall heat- transfer pattern was clearly shown. As the Reynolds number increased, the gradient in Stanton number greatly increased across the midchord region of the channel passage from a minimum value near the vane pressure surface to a maximum value near the suction surface. In the downstream-channel region the constant Stanton-number lines changed from a streamwise direction to a cross-channel direction as the Reynolds number increased. This directional influence on the
Figure 12.-Heat transfer coefficient maps (Stanton numbers).
J
1 1
dRlGlNAL PAGE aIU% PHOTOGRAPH
CONTOUR STANTON NUMBER
0,00370 ~ 11 0.00403
0.00461 F 0.00530
STAN T 0 N NUMBER -- ,0050
~ ,0045
- ,0040
- ,0035
(c) Reynolds number, 2 . 6 9 ~ 105.
Figure 12.-Concluded.
12
constant Stanton-number lines by Reynolds number was not known before these data were obtained. This information was obtained on the end wall of a model turbine passage, at near , ,’ room-temperature conditions, and at relatively low cost. The ’ ”’ inlet Reynolds number (based on axial chord) was varied from 0.83 x lo5 to 3.97 x lo5. This application of the method along with past applications (Hippensteele et al., refs. 1 to 3) indicates a high potential for future heat-transfer experiments with complex, two-dimensional configurations.
References I . Hippensteele, S.A., Russell, L.M., and Stepka, F.S., 1983, “Evaluation
of a Method for Heat Transfer Measurements and Thermal Visualization Using a Composite of a Heater Element and Liquid Crystals,” Journal of Heat Transfer, Vol. 105, No. 1, pp.184-189.
2. Hippensteele, S.A., Russell, L.M., and Torres, F.J., 1985, “Local Heat-Transfer Measurements on a Large, Scale-Model Turbine Blade Airfoil Using a Composite of a Heater Element and Liquid Crystals,” Journal of Engineering for Gas Turbines and Power, Vol. 107, No. 4,
3. Hippensteele, S.A., Russell, L.M., and Torres, F.J., 1987, “Use of a Liquid-Crystal, Heater-Element Composite for Quantitative, High- Resolution Heat Transfer Coefficients on a Turbine Airfoil, Including Turbulence and Surface Roughness Effects,” NASA TM-87355.
4. Gaugler, R.E., and Russell, L.M., 1982, “Flow Visualization Study of the Horseshoe Vortex in a Turbine Stator Cascade,‘ NASA TP-1884.
5. Graziani, R.A., Blair, M.F., Taylor, J.R., and Mayle, R.E., 1980, “An Experimental Study of Endwall and Airfoil Surface Heat Transfer in a Large Scale Turbine Blade Cascade,” Journal of Engineering for Power, Vol. 102, No. 2, pp. 257-267.
6. Gaugler, R.E., and Russell, L.M., 1984, “Comparison of Visualized Turbine Endwall Secondary Flows and Measured Heat Transfer Patterns,” Journal of Engineering for Gas Turbines and Power, Vol.
pp. 953-960.
106, NO. 1, pp. 168-172.
13
1. Report No.
NASA TM- 100827
High-Resolution Liquid-Crystal Heat-Transfer Measurements on the End Wall of a Turbine Passage With Variations in Reynolds Number
December 1988
2. Government Accession No. 3. Recipient's Catalog No.
4. Title and Subtitle
National Aeronautics and Space Administration Washington, D.C. 20546-0001
5. Report Date
14. Sponsoring Agency Code
7. Author(s)
Steven A. Hippensteele and Louis M. Russell
I
5. Supplementary Notes
Prepared for the 25th National Heat Transfer Conference sponsored by the American Society of Mechanical Engineers, Houston, Texas, July 24-27, 1988.
8. Performing Organization Report No.
E-4004
IO. Work Unit No.
505-62-2 1
6. Abstract
9. Performing Organization Name and Address
National Aeronautics and Space Administration Lewis Research Center Cleveland, Ohio 44135-3191
12. Sponsoring Agency Name and Address
Local heat-transfer coefficients were experimentally mapped on the end-wall surface of a three-times turbine vane passage in a static, single-row cascade operated with room-temperature inlet air over a range of Reynolds numbers. The test surface was a composite of commercially available materials: a Mylar sheet with a layer of cholesteric liquid crystals, which change color with temperature, and a heater made of a polyester sheet coated with vapor-deposited gold, which produces uniform heat flux. After the initial selection and calibration of the composite sheet, accurate, quantitative, and continuous heat-transfer coefficients were mapped over the end-wall surface. The local heat-transfer coefficients (expressed as nondimensional Stanton number) are presented for inlet Reynolds numbers (based on vane axial chord) from 0.83 x lo5 to 3.97 x lo5.
1 1 . Contract or Grant No.
13. Type of Report and Period Covered
Technical Memorandum
7. Key Words (Suggested by Author(s))
Heat transfer; Liquid crystals; End wall; Heat transfer coefficients
9. Security Classif. (of this report)
Unclassified
18. Distribution Statement
Unclassified - Unlimited Subject Category 34
22. Price' 20. Security Classif. (of this page) 21. No of pages
Unclassified 16 A03
I
I
*For sale by the National Technical Information Service, Springfield, Virginia 221 61 NASA FORM 1626 OCT 86