High-resolution mass spectrometric analysis of secondary organic aerosol produced by ozonation of limonenew Maggie L. Walser, a Yury Desyaterik, b Julia Laskin, c Alexander Laskin b and Sergey A. Nizkorodov* a Received 16th August 2007, Accepted 15th November 2007 First published as an Advance Article on the web 10th December 2007 DOI: 10.1039/b712620d Chemical composition of secondary organic aerosol (SOA) formed from the ozone-initiated oxidation of limonene is characterized by high-resolution electrospray ionization mass spectrometry in both positive and negative ion modes. The mass spectra reveal a large number of both monomeric (m/z o 300) and oligomeric (m/z 4 300) condensed products of oxidation. A combination of high resolving power (m/Dm B 60 000) and Kendrick mass defect analysis makes it possible to unambiguously determine the molecular composition of hundreds of individual compounds in SOA samples. Van Krevelen analysis shows that the SOA compounds are heavily oxidized, with average O : C ratios of 0.43 and 0.50 determined from the positive and negative ion mode spectra, respectively. A possible reaction mechanism for the formation of the first generation SOA molecular components is considered. The discussed mechanism includes known isomerization and addition reactions of the carbonyl oxide intermediates generated during the ozonation of limonene. In addition, it includes isomerization and decomposition pathways for alkoxy radicals resulting from unimolecular decomposition of carbonyl oxides that have been disregarded by previous studies. The isomerization reactions yield numerous products with a progressively increasing number of alcohol and carbonyl groups, whereas C–C bond scission reactions in alkoxy radicals shorten the carbon chain. Together these reactions yield a large number of isomeric products with broadly distributed masses. A qualitative agreement is found between the number and degree of oxidation of the predicted and measured reaction products in the monomer product range. Introduction Atmospheric aerosols impact local air quality and human health, and play a large, as yet undetermined, role in control- ling global climate. 1–6 A large portion of aerosol in both the free and polluted troposphere contains organic material, there- fore it is important to understand the chemical composition and physical properties of the most representative types of organic aerosol constituents. 7–16 Increasingly sophisticated methods, such as high-resolution mass spectrometry, are used to determine the molecular composition of atmospherically relevant organic aerosol species. 17–21 Condensed organic material resulting from the oxidation of volatile organic compounds (VOC) is usually found in sec- ondary organic aerosol (SOA). Monoterpenes constitute a significant amount of biogenic VOC emissions and have been shown to form SOA in high yields. 22 The ability of mono- terpenes to form SOA was recognized in 1960, 23 and has since been an area of great research interest. For many monoter- penes, SOA yields have been measured under different condi- tions, and the primary chemical components of SOA characterized by mass spectrometry and chromatography techniques. A variety of polyfunctional species, ranging from alcohols to ketones, aldehydes, and carboxylic acids have been detected among the gas- and particle-phase oxidation products. 24–26 In the case of the ozone-initiated oxidation of D-limonene, Leungsakul et al. 24 recently described a semi-empirical me- chanism that correctly reproduced the major first-generation products identified in SOA by chromatographic techniques. Limononaldehyde was the major identified product, followed by keto-limonene, keto-limononaldehyde, limononic acid, and keto-limononic acid (the corresponding structures are shown in Table 1). These products accounted for about 60% of the observed particle mass. Major gas-phase products included formaldehyde and keto-limonene. 25,26 A relatively stable endo-ozonide was also identified amongst the products. 26–28 Yields of SOA resulting from the ozonation of limonene were a Department of Chemistry, University of California Irvine, Irvine, California 92617-2025, USA. E-mail: [email protected]; Fax: +1-949-824-8571; Tel: +1-949-824-1262 b Environmental Molecular Sciences Laboratory, Pacific Northwest National Laboratory, Richland, Washington 99354, USA c Chemical and Materials Sciences Division, Pacific Northwest National Laboratory, Richland, Washington, 99354, USA w Electronic supplementary material (ESM) available: (a) Spread- sheets with m/z, relative abundances, and proposed elemental compo- sition of all peaks in the positive and negative ion modes used for analysis (40.5% relative intensity); (b) a large image containing a subset of all possible isomerization and decomposition pathways following decomposition of the initial endo-Criegee intermediates. Examples of stable products formed in this mechanism are outlined in Fig. 4–7, and are used to calculate the predicted properties of SOA species in Fig. 8. See DOI: 10.1039/b712620d This journal is c the Owner Societies 2008 Phys. Chem. Chem. Phys., 2008, 10, 1009–1022 | 1009 PAPER www.rsc.org/pccp | Physical Chemistry Chemical Physics
Transcript
High-resolution mass spectrometric analysis of secondary organic aerosol
produced by ozonation of limonenew
Maggie L. Walser,a Yury Desyaterik,b Julia Laskin,c Alexander Laskinb and
Sergey A. Nizkorodov*a
Received 16th August 2007, Accepted 15th November 2007
First published as an Advance Article on the web 10th December 2007
DOI: 10.1039/b712620d
Chemical composition of secondary organic aerosol (SOA) formed from the ozone-initiated
oxidation of limonene is characterized by high-resolution electrospray ionization mass
spectrometry in both positive and negative ion modes. The mass spectra reveal a large number of
both monomeric (m/z o 300) and oligomeric (m/z 4 300) condensed products of oxidation. A
combination of high resolving power (m/Dm B 60 000) and Kendrick mass defect analysis makes
it possible to unambiguously determine the molecular composition of hundreds of individual
compounds in SOA samples. Van Krevelen analysis shows that the SOA compounds are heavily
oxidized, with average O :C ratios of 0.43 and 0.50 determined from the positive and negative ion
mode spectra, respectively. A possible reaction mechanism for the formation of the first
generation SOA molecular components is considered. The discussed mechanism includes known
isomerization and addition reactions of the carbonyl oxide intermediates generated during the
ozonation of limonene. In addition, it includes isomerization and decomposition pathways for
alkoxy radicals resulting from unimolecular decomposition of carbonyl oxides that have been
disregarded by previous studies. The isomerization reactions yield numerous products with a
progressively increasing number of alcohol and carbonyl groups, whereas C–C bond scission
reactions in alkoxy radicals shorten the carbon chain. Together these reactions yield a large
number of isomeric products with broadly distributed masses. A qualitative agreement is found
between the number and degree of oxidation of the predicted and measured reaction products in
the monomer product range.
Introduction
Atmospheric aerosols impact local air quality and human
health, and play a large, as yet undetermined, role in control-
ling global climate.1–6 A large portion of aerosol in both the
free and polluted troposphere contains organic material, there-
fore it is important to understand the chemical composition
and physical properties of the most representative types of
methods, such as high-resolution mass spectrometry, are used
to determine the molecular composition of atmospherically
relevant organic aerosol species.17–21
Condensed organic material resulting from the oxidation of
volatile organic compounds (VOC) is usually found in sec-
ondary organic aerosol (SOA). Monoterpenes constitute a
significant amount of biogenic VOC emissions and have been
shown to form SOA in high yields.22 The ability of mono-
terpenes to form SOA was recognized in 1960,23 and has since
been an area of great research interest. For many monoter-
penes, SOA yields have been measured under different condi-
tions, and the primary chemical components of SOA
characterized by mass spectrometry and chromatography
techniques. A variety of polyfunctional species, ranging from
alcohols to ketones, aldehydes, and carboxylic acids have
been detected among the gas- and particle-phase oxidation
products.24–26
In the case of the ozone-initiated oxidation of D-limonene,
Leungsakul et al.24 recently described a semi-empirical me-
chanism that correctly reproduced the major first-generation
products identified in SOA by chromatographic techniques.
Limononaldehyde was the major identified product, followed
by keto-limonene, keto-limononaldehyde, limononic acid, and
keto-limononic acid (the corresponding structures are shown
in Table 1). These products accounted for about 60% of the
observed particle mass. Major gas-phase products included
formaldehyde and keto-limonene.25,26 A relatively stable
endo-ozonide was also identified amongst the products.26–28
Yields of SOA resulting from the ozonation of limonene were
aDepartment of Chemistry, University of California Irvine, Irvine,California 92617-2025, USA. E-mail: [email protected];Fax: +1-949-824-8571; Tel: +1-949-824-1262
b Environmental Molecular Sciences Laboratory, Pacific NorthwestNational Laboratory, Richland, Washington 99354, USA
cChemical and Materials Sciences Division, Pacific NorthwestNational Laboratory, Richland, Washington, 99354, USAw Electronic supplementary material (ESM) available: (a) Spread-sheets with m/z, relative abundances, and proposed elemental compo-sition of all peaks in the positive and negative ion modes used foranalysis (40.5% relative intensity); (b) a large image containing asubset of all possible isomerization and decomposition pathwaysfollowing decomposition of the initial endo-Criegee intermediates.Examples of stable products formed in this mechanism are outlinedin Fig. 4–7, and are used to calculate the predicted properties of SOAspecies in Fig. 8. See DOI: 10.1039/b712620d
This journal is �c the Owner Societies 2008 Phys. Chem. Chem. Phys., 2008, 10, 1009–1022 | 1009
PAPER www.rsc.org/pccp | Physical Chemistry Chemical Physics
Table 1 Elemental composition for the 5 most abundant peaks observed in the positive (top) and negative (bottom) ESI ion modes. Up to 3structures consistent with the measured compositions are shown in the last column. The structures are taken from the mechanism presented inFig. 4–7 and in the ESMw
Measuredm/z
Relativeabundance
Ioncomposition
Non-ionizedcomposition
Possiblestructures
209.0777 100 NaC9H14O4+ C9H14O4
207.0984 87 NaC10H16O3+ C10H16O3
223.0933 78 NaC10H16O4+ C10H16O4
193.0827 51 NaC9H14O3+ C9H14O3
191.1036 37 NaC10H16O2+ C10H16O2
185.0817 100 C9H13O4� C9H14O4 Same as for positive ion mode, m/z 209.0777
199.0974 37 C10H15O4� C10H16O4 Same as for positive ion mode, m/z 223.0933
1010 | Phys. Chem. Chem. Phys., 2008, 10, 1009–1022 This journal is �c the Owner Societies 2008
reported in ref. 29–33. The observed SOA yields for limonene
are generally higher29 than those for monoterpenes containing
a single double bond, such as a- or b-pinene.The presence of oligomeric species in terpene-derived SOA
particles has been reported by multiple groups19,34–42 but the
mechanism of their formation is still not fully understood.
This work focuses on the identification of the monomeric and
oligomeric chemical species present in SOA particles produced
from the ozone-induced oxidation of limonene. We take
advantage of the rapidly developing tools of high-resolution
mass spectrometry that have the potential to analyze aerosol
particle composition without chromatographic separation
techniques. Furthermore this work, along with that of
Reinhardt et al.,19 represents the first application of advanced
mass spectrometric techniques developed for the analysis of
complex mixtures to SOA characterization.
Typical mixing ratios of ozone in the lower atmosphere
range from about 0.03 ppm (parts per million by volume)
in clean air to over 0.3 ppm in heavily polluted air.2 Atmo-
spheric mixing ratios of monoterpenes rarely exceed 0.01 ppm.
The mixing ratios of reactants used in this work are in the
1–10 ppm range, considerably higher than typical ambient
levels. However, such high concentrations of ozone
and limonene do occur in indoor air during building disinfec-
tion by ozone-generating air purifiers and normal cleaning,
respectively.43,44 Reactions between ozone and terpenes
are well known to produce organic aerosol in indoor
environments,30,45–48 and the reaction products are known
to be strong irritants.49–51 An additional objective of this
work is to provide information on the types of chemical
functional groups, and the degree of oxidation, in
aerosol constituents formed under such extreme oxidation
conditions.
Experiment
Model SOA particles were formed by the ozone-initiated
oxidation of D-limonene vapor in an inflatable Teflon reaction
chamber (Fig. 1). A fan was used to ensure rapid mixing of
ozone and limonene in the chamber. The chamber was first
filled with approximately 200 L of oxygen (99.994% purity).
Ozone was produced at concentrations ranging from 1–10
ppm using a small commercial ozone-generator (EZ-Com air
purifier; 68 mg O3 per hour52) placed directly inside the
chamber. Pure oxygen was used rather than air to minimize
impurities and avoid production of NOx by the ozone source.
Once the desired ozone concentration was achieved, a 0.1 slpm
(standard liters per minute) oxygen flow saturated with
D-limonene vapor was injected into the chamber over the
Table 1 (continued )
Measuredm/z
Relativeabundance
Ioncomposition
Non-ionizedcomposition
Possiblestructures
171.0661 32 C8H11O4� C8H12O4
201.0766 25 C9H13O5� C9H14O5
183.1024 17 C10H15O3� C10H16O3 Same as for positive ion mode m/z 207.0984
Fig. 1 Aerosol generation setup. Limonene reacts with ozone in the
dark for 15–60 min. The aerosol samples are collected by filtration and
extracted in a suitable solvent for mass spectrometric analysis.
This journal is �c the Owner Societies 2008 Phys. Chem. Chem. Phys., 2008, 10, 1009–1022 | 1011
course of 10 min. The saturated vapor was obtained by flowing
oxygen through a temperature-controlled bubbler containing
limonene (97% purity, Fisher Scientific) at T = 298 K (partial
pressure of D-limonene = 260 Pa). In the absence of ozone, the
final concentration of D-limonene in the 200 L chamber would
beB10 ppm, but this level was not achieved because oxidation
and particle growth occurred in parallel with the slow
D-limonene addition. The resulting mixture was allowed to
age in the dark, at room temperature (B298 K), low relative
humidity (B0–1%), and ambient pressure (B750 Torr), for
15–60 min before particle collection.
The particles were collected on a glass fiber filter by pump-
ing air through the filter at 30 slpm over the course ofB6 min.
The particle filter collection efficiency was 495% for particles
larger than 0.1 mm.53 The SOA material was subsequently
extracted by sonicating the filter in 10 mL of solvent (metha-
nol, acetonitrile, dichloromethane, or water). Secondary ex-
traction of previously extracted filters resulted in much weaker
mass spectra, suggesting that most soluble SOA material was
extracted. It is possible, however, that a fraction of SOA
material was not soluble in these solvents and remained on
the filters. Isotopically labeled CD3CN and CD3OH solvents
were used to assess the degree of functionalization of the
analyte molecules by the solvents. Exposure to ambient light
was minimized during the collection and extraction processes.
The resulting extracts were then filtered through a 0.45 mmpore syringe filter before mass spectrometric analysis.
The composition of the SOA extracts was probed using a
Finnigan LTQ (linear ion trap) Orbitrapt Hybrid Mass
Spectrometer (Thermo Electron Corporation) with a modified
electrospray ionization (ESI) source. Samples were injected
through a pulled fused silica capillary tip (50 mm id) at a flow
rate of 0.5–1.5 mL min�1 using a spray voltage of 3.5 kV. The
mass spectra were acquired in both positive and negative ion
modes with a resolving power of 60 000 (m/Dm at 400 amu).
The instrument was calibrated using a mixture of stock
solutions of caffeine, MRFA, and Ultramark 1621.
Results
High-resolution mass spectrometric data were used to generate
the stick spectra shown in Fig. 2. Peaks resulting from solvent
impurities were not included in the stick spectra. Fig. 2a shows
a representative mass spectrum of a limonene-derived SOA
sample extracted in acetonitrile obtained in the positive ESI
ion mode with resolving power of 60 000. The spectrum
contains more than 600 peaks in the m/z range of 100–1000
with intensities exceeding 0.5% of the most abundant peak at
m/z 209.0777. The peaks are clustered in clearly identifiable
groups separated by B14 amu. In addition, there is a broader
pattern resulting from the presence of oligomerization pro-
ducts: the cluster of peaks centered at m/z 200 corresponds to
monomeric products; peaks centered at m/z 400 are dimeric
products; and so on.
Composition of the observed peaks was determined by the
mass spectrometer software (Xcaliburt) assuming that ions
contain only 12C, 13C, 1H, 16O, and 23Na atoms, and verified
for consistency as described below. Analysis of the measured
m/z values showed that all major positive peaks in the mono-
meric range (m/z o 300) contain one Na atom. Alternative
composition assignments containing zero or two Na atoms
resulted in deviations between the measured and predicted m/z
values that were in excess of the experimental uncertainty.
Therefore, complexation to 23Na+ (m/z 22.9898) was assumed
to be the primary ionization pathway for all positive peaks.
This assumption is consistent with mass spectra of several
standards recorded under similar experimental conditions.
Fig. 2 Representative ESI mass spectra of SOA particles extracted in
acetonitrile. The data include peaks with Z 0.5% abundance relative
to the largest peak in the spectrum. (a) Stick spectra in the positive and
(b) negative ion modes. (c) Comparison of positive (up) and negative
(down) mass spectra on a logarithmic intensity scale after subtracting
the exact mass of 23Na from the positivem/z scale and adding the exact
mass of 1H to the negative m/z scale (to make the plot pertinent to the
neutral analyte).
1012 | Phys. Chem. Chem. Phys., 2008, 10, 1009–1022 This journal is �c the Owner Societies 2008
The mass spectrum of the same acetonitrile SOA extract
obtained in the negative ESI ion mode is shown in Fig. 2b. It
contains about 220 peaks above the 0.5% intensity threshold.
The spectrum obtained in the negative mode displays very
similar features to the positive-ion spectrum, i.e. broad fea-
tures corresponding to monomeric, dimeric, and trimeric
products as well as repeated clusters of peaks separated by
B14 amu. Based on the mass spectra of standards, the major
ionization pathway is deprotonation, i.e., removal of a proton
(m/z 1.0078) from the analyte molecules. Therefore, the com-
position was assigned assuming that the negative ions contain
only 12C, 13C, 1H, and 16O atoms. There was no evidence for
the presence of multiply charged ions (z 4 1) in either positive
or negative ion mode spectra.
The most abundant peaks in the positive and negative ion
mode spectra, atm/z 209.0777 and 185.0817, respectively, were
assigned to the same neutral precursor C9H14O4, which most
likely corresponds to limonic acid.24 This is not an isolated
coincidence. Table 1 shows elemental composition and possi-
ble structural assignments for the 5 most abundant peaks
measured in each ion mode. All of these species are simulta-
neously detected in both modes. Furthermore, there is a good
correlation between the positions and intensities of [M+Na]+
peaks in the positive ion mode spectrum and [M�H]� peaks in
the negative ion mode spectrum. To emphasize this point,
Fig. 2c explicitly compares the positive ion mode spectrum
shifted by the exact mass of one 23Na atom and the negative
ion mode spectrum shifted towards higher masses by the exact
mass of the proton. The horizontal axis in this plot essentially
corresponds to the molecular weight of the neutral analyte
molecules. Although many peaks appear in both modes, there
is also a significant number of peaks observed in only one ion
mode, which indicates that data from both ion modes provide
complementary information necessary for detailed character-
ization of the aerosol composition.
The spectra shown in Fig. 2 correspond to SOA prepared by
reacting 10 ppm ozone and 10 ppm limonene for 1 h. Spectra
were also obtained at different limonene : ozone ratios
(10 ppm : 1 ppm and 1 ppm : 10 ppm) and at variable reaction
times. SOA samples prepared using lower concentrations were
all extracted in methanol and compared to the methanol
analogs of the spectra shown in Fig. 2. A surprising result
was that these spectra all had a similar overall appearance
suggesting that the effect of reactants’ concentrations on the
distribution of extractable products is small. A considerably
larger reaction chamber will be used in future experiments to
obtain mass spectra at sub-ppm concentrations of reactants.
In addition, the reaction conditions were modified to in-
clude an excess amount of an OH-scavenger (up to 500 ppm of
2-butanol). Addition of the scavenger did not significantly
affect the resulting mass spectra, suggesting that enough
volatile products were generated by the oxidation of limonene
to efficiently convert OH radicals produced by decomposition
of carbonyl oxides into HO2.
Mass spectra of SOA extracts in methanol looked qualita-
tively similar to the spectra of acetonitrile extracts, and the
observed abundances of different features were comparable for
both solvents. However, the exact peak positions were not
identical, with clear evidence of methylation (addition of
CH3OH) of a large fraction of SOA peaks in the methanol
mass-spectra. Indeed, for 51 and 45% of peaks below m/z 300
in the positive and negative ion modes, respectively, there is an
overlap between peaks in acetonitrile mass spectra and peaks
in the methanol mass spectra shifted down by 32.0262 amu,
the molecular weight of a methanol molecule. The methylation
was observed in both positive and negative ion modes suggest-
ing that it occurred during the SOA extraction, and not during
the electrospray process. MS/MS fragmentation experiments
(not shown here) confirmed that methanol addition results in
formation of new covalent bonds, rather than weakly asso-
ciated complexes between ions and solvent molecules.
Additional evidence of solvent reactions was obtained using
isotopically labeled solvents. There was no observable differ-
ence between positive ion mode spectra obtained from samples
extracted in acetonitrile and acetonitrile-d3, while negative ion
mode spectra showed very few, likely insignificant, differences.
These results indicate that acetonitrile does not react with
analyte molecules. SOA samples were also extracted in both
methanol and methanol-d3. A comparison of the major peaks
in the positive mode and smaller peaks in the negative ion
mode showed a shift of 3.0188 amu, which corresponds to
replacing 3 hydrogen atoms with 3 deuterium atoms when
methanol solvent molecules react with analyte molecules.
Detailed discussion of the effect of solvent on the analysis of
SOA using ESI-MS will be presented in a separate publication.
Mass spectra obtained from dichloromethane SOA extracts
were similar in the overall appearance but considerably weaker
in intensity suggesting that the majority of the observed peaks
correspond to moderately polar species. In addition, there
were impurity peaks resulting from reaction between dichloro-
methane and ion source components. Spectra obtained for
SOA samples extracted in water were comparable in both
appearance and intensities to acetonitrile spectra obtained in
the positive ion mode. In contrast, negative ion mode spectra
were characterized by considerably weaker signal intensities.
Therefore, dichloromethane and water were abandoned as
SOA extracting solvents after a few initial trials. To avoid
complications arising from solvent effects, the analysis de-
scribed below is limited to mass spectra obtained using
acetonitrile as the extracting solvent.
Two representative mass spectra recorded in acetonitrile
were selected for a detailed analysis. All peaks in the negative
ion mode above the 0.5% intensity cutoff were assigned a
tentative elemental composition by Xcaliburt assuming that
the peaks contain only 12C, 13C, 16O, and 1H isotopes. We
explicitly verified that all major peaks in the spectra had a
neighboring peak at m/z + 1.0034 corresponding to incor-
poration of one 13C atom. The ratio of intensities of 13C- and12C-containing peaks was close to the expected nC � 0.0108,
where nC is the number of carbon atoms in the molecules.
Although these 13C peaks did not add additional information
about SOA composition, they were used to confirm the
validity of the peak assignments. In the positive ion spectra,
the peaks were assumed to contain one 23Na atom in addition
to 12C, 13C, 16O, and 1H.
Because some of the elemental compositions suggested by
Xcaliburt had unrealistic C :H or C :O ratios, the initial peak
assignments were additionally assessed for consistency using
This journal is �c the Owner Societies 2008 Phys. Chem. Chem. Phys., 2008, 10, 1009–1022 | 1013
Kendrick analysis.54 This approach provides an effective
visual method of presenting a mass spectrum in a two-
dimensional way, and offers much more chemical insight into
the composition of complicated mixtures than a standard mass
spectrum. It introduces a new mass scale alternative to the12C-based IUPAC scale. The new mass scale can be based on
any chemical moiety; CH2 and oxygen atom are the most
commonly used bases for the Kendrick analysis of complex
mass spectra.54 We illustrate this approach using a
CH2-Kendrick diagram that eliminates any mass defect due
to the 12CH2 group as an example. The Kendrick mass
(KMCH2) is calculated by re-normalizing the IUPAC scale to
the CH2 Kendrick scale that equates the exact mass of the12CH2 group to 14.0000 amu (eqn (1)). The Kendrick mass
defect (KMD) is calculated as the difference between the
nominal value of KM (rounded up to the nearest integer)
and KM (eqn (2)).
KMCH2¼ ðm=zÞ � 14:000 00
14:015 65ð1Þ
KMDCH2¼ Nominalmass�KMCH2
ð2Þ
Kendrick plots are constructed by plotting the values of
KMDCH2vs. KMCH2
. The advantage of this approach is that
KMDCH2values are identical for families of species that differ
from each other only by the number of CH2 groups, referred
to hereafter as CH2-families. Kendrick diagrams have been
extensively used in petroleomics research,55–57 and for the
analysis of complex mass spectra of natural organic mat-
ter.58–60 They have only recently been applied to the analysis
of the chemical composition of organic aerosols.19 The peaks
were also analyzed by an analogous method in which the
measured m/z values were normalized to a mass scale in which
the m/z of the 16O atom is 16.0000 amu (eqns (3) and (4)). To
make our KMDCH2values directly comparable with the results
of ref. 19 the nominal masses were calculated by rounding
KMCH2up to the nearest integer; the same procedure was used
for calculating nominal KMO values.
KMO ¼ ðm=zÞ �16:000 00
15:994 92ð3Þ
KMDO ¼ Nominalmass�KMO ð4Þ
Fig. 3a shows a CH2-Kendrick plot, i.e., KMDCH2vs.KMCH2
,
constructed using the data from both the positive and negative
mass spectra discussed earlier. For clarity, only data (including13C-containing peaks) above 1% relative abundance are
shown. To make a meaningful comparison between positive
and negative ion mode data, the KMCH2and KMDCH2
values
are calculated for the neutral precursors of the ions appearing
in the ESI mass spectra. Specifically, because positive ions are
cationized with sodium, [M+Na]+, the m/z values measured
in the positive ion mode have been shifted down by 22.9898
amu, and the m/z values of deprotonated [M�H]� ions
measured in the negative ion mode have been shifted up by
1.0078 amu before calculating KMCH2and KMDCH2
. The size
of each point is proportional to the logarithm of the
peak intensity. Fig. 3 also provides a visual representation
of the degree of overlap between peaks measured in the two
modes. For species observed in both negative and positive
ion mode spectra, the experimental values of KMD are
the same within the experimental uncertainty,
|KMD(�)–KMD(+)| o B0.001 amu.
Fig. 3 Data with Z 1.0% relative abundance, obtained in the
positive and negative ion modes: (a) CH2-Kendrick plot. Species
separated by CH2 groups fall on horizontal lines. (b) Oxygen Kendrick
plot. Species separated by O atoms fall on horizontal lines. (c) van
Krevelen plot. A plot of the H :C atomic ratio versus the O :C atomic
ratio provides a visual representation of the degree of oxidation of the
SOA component species. The size of the data points in all plots is
proportional to the logarithm of the peak intensity. All plots are
constructed for neutral species corresponding to ions detected in
positive and negative mode mass spectra.
1014 | Phys. Chem. Chem. Phys., 2008, 10, 1009–1022 This journal is �c the Owner Societies 2008
Points with identical KMDCH2forming lines parallel to the
x-axis correspond to families of species CxHyOz(CH2)n with a
fixed oxygen atom content (x, y, z = fixed; n = variable) and
varying numbers of CH2 groups. For example, one of the lines
in the inset in Fig. 3a corresponds to a family C5H6O4(CH2)nwith n ranging from 0 to 4 for negative ions and from 2 to 6 for
positive ions. Average experimental values of KMDCH2for
this family are 0.1183 (negative ions) and 0.1191 (positive
ions), which is equal to the predicted KMDCH2of 0.1186
within the experimental error in m/z. For the data sets used
in this analysis, such n-families generally contained up to 8 and
6 members in the positive and negative ion mode spectra,
respectively.
For species containing only carbon, hydrogen, and oxygen,
a larger CH2-Kendrick defect generally implies a higher degree
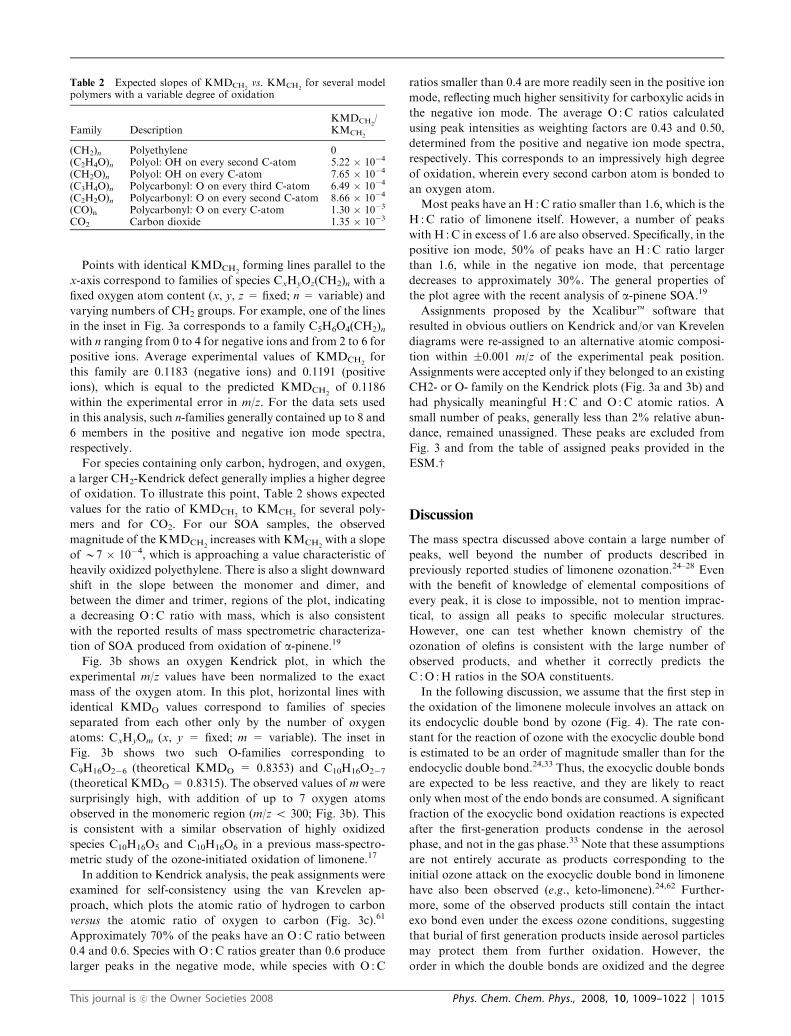
of oxidation. To illustrate this point, Table 2 shows expected
values for the ratio of KMDCH2to KMCH2
for several poly-
mers and for CO2. For our SOA samples, the observed
magnitude of the KMDCH2increases with KMCH2
with a slope
of B7 � 10�4, which is approaching a value characteristic of
heavily oxidized polyethylene. There is also a slight downward
shift in the slope between the monomer and dimer, and
between the dimer and trimer, regions of the plot, indicating
a decreasing O :C ratio with mass, which is also consistent
with the reported results of mass spectrometric characteriza-
tion of SOA produced from oxidation of a-pinene.19
Fig. 3b shows an oxygen Kendrick plot, in which the
experimental m/z values have been normalized to the exact
mass of the oxygen atom. In this plot, horizontal lines with
identical KMDO values correspond to families of species
separated from each other only by the number of oxygen
atoms: CxHyOm (x, y = fixed; m = variable). The inset in
Fig. 3b shows two such O-families corresponding to
C9H16O2�6 (theoretical KMDO = 0.8353) and C10H16O2�7(theoretical KMDO = 0.8315). The observed values of m were
surprisingly high, with addition of up to 7 oxygen atoms
observed in the monomeric region (m/z o 300; Fig. 3b). This
is consistent with a similar observation of highly oxidized
species C10H16O5 and C10H16O6 in a previous mass-spectro-
metric study of the ozone-initiated oxidation of limonene.17
In addition to Kendrick analysis, the peak assignments were
examined for self-consistency using the van Krevelen ap-
proach, which plots the atomic ratio of hydrogen to carbon
versus the atomic ratio of oxygen to carbon (Fig. 3c).61
Approximately 70% of the peaks have an O :C ratio between
0.4 and 0.6. Species with O :C ratios greater than 0.6 produce
larger peaks in the negative mode, while species with O :C
ratios smaller than 0.4 are more readily seen in the positive ion
mode, reflecting much higher sensitivity for carboxylic acids in
the negative ion mode. The average O :C ratios calculated
using peak intensities as weighting factors are 0.43 and 0.50,
determined from the positive and negative ion mode spectra,
respectively. This corresponds to an impressively high degree
of oxidation, wherein every second carbon atom is bonded to
an oxygen atom.
Most peaks have an H :C ratio smaller than 1.6, which is the
H :C ratio of limonene itself. However, a number of peaks
with H :C in excess of 1.6 are also observed. Specifically, in the
positive ion mode, 50% of peaks have an H :C ratio larger
than 1.6, while in the negative ion mode, that percentage
decreases to approximately 30%. The general properties of
the plot agree with the recent analysis of a-pinene SOA.19
Assignments proposed by the Xcaliburt software that
resulted in obvious outliers on Kendrick and/or van Krevelen
diagrams were re-assigned to an alternative atomic composi-
tion within �0.001 m/z of the experimental peak position.
Assignments were accepted only if they belonged to an existing
CH2- or O- family on the Kendrick plots (Fig. 3a and 3b) and
had physically meaningful H :C and O :C atomic ratios. A
small number of peaks, generally less than 2% relative abun-
dance, remained unassigned. These peaks are excluded from
Fig. 3 and from the table of assigned peaks provided in the
ESM.w
Discussion
The mass spectra discussed above contain a large number of
peaks, well beyond the number of products described in
previously reported studies of limonene ozonation.24–28 Even
with the benefit of knowledge of elemental compositions of
every peak, it is close to impossible, not to mention imprac-
tical, to assign all peaks to specific molecular structures.
However, one can test whether known chemistry of the
ozonation of olefins is consistent with the large number of
observed products, and whether it correctly predicts the
C :O :H ratios in the SOA constituents.
In the following discussion, we assume that the first step in
the oxidation of the limonene molecule involves an attack on
its endocyclic double bond by ozone (Fig. 4). The rate con-
stant for the reaction of ozone with the exocyclic double bond
is estimated to be an order of magnitude smaller than for the
endocyclic double bond.24,33 Thus, the exocyclic double bonds
are expected to be less reactive, and they are likely to react
only when most of the endo bonds are consumed. A significant
fraction of the exocyclic bond oxidation reactions is expected
after the first-generation products condense in the aerosol
phase, and not in the gas phase.33 Note that these assumptions
are not entirely accurate as products corresponding to the
initial ozone attack on the exocyclic double bond in limonene
have also been observed (e.g., keto-limonene).24,62 Further-
more, some of the observed products still contain the intact
exo bond even under the excess ozone conditions, suggesting
that burial of first generation products inside aerosol particles
may protect them from further oxidation. However, the
order in which the double bonds are oxidized and the degree
Table 2 Expected slopes of KMDCH2vs. KMCH2
for several modelpolymers with a variable degree of oxidation
Family DescriptionKMDCH2
/KMCH2
(CH2)n Polyethylene 0(C2H4O)n Polyol: OH on every second C-atom 5.22 � 10�4
(CH2O)n Polyol: OH on every C-atom 7.65 � 10�4
(C3H4O)n Polycarbonyl: O on every third C-atom 6.49 � 10�4
(C2H2O)n Polycarbonyl: O on every second C-atom 8.66 � 10�4
(CO)n Polycarbonyl: O on every C-atom 1.30 � 10�3
CO2 Carbon dioxide 1.35 � 10�3
This journal is �c the Owner Societies 2008 Phys. Chem. Chem. Phys., 2008, 10, 1009–1022 | 1015
of oxidation will not affect the overall conclusions of this
analysis.
The initial ozone attack on the endocyclic double bond
generates an unstable primary endo-ozonide (POZ) that
quickly decomposes into one of two possible endo carbonyl
oxides (labeled Criegee I and II in Fig. 4). These carbonyl
oxides are endowed with a considerable amount of internal
energy that is disposed of by isomerization, decomposition, or
recombination, leading to a host of known products of the
ozonation of limonene.24–28 Fig. 4 shows pathways to pre-
viously identified products of ozonation of limonene including
densation reactions of the initial products with small mole-
cules with H :C 4 1.6 (e.g. with formaldehyde or water)
would increase the H :C ratio. However, Fig. 8b shows that
the proposed mechanism generates products with H :C ratio
4 1.6 without invoking such hydrogenation processes. For
example, the loss of CO2 during decomposition of carbonyl
oxides increases the H :C ratio. Additionally, formation of a
stable alcohol through RO2 self-reactions or peroxide through
reaction of RO2 with HO2 results in addition of a hydrogen
atom without addition of a carbon atom, which also increases
the H :C ratio.
Fig. 8b also illustrates that a number of points in the
O:C–H:C coordinate space remain unexplained by the as-
sumed reactions of RO and RO2 free radicals. This is likely
a result of the over restrictive rules built into the presented
mechanism (for example, the requirement for RO radicals to
abstract H-atoms only from g-carbon atoms). However, this
may also reflect neglect of secondary chemistry taking place in
the condensed phase. Cross-polymerization of carbonyls, de-
composition of peroxides and ozonides, cyclization of mole-
cules containing carbonyl and hydroxyl functional groups,
ester formation, and similar processes may slowly change the
composition of SOA samples as they are collected and ana-
lyzed. Therefore, our future efforts will be directed toward
understanding the mechanism of slow aging processes in SOA.
Conclusions
High-resolution mass spectrometric characterization of SOA
particles formed from the ozone-induced oxidation of limo-
nene confirmed that the composition of these particles is
significantly more complex than that predicted by the basic
Criegee mechanism of alkene ozonolysis. This work convin-
cingly demonstrates that in order to account for the very large
number of poly-functional species that exist in SOA in both
monomeric and polymeric form, one has to include rich
chemistry involving alkylperoxy and alkoxy radicals formed
from the decomposition of carbonyl oxide intermediates.
Furthermore, we describe a minimal set of reactions required
to produce a distribution of limonene ozonation products that
is consistent with mass-spectrometric observations. Even with
a fairly restrictive set of reaction rules, inclusion of alkylper-
oxy and alkoxy chemistry in limonene ozonation produces
some 1000 products with 140 unique m/z values in the mono-
meric mass range (m/z o 300). The large number of isomeric
products produced in the oxidation of just one terpene shows
how challenging it will be to obtain detailed characterization
of molecular composition of ambient SOA particles that
typically result from oxidation of multiple precursors.
The ultimate goal of research on chemical mechanisms of
SOA formation is to find out which reactions out of the
infinite number of possibilities actually take place, and which
are likely to be insignificant. We expect that for such complex
systems the answer to this question will come from coupling
mass spectrometry and information theory, and this work can
be viewed as the first step in that direction.
We take advantage of both positive and negative ion mass
spectra mode, which allows the identification of a more
complete set of SOA species. The similarities and differences
between spectra obtained in the two ion modes clearly show
that complementary information is obtained by using both
modes. Our analysis shows that more oxidized species (e.g.
carboxylic acids vs. corresponding aldehydes) are more readily
detected in the negative ion mode. The use of Kendrick and
van Krevelen analysis, tools commonly used in mass spectro-
metry of complex mixtures, allows the identification of homo-
logous series of products with varying degrees of oxidation.
Analysis of oligomeric species (m/z 4 300) is currently under-
way, and this, along with a proposed mechanism for oligomer
formation, will be presented in another publication.
Acknowledgements
This study was supported by the National Science Foundation
through the Environmental Molecular Science Institute pro-
gram, grant CHE-0431312, and Atmospheric Chemistry pro-
gram, grant ATM-0509248. M.L.W. was supported by a
National Science Foundation Graduate Research Fellowship.
The research described in this paper was performed in the
Environmental Molecular Sciences Laboratory, a national
scientific user facility sponsored by the Department of
Energy’s (DOE) Office of Biological and Environmental
Research and located at the Pacific Northwest National
Laboratory. J.L. acknowledges support from the Chemical
Sciences Division, Office of Basic Energy Sciences of the
US DOE.
References
1 M. Kanakidou, J. H. Seinfeld, S. N. Pandis, I. Barnes, F. J.Dentener, M. C. Facchini, R. Van Dingenen, B. Ervens, A. Nenes,C. J. Nielsen, E. Swietlicki, J. P. Putaud, Y. Balkanski, S. Fuzzi, J.Horth, G. K. Moortgat, R. Winterhalter, C. E. L. Myhre, K.Tsigaridis, E. Vignati, E. G. Stephanou and J. Wilson, Organicaerosol and global climate modeling: A review, Atmos. Chem.Phys., 2005, 5, 1053–1123.
2 B. J. Finlayson-Pitts and J. N. Pitts, Chemistry of the Upper andLower Atmosphere: Theory, Experiments, and Applications, Aca-demic Press, San Diego–London, 2000.
3 C. A. Pope, III, R. T. Burnett, M. J. Thun, E. E. Calle, D. Krewski,K. Ito and G. D. Thurston, Lung cancer, cardiopulmonarymortality, and long-term exposure to fine particulate air pollution,J. Am. Med. Assoc., 2002, 287, 1132–1141.
1020 | Phys. Chem. Chem. Phys., 2008, 10, 1009–1022 This journal is �c the Owner Societies 2008
4 D. W. Dockery, C. A. Pope, 3rd, X. Xu, J. D. Spengler, J. H.Ware, M. E. Fay, B. G. Ferris, Jr and F. E. Speizer, An associationbetween air pollution and mortality in six U.S. cities, N. Engl. J.Med., 1993, 329, 1753–1759.
5 W. J. Gauderman, G. F. Gilliland, H. Vora, E. Avol, D. Stram, R.McConnell, D. Thomas, F. Lurmann, G. Margolis Helene, B.Rappaport Edward, K. Berhane and M. Peters John, Associationbetween air pollution and lung function growth in southernCalifornia children: results from a second cohort, Am. J. Respir.Crit. Care Med., 2000, 166, 76–84.
6 J. H. Seinfeld and S. N. Pandis, Atmospheric Chemistry andPhysics: From Air Pollution to Climate Change, Wiley Interscience,1998.
7 H. -J. Lim and B. J. Turpin, Origins of Primary and SecondaryOrganic Aerosol in Atlanta: Results of Time-Resolved Measure-ments during the Atlanta Supersite Experiment, Environ. Sci.Technol., 2002, 36, 4489–4496.
8 C. Alves, A. Carvalho and C. Pio, Mass balance of organic carbonfractions in atmospheric aerosols, J. Geophys. Res., [Atmos.],2002, 107(D21), 8345, DOI: 10.1029/2001JD000616.
9 R. A. Duce, V. A. Mohnen, P. R. Zimmerman, D. Grosjean, W.Cautreels, R. Chatfield, R. Jaenicke, J. A. Ogren, E. D. Pellizzariand G. T. Wallace, Organic material in the global troposphere,Rev. Geophys. Space Phys., 1983, 21, 921–952.
10 M. C. Jacobson, H. C. Hansson, K. J. Noone and R. J. Charlson,Organic atmospheric aerosols: review and state of the science, Rev.Geophys., 2000, 38, 267–294.
11 L. M. Hildemann, G. R. Markowski and G. R. Cass, Chemicalcomposition of emissions from urban sources of fine organicaerosol, Environ. Sci. Technol., 1991, 25, 744–759.
12 D.-Y. Liu, R. J. Wenzel and K. A. Prather, Aerosol time-of-flightmass spectrometry during the Atlanta Supersite Experiment: 1.Measurements, J. Geophys. Res., [Atmos.], 2003, 108(D7), 8427.
13 A. M. Middlebrook, D. M. Murphy and D. S. Thomson,Observations of organic material in individual marine particlesat Cape Grim during the First Aerosol CharacterizationExperiment (ACE 1), J. Geophys. Res., [Atmos.], 1998, 103,16475–16483.
14 M. Mochida, Y. Kitamori, K. Kawamura, Y. Nojiri and K.Suzuki, Fatty acids in the marine atmosphere: factors governingtheir concentrations and evaluation of organic films on sea-saltparticles, J. Geophys. Res., [Atmos.], 2002, 107(D17), 4325.
15 D. M. Murphy, D. S. Thomson and M. J. Mahoney, In situmeasurements of organics, meteoritic material, mercury, andotherelements in aerosols at 5 to 19 kilometers, Science, 1998,282, 1664–1669.
16 F. Raes, T. Bates, F. McGovern and M. Van Liedekerke, The 2ndAerosol Characterization Experiment (ACE-2): general overviewand main results, Tellus B, 2000, 52B, 111–125.
17 B. Warscheid and T. Hoffmann, Direct analysis of highly oxidisedorganic aerosol constituents by on-line ion trap mass spectrometryin the negative-ion mode, Rapid Commun. Mass Spectrom., 2002,16, 496–504.
18 B. Warscheid, U. Kueckelmann and T. Hoffmann, Direct Quanti-tative Analysis of Organic Compounds in the Gas and ParticlePhase Using a Modified Atmospheric Pressure Chemical Ioniza-tion Source in Combination with Ion Trap Mass Spectrometry,Anal. Chem., 2003, 75, 1410–1417.
19 A. Reinhardt, C. Emmenegger, B. Gerrits, C. Panse, J. Dommen,U. Baltensperger, R. Zenobi and M. Kalberer, Ultrahigh MassResolution and Accurate Mass Measurements as a Tool ToCharacterize Oligomers in Secondary Organic Aerosols, Anal.Chem., 2007, 79, 4074–4082.
20 M. P. Tolocka, M. Jang, J. M. Ginter, F. J. Cox, R. M. Kamensand M. V. Johnston, Formation of Oligomers in SecondaryOrganic Aerosol, Environ. Sci. Technol., 2004, 38, 1428–1434.
21 M. Kalberer, D. Paulsen, M. Sax, M. Steinbacher, J. Dommen, A.S. H. Prevot, R. Fisseha, E. Weingartner, V. Frankevich, R.Zenobi and U. Baltensperger, Identification of polymers as majorcomponents of atmospheric organic aerosols, Science, 2004, 303,1659–1662.
22 A. Guenther, C. N. Hewitt, D. Erickson, R. Fall, C. Geron, T.Graedel, P. Harley, L. Klinger and M. Lerdau et al., A globalmodel of natural volatile organic compound emissions, J. Geophys.Res., [Atmos.], 1995, 100, 8873–8892.
23 F. W. Went, Blue Hazes in the Atmosphere, Nature, 1960, 187,641–643.
24 S. Leungsakul, M. Jaoui and R. M. Kamens, Kinetic Mechanismfor Predicting Secondary Organic Aerosol Formation from theReaction of d-Limonene with Ozone, Environ. Sci. Technol., 2005,39, 9583–9594.
25 D. Grosjean, E. L. Williams, II, E. Grosjean, J. M. Andino and J.H. Seinfeld, Atmospheric oxidation of biogenic hydrocarbons:reaction of ozone with b-pinene, D-limonene and trans-caryophyl-lene, Environ. Sci. Technol., 1993, 27, 2754–2758.
26 A. W. Norgaard, J. K. Nojgaard, K. Larsen, S. Sporring, C. K.Wilkins, P. A. Clausen and P. Wolkoff, Secondary limonene endo-ozonide: a major product from gas-phase ozonolysis of R -(+)-limonene at ambient temperature, Atmos. Environ., 2006, 40,3460–3466.
27 E. J. Feltham, M. J. Almond, G. Marston, V. P. Ly and K. S.Wiltshire, Reactions of alkenes with ozone in the gas phase: amatrix-isolation study of secondary ozonides and carbonyl-con-taining reaction products, Spectrochim. Acta, Part A, 2000, 56,2605–2616.
28 K. Griesbaum, M. Hilss and J. Bosch, Ozonides of mono-, bi- andtricyclic terpenes, Tetrahedron, 1996, 52, 14813–14826.
29 T. Hoffmann, J. R. Odum, F. Bowman, D. Collins, D. Klockow,R. C. Flagan and J. H. Seinfeld, Formation of organic aerosolsfrom the oxidation of biogenic hydrocarbons, J. Atmos. Chem.,1997, 26, 189–222.
30 A. C. Rohr, C. J. Weschler, P. Koutrakis and J. D. Spengler,Generation and quantification of ultrafine particles through ter-pene/ozone reaction in a chamber setting, Aerosol Sci. Technol.,2003, 37, 65–78.
31 B. Bonn, G. Schuster and G. K. Moortgat, Influence of WaterVapor on the Process of New Particle Formation during Mono-terpene Ozonolysis, J. Phys. Chem. A, 2002, 106, 2869–2881.
32 S. M. Jonsson, M. Hallquist and E. Ljungstroem, Impact ofHumidity on the Ozone Initiated Oxidation of Limonene,D3-Carene, and a-Pinene, Environ. Sci. Technol., 2006, 40,188–194.
33 J. Zhang, K. E. Huff Hartz, S. N. Pandis and N. M. Donahue,Secondary Organic Aerosol Formation from Limonene Ozonoly-sis: Homogeneous and Heterogeneous Influences as a Function ofNOx, J. Phys. Chem. A, 2006, 110, 11053–11063.
34 K. S. Docherty, W. Wu, Y. B. Lim and P. J. Ziemann, Contribu-tions of Organic Peroxides to Secondary Aerosol Formed fromReactions of Monoterpenes with O3, Environ. Sci. Technol., 2005,39, 4049–4059.
35 T. M. van Reken, N. L. Ng, R. C. Flagan and J. H. Seinfeld, Cloudcondensation nucleus activation properties of biogenic secondaryorganic aerosol, J. Geophys. Res., [Atmos.], 2005, 110, DOI:10.1029/2004JD005465.
36 Y. Iinuma, O. Boege, Y. Miao, B. Sierau, T. Gnauk and H.Herrmann, Laboratory studies on secondary organic aerosol for-mation from terpenes, Faraday Discuss., 2005, 130, 279–294.
37 S. Gao, M. Keywood, N. L. Ng, J. Surratt, V. Varutbangkul, R.Bahreini, R. C. Flagan and J. H. Seinfeld, Low-Molecular-Weightand Oligomeric Components in Secondary Organic Aerosol fromthe Ozonolysis of Cycloalkenes and a-Pinene, J. Phys. Chem. A,2004, 108, 10147–10164.
38 S. Gao, N. L. Ng, M. Keywood, V. Varutbangkul, R. Bahreini, A.Nenes, J. He, K. Y. Yoo, J. L. Beauchamp, R. P. Hodyss, R. C.Flagan and J. H. Seinfeld, Particle phase acidity and oligomerformation in secondary organic aerosol, Environ. Sci. Technol.,2004, 38, 6582–6589.
39 J. D. Surratt, S. M. Murphy, J. H. Kroll, N. L. Ng, L. Hildebrandt,A. Sorooshian, R. Szmigielski, R. Vermeylen, W. Maenhaut, M.Claeys, R. C. Flagan and J. H. Seinfeld, Chemical Composition ofSecondary Organic Aerosol Formed from the Photooxidation ofIsoprene, J. Phys. Chem. A, 2006, 110, 9665–9690.
40 R. Szmigielski, J. D. Surratt, R. Vermeylen, K. Szmigielska, J. H.Kroll, N. L. Ng, S. M. Murphy, A. Sorooshian, J. H. Seinfeld andM. Claeys, Characterization of 2-methylglyceric acid oligomers insecondary organic aerosol formed from the photooxidation ofisoprene using trimethylsilylation and gas chromatography/iontrap mass spectrometry, J. Mass Spectrom., 2007, 42, 101–116.
41 M. Mochida, Y. Katrib, J. T. Jayne, D. R. Worsnop and S. T.Martin, The relative importance of competing pathways for the
This journal is �c the Owner Societies 2008 Phys. Chem. Chem. Phys., 2008, 10, 1009–1022 | 1021
formation of high-molecular-weight peroxides in the ozonolysis oforganic aerosol particles, Atmos. Chem. Phys., 2007, 6, 4851–4866.
42 D. S. Gross, M. E. Gaelli, M. Kalberer, A. S. H. Prevot, J.Dommen, M. R. Alfarra, J. Duplissy, K. Gaeggeler, A. Gascho,A. Metzger and U. Baltensperger, Real-Time Measurement ofOligomeric Species in Secondary Organic Aerosol with the AerosolTime-of-Flight Mass Spectrometer, Anal. Chem., 2006, 78,2130–2137.
43 D. Poppendieck, H. Hubbard, M. Ward, C. Weschler and R. L.Corsi, Ozone reactions with indoor materials during buildingdisinfection, Atmos. Environ., 2007, 41, 3166–3176.
44 W. W. Nazaroff and C. J. Weschler, Cleaning products and airfresheners: exposure to primary and secondary air pollutants,Atmos. Environ., 2004, 38, 2841–2865.
45 Z. Fan, P. Lioy, C. Weschler, N. Fiedler, H. Kipen and J. Zhang,Ozone-Initiated Reactions with Mixtures of Volatile OrganicCompounds under Simulated Indoor Conditions, Environ. Sci.Technol., 2003, 37, 1811–1821.
46 C. J. Weschler and H. C. Shields, Indoor ozone/terpene reactionsas a source of indoor particles, Atmos. Environ., 1999, 33,2301–2312.
47 X. Liu, M. Mason, K. Krebs and L. Sparks, Full-Scale ChamberInvestigation and Simulation of Air Freshener Emissions in thePresence of Ozone, Environ. Sci. Technol., 2004, 38, 2802–2812.
48 A. Alshawa, A. R. Russell and S. A. Nizkorodov, Kinetic Analysisof Competition between Aerosol Particle Removal and Generationby Ionization Air Purifiers, Environ. Sci. Technol., 2007, 41,2498–2504.
49 J. K. Nojgaard, K. B. Christensen and P. Wolkoff, The effecton human eye blink frequency of exposure to limoneneoxidation products and methacrolein, Toxicol. Lett., 2005, 156,241–251.
50 P. Wolkoff, P. A. Clausen, C. K. Wilkins and G. D. Nielsen,Formation of strong airway irritants in terpene/ozone mixtures,Indoor Air, 2000, 10, 82–91.
51 G. Tamas, C. J. Weschler, J. Toftum and P. O. Fanger, Influenceof ozone-limonene reactions on perceived air quality, Indoor Air,2006, 16, 168–178.
52 N. Britigan, A. Alshawa and S. A. Nizkorodov, Quantification ofOzone Levels in Indoor Environments Generated by Ionic andOzonolysis Air Purifiers, J. Air Waste Manage. Assoc., 2006, 56,601–610.
53 M. L. Walser, J. Park, A. L. Gomez, A. R. Russell and S. A.Nizkorodov, Photochemical Aging of Secondary Organic AerosolParticles Generated from the Oxidation of d-Limonene, J. Phys.Chem. A, 2007, 111, 1907–1913.
54 E. Kendrick, Mass scale based on CH2 = 14.0000 for high-resolution mass spectrometry of organic compounds, Anal. Chem.,1963, 35, 2146–2154.
55 A. G. Marshall and R. P. Rodgers, Petroleomics: The Next GrandChallenge for Chemical Analysis, Acc. Chem. Res., 2004, 37,53–59.
56 C. A. Hughey, R. P. Rodgers and A. G. Marshall, Resolution of 11000 Compositionally Distinct Components in a Single ElectrosprayIonization Fourier Transform Ion Cyclotron Resonance MassSpectrum of Crude Oil, Anal. Chem., 2002, 74, 4145–4149.
57 C. A. Hughey, C. L. Hendrickson, R. P. Rodgers, A. G. Marshalland K. Qian, Kendrick Mass Defect Spectrum: A Compact VisualAnalysis for Ultrahigh-Resolution BroadbandMass Spectra, Anal.Chem., 2001, 73, 4676–4681.
58 S. Kim, R. W. Kramer and P. G. Hatcher, Graphical method foranalysis of ultrahigh-resolution broadband mass spectra of naturalorganic matter, the Van Krevelen diagram, Anal. Chem., 2003, 75,5336–5344.
59 R. W. Kramer, E. B. Kujawinski and P. G. Hatcher, Identificationof Black Carbon Derived Structures in a Volcanic Ash Soil HumicAcid by Fourier Transform Ion Cyclotron Resonance Mass Spec-trometry, Environ. Sci. Technol., 2004, 38, 3387–3395.
60 A. M. Grannas, W. C. Hockaday, P. G. Hatcher, L. G. Thompsonand E. Mosley-Thompson, New revelations on the nature oforganic matter in ice cores, J. Geophys. Res., [Atmos.], 2006,111, DOI: 10.1029/2005JD006251.
61 D. W. van Krevelen, Graphical-statistical method for the study ofstructure and reaction processes of coal, Fuel, 1950, 29, 269–284.
62 N. M. Donahue, J. E. Tischuk, B. J. Marquis and K. E. HuffHartz, Secondary organic aerosol from limona ketone: insightsinto terpene ozonolysis via synthesis of key intermediates, Phys.Chem. Chem. Phys., 2007, 9, 2991–2998.
63 A. A. Presto and N. M. Donahue, Ozonolysis Fragment Quench-ing by Nitrate Formation: The Pressure Dependence of PromptOH Radical Formation, J. Phys. Chem. A, 2004, 108, 9096–9104.
64 A. R. Rickard, D. Johnson, C. D. McGill and G. Marston, OHYields in the Gas-Phase Reactions of Ozone with Alkenes, J. Phys.Chem. A, 1999, 103, 7656–7664.
65 S. E. Paulson, M. Chung, A. D. Sen and G. Orzechowska,Measurement of OH radical formation from the reaction of ozonewith several biogenic alkenes, J. Geophys. Res., [Atmos.], 1998,103, 25533–25539.
66 Transport and Chemical Transformation of Pollutants in the Tropo-sphere, Volume 3: Chemical Processes in Atmospheric Oxidation;Laboratory Studies of Chemistry to Tropospheric Ozone, ed. G. LeBras, Springer, Berlin–Heidelberg–New York, 1997.
67 J. J. Orlando, G. S. Tyndall and T. J. Wallington, The Atmo-spheric Chemistry of Alkoxy Radicals, Chem. Rev., 2003, 103,4657–4689.
68 R. Atkinson and W. P. L. Carter, Kinetics and mechanisms of thegas-phase reactions of ozone with organic compounds underatmospheric conditions, Chem. Rev., 1984, 84, 437–470.
1022 | Phys. Chem. Chem. Phys., 2008, 10, 1009–1022 This journal is �c the Owner Societies 2008