High Resolution Monitoring of Expansion Joints of a Concrete Arch Dam using Fiber Optic Sensors High resolution monitoring of expansion joints of a concrete arch dam using fiber optic sensors* Ferdinand Klug 1 , Werner Lienhart 2 and Helmut Woschitz 3 Abstract In many countries existing hydro-electric power plants are currently modified to operate in pump-storage mode. This type of operation significantly increases the number of load cycles of the dams and induces high frequent deformations with low amplitudes. Current monitoring systems are not sensitive enough to measure these small scale deformations. In this paper we report about the development of an autonomous monitoring system for block joint movements based on fiber optic strain measurements. The monitoring system is based on FBG (fiber Bragg grating) sensors. One key factor of such a system is the optimal sensor configuration to ensure the measurement of the whole displacement range without overlapping signals from different sensors. Another important aspect of the system design is that the FBG sensors have to withstand also movements during extreme events. Such an event occurs every five to ten years when the water reservoir is entirely emptied for inspection purposes. Due to the missing water load the joints experience maximum expansion during this event. The developed system was installed in autumn 2013 in a 122m high concrete arch dam in Austria. Fifteen expansion joints of one maintenance corridor were equipped with FBG sensors. Continuous long term measurements started right after the installation of the measurement systems. We report the results of the first two months of operation. We demonstrate that the impact of small water level changes which typically occur in pump-storage operation can be measured reliably with the developed monitoring system. A water level change of 1m results in length changes of the expansion joints of up to 6μ m. Temperature induced movements can also be measured due to the high precision of 0.4μ m of the monitoring system. Daily temperature variations result in cyclic expansion joint movements with amplitudes up to 4.5μ m. The developed monitoring system is the basis for modern structural monitoring of concrete dams with pump-storage operation. The high measurement resolution gives new insights into the structural behavior of dams and can potentially improve the design of new dams. Keywords: Structural Monitoring, Concrete Dam, Pump-storage plant, Fiber Optic Sensor, FBG, SHM I. I NTRODUCTION Water power plants are an important source of sustainable energy. In Austria more than 50% of the power production is based on water power plants. Within the last 70 years more than twenty large concrete dams were built in alpine area. Most of these dams are gravity or arch dams and are traditionally operated as storage power stations. Due to legal regulations these structures have to be monitored in regular intervals. Conventional structural monitoring systems of dams consist of geotechnical and geodetic measurements and are optimized to detect movements due to seasonal temperature changes and due to slow water level changes of the reservoir. Many of the monitoring programs are based on epoch wise measurements which take place only a few times per year. These measurement concepts are adequate for the operation type for which the hydro-electric dams were originally built for. However, within the last years many of these hydro-electric power plants were modified to pump-storage plants where the same water is used several times. Water from the reservoir is used during peak times for power production and at times with low energy prices the water is pumped up from a collecting basin back to the reservoir at higher altitude. This type of operation significantly increases the number of load cycles of the dam and does require new monitoring techniques. We therefore developed a new monitoring system for the continuous and high resolution monitoring of expansion joints of concrete arch dams. The system was installed in the water dam Kops in 2013. II. THE WATER DAM KOPS The Kops dam is located in the western part of Austria, at a sea level height of 1800m. It has an active storage volume of 42.9 mio. m3. The special feature of this dam is its construction design. It consists of two distinct parts which are an arch dam and a gravity dam. Both dam parts are connected by an artificial bearing, see Fig. 1. The arch dam has a crest length of 400m and a height of 122m. The crest length of the gravity dam is 214m and its height is 43m [1]. The arch dam was built in 27 vertical blocks and finished in 1965. Until 2008 the dam was used in standard storage mode. In 2008 the power plant was modified to pump-storage operation. *Research supported by Vorarlberger Illwerke AG 1−3 All authors are with the Institute of Engineering Geodesy and Measurement Systems, Graz University of Technology, Graz, Austria [email protected]3164 Proc. 6th World Conference on Structural Control and Monitoring (6WCSCM), 2014, Barcelona, Spain: 3164-3176
Transcript
High Resolution Monitoring of Expansion Joints of a Concrete Arch Dam using Fiber Optic Sensors
High resolution monitoring of expansion joints of a concrete arch damusing fiber optic sensors*
Ferdinand Klug1, Werner Lienhart2 and Helmut Woschitz3
Abstract
In many countries existing hydro-electric power plants are currently modified to operate in pump-storage mode. This typeof operation significantly increases the number of load cycles of the dams and induces high frequent deformations with lowamplitudes. Current monitoring systems are not sensitive enough to measure these small scale deformations.
In this paper we report about the development of an autonomous monitoring system for block joint movements based onfiber optic strain measurements. The monitoring system is based on FBG (fiber Bragg grating) sensors. One key factor of sucha system is the optimal sensor configuration to ensure the measurement of the whole displacement range without overlappingsignals from different sensors. Another important aspect of the system design is that the FBG sensors have to withstand alsomovements during extreme events. Such an event occurs every five to ten years when the water reservoir is entirely emptiedfor inspection purposes. Due to the missing water load the joints experience maximum expansion during this event.
The developed system was installed in autumn 2013 in a 122m high concrete arch dam in Austria. Fifteen expansion jointsof one maintenance corridor were equipped with FBG sensors. Continuous long term measurements started right after theinstallation of the measurement systems. We report the results of the first two months of operation. We demonstrate thatthe impact of small water level changes which typically occur in pump-storage operation can be measured reliably with thedeveloped monitoring system. A water level change of 1m results in length changes of the expansion joints of up to 6μm.Temperature induced movements can also be measured due to the high precision of 0.4μm of the monitoring system. Dailytemperature variations result in cyclic expansion joint movements with amplitudes up to 4.5μm.
The developed monitoring system is the basis for modern structural monitoring of concrete dams with pump-storage operation.The high measurement resolution gives new insights into the structural behavior of dams and can potentially improve the designof new dams.
Water power plants are an important source of sustainable energy. In Austria more than 50% of the power production is
based on water power plants. Within the last 70 years more than twenty large concrete dams were built in alpine area. Most
of these dams are gravity or arch dams and are traditionally operated as storage power stations. Due to legal regulations
these structures have to be monitored in regular intervals. Conventional structural monitoring systems of dams consist of
geotechnical and geodetic measurements and are optimized to detect movements due to seasonal temperature changes and
due to slow water level changes of the reservoir. Many of the monitoring programs are based on epoch wise measurements
which take place only a few times per year. These measurement concepts are adequate for the operation type for which the
hydro-electric dams were originally built for.
However, within the last years many of these hydro-electric power plants were modified to pump-storage plants where
the same water is used several times. Water from the reservoir is used during peak times for power production and at times
with low energy prices the water is pumped up from a collecting basin back to the reservoir at higher altitude. This type
of operation significantly increases the number of load cycles of the dam and does require new monitoring techniques.
We therefore developed a new monitoring system for the continuous and high resolution monitoring of expansion joints of
concrete arch dams. The system was installed in the water dam Kops in 2013.
II. THE WATER DAM KOPS
The Kops dam is located in the western part of Austria, at a sea level height of 1800m. It has an active storage volume
of 42.9 mio. m3. The special feature of this dam is its construction design. It consists of two distinct parts which are an
arch dam and a gravity dam. Both dam parts are connected by an artificial bearing, see Fig. 1. The arch dam has a crest
length of 400m and a height of 122m. The crest length of the gravity dam is 214m and its height is 43m [1]. The arch dam
was built in 27 vertical blocks and finished in 1965. Until 2008 the dam was used in standard storage mode. In 2008 the
power plant was modified to pump-storage operation.
*Research supported by Vorarlberger Illwerke AG1−3All authors are with the Institute of Engineering Geodesy and Measurement Systems, Graz University of Technology, Graz, Austria
Proc. 6th World Conference on Structural Control and Monitoring (6WCSCM), 2014, Barcelona, Spain: 3164-3176
Fig. 1. Overview of the hydroelectric power dam Kops (left) [1] and the vertically aligned concrete blocks of the arch dam, each about 30m wide (right)
The health of the dam is evaluated based on geotechnical measurements and periodic geodetic measurements. The geodetic
measurement program consists of precise leveling in maintenance corridors and at the crest as well as geodetic traverse and
network measurements of points within the corridors and on the dam surface. Furthermore, displacement dial gauges are
used to measure relative movements of the concrete blocks of the dam, Fig. 2. These manual measurements are carried out
quarterly.
Fig. 2. Expansion joint between two vertical concrete blocks with measurement anchors (left), manual displacement measurement with a dial gauge (right)
The current measurement concept was designed for conventional reservoir operation. In this operation mode, the seasonal
variation of the expansion joint movement is up to 2mm. After the change to pump-storage operation in 2008, the number
of load cycles increased significantly. However, these high frequent changes induce deformations with smaller amplitudes.
Due to the low measurement rate (1 measurement per every 4 month) and the limited measurement precision of the manual
dial gauges (approximately 0.02mm to 0.05mm depending on operator) deformations of the concrete joints induced by pump
storage operation could not be detected until now.
One way to upgrade the monitoring system to an automated system would be the use of electric dial gauge sensors.
However, using electric dial gauges for the monitoring of the 60 concrete joints would result in a high installation effort.
Because these sensors require a power supply and cabling to each sensor. Furthermore, large temperature changes and high
humidity might cause problems.
Fiber optic sensors are better suited to fulfill the requirements in this application due to their high measurement resolution and
the possibility to place several sensors on a single fiber. Fiber optic sensors are already used for monitoring applications in
hydroelectric dams, such as distributed temperature sensing for leakage detection measurements [2]. However, they have not
been applied yet for the monitoring of concrete joint deformations. The Institute of Engineering Geodesy and Measurement
Systems (EGMS) of Graz University of Technology developed a fiber optic measurement system based on fiber Bragg
gratings (FBG) for the monitoring of the concrete joint movements of the water dam Kops.
3165
III. FIBER BRAGG GRATING SENSORS
FBG sensors are created through a periodic change of the refractive index in the core of a glass fiber. Part of the light
transmitted in a fiber gets reflected at the position of the grating. The center wavelength of the reflected signal λB can be
determined from the Bragg condition [3].
λB = 2∗ne f f ∗Λ (1)
Where ne f f is the effective refractive index and Λ is the period of the refractive index changes. The Bragg wavelength is
affected by strain and temperature changes. The relation between strain and temperature induced wavelength shift can be
approximated with the linear functionΔλ(ε,T )
λB= kε ∗ ε + kT ∗ΔT (2)
with
k ... gage factor
ε ... applied strain
αT ... change of refractive index
ΔT ... temperature change
Alternatively the FBG strain k and temperature kT sensitivity can be expressed in pm/με and pm/K. Typical values are
kε = 1.2pm/με for a strain sensor and kT = 10pm/K for a temperature sensor, e.g. [3]. Therefore, a temperature change of
1K and a strain change of 8μm/m (8με) yield the same measurement signal. In order to separate temperature from strain,
a FBG temperature sensor placed in the vicinity of the FBG strain sensor, can be used.
The appropriate selection of the center wavelength of the FBG sensors as well as the selection of a suitable FBG interrogator
are crucial elements in the development of a monitoring system with many sensors and large strains. To separate the signals
of two sensors, the FBG wavelengths must not overlap. This can significantly reduce the maximum possible number of
sensors on one single fiber, depending on the wavelength range of the interrogator and the deformations of the object.
Another limiting factor is the dynamic range of the interrogator, which is especially important if the core diameter of the
glass fiber in a strain chain changes.
IV. FIBER OPTIC MEASUREMENT CONCEPT FOR THE KOPS DAM
The Kops arch dam has more than 60 dial gauge measurement points. Since the performance and lifetime of fiber optic
sensors in this application were unknown it was decided to upgrade, in a first step, only 15 of the manual dial gauge
measurement points with fiber optic sensors. All sensors are located in the highest maintenance corridor as can be seen in
Fig. 3.
Fig. 3. Selected sensor positions in the arch dam, distributed on three fiber optic chains
Today, many FBG strain gauges with different designs are commercially available. For this project, the SYLEX SC-01
sensor was selected and its performance was intensively tested in laboratory investigations. Fig. 4 shows the SYLEX SC-01
sensor. The temperature sensing FBG is encapsulated in one of the anchors of the sensor where it does not experience strain.
The strain sensitive FBG is stretched between the anchors and protected by a plastic tube. This sensor design allows a wide
3166
adjustment range for pretensioning and assures sufficient mechanical protection. Furthermore, the sensor is watertight for
continuous submerge in a depth of 1m (IP68 [4])
Fig. 4. SYLEX SC-01 sensor [6]
The SYLEX SC-01 sensors where chosen with draw tower gratins (DTGs) as sensitive elements. Due to the production
process very high strains of up to 50000μm/m can be measured using these gratings, [5]. This high strain measurement is
not possible with standard gratings. However, information about the long term stability at high strains are not available and
SYLEX conservatively specifies the long term strain range with ±5000μm/m (1%) [6].
In order to further reduce outage probability, a sensor length of 0.5m was chosen. Taking maximum expansion joint
movements of about 3mm, known from dial gauge measurements, and a free fiber length of the sensor of 0.4m into account,
the gratings must withstand a maximum strain of about 7500μm/m (0.75%) which was expected to be appropriate for long
term operation (¿10 year). However, using several DTG sensors on a long chain, signal loss computation must be carefully
operated due to the smaller core of the DTG fiber.
As measurement unit, a SM130 from Micron Optics was selected [7]. This interrogator has a wavelength resolution of
1pm and a maximum sampling rate of 1kHz. Furthermore, the instrument is equipped with four independent measurement
channels. With a sensor free fiber length of 0.4m and the high wavelength resolution of 1pm, the minimum strain resolution
is 0.3μm.
By using four measurement channels, all 30 FBGs (15 strain and 15 temperature sensors) can be measured simultaneously.
A sixteenth sensor was installed as reference sensor in stable rock. This reference sensor is used to assess the long term
stability of the measurement system and to detect any potential drift. Fig. 5 shows a schematic installation plan for the first
measurement chain with 10 FBG sensors (5 strain sensors and 5 temperature sensors) and the reference sensor on a separate
channel.
Fig. 5. Sensorchain A with five strain sensors (S) and five temperature sensors (T)
With respect to the wavelength and dynamic range of the interrogator, and the expected strain at the different expansion
3167
joints, the sensors were arranged in three measurement chains (A, B, C), each connected to a separate channel of the
interrogator.
V. LABORATORY INVESTIGATIONS OF THE SENSORS
The strain and temperature coefficients of the chosen sensors are given by the manufacturer. In order to verify these
values, but especially for choosing the appropriate sensor type [8], we calibrated several sensors on our unique fiber optic
calibration facility [9]. In this paper we discuss the calibration results of three mounted sensors as well as for the laboratory
sensor. One of each chain. As will be shown, the sensors show similar effects.
A. Temperature calibrationEvery fiber optic sensor is temperature dependent. This relation is usually expressed by a linear temperature coefficient.
Depending on the application and on the temperature range it may also be necessary to use a non-linear calibration function
to guarantee high precision over a large temperature range [10]. In this project, the expected range of the yearly temperature
cycle in the arch dam is 25K. Based on this information, a standard linear calibration function is sufficient. In order to
determine the temperature coefficient, each sensor was placed into a climate chamber and exposed to specific temperature
cycles. Using these data the temperature coefficients were determined by least squares adjustment.
The temperature coefficient of the strain FBG and the temperature FBG should be the same and was expect to be about
10pm/K [3]. However, the results of the calibration show that the coefficients of the strain and temperature FBG are
significantly different, see Table I, which might be caused by the manufacturing of the sensor with a different kind of
production for the temperature and strain FBG sensor.
TABLE I
TEMPERATURE COEFFICIENTS FOR STRAIN AND TEMPERATURE SENSORS DETERMINED BY CALIBRATION (SENSORS WITHIN A WAVELENGTH RANGE
OF 1520 < λbB < 1570nm)
sensortemperature coefficients
[pm/K]strain FBG temperature FBG
A 3 12,85 8,26B 4 13,05 8,26C 2 12,79 7,96
Therefore, the wavelength change of an induced temperature cannot directly be removed from the measured wavelength
of the strain sensor. Data evaluation of the chosen sensors also shows another interesting effect. Fig. 6 displays the results of
one temperature experiment of sensor B4. First the temperature in the temperature chamber was reduced by −30◦C. After an
acclimatization time of about 2h the temperature was slowly increased to the initial temperature. The reference temperature
was measured with a fast reacting and calibrated PT100 temperature sensor. As can be seen, the temperature sensor of the
SYLEX SC-01 has a lower reaction time (∼ 20min) than the strain sensor. Due to the slow temperature change inside the
arch dam this delay is not critical in this application. However, in applications with fast temperature changes the different
response time of both sensors has to be taken into account.
Fig. 6. Temperature comparison: PT-100 (top) vs. SYLEX SC-01 (bottom)
3168
B. Strain calibration
Each SYLEX SC-01 sensor is delivered with a calibration protocol to convert measured wavelength changes to strain
values. The precision of the calculated strain using the provided calibration function is stated as 1.7μm/m. Since, a correct
calibration function is critical for the dam monitoring application EGMS independently calibrated all sensors in the EGMS
temperature controlled measurement laboratory with its fully automated fiber optic calibration facility [9]. In this facility
fiber optic sensors can be controlled elongated and shortened by an automatic translation stage. The reference length change
is measured with a laser interferometer [8]. With this test facility, it is possible to calibrate sensors with a maximum length
of 30m and a maximum sensor elongation of 30cm, Fig. 7.
Fig. 7. Calibration facility for fiber optic strain sensors at the EGMS measurement laboratory
All SYLEX SC-01 sensors used in the dam monitoring project were calibrated independently. Fig. 8 shows the result of a
typical calibration run. The sensor was elongated four times from 0 to 3.6mm in a 0.2mm interval. The initial position (0mm)
was determined experimentally and set to the position where λB did not change any more when shortening the sensor. In
Fig. 8 the interferometric reference distances are denoted as L and the measurement error of the fiber optic system as ΔL.
ΔL is calculated as L minus FBG value converted with calibration function from manufacturer, as given on the calibration
sheet which was delivered with the sensor.
Fig. 8. Calibration results of a Sylex SC-01 (laboratory) sensor
The sensor shows a large error of 0.4mm at very low strain values. This highly non-linear effect might be caused by
an almost loose fiber inside the protection tube. The sensor was ordered with a low pre-strain of about 200μm/m. Since
the protective tube of the sensor is very flexible it curves if the sensor is unstrained which obviously is the reason for this
effect. Later, when installing the sensors in the hydro-electric dam, the sensors were sufficiently pre-strained to allow the
unaffected measurement of negative strain too. For elongations of 1mm and more, the data shows an almost linear deviation
3169
of about 0.2% and a small hysteresis of about 3.6μm (sensor length 0.5m).
The calibration results of all investigated sensors shows the same effects, with respect to hysteresis and linearity. However,
some sensors have a more significant non-linear behavior. Therefore, a quadratic calibration function was chosen and its
coefficients were determined. Fig. 9 gives a comparison between the linear and quadratic estimation for the laboratory sensor.
Fig. 9. Comparison of linear, quadratic and manufacturer calibration for Sylex SC-01 laboratory sensor
It can be seen that the calibration function from the manufacturer delivers deviations up to 4.8μm. Using a standard linear
calibration function the range of the deviations are up to 6.0μm. When using the EGMS quadratic calibration function the
full potential of the FBG sensors can be accessed. The only remaining deviations are caused by the hysteresis which is
about 3.1μm. A summary of the results is given in Table II.
TABLE II
NUMERICAL VALUES FOR LINEAR, QUADRATIC AND MANUFACTURER CALIBRATION FOR SYLEX SC-01 SENSOR (LABORATORY) WITHIN THE
EXPECTED CALIBRATION RANGE (1.2MM TO 3.6MM)
SensorHysteresis Non-Linearity Max. Divergence
[μm] [%] [μm]
Linear 3,1 0,1 6,0Quadratic 3,1 0,1 3,7
Manufacturer 3,6 0,2 4,8
The main results of the EGMS calibration facility are strain coefficients to convert measured wavelength shifts into strain
changes. These coefficients were calculated for linear (3) and quadratic calibration functions (4) by least squares estimation.
Δλ = k0 + k1 ∗Δμε (3)
Δλ = k0 + k1 ∗Δμε + k2 ∗Δμε2 (4)
The calculated coefficients are summarized for three sensors (A3, B4 and C2) in Table III.
TABLE III
COEFFICIENTS FOR LINEAR AND QUADRATIC CALIBRATION FUNCTIONS
By re-arranging eq. (4) the strain change can be derived from measured wavelength changes Δλ using following equation
Δμε =−(
k1 +√
k21 +4∗ k2 ∗Δλ
)
2∗ k2(5)
3170
VI. INSTALLATION IN THE HYDRO-ELECTRIC DAM
The installation of the fiber optic monitoring system was carried out in September 2013. In the upper maintenance corridor
15 block joints were instrumented with fiber optic strain and temperature sensors. The fiber optic sensors were installed
above the dial gauge anchors as can be seen in Fig. 10. Special designed anchors were used to connect the sensor with the
concrete of the dam. After the concrete anchors were stable, the FBG sensors were mounted and pre-strained. The pre-strain
value was based on the laboratory experiments and the current opening of the expansion joint.
Fig. 10. Expansion joint between concrete block 24/25 (C3) with fibre optic sensor and dial gauge anchors
The interrogation unit was positioned in the control center, about 500m away (outside the dam). For a direct comparison
between the conventional measurement system and the fiber optic system, the instrumented joints were simultaneous measured
with the dial gauge and the fiber optic system. For validation of the stability and further comparisons, the manual dial gauge
measurements will also be continued in the future. A continuous 1.5 months fiber optic measurement campaign was started
right after installation of the sensors.
VII. MEASUREMENTS
The first continuous measurements were performed from September 2013 to November 2013. Within 48 days of permanent
measurements, different sampling rates and the remote control were tested. With the recorded data it was also possible to
validate the temperature compensation of the measured strain values. At the start and at the end of the continuous measurement
period two dial gauge measurements were carried out. Furthermore, the independent geodetic measurements of the reference
sensor were carried out at the same time. For comparison with dial gauge measurements, length changes, instead of strain
values, are plotted.
A. Reference sensor
The precision of the monitoring system can be assessed by analyzing the measurement data of the reference sensor which
is installed in stable bedrock. Fig. 11 shows 30 minutes of measurements of the temperature and strain FBG taken with a
sampling rate of 1Hz. In Fig. 11 the signal, denoted as Δλ , is the wavelength change of the temperature and strain FBG.
The calculated standard deviation is 1.4pm for both FBGs. This corresponds to a standard deviation of the temperature of
0.2K and a standard deviation of the length change of 0.4μm. This high precision is sufficient to detect the small length
changes of the concrete joints due to the pump-storage operation.
Fig. 11. 30 Minutes raw FBG temperature (left) and strain (right) signals (reference sensor)
Fig. 12 shows the strain and temperature values of the reference sensor for a measurement window of two days in September
2013. The shown data were down sampled to 15 minutes values by averaging. Within these two days, temperature changes
3171
of 0.3K were captured, Fig. 12 (left). As in Fig. 12 (right) is shown, even these small temperature changes affected the strain
measurements. Without any temperature compensation, the expansion joint measurement value is increased by, approximately
1μm. Therefore, a separate temperature measurement and an adequate compensation of the temperature induced, apparent
strain change is an essential part for a high precision result.
Fig. 12. Measured temperature (temperature sensor, left), impact of temperature on measured length changes and temperature correction (strain sensor,right)
B. CONCRETE JOINTS
In this section, the measured concrete joint deformations are correlated with the impact factors water storage level and
air temperature. Fig. 13 shows the water storage level changes and the ambient air temperatures within the measurement
period. Within this period (September to November) the water storage level was increasing slightly and was always close to
the maximum capacity level of 1809m above sea level [1]. In the same period the ambient air temperature showed variations
of approximately 17K. Based on the weather conditions, a daily temperature variation of 5K occurred.
Fig. 13. Water storage level (left) and ambient air temperatures (right) during monitoring measurements
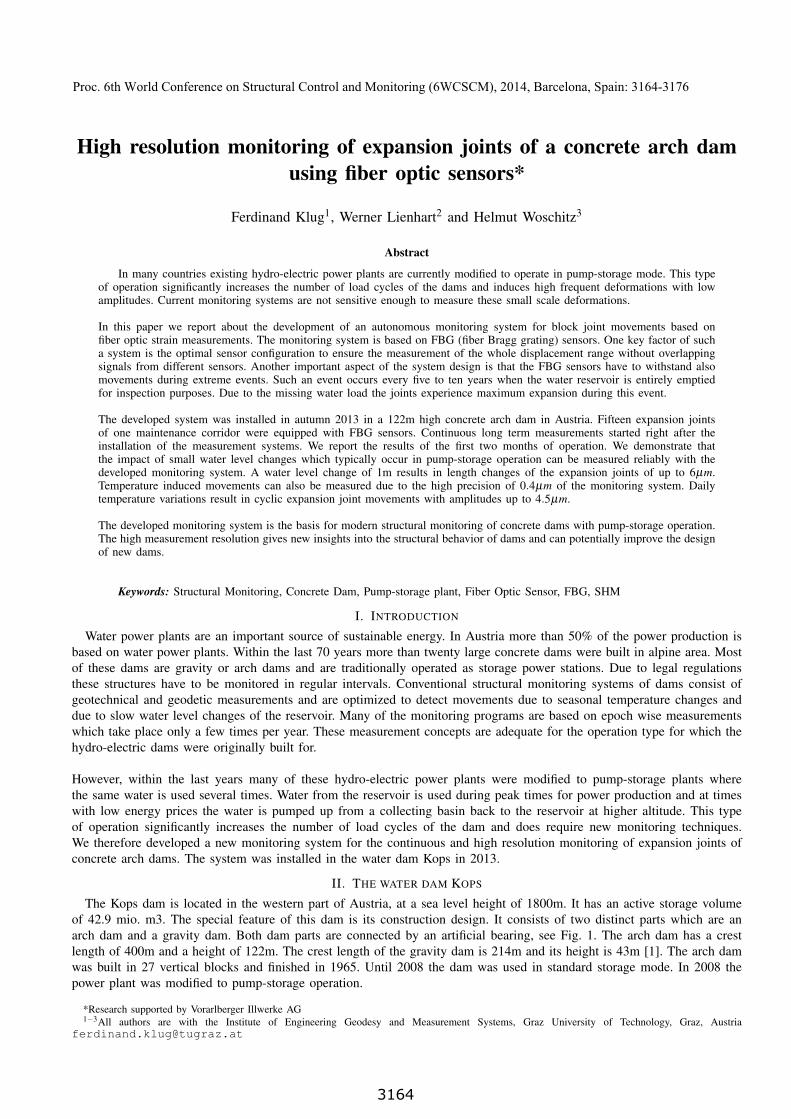
Fig. 14 shows the concrete joint movements of the second measurement chain B and the data of the reference sensor
R. The data gaps are the results of remote control problems in this badly covered cell phone section. Manual dial gauge
measurements were performed at the installing (2 days before measurement starts) and the end of the fiber optic measurement
period. These measurements are centered to the fiber optic results at the end of the time series. Taking into account the
low precision of the manual readings, indicated by the bias in Fig. 14, the results of the fiber optic measurements and the
manual measurements are consistent.
3172
Fig. 14. Concrete joint measurements with sensor chain B (sampling intervall: 15min)
Evaluation of the data of Fig. 13 (left) and Fig. 14 shows a negative correlation between the water storage level and the
expansion joint movement. With increasing water level the distance between the concrete blocks is decreasing. This effect
is especially distinct from day 40 to 42 where the water storage level had a local minimum. An increasing water level
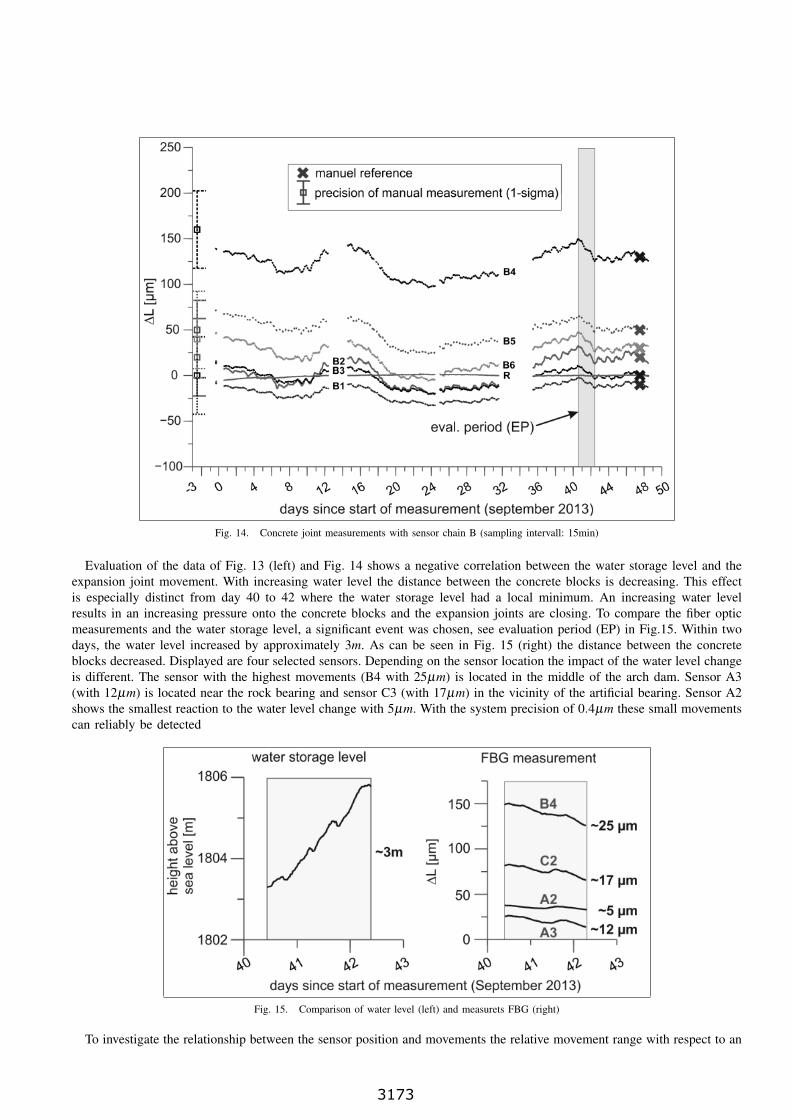
results in an increasing pressure onto the concrete blocks and the expansion joints are closing. To compare the fiber optic
measurements and the water storage level, a significant event was chosen, see evaluation period (EP) in Fig.15. Within two
days, the water level increased by approximately 3m. As can be seen in Fig. 15 (right) the distance between the concrete
blocks decreased. Displayed are four selected sensors. Depending on the sensor location the impact of the water level change
is different. The sensor with the highest movements (B4 with 25μm) is located in the middle of the arch dam. Sensor A3
(with 12μm) is located near the rock bearing and sensor C3 (with 17μm) in the vicinity of the artificial bearing. Sensor A2
shows the smallest reaction to the water level change with 5μm. With the system precision of 0.4μm these small movements
can reliably be detected
Fig. 15. Comparison of water level (left) and measurets FBG (right)
To investigate the relationship between the sensor position and movements the relative movement range with respect to an
3173
initial value and within the measurement period, is plotted in Fig. 16 (right). The range of the measured movement differs
between 8μm (sensor A2) and 53μm (sensor C2). Interestingly, the sensors A2 and A4 experience small movements. This
was already observed in the long term manual measurements carried out since 1994. The reasons for the special behavior
at these locations is currently investigated in detail.
Fig. 16. Water storage level (left) and expansion joint range (right) over the measurement period
In general the measured block joint movements are a superposition of different effects. One of the main influences
is, as described before, the water storage level. Another effect is thermal deformation induced by changing ambient air
temperatures. The impact of temperature changes is reflected in daily variations with amplitudes of block joint movements
of approximately 4μm to 6μm, see Fig 17. A detailed investigation of the temperature influenced movements and their time
delay with respect to the ambient air temperature are part of future studies, which will be performed when data over a longer
period are available.
Fig. 17. Daily variation of expansion joint movements
To interpret the induced effects of ambient air temperature and water storage level, the spectra of the original 1Hz data
were calculated. Fig. 18 shows a part of this spectrum. The frequencies were converted to periods of days (from 0.5 day to
8 days). As expected a 24h cycles caused by daily temperature variations is apparent in all sensors, see Fig. 18 (upper right
and bottom). The spectrum of the water storage level does not show a peak at the 24h cycle, Fig. 18 (upper left). Another
major cycle has a duration time between 5 and 6 days and is apparent in the water storage level and also in the measured
joint movements.
3174
Fig. 18. Spectral investigation of fibre optic data
Such investigations now at the very early beginning- are only possible using the data of the new system with its high
data rate compared to the traditional measurement system.
VIII. CONCLUSIONS
In this paper a new method for continuous concrete joint monitoring was introduced. The biggest advantages with respect
to conventional electric sensor systems are the lower installation costs and the better measurement precision. However,
to achieve accuracies in the range of a few mum, a comprehensive calibration and appropriate temperature correction are
required.
The developed monitoring system was successfully installed in a concrete arch dam. Data acquired in the first two months
of operation proof that small water level changes caused by the pump-storage operation can be depicted reliably. A water
level change of 1m results in length changes of the expansion joints of up to 1.7μm at the rock bearing and up to 8μmin the middle of the arch dam. Temperature induced movements can also be measured due to the high precision of 0.4μmof the monitoring system. Daily temperature variations result in cyclic expansion joints movements with amplitudes up to
6μm.
The developed monitoring system can be the basis for modern structural monitoring of concrete dams with pump-storage
operation. The high measurement resolution gives new insight into the structural behavior of dams and can potentially
improve the design of new dams.
ACKNOWLEDGMENT
We want to thank Vorarlberger Illwerke AG, especially Dipl.-Ing. Peter Staubmann, Dipl.-Ing. Rupert Zischinsky and
Dr.-Ing. Ralf Laufer for the possibility to realize this project and for their support during the installation of the sensors.
[2] D. Inaudi, ”Overview of fiber optic sensing technologies for structural health monitoring”, in Proc. 46th International Conference on Microelectronics,Devices and Materials, Radenci, Slovenia, 2010, p. 10.
[3] Othonos and K. Kalli, Fiber Bragg Gratings, Fundamentals and Applications in Telecommunications and Sensing”, Boston, 1999, USA: Artech HousePublishers
[4] IEC 60529:1989+A1:1990: Schutzarten durch Gehause (IP-Code); Deutsche Fassung EN 60529:1991+A1:2000”, Deutsches Institut fr Normung Std.[5] M. Rothhard, C. Chojetzki and H.R.Mueller, ”High mechanical strength single-pulse draw tower gratins” in. Proc. SPIE, Vol 5579, 2004, pp. 127-135
[8] H. Woschitz, W. Lienhart and F. Klug , ”Fibre optic monitoring system for the determination of segment joint movements inside a hydro powerdam”, in OFS 23, 2014
[9] R. Presl (2009), ”Entwicklung eines automatisierten Messsystems zur Charakterisierung faseroptischer Dehnungssensoren” Master thesis, FHObersterreich, Obersterreich, 2009.
[10] Z. Jing and L. Yongqian, ”Calibration method for fiberbragg grating temperature sensor” in Proc. 9th. ICEMI, 2009, pp. 2822.