+ All Categories
Home > Documents > High Resolution Numerical Models of Tidal Marshes in … · Delaware Estuary Delaware Estuary...

High Resolution Numerical Models of Tidal Marshes in … · Delaware Estuary Delaware Estuary...

Date post: 25-Aug-2018
Category:
Upload: buidang
View: 215 times
Download: 0 times
Share this document with a friend
36
Ramona Stammermann Dept. of Civil, Architectural & Environmental Engineering, Drexel University, Philadelphia, PA Michael Piasecki Dept. of Civil Engineering, City College New York, New York City, NY High Resolution Numerical Models of Tidal Marshes in the Delaware Bay Delaware Estuary Science & Environmental Summit 2013, Cape May , NJ
Transcript

Ramona Stammermann Dept. of Civil, Architectural & Environmental Engineering, Drexel University,

Philadelphia, PA

Michael Piasecki Dept. of Civil Engineering, City College New York, New York City, NY

High Resolution Numerical Models of Tidal Marshes in the Delaware Bay

Delaware Estuary Science & Environmental Summit 2013, Cape May , NJ

Content

• Delaware Bay marshes

• Objectives

• Challenges

• Methods

• Model applications – Bombay Hook

– Blackbird Creek

• Summary

Delaware Estuary Science & Environmental Summit 2013, Cape May , NJ

Delaware Estuary

Delaware Estuary Science & Environmental Summit 2013, Cape May , NJ

Delaware Estuary Science & Environmental Summit 2013, Cape May , NJ

Importance of Delaware Bay Wetlands • Wetlands influence health and function of adjacent

water bodies and provide habitat for flora and fauna

– „Kidneys“ of the Delaware Bay → filters harmful materials

– Home of a variety of animals including mussels, crabs, fish, birds

– One of the biggest and most important resting places for migratory birds on the US East Coast

– Provide a coastal defense line against stormsurges

– Provide recreational space for everybody

Delaware Estuary Science & Environmental Summit 2013, Cape May , NJ

Delaware Bay Wetlands • some wetlands are deteriorating

– erosion

– Sudden wetland dieback

• Reasons mostly not entirely understood

– Starvation >> not enough sediment input from the bay?

– Change in composition of ecosystem

• Diffferent types of vegetation

• Decrease of bottom stabilizing mussel colonies

>> numerical models to learn more about processes in marsh systems

Delaware Estuary Science & Environmental Summit 2013, Cape May , NJ

Research Objectives

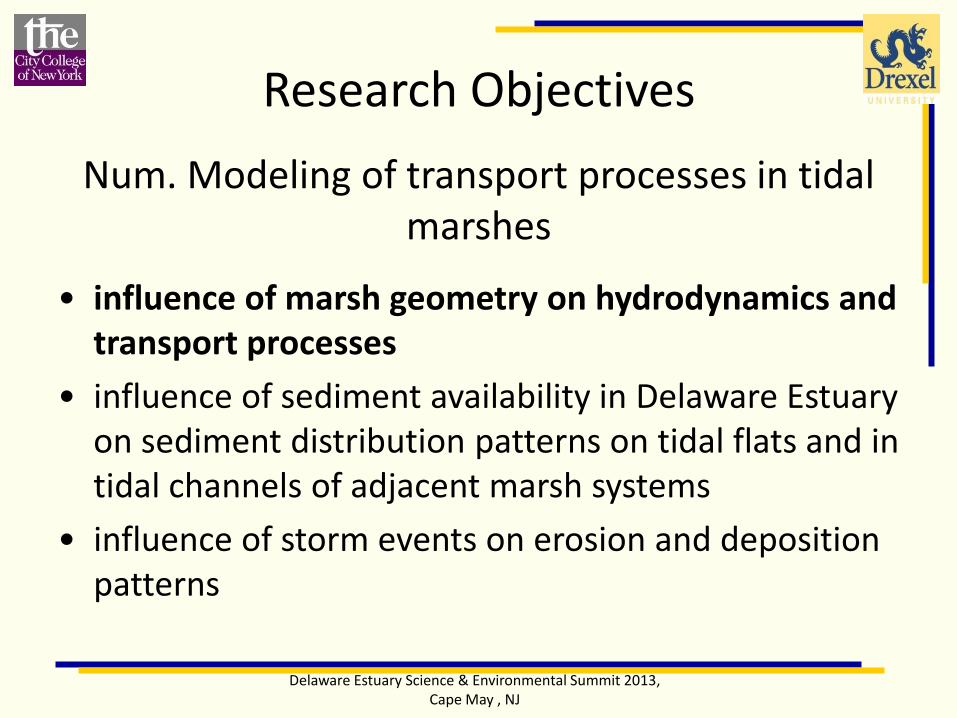
Num. Modeling of transport processes in tidal marshes

• influence of marsh geometry on hydrodynamics and transport processes

• influence of sediment availability in Delaware Estuary on sediment distribution patterns on tidal flats and in tidal channels of adjacent marsh systems

• influence of storm events on erosion and deposition patterns

Delaware Estuary Science & Environmental Summit 2013,

Cape May , NJ

Model system Marina

Delaware Estuary Science & Environmental Summit 2013, Cape May , NJ

Model Area – Delaware Estuary Create Boundary Conditions for Marsh Model

Location of

Blackbird Creek

Marsh

15726 nodes

28831 elements

min L = ~ 50 m

max L = ~5500 m

Delaware Estuary Science & Environmental Summit 2013, Cape May , NJ

Challenges for high resolution marsh modeling

• Marshes are large and very inaccessible makes field measurements difficult, costly and time consuming

not much data for initial and boundary conditions available

need to develop methods to compensate for lack of data

• Methods no high resolution bathymetry

>> cross sectional measurements to determine general shape and depths of tidal channels

>> use model to iterativeley swing in and smooth bathymetry

LiDAR data with high vertical error above dense vegetation >> RTK points as reference data to determine an adjustment factor for topography

No high resolution sediment inventory >> use model itself to iteratively determine grain size distribution

Delaware Estuary Science & Environmental Summit 2013, Cape May , NJ

Extraction of tidal channels DTM Flooded contours: -0.5m < z < 0.5m

export outline as polygons

extract significant channels

channels that can be resolved with ≥ 3 elements with ≥ 3m side length

Delaware Estuary Science & Environmental Summit 2013, Cape May , NJ

Grid Generation Triangulation

Polygons Basic Triangulation

After Advancing Front Refinement Detail

Delaware Estuary Science & Environmental Summit 2013, Cape May , NJ

Bombay Hook – Model grid

695,390 elements

max L = 1000 m

min L = 3.0 m

Bathymetry Model Grid

Delaware Estuary Science & Environmental Summit 2013, Cape May , NJ

Reference Stations

Water Levels

Delaware Estuary Science & Environmental Summit 2013, Cape May , NJ

Mud flats 2005

Delaware Estuary Science & Environmental Summit 2013, Cape May , NJ

Mud flats 2010

Delaware Estuary Science & Environmental Summit 2013, Cape May , NJ

Hydrodynamics change of channel geometry – with channel

Delaware Estuary Science & Environmental Summit 2013, Cape May , NJ

Hydrodynamics change of channel geometry – no channel

Delaware Estuary Science & Environmental Summit 2013, Cape May , NJ

Tracer experiment Start in marsh

Delaware Estuary Science & Environmental Summit 2013, Cape May , NJ

Tracer experiment Start in bay

Delaware Estuary Science & Environmental Summit 2013, Cape May , NJ

Tracer Experiment Block overview

Tracer start

Tracer Experiment Block original geometry

Tracer Experiment Block Block 1

Tracer Experiment Block Block 2

Tracer Experiment Block Block 1 & 2

Blackbird Creek Model Grid

Bathymetry Model Grid

260,547 Elements

Max L = 285 m

Min L = 3.5 m

Delaware Estuary Science & Environmental Summit 2013, Cape May , NJ

Initial sediment distribution Blackbird Creek

• Procedure

Simulate hydrodynamics only

Extract shear stress

Determine D50 with inverse Shields

equation

• Results

Coarser sediment in channels

Extreme coarse in areas where

assumptions of initial bathymetry are

wrong

Further adjustment of initial

bathymetry

Delaware Estuary Science & Environmental Summit 2013, Cape May , NJ

Sediment composition

• Low variability of grain sizes in shallow areas >> mainly fine sediments (silt/clay/fine sand) >> a = 0.4 in depths < 2m

• Higher variability in deeper areas >> mix of sediments ( silt – coarse sand) >> a = 0.4 -2 in depths > 2m

Delaware Estuary Science & Environmental Summit 2013, Cape May , NJ

Sediment Transport Erosion and Deposition after 3 days

With vegetation Without vegetation

after improving initial conditions

Delaware Estuary Science & Environmental Summit 2013, Cape May , NJ

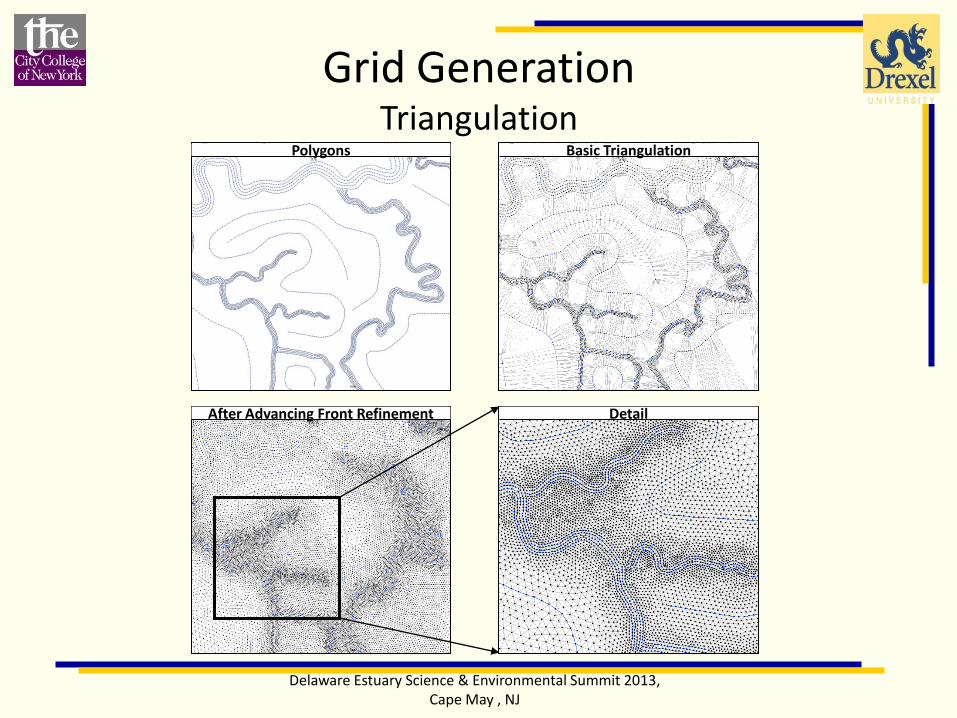
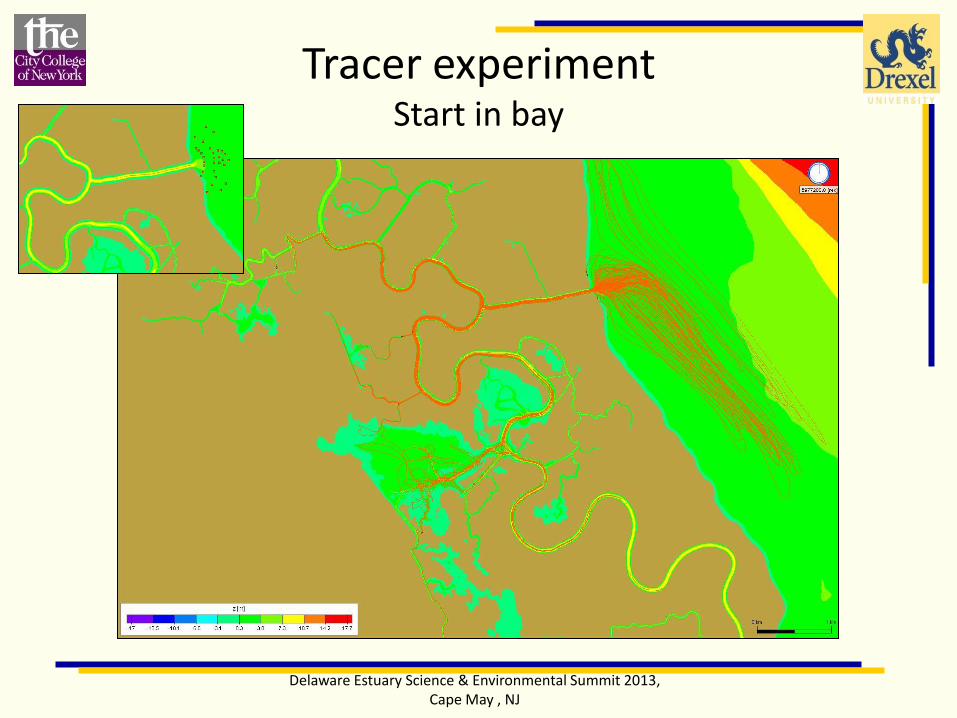
Summary • Tracer experiments useful to determine general transport paths • High grid resolution in combination with many processes

(hydrodynamic, sediment transport, heat transport, salt transport) results in low model efficiency important to find balance between spatial accuracy and efficiency

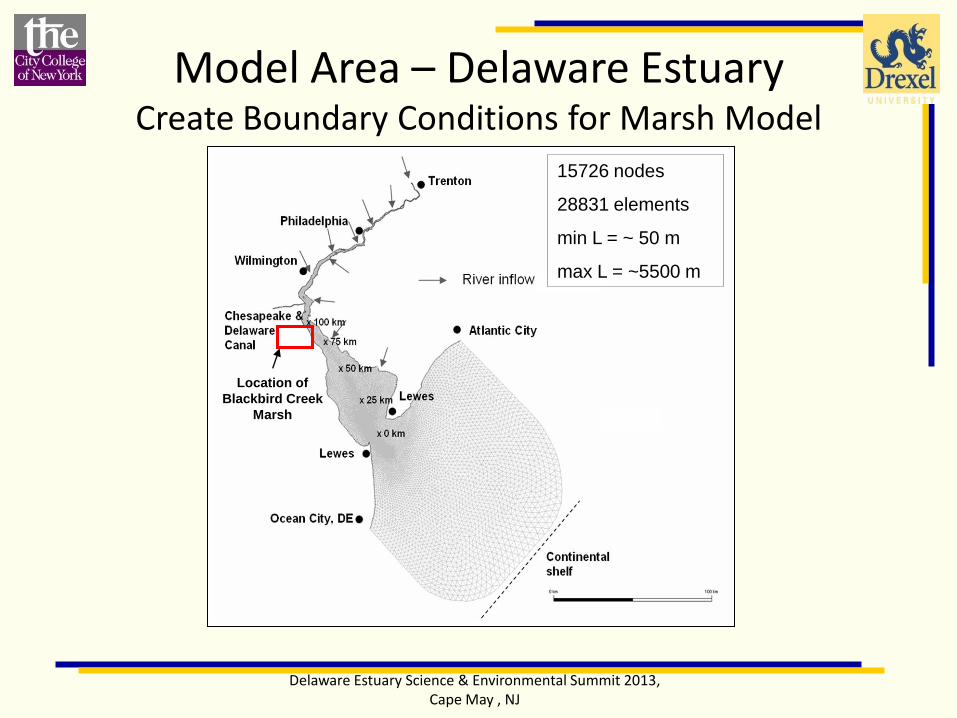
• Importance of accurate topographic data – Height of tidal flats determines when flooding starts

• Erosion/deposition patterns show – importance of good initial bathymetry data

here: bathymetry based on interpolation between cross sectional measurements

>> in first days of model run bathymetry reacts strongly to hydrodynamic conditions and adjusts

– Importance of vegetation without vegetation high velocities - resulting in larger unrealistic

erosion/deposition patterns on tidal flats

Delaware Estuary Science & Environmental Summit 2013, Cape May , NJ

Acknowledgements

National Estuarine Research Reserve Graduate Research Fellowship

Graduate Research Assistantship

This research was supported, in part, under National Science Foundation Grants CNS-0958379 and CNS-0855217 and the City University of New York High Performance Computing Center.

Delaware Estuary Science & Environmental Summit 2013, Cape May , NJ

Questions?

Delaware Estuary Science & Environmental Summit 2013, Cape May , NJ

Suspended Sediment D50=0.05 mm D50=0.1 mm

• suspended sediment concentration dependent on sediment composition on the ground >> the finer the d50 the higher the concentration need to adjust initial d50 to reach desired sediment concentration in water column

for sensitivity studies Problem: - the finer the d50 the more erosion >> unrealistic - limiting the erodable layer cuts off supply at some point >> no long term results yet that show significant deposition on tidal flats

• settling velocity calculated based on d50 >> consistently too high >> material settles completely during slack tide

0.7 g/l 0.2 g/l

Delaware Estuary Science & Environmental Summit 2013, Cape May , NJ

Elevation Adjustment Vegetation error

before after

difference


Recommended