43
High-resolution Porewater Sampling Near the Groundwater/ Surface Water Interface April 2009 Publication No. 09-03-017

High-resolution Porewater Sampling Near the Groundwater/ Surface Water Interface
April 2009 Publication No. 09-03-017

Publication and Contact Information This report is available on the Department of Ecology’s website at www.ecy.wa.gov/biblio/0903017.html
Data for this project are available on Ecology’s Environmental Information Management (EIM) website at www.ecy.wa.gov/eim/index.htm. Search User Study ID, CHPI003. Ecology’s Project Tracker Code for this project is 09-146.
For more information contact: Author: Charles Pitz, Licensed Geologist, Licensed Hydrogeologist Environmental Assessment Program Washington State Department of Ecology PO Box 47710, Olympia WA 98504-7710 Phone: 360-407-6775 Publications Coordinator Environmental Assessment Program P.O. Box 47600 Olympia, WA 98504-7600 Phone: 360-407-6764
Washington State Department of Ecology - www.ecy.wa.gov/ o Headquarters, Olympia 360-407-6000 o Northwest Regional Office, Bellevue 425-649-7000 o Southwest Regional Office, Olympia 360-407-6300 o Central Regional Office, Yakima 509-575-2490 o Eastern Regional Office, Spokane 509-329-3400
This report was prepared by a licensed hydrogeologist. A signed and stamped copy of the report is available upon request.
Any use of product or firm names in this publication is for descriptive purposes only and does not imply endorsement by the author or the Department of Ecology.
If you need this publication in an alternate format, please call Joan LeTourneau at 360-407-6764. Persons with hearing loss can call 711 for Washington Relay Service. Persons with a speech disability can call 877-833-6341.

Page 1
High-resolution Porewater Sampling Near the Groundwater/
Surface Water Interface
by Charles F. Pitz
Statewide Coordination Section Environmental Assessment Program
Washington State Department of Ecology Olympia, Washington 98504-7710

Page 2
This page is purposely left blank

Page 3
Table of Contents
Page
List of Figures and Tables....................................................................................................4
Abstract ................................................................................................................................5
Acknowledgements ..............................................................................................................6
Introduction ..........................................................................................................................7 Groundwater/Surface Water Exchange ..........................................................................7 Changes in Groundwater Chemistry near the Point of Discharge .................................8 Project Objectives ..........................................................................................................8
Study Area Site Description...............................................................................................10
Study Methods ...................................................................................................................12 PushPoint Installation and Measurement of Hydraulic Gradient ................................13 Water Quality Sampling ..............................................................................................13
Project Quality Assurance ..................................................................................................15 Cross-pumping .............................................................................................................15 Equipment Bias and Decontamination.........................................................................17 Field Split Replicates ...................................................................................................17 Laboratory Quality Assurance .....................................................................................17
Results ................................................................................................................................18
Discussion ..........................................................................................................................21 Method Testing ............................................................................................................21
Quality Control ....................................................................................................21 Field Application .................................................................................................21
Profiling Data Results ..................................................................................................22 Dilution and Mixing Influences on Porewater Concentrations ...........................22 Nutrient Cycling and Secondary Concentration Controls ...................................24 Implications for Loading Evaluations .................................................................26
Conclusions ........................................................................................................................28
Recommendations ..............................................................................................................29
References ..........................................................................................................................30
Appendices .........................................................................................................................35 Appendix A. Quality Assurance ..................................................................................37
Equipment Blanks ...............................................................................................37 Decontamination Blanks .....................................................................................37 Field Replicates ...................................................................................................38
Appendix B. Glossary, Acronyms, and Abbreviations ................................................40

Page 4
List of Figures and Tables
Page Figures Figure 1. Lake Whatcom Study Location. ................................................................................... 11
Figure 2. Schematic of the Study Porewater Sampling System................................................... 12
Figure 3. Schematic of Leakage Test System. ............................................................................. 16
Figure 4. Porewater Concentration Profiles. ................................................................................ 20
Figure 5. Vertical Profile of the Ratio of Dissolved Orthophosphate-P (OP) to Total Dissolved Phosphorus (TDP). ...................................................................................... 26
Tables Table 1. Leakage Test Results. .................................................................................................... 16
Table 2. Field and Laboratory Project Results. ............................................................................ 19
Table 3. Mixing Analysis Results for Orthophosphate (OP). ...................................................... 25
Table 4. Mixing Analysis Results for Total Dissolved Phosphorus (TDP). ................................ 25

Page 5
Abstract
A complex suite of biogeochemical processes can occur below the sediment surface in aquatic environments. These processes can produce strong vertical concentration gradients in upwelling groundwater, and significantly alter the chemical character of groundwater discharging to surface water. Accurate field measurements of these changes can be important for studies that depend on estimates of groundwater discharge chemistry and pollutant loading. This paper presents a refined field method for high-resolution water quality sampling of porewater in shallow sediments underlying the groundwater/surface water interface. A programmable syringe pump was coupled with an M.H.E. Inc. PushPoint device to collect porewater samples using an ultra-low-flow (≤2.5 ml/min) approach. During October 2008, the method was field tested in Lake Whatcom at a location previously sampled using traditional in-water piezometers. This ultra-low-flow method was successful in collecting unbiased, depth-discrete porewater samples at a 5-cm resolution, and revealed a significant reduction in dissolved phosphorus concentration in the uppermost 50 cm of the study area sediments. The field method described provides a low-cost, easy-to-use alternative to previous methods developed for porewater profile sampling. The method can help to reduce uncertainty and improve the overall accuracy of the Total Maximum Daily Load loading assessments and numerical modeling efforts conducted by the Department of Ecology’s Environmental Assessment Program. This technique may also benefit a variety of other projects where groundwater chemical loading to surface water is of concern.

Page 6
Acknowledgements
The author thanks the following individuals for their support during this project:
• Niki Thane (Western Washington University Geology Department) for assistance with field work.
• Robin Matthews (Western Washington University) for aquatic plant information.
• John Duff (U.S. Geological Survey), Robert Ford (U.S. Environmental Protection Agency), and Susan Hendricks (Murray State University) for technical guidance.
• Washington State Department of Ecology staff:
o Bill Kammin, Laura Klasner, Martha Maggi, and Patricia Olson for suggestions on the study design.
o Maggie Bell-McKinnon and Jenifer Parsons for aquatic plant information
o Kirk Sinclair for technical guidance.
o Daniel Baker, Dean Momohara, Aileen Richmond, Nancy Rosenbower, Leon Weiks, and Rebecca Wood at the Manchester Environmental Lab for sample management and analytical support.
o Barb Carey, Tom Gries, Steve Hood, Martha Maggi, and Paul Pickett for peer review of the draft report.
o Joan LeTourneau for editorial assistance.

Page 7
Introduction
A growing body of technical literature has highlighted the important role that nonpoint (diffuse) groundwater discharge can have in sustaining, or degrading, surface water quality and flow (e.g., Winter et al., 1998; EPA, 1991, 2000, 2008; Jones and Mulholland, 2000). This finding has prompted significant interest in the field study of groundwater/surface water interactions by the Washington State Department of Ecology’s (Ecology) Environmental Assessment Program (EAP). Over the past decade, EAP hydrogeologists have focused on quantifying groundwater’s contribution to a number of Washington State surface water systems, both in terms of water volume and chemical mass. This information has been used to help refine numerical models of watershed hydrodynamics and pollutant distribution. These models are often developed in support of surface water loading-capacity evaluations, commonly known as Total Maximum Daily Load (TMDL) studies.
Groundwater/Surface Water Exchange In settings where groundwater is discharging to a surface waterbody (i.e. gaining conditions), estimates of unit area chemical loading via advective groundwater flow are developed by:
FM = Q*C (1) where: FM = mass flux of a chemical loaded to a surface waterbody by groundwater discharge [(mass/time)/unit area].
Q = rate of groundwater discharge [(volume/time)/unit area].
C = concentration of the chemical in the groundwater discharge (mass/volume). For EAP TMDL studies, flow field analyses using Darcy’s Law or water budget approaches are the standard methods for developing estimates of the volume of groundwater discharge (Q). Porewater located beneath (hydraulically upgradient of) the groundwater/surface water interface (GSI) is typically sampled to estimate the chemical concentration of that discharge (C). The accuracy of the estimate for each of these terms can have a significant bearing on the accuracy of an overall loading-capacity analysis. Depending on the volume of exchange, even small differences in the estimated discharge concentration can significantly modify the final groundwater loading estimate provided to the surface water modeler (Equation 1). As a result, it is important that the measurements collected to support these estimates are as representative of true field conditions as possible.

Page 8
Changes in Groundwater Chemistry near the Point of Discharge Research advances in recent years have illustrated the dynamic nature of the transition zone or membrane between groundwater and surface water systems (Constanz, 2007; Winter et al., 1998; Ford, 2005, Bridge, 2005; EPA, 2008).1
Project Objectives
A variety of interrelated biogeochemical processes can be active in this transition zone, including reduction-oxidation (redox)-driven sorption reactions, microbial and plant uptake, and mixing with overlying surface water. These processes can create strong vertical solute concentration gradients over short distances and considerably alter the final chemical character of groundwater discharge (EPA, 2000; Ford, 2005; Laskov et al., 2007). In many cases, processes active near the GSI will decrease or attenuate dissolved chemical concentrations as groundwater approaches the point of discharge, potentially by an order of magnitude or more (Ford, 2005; Duff et al., 1998; Charette and Sholkovitz, 2002). These attenuation effects can have a significant bearing on the estimated total groundwater-related chemical load to a surface system, even at a watershed scale (Harvey and Fuller, 1998; Angier and McCarty, 2008; Kuwabara et al., 2009). Two key nutrients of interest for Washington State TMDL studies, phosphorus and nitrogen, can be particularly subject to these attenuation reactions (Charette and Sholkovitz, 2002; Chambers and Odum, 1990; Cox et al., 2005; Maleki et al., 2004; Fisher and Reddy, 2001; Griffioen, 2006; Di Toro, 2001). Previous investigators have shown that the majority of these attenuation processes can occur within as little as 1 to 50 cm of the sediment surface (Chambers and Odum, 1990; Beck et al., 2007; Berg and McGlathery, 2001; Duff et al., 1998, Martin et al., 2003; Ford, 2005). The monitoring tools and methods that have been used for EAP groundwater/surface water interaction studies are not sufficiently accurate for characterizing changes in groundwater chemistry in this depth range. Without accurate measurements of water quality changes in shallow sediments, EAP estimates of groundwater chemical loading to surface water can have a relatively high degree of uncertainty (e.g., Pitz, 2005; Sinclair and Kardouni, 2009). This uncertainty reduces confidence in how accurately models of groundwater/surface water exchange reflect the natural environment.
The purpose of this study was to develop and test a high-resolution, porewater sampling method to improve descriptions of groundwater discharge chemistry, particularly in areas where steep chemical concentration gradients are suspected near the GSI. The success of the test method was judged by its ability to produce: • Porewater chemical profiles at a vertical resolution of 5 centimeters. • An adequate sample volume for chemical analysis. • A sample free of surface water cross-contamination.
1 In a lake setting such as the one described in this report, this zone is technically referred to as the hypolentic zone (EPA, 2008).

Page 9
• Quality control blanks free of significant contamination. • Duplicate sample results within acceptable quality objective criteria. • Water samples in an efficient, low-cost, and field-robust manner. The study area selected for method testing is currently the subject of an active TMDL nutrient- assimilation modeling effort (Pickett and Hood, 2008). Phosphorus is the primary nutrient of concern for that effort. Because the groundwater phosphorus loading estimates developed for the model did not account for attenuation effects in the upper meter of lake-bed sediment (Pitz, 2005), the findings generated from this study may benefit that modeling work.
Page 10
Study Area Site Description
During October 2008, method testing was conducted approximately 15 meters off the western shoreline of Lake Whatcom, in Whatcom County, Washington (Figure 1). The site is located immediately downgradient of an active golf course, with moderate-density suburban development further upslope. Prior to development of the golf course in the 1970s, the property adjacent to the lake was used for livestock farming. Austin Creek flows into the lake less than 100 meters from the test site. The creek drains approximately 5000 acres of the western portion of the Lake Whatcom watershed, and is probably a major source of the sediment observed at the study location. Surficial sediments at the site are poorly-graded sands with silt (Pitz, 2005), supporting scattered growth of the aquatic macrophyte Elodea canadensis. Prior to testing the sampling system, a piezometer-based, constant-head injection test (Pitz, 2006) was conducted at approximately 1.2 meters below the sediment surface. The test results indicate a moderate permeability condition for sub-surface deposits (~ 4.2E-03 centimeters/second). This permeability value suggests the deeper sediments at the study location are similar to sediments observed near the surface. A 1.4-meter-deep tubing piezometer (LWGW-09) was installed and monitored at the study location during 2002-2003 as part of a Lake Whatcom TMDL support study (Pitz, 2005). The deep piezometer is constructed with a ~15-cm long screened interval. Porewater at this depth has historically exhibited a positive (upward) vertical hydraulic gradient, indicating a groundwater discharge condition in the study area. Water quality samples collected from the deep piezometer revealed a high dissolved phosphorus concentration in upwelling groundwater, accompanied by sub-oxic to anoxic conditions [<1-2 milligram/liter (mg/L) dissolved oxygen, elevated dissolved iron]. Ammonia as nitrogen (ammonia-N) averaged ~0.3 mg/L, and dissolved organic carbon was highly elevated, averaging >20 mg/L. Negligible levels of nitrite + nitrate as nitrogen (nitrate-N) were measured at this depth (<0.1 mg/L). This piezometer was left in place at the end of the 2002-2003 study, and was used again for the current project to provide boundary conditions for data interpretation. These conditions suggested the potential for a significant reduction in the phosphorus concentration of discharging groundwater as it moves to shallower portions of the sediment column.

Page 11
Figure 1. Lake Whatcom Study Location.

Page 12
Study Methods
A variety of techniques have been used for collecting samples representative of shallow porewater solute gradients (Krupa et al., 1999; Bridge, 2005; Kalbus et al., 2006; ITRC, 2006; Hesslein, 1976; Doussan et al., 1998). Examples of these techniques include permeable membrane diffusion samplers (a.k.a. peepers), porewater extractors, in-situ chambers and probes, and at-surface seepage or benthic flux chambers. These methods were evaluated against the project goals, with a particular focus on finding a low-cost, field-efficient procedure. The approach ultimately adopted for this study is an ultra-low-flow purge and sampling method using the M.H.E. Inc. PushPoint device coupled to an automated pump. This is a modification of techniques developed and described by Duff et al. (1998), Henry (2003), Zimmerman et al. (2005), Ford (2005), and Berg and McGlathery (2001). A controlled, ultra-low-flow [≤2.5 milliliter/minute (ml/min)] approach was used to minimize the disruption of natural concentration gradients that could lead to cross-contamination of closely-spaced sample intervals. A schematic of the sampling system is presented in Figure 2.
Figure 2. Schematic of the Study Porewater Sampling System.
Sediment Surface
PushPoint sampler – 3.2 to 6.3 mm ID,4 cm open interval length
1/8” ID Pharmed®
tubing
CHEMetrics®
DO & ferrous ironfield analysis
0.45 µm filter
Pre-preservedSample container
Syringe pump
Battery
Sample for OP, TDP,
NH4, and Cllab analysis
Luer tubing lock
Tubing clamp
60 ml syringe
Ring clamp
5-50 cm
Stabilizing plate

Page 13
A full description of the methods used during this project is presented in Pitz (2008). Vertical profiling of porewater quality conditions was focused on the uppermost 50 centimeters (cm) of site sediments (5, 10, 15, 25 and 50 cm intervals). A 3.175 millimeter (mm) interior-diameter, 61 cm long PushPoint was used for the 5 and 10 cm depth intervals; a 6.35 mm interior-diameter, 91 cm long PushPoint was used for the 15, 25, and 50 cm intervals. Both models of the PushPoint device have a 4 cm long slotted open interval; the mid-point of this open ‘screen’ was used as the position point for each depth interval. Samples were collected in October 2008; water depth at the time of sampling was approximately 3 feet.
PushPoint Installation and Measurement of Hydraulic Gradient A surface plate was used to stabilize and seal the PushPoint device during insertion into the sediment column. After installation, the PushPoint interior guard rod was removed and a flexible tube was attached to the top of the PushPoint. The hydraulic head observed in the tube was compared to the surface water stage to establish the vertical hydraulic gradient for the various depth intervals, using Equation 2:
(2) where: iv = vertical hydraulic gradient (dimensionless).
dh = the difference in head between the lake stage and PushPoint water level (L).2
Water Quality Sampling
dl = the distance from the lakebed surface to the mid-point of the PushPoint open interval (L). where (L) is length. By convention, negative hydraulic gradient values indicate potential loss of water from the lake to groundwater, while positive values indicate potential groundwater discharge into the lake.
Porewater samples were drawn from the PushPoint using a programmable syringe pump (New Era Pump Systems Inc., NE-500) modified for field use. Samples were collected after purging and discarding a minimum of 1.2 times the interior volume of the sampling system. Depth interval samples were collected a minimum of 10 cm apart laterally to avoid cross contamination. Additional samples of lake water from immediately above the GSI, and porewater from the original deep piezometer (140 cm - LWGW-09), were collected to provide boundary conditions for the transition zone. 2 If the surface water stage is below the PushPoint water level, [dh] is recorded as a positive value. If the surface water stage is above the PushPoint water level, [dh] is recorded as a negative value. The [dl] term is always recorded as a positive value.

Page 14
Due to time limitations, the surface water sample, the deep piezometer sample, and the 50-cm PushPoint sample were collected one day apart from the remaining depth intervals. The time difference between samples is assumed not to significantly alter the results or conclusions presented here. All contact sampling equipment, including the PushPoint device, was cleaned between sample intervals by triple rinsing using a pressure sprayer and laboratory-grade, de-ionized water. All samples were filtered and preserved at the time of collection. Analysis of porewater samples included:
• Field analysis for: dissolved oxygen, ferrous iron, temperature, and specific conductance.
• Laboratory analysis for: orthophosphate as phosphorus (OP), total dissolved phosphorus (TDP), nitrogen, and chloride.
All samples for lab analysis were submitted to Ecology’s Manchester Environmental Laboratory following standard sample preservation and handling procedures.

Page 15
Project Quality Assurance
Cross-pumping Cross-contamination is a significant concern when collecting close-interval samples of porewater, particularly near the sediment surface. Cross-contamination can directly result from two main processes:
• Pumping-induced vertical movement of porewater from a higher or lower sediment horizon into the sampler intake.
• Introduction of surface water into the sample during pumping by leakage down an annular space adjacent to the porewater collection device.
The key field controls for both of these problems are maintaining an ultra low-flow pumping rate, and limiting total withdrawal volumes. These steps help to minimize disturbance of in-situ hydraulic and chemical gradients and limit the spatial extent of the three-dimensional capture zone. Control of annular leakage, probably the problem of greatest concern, can be addressed by packing fine sediments around the entry point of the sampling device into the sediment surface, or using a sealed stabilizing plate to deter downward leakage (Figure 2). Vertical movement of porewater between sediment horizons is also limited by the strong horizontal to vertical permeability contrast typical of deposited sediments (Duff et al., 1998). To examine the adequacy of these controls in preventing cross-contamination, an annular leakage test was performed at an adjacent location prior to sampling (Pitz, 2008). After installing the PushPoint device and stabilizing plate, hydraulic head and field water chemistry were measured and compared between the underlying porewater and overlying surface water. Measuring a distinct difference in these conditions at the end of an initial purge (intended to remove surface water introduced during the installation of the sampling tube) is considered a reliable indication of hydraulic isolation.3
The leakage test was performed at three depth intervals (5, 10, and 25 cm). After measurement and comparison of equilibrated hydraulic head conditions, the PushPoint device was purged using a peristaltic pump (
Figure 3).4
Table 1
The sample stream was directed through a small-volume flow cell to allow instantaneous measurement of temperature, pH, specific conductance, and dissolved oxygen. Equilibrated, end-of-purge measurement results are presented in ; the end-of-purge field parameter results for the original piezometer (LWGW-09) are also included for comparison.
3 If there is substantial leakage of surface water down the annular space and into the PushPoint open interval, hydraulic and chemical conditions would quickly equilibrate to match (or nearly match) surface water measurements. 4 Use of a peristaltic pump for the leakage tests probably provides a worst-case condition for leakage since the minimum pumping rate is greater than the rate for the syringe pump used for sampling. A peristaltic pump was employed for the leakage test to allow the use of a metered flow cell.

Page 16
The test data indicate that annular leakage was not a significant problem for the sampling system at the test location. Maintenance of a positive hydraulic head difference and distinct specific conductance and dissolved oxygen values between porewater and surface water suggest the PushPoint open interval was hydraulically isolated from the surface even at the 5 cm depth. This conclusion is also supported by water quality data collected during the sampling described later in this report.
Figure 3. Schematic of Leakage Test System.
Table 1. Leakage Test Results.
Sediment depth (cm)
Vertical hydraulic gradient (iv)
(dimensionless)(A)
Temp. (°C)
pH (S.U.)
Specific conductance
(µS/cm)
Dissolved oxygen
(mg/L)(B) Base of surface water column NA 16.0 6.18 58 9.4
5 0.01 15.6 6.06 175 1.40 10 0.05 15.6 6.13 170 1.28 25 0.08 15.7 6.17 173 0.68
140 (LWGW-09)(C) 0.03 15.8 6.05 399 1.77 (A) Positive values indicate an upward vertical hydraulic gradient. (B) Dissolved oxygen measured by electrode probe. (C)Measured separately.
Sediment surface
12V battery
Peristaltic pump
Low-volume flow block
Waste linePushPoint sampler – 1/16” ID,≤ 1.5” open interval length
1/8” ID Pharmed® tubing
Reducingconnector
¼” ID Pharmed® tubing
Ring clamp
Stabilizing plate

Page 17
Equipment Bias and Decontamination The use of ultra low-flow techniques and limited sample quantities requires minimizing the interior volume of the equipment used to collect close-interval porewater samples. This can make decontamination (decon) of equipment between sampling sets more difficult, potentially leading to an indirect source of cross contamination. Low pumping rates also limit the total sample volume that can be collected in a reasonable timeframe. The smaller the volume of sample collected, the greater the influence of equipment contamination on the final sample results. To quantify bias introduced into the project results by both sampling materials (including the PushPoint device, tubing, syringes, filters, sample containers, and preservatives) and decon procedures, a total of six blank samples were collected and submitted to the laboratory for analysis. Detailed discussion and results from these tests are presented in the Quality Assurance Appendix. All blank samples collected during the project were reported by the laboratory as non-detect. The results indicate that no measurable positive bias was introduced into the sample results by leaching from sampling materials. The results also indicate that the decon procedures adopted for the sampling method were successful in preventing indirect cross contamination between stations.
Field Split Replicates To evaluate overall sampling and analytical precision, split-replicate sample sets were collected and submitted as blind samples for analysis. Split samples were collected from three of the sampling intervals (10, 25, and 50 cm). A detailed comparison of the replicate pair results is presented in the Quality Assurance Appendix. All replicate pairs were well within the target percent relative standard deviation for all parameters (Pitz, 2008), indicating excellent project data precision.
Laboratory Quality Assurance All analytical results reported by Manchester Laboratory were subject to quality assurance testing and review by a laboratory chemist prior to delivery to the author. With the exception of the ammonia-N results, all sample concentrations were reported without qualification. Due to the use of excess preservative relative to the small sample volume collected, ammonia-N results were reported as estimates by the laboratory (potentially biased low by matrix interference effects). The qualification of the ammonia-N values does not significantly change the interpretation of the final data results.
Page 18
Results
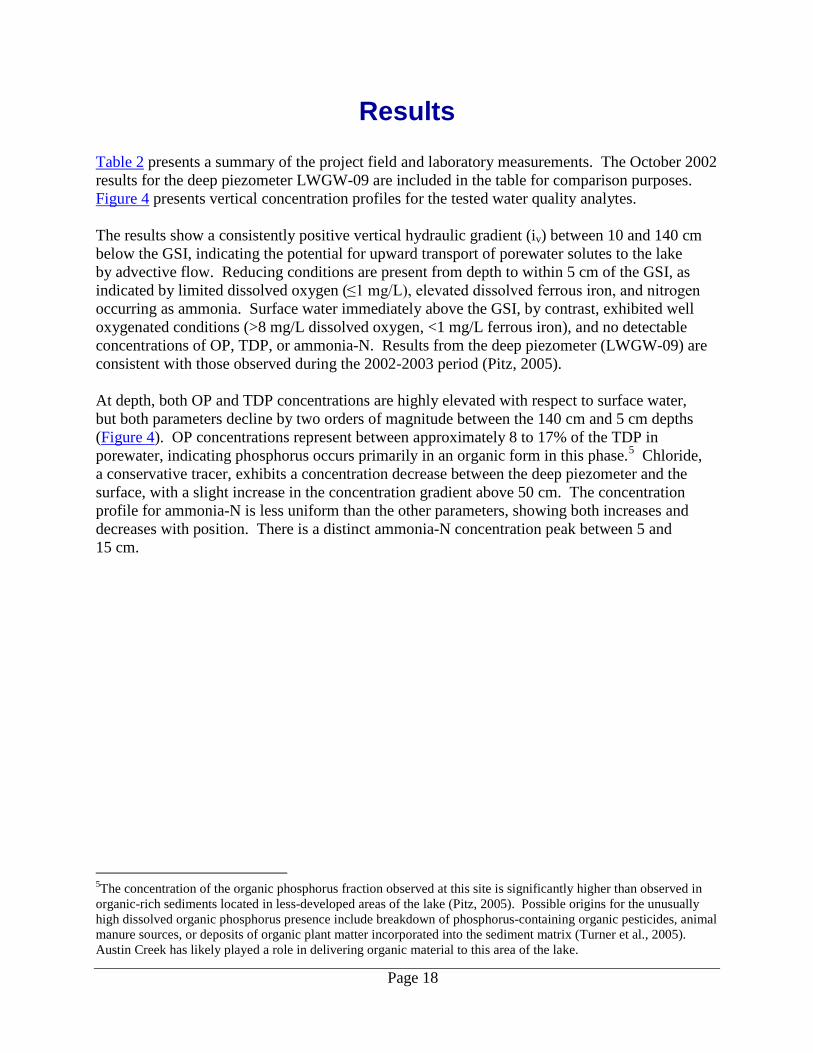
Table 2 presents a summary of the project field and laboratory measurements. The October 2002 results for the deep piezometer LWGW-09 are included in the table for comparison purposes. Figure 4 presents vertical concentration profiles for the tested water quality analytes. The results show a consistently positive vertical hydraulic gradient (iv) between 10 and 140 cm below the GSI, indicating the potential for upward transport of porewater solutes to the lake by advective flow. Reducing conditions are present from depth to within 5 cm of the GSI, as indicated by limited dissolved oxygen (≤1 mg/L), elevated dissolved ferrous iron, and nitrogen occurring as ammonia. Surface water immediately above the GSI, by contrast, exhibited well oxygenated conditions (>8 mg/L dissolved oxygen, <1 mg/L ferrous iron), and no detectable concentrations of OP, TDP, or ammonia-N. Results from the deep piezometer (LWGW-09) are consistent with those observed during the 2002-2003 period (Pitz, 2005). At depth, both OP and TDP concentrations are highly elevated with respect to surface water, but both parameters decline by two orders of magnitude between the 140 cm and 5 cm depths (Figure 4). OP concentrations represent between approximately 8 to 17% of the TDP in porewater, indicating phosphorus occurs primarily in an organic form in this phase.5
Chloride, a conservative tracer, exhibits a concentration decrease between the deep piezometer and the surface, with a slight increase in the concentration gradient above 50 cm. The concentration profile for ammonia-N is less uniform than the other parameters, showing both increases and decreases with position. There is a distinct ammonia-N concentration peak between 5 and 15 cm.
5The concentration of the organic phosphorus fraction observed at this site is significantly higher than observed in organic-rich sediments located in less-developed areas of the lake (Pitz, 2005). Possible origins for the unusually high dissolved organic phosphorus presence include breakdown of phosphorus-containing organic pesticides, animal manure sources, or deposits of organic plant matter incorporated into the sediment matrix (Turner et al., 2005). Austin Creek has likely played a role in delivering organic material to this area of the lake.
Page 19
Table 2. Field and Laboratory Project Results.
Station ID Depth (cm)
Sample Date
Vertical Hydraulic
Gradient (iv) (dimensionless)
Dissolved Oxygen
(mg/L)(A)
Ferrous Iron
(mg/L)(B)
Orthophosphate-P (mg/L)(C)
Total Phosphorus (mg/L)(C)
Ammonia-N (mg/L)(C)
Chloride (mg/L)(C)
SW-01 Surface water 10/13/08 NA 8.5 0.5 0.0030 U 0.010 U 0.020 UJ 2.50
HR-PP-05 5 10/14/08 NM 0.4 9 0.0031 0.038 1.14 J 3.01
HR-PP-10 10 10/14/08 0.05 0.25 >10 0.0057 0.056 1.28 J 3.26
HR-PP-15 15 10/14/08 0.02 0.5 >10 0.0409 0.236 1.29 J 4.04
HR-PP-25 25 10/14/08 0.08 1.0 >10 0.0360 0.227 0.362 J 4.48
HR-PP-50 50 10/13/08 0.1 0.8 >10 0.0910 0.736 0.829 J 6.07
LWGW-09 140 10/13/08 0.03 1.0 >10 0.192 2.13 0.411 J 7.02
LWGW-09 140 10/15/02 0.007 2.54(D) 35.7 0.298 J 2.18 0.272 3.27
NA – Not applicable NM – Not measurable U – Analyte not detected at or above the reporting limit. J – Result considered an estimate. (A)Dissolved oxygen measurement by CHEMetrics® low-concentration colorimetric analysis. (B)Ferrous iron measurement by CHEMetrics® colorimetric analysis. (C)All samples field-filtered @ 0.45 µm. (D)Dissolved oxygen measured by membrane dissolved oxygen probe.

Page 20
Figure 4. Porewater Concentration Profiles.
Dissolved Oxygen(mg/L)
Ferrous Iron(mg/L)
Orthophosphate-P*(mg/L)
Total Dissolved P*(mg/L)
Ammonia-N(mg/L)
0 2 4 6 8 10
>
>
>
>>
0 0.04 0.08 0.12 0.16 0.2 0 0.3 0.6 0.9 1.2 1.50 0.5 1.0 1.5 2.0 2.5
Dep
th b
elow
GW
/SW
inte
rfac
e (c
m)
0 2 4 6 8 10
Lake5
1015
25
50
140
D.O. by colorimetric analysis
Dissolved sample conc. (> indicates value above range of analysis method)
Non-detect (OP- <0.003 mg/L; TDP - < 0.01 mg/L; NH4 - < 0.02 mg/L)
Chloride(mg/L)
0 2 4 6 8 10
Concentration decrease due to mixing and dilution
Concentration decrease due to secondary attenuation processes
*Note difference in concentration scales for OP and TDP

Page 21
Discussion
Method Testing The results demonstrate that the proposed sampling method was successful in meeting all of the criteria outlined in the Project Objectives section. Results indicate that the method is capable of retrieving an adequate volume of porewater sample, free of cross-contamination, to within 5 cm of the GSI. Quality Control Field quality control testing indicated no significant bias due to cross-pumping of surface water into the sample stream. Additional measures such as replicate testing and blank sample analysis further establish that the samples collected were within acceptable quality control limits for precision, material bias, and decon ‘carryover’. The ultra-low flow rates were an effective control on sample turbidity, and 1 or 2 small volume (25-mm) syringe filters were adequate for filtering samples prior to analysis. Field Application The sampling system is judged to be portable, low cost, and simple to use. Total equipment and fabrication cost for the system depicted in Figure 2 was approximately $650. The time required for sample collection from each sampling interval is dictated by the low pumping rate and the number of analytes of interest (which dictate the total volume of sample required for analysis). Purge and sample collection for each depth interval took 30 to 45 minutes. To speed the overall process, a multi-channel syringe pump and sampler frame could be substituted for the equipment described in this report to allow simultaneous collection from multiple depth intervals (similar to Duff et al., 1998). The simplicity of the method compares favorably with the cost, level of effort, and equipment and handling requirements of approaches used by other authors (e.g., Krupa et al., 1999; Hesslein, 1976; ITRC, 2006). The approach is also considered to be better suited for characterizing shallow solute gradients in settings where solute transport is dominated by advection (vs. diffusion) (Duff et al., 1998). The small diameter and wall thickness of the PushPoint device would probably make the device too fragile for installations in very coarse-grained or well-consolidated sediments.6
6 Due to higher fluid velocities and smaller relative contact surface area, coarse-grained settings are also less likely to exhibit strong porewater concentration gradients and attenuation affects.
Capillary action and air trapping can make accurate observations of hydraulic head difficult with the smaller diameter (~3-mm) PushPoint device; the larger diameter (~6-mm) PushPoint could be installed separately for this purpose. Due to the need to handle the equipment and attach tubing, use of the PushPoint is best suited for shallow-water settings. Deeper water installations would require snorkeling or diving equipment (true for nearly all other techniques).

Page 22
Although the sample volume collected for each laboratory parameter (15-20 ml) is significantly smaller than normally requested, Manchester Laboratory was successful in analyzing all samples, while still providing low-limit detection levels. For future projects, the amount of preservative used in the sample containers should be decreased to avoid the matrix interference problems encountered during the study. Momohara (2008) recommends using 15%-20% of the normal preservative volume when submitting low-volume samples to Manchester Laboratory. The sampling procedure described in this report is intended to complement, rather than replace, the field monitoring conducted using deeper (3-8 feet), larger-diameter piezometers. While the PushPoint device is well suited to highly detailed measurements of porewater quality conditions near the GSI, larger-diameter piezometers probably provide more accurate measurements of hydraulic gradient conditions, at least at depth. Larger diameter piezometers also allow the use of additional instrumentation and testing not possible with the small diameter equipment described here (e.g., thermistors, hydraulic testing). The sampling system described here can be used for rapid reconnaissance measurements of porewater quality conditions near the interface at multiple locations. This approach may be best for cases where researchers are most interested in mapping groundwater discharge conditions over large areal scales. Alternatively, the method can be used to provide highly detailed descriptions of vertical concentration gradients at a limited number of locations to help determine specific mechanisms of solute attenuation. Depending on sediment character, it may be possible to collect porewater samples from even shallower intervals than attempted for this study, if the total length of the PushPoint open interval were reduced. While this study focused on characterizing high-resolution porewater nutrient conditions, the techniques are easily adapted to the study of other water quality constituents such as metals, chlorinated solvents, and petroleum products that may undergo changes at the end of the groundwater flow path (e.g., Zimmerman et al., 2005; Ford, 2005, Dean et al., 1999).
Profiling Data Results Profiling results indicate the presence of a strong vertical concentration gradient in porewater phosphorus in the upper portions of the test area sediment column. While natural heterogeneity may explain some of the data variation, the observed gradient is interpreted primarily as the result of dilution by mixing, and immobilization or uptake of phosphorus below the GSI. Dilution and Mixing Influences on Porewater Concentrations In the vicinity of the GSI, porewater concentration reductions may be attributable, in part, to dilution by mixing of overlying lower-concentration surface water with underlying higher-concentration porewater. Mixing itself may be the result of a combination of factors, including diffusion exchange with the water column, advective movement of surface water into sediments during hydraulic gradient reversals, and burial of surface water during reworking and deposition of sediments. The concentration of upwelling porewater may also be diluted as a result of an increase in the bulk water content of sediments at increasingly shallower depths.

Page 23
To determine the extent of these influences on the observed phosphorus concentrations, the results from Table 2 were evaluated using a one-dimensional mixing equation for a chemically conservative tracer (Walecka-Hutchison and Walworth, 2005; Schuster et al., 2003).7
(3)
where:
This model can be used to determine the proportion of one water type in a mixture of two distinct end-point water types by:
= initial tracer concentration of water type A (mg/L-chloride in lake water, SW-01). = initial tracer concentration of water type B (mg/L-chloride in groundwater, piezometer
LWGW-09, assumes no dilution by surface water at this depth). = the concentration of the tracer in a mid-point mixture of water types A and B
(mg/L-chloride in porewater between 5-50 cm). X = the volume fraction of water [Va/(Va + Vb)], where Va is the volume of water type A, and Vb is the volume of water type B. Rearranging to solve for X, Equation 3 becomes:
(4)
The calculated value for X from Equation 4 can be used to develop a dilution factor (DF) by:
(5)
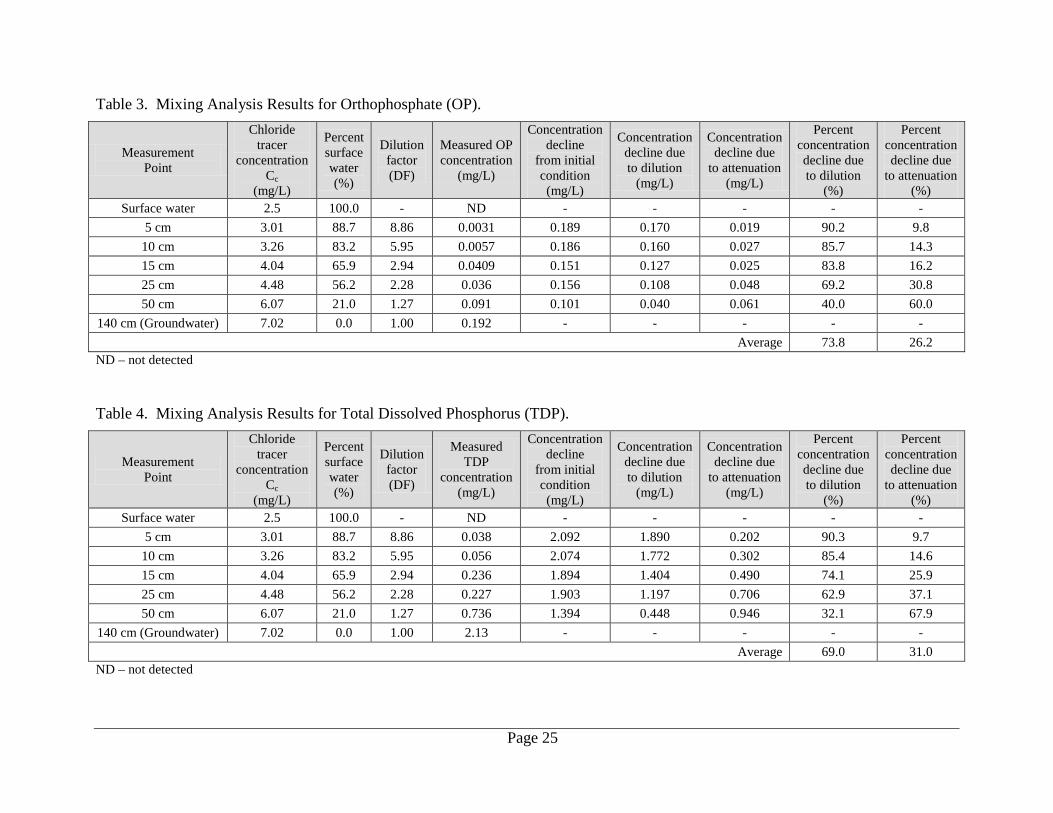
For a reactive (non-conservative) parameter of interest such as phosphorus, the DF value can in turn be used to quantify what proportion of an observed concentration decline from an initial condition is attributable to dilution. If the field-measured mid-point concentration of the parameter is lower than expected by dilution alone, the remaining concentration decrease is assumed to be the result of one or more secondary attenuation processes. Tables 3 and 4 present the results of the mixing analysis for OP and TDP for each mid-point depth interval. The results of the analysis suggest that a significant portion of the observed decline in TDP and OP concentration at each interval is due to mixing and dilution by surface water, particularly at depths ≤ 25 cm (the blue shaded areas on Figure 4). Phosphorus concentrations at all mid-point intervals, however, were lower than expected due to dilution alone. This suggests that additional phosphorus uptake or immobilization processes may be active throughout the tested portion of the sediment column. The mixing analysis indicates a range between 10 to 67% of the phosphorus concentration decline is attributable to these attenuation processes at any given depth interval, with an average of ~30%.
7 A conservative tracer (in this case, chloride) is one that does not react or degrade as it moves through a sediment matrix. A reduction in tracer concentration is assumed to be due solely to dilution by mixing with water with a lower tracer concentration.
Page 24
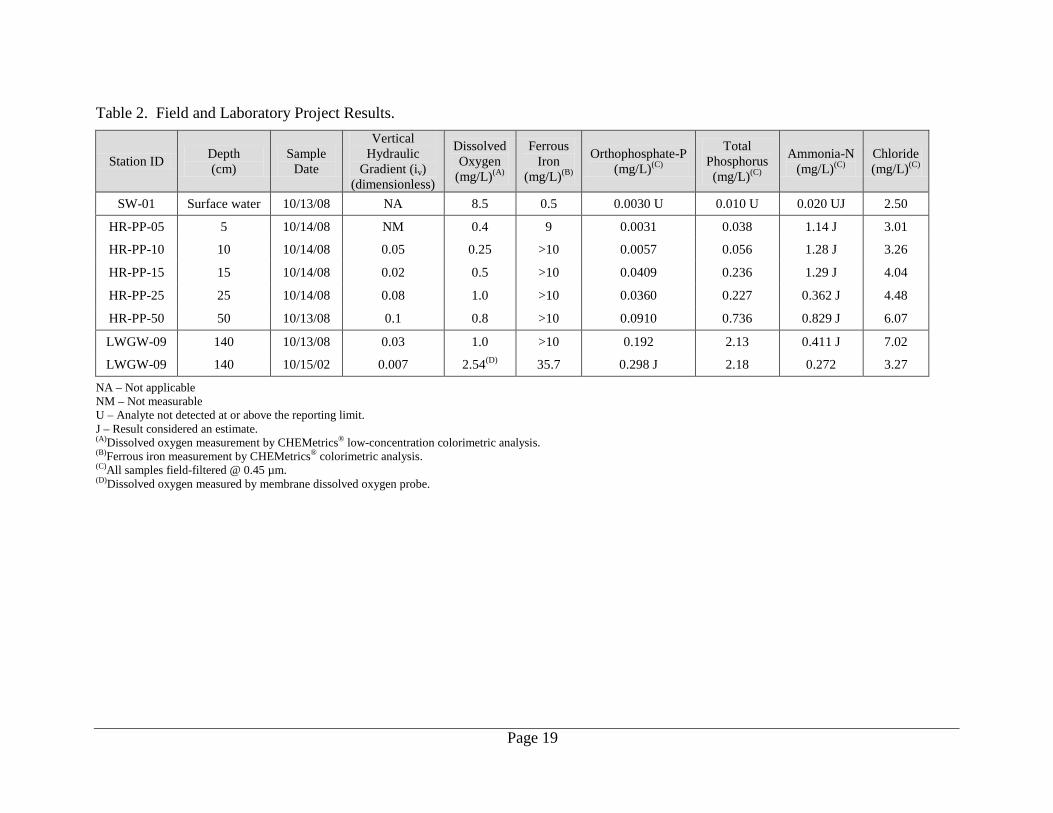
Nutrient Cycling and Secondary Concentration Controls Phosphorus and nitrogen cycling in shallow aquatic sediments can involve a complex suite of both biotic and abiotic controls which influence the transport and ultimate release of nutrients to the surface water column. As upwelling groundwater enters this transition area by advective flow, dissolved-phase nutrients can be subjected to a variety of inter-related processes. These processes include microbially-mediated sorption and precipitation reactions, mineralization of organic forms to inorganic forms, uptake by macrophytes and periphytic biofilm, and molecular diffusion to the water column (Wetzel, 1983; Turner et al., 2005; Berg and McGlathery, 2001; Duff, 2008; Hendricks and White, 2000; Holman et al., 2008; Bostrom et al., 1988; Spiteri et al., 2005; Carlyle and Hill, 2001; MacDonald et al., 2009, Walter et al., 1996). The study was not designed to identify the specific reasons for the extra phosphorus concentration reduction (the green shaded area on Figure 4). However, the presence of reducing conditions to within 5 cm of the GSI (dissolved oxygen ≤ 1 mg/L; >8 mg/L dissolved iron; elevated ammonia-N) suggests that sorption of dissolved phosphorus onto precipitated ferric iron surfaces is not a primary explanation of the observed decline.8 MacDonald et al. (2009) have noted that phosphorus sorption can still occur in predominantly reducing environments at oxic micro-sites adjacent to the roots of aquatic plants.9
MacDonald and his coauthors have also recently reported evidence of removal of phosphorus from the dissolved phase under reducing conditions by co-precipitation with ferrous iron solids. Collectively, these immobilization processes can cause phosphorus to accumulate as a solid phase in the uppermost portion of the sediment profile, reducing the dissolved phase concentration exiting to the water column (Wetzel, 1983; Di Toro, 2001; Carlyle and Hill, 2001). A significant change in the redox condition of the sediments can result in a later release of phosphorus from this ‘reservoir’. The ammonia-N concentration profile exhibits a dilution-related decrease similar to the phosphorus profiles between the 50 and 25 cm intervals, but then increases significantly between 15 and 5 cm. This peak is consistent with observations of nitrogen profiles in aquatic sediments observed by other authors (Duff et al., 2002; Sheibley et al., 2003; Berg and McGlathery, 2001; Hendricks et al., 2008). This suggests that mineralization of organic matter is maximized at this interval, coincident with the macrophyte rooting zone. Sheibley et al. (2003) and Duff (2008) report that once the ammonia encounters an aerobic boundary (presumably at some point above the 5 cm interval) it may be quickly converted to nitrate via nitrification, then further attenuated via denitrification, or transported to the water column.
8 Rapid precipitation and coupling of dissolved phosphorus with ferric iron could still occur at a redox front located between 0 and 5 cm. 9 Maximum rooting depth for Elodea canadensis is typically ~15 cm (Parsons, 2008).
Page 25
Table 3. Mixing Analysis Results for Orthophosphate (OP).
Measurement Point
Chloride tracer
concentration Cc
(mg/L)
Percent surface water (%)
Dilution factor (DF)
Measured OP concentration
(mg/L)
Concentration decline
from initial condition (mg/L)
Concentration decline due to dilution
(mg/L)
Concentration decline due
to attenuation (mg/L)
Percent concentration decline due to dilution
(%)
Percent concentration decline due
to attenuation (%)
Surface water 2.5 100.0 - ND - - - - - 5 cm 3.01 88.7 8.86 0.0031 0.189 0.170 0.019 90.2 9.8
10 cm 3.26 83.2 5.95 0.0057 0.186 0.160 0.027 85.7 14.3 15 cm 4.04 65.9 2.94 0.0409 0.151 0.127 0.025 83.8 16.2 25 cm 4.48 56.2 2.28 0.036 0.156 0.108 0.048 69.2 30.8 50 cm 6.07 21.0 1.27 0.091 0.101 0.040 0.061 40.0 60.0
140 cm (Groundwater) 7.02 0.0 1.00 0.192 - - - - - Average 73.8 26.2
ND – not detected Table 4. Mixing Analysis Results for Total Dissolved Phosphorus (TDP).
Measurement Point
Chloride tracer
concentration Cc
(mg/L)
Percent surface water (%)
Dilution factor (DF)
Measured TDP
concentration (mg/L)
Concentration decline
from initial condition (mg/L)
Concentration decline due to dilution
(mg/L)
Concentration decline due
to attenuation (mg/L)
Percent concentration decline due to dilution
(%)
Percent concentration decline due
to attenuation (%)
Surface water 2.5 100.0 - ND - - - - - 5 cm 3.01 88.7 8.86 0.038 2.092 1.890 0.202 90.3 9.7
10 cm 3.26 83.2 5.95 0.056 2.074 1.772 0.302 85.4 14.6 15 cm 4.04 65.9 2.94 0.236 1.894 1.404 0.490 74.1 25.9 25 cm 4.48 56.2 2.28 0.227 1.903 1.197 0.706 62.9 37.1 50 cm 6.07 21.0 1.27 0.736 1.394 0.448 0.946 32.1 67.9
140 cm (Groundwater) 7.02 0.0 1.00 2.13 - - - - - Average 69.0 31.0
ND – not detected

Page 26
The coincidence of the rapid drop in the OP/TDP ratio between 15 and 5 cm (Figure 5) suggests the possibility of plant uptake of available inorganic phosphorus in this zone as well. The ratio of dissolved OP to TDP reaches a maximum at 15 cm, and rapidly decreases at 10 cm and 5 cm depths (Figure 5).
Figure 5. Vertical Profile of the Ratio of Dissolved Orthophosphate-P (OP) to Total Dissolved Phosphorus (TDP).
Implications for Loading Evaluations The data indicate that the concentration of phosphorus delivered to the GSI by advective groundwater transport at this site is lower than originally estimated from the deep piezometer data alone. This concentration reduction appears to be due to a combination of the removal of phosphorus from the dissolved phase by various attenuation processes active prior to discharge, and simple dilution by mixing. Since dilution and mixing processes are not mass destructive or immobilizing, this portion of the porewater phosphorus is assumed to still be available for transport to the overlying water column. This suggests that the phosphorus concentration assumed for mass loading calculations (Equation 1) should be adjusted downward only by an amount equivalent to the phosphorus removed from the porewater by attenuation processes. For this particular site, the data indicates
OP/TDP Ratio
Dep
th b
elow
GW
/SW
Inte
rfac
e (c
m)
0
Lake
5
10
15
25
50
140
0.20.1 0.150.05
Page 27
the phosphorus concentrations used in Equation 1 may need to be reduced by between 10 to 67% of the original piezometer (LWGW-09) concentration values. The detailed profiling of only one location at Lake Whatcom limits the ability to draw broader conclusions about phosphorus attenuation processes active near the GSI at other locations around the lake. However, most of the other piezometers sampled during the 2002-2003 study (Pitz, 2005) exhibited conditions that are probably less favorable to significant near-surface phosphorus concentration reduction (e.g., oxidized porewater at depth, coarser-grained sediment matrix, higher permeabilities, few established surface macrophytes, low organic content). If further refinement of the groundwater phosphorus load to the lake is critical to the TMDL modeling work, profile sampling at additional sites may be of benefit.

Page 28
Conclusions
The dynamic biogeochemical processes often active in the near vicinity of the groundwater/ surface water interface (GSI) can generate strong vertical solute concentration gradients and alter the chemistry of discharging groundwater. Traditional piezometer designs used by Ecology’s Environmental Assessment Program (EAP) to characterize water exchange across the interface are not well suited to accurately describe these changes. The high-resolution profiling method described in this report should be a useful additional tool for this purpose. The methods described here are intended to complement, rather than replace, other in-water monitoring methods developed and used by EAP staff. The sampling system is low cost and simple to use, and is capable of providing unbiased, depth-discrete porewater samples at a 5-cm resolution. The method can be used to provide rapid reconnaissance data at multiple locations, or highly detailed descriptions of contaminant attenuation in focused areas. The method should be considered for use wherever steep concentration gradients near the GSI are suspected. The tools and methods described here should help to reduce uncertainty and improve the overall accuracy of the TMDL loading assessments and numerical modeling efforts conducted by EAP. These procedures also have potential for application in a variety of other investigations of groundwater discharge to surface water (e.g., mapping toxic or nutrient groundwater plume entry/attenuation to Puget Sound; e.g., Pitz, 1999; Simonds et al., 2008). The results collected during the October 2008 method testing indicate that the concentration of phosphorus delivered to the water column by advective groundwater flow in the Sudden Valley area of Lake Whatcom is likely lower than suggested by the 2002-2003 monitoring data.

Page 29
Recommendations
Based on the results of this study, the following recommendations are suggested:
• Adopt the techniques described in this report for use in Ecology’s Environmental Assessment Program studies where groundwater-related solute loading is of concern and site conditions are favorable. The method should be used as a complement to other monitoring approaches. Site conditions most favorable to generating strong concentration gradients near the groundwater/surface water interface (GSI) include: reducing conditions at depth, highly elevated porewater concentrations in comparison to surface water conditions, presence of macrophytes or near-surface biological activity, high organic content, fine overall sediment-column grain size, and low to moderate permeability.
• Reduce the standard volume of preservative added to sample containers for the small volume samples generated by the methods described in this report to avoid interferences with laboratory analysis.
• Adopt the use of a long-shaft temperature probe to improve and speed characterization of vertical hydraulic gradients and groundwater flux at sites where the PushPoint device is used (Conant, 2004; Duff, 2002; Kuwabara et al., 2009).
• Use a multi-channel syringe pump to speed sample collection at multi-interval study sites.

Page 30
References
Angier, J.T. and McCarty, G.W., 2008. Variations in base-flow nitrate flux in a first order stream and riparian zone, Journal of the American Water Resources Association, v. 44, No. 2, p. 367-380. Beck, M., Dellwig, O., Kolditz, K, Freund, H., Liebezeit, G., Schnetger, B., and Brumsack, H.J., 2007. In-situ pore water sampling in deep intertidal flat sediments. Limnology and Oceanography: Methods, v. 5, p. 136-144. Berg, P. and McGlathery, K.J., 2001. A high-resolution pore water sampler for sandy sediments. Limnology and Oceanography, v. 46, no. 1, p. 203-210. Bostrom, B., Andersen, J.M., Fleischer, S., and Jansson, M., 1988. Exchange of phosphorus across the sediment-water interface. Hydrobiologia, v. 170, p. 229-244. Bridge, J.W., 2005. High resolution in-situ monitoring of hyporheic zone biogeochemistry. United Kingdom Environment Agency Science Report SC030155/SR3, 51p. http://publications.environment-agency.gov.uk/pdf/SCHO0605BJCO-e-e.pdf. Carlyle, G.C. and Hill, A.R., 2001. Groundwater phosphate dynamics in a river riparian zone: effects of hydrologic flowpaths, lithology and redox chemistry. Journal of Hydrology, v. 247, p. 151-168. Chambers, R.M. and Odum, W.E., 1990. Porewater oxidation, dissolved phosphate and the iron curtain – Iron-phosphorus relations in tidal freshwater marshes. Biogeochemistry, v. 10, p. 37-52. Charette, M.A. and Sholkovitz, E.R., 2002. Oxidative precipitation of groundwater derived ferrous iron in the subterranean estuary of a coastal bay. Geophysical Research Letters, v. 29, n. 10, p. 85-1 to 85-4. Conant, B. Jr., 2004. Delineating and Quantifying Ground Water Discharge Zones Using Streambed Temperatures, Ground Water, v. 42, No. 2, p. 243-257. Constanz, J., 2007. The Streambed as a Dynamic Membrane in the Watershed, Abstract. EOS Transactions American Geophysical Union, 88(52), Fall Meeting Supplement. Cox, S.E., Simonds, F.W., Huffman, R.L., Doremus, Llyn, Defawe, R.M., 2005. Ground water/ surface water interactions and quality of discharging ground-water in streams of the Lower Nooksack River Basin, Whatcom County, Washington. U.S. Geological Survey Scientific Investigations Report 2005-5255, 46 p. http://pubs.water.usgs.gov/sir2005-5255/. Dean, S.M., Lendvay, J.M., Barcelona, M.J., Adriaens, P., and Katopodes, N.D., 1999. Installing multilevel sampling arrays to monitor groundwater and contaminant discharge to a surface water body. Groundwater Monitoring and Remediation, v. 19, no. 4, p. 90-96.

Page 31
Di Toro, D. M., 2001. Sediment Flux Modeling. J. Wiley and Sons, New York, 624 p. Doussan, C., Ledoux, E, and Detay, M., 1998. River-groundwater exchanges, bank filtration, and groundwater quality: ammonium behavior. Journal of Environmental Quality, v. 27, p. 1418-1427. Duff, J.H., Murphy, F., Fuller, C.C., Triska, F.J., Harvey, J.W., and Jackman, A.P., 1998. A mini drivepoint sampler for measuring pore water solute concentrations in the hyporheic zone of sand-bottom streams. Limnology and Oceanography, v. 43(6), p. 1378-1383. Duff, J.H., Hendricks, S.P., Jackman, A. P., and Triska, F. J., 2002. The effect of Elodea Canadensis beds on porewater chemistry, microbial respiration, and nutrient retention in the Shingobee River, Minnesota, North America. Verh. Internat. Verein. Limnol., v. 28, p. 214-222. Duff, J. H., 2008. U.S. Geological Survey, Research Hydrologist, Menlo Park, CA. Personal communication. EPA, 1991. A Review of Methods for Assessing Nonpoint Source Contaminated Ground-Water Discharge to Surface Water. U.S. Environmental Protection Agency, Washington, DC. EPA/570/9-91/010. EPA, 2000. Proceedings of the Ground-Water/Surface-Water Interactions Workshop. U.S. Environmental Protection Agency. EPA/542/R-00/007, Parts 1-3. www.epa.gov/tio/download/remed/gwsw/gwsw_part1.pdf. www.epa.gov/tio/tsp/download/gwsw/gwsw_part2.pdf. www.epa.gov/tio/tsp/download/gwsw/gwsw_part3.pdf. EPA, 2008. ECO Update/Ground Water Forum Issue Paper, Evaluating Ground-Water/ Surface-Water Transition Zones in Ecological Risk Assessments. U.S. Environmental Protection Agency. EPA-540-R-06-072, July 2008, 30 p. www.epa.gov/oswer/riskassessment/ecoup/pdf/eco_update_08.pdf. Fisher, M.M., and Reddy, K.R., 2001. Phosphorus Flux from Wetland Soils Affected by Long-Term Nutrient Loading. Journal of Environmental Quality, v. 30, p. 261-271. Ford, R.G., 2005. The Impact of Ground-water/Surface-water Interactions on Contaminant Transport with Application to an Arsenic Contaminated Site. U.S. EPA Environmental Research Brief, National Risk Management Research Laboratory, Ada, OK. EPA 600-S-05-002, 22 p. www.epa.gov/ada/download/briefs/epa_600_s05_002.pdf. Griffioen, J., 2006. Extent of immobilization of phosphate during aeration of nutrient-rich, anoxic groundwater. Journal of Hydrology, v. 320, p. 359-369. Harvey, L.W. and Fuller, C.C., 1998. Effect of enhanced manganese oxidation in the hyporheic zone on basin-scale geochemical mass balance. Water Resources Research, v. 34, p. 623-636.
Page 32
Hendricks, S.P. and White, D.S., 2000. Stream and Groundwater Influences on Phosphorus Biogeochemistry, in: Jones, J.B., and Mulholland, P.J. (eds.), 2000. Streams and Ground Waters, Academic Press, San Diego, CA, 425 p. Hendricks, S. P., Duff, J. H., Triska, F. J., and Jackman, A. P., 2008. Bacterial biomass and productivity within different subsurface hydrologic environments of a sandy, low elevation river in north-central Minnesota, USA. Verh. Internat. Verein. Limnol., v. 30, Part 2, p. 203-212. Henry, M., 2003. PushPoint Sampler Operators Manual and Applications Guide, v. 2.01, M.H.E. Products, Inc. www.mheproducts.com/MHE-instructions-ver-2.01.doc. Hesslein, R.H., 1976. An in-situ sampler for close interval pore water studies. Limnology and Oceanography, v. 21, p. 912-914. Holman, I., Howden, N., Whelan, M., Bellamy, P., Rivas-Casado, M., and Willby, N., 2008. An improved understanding of phosphorus origin, fate, and transport within groundwater and the significance for associated receptors, Final Report, Project WFD85. Scotland and Northern Ireland Forum for Environmental Research, 139 p. www.sniffer.org.uk/Webcontrol/Secure/ClientSpecific/ResourceManagement/UploadedFiles/WFD85_Final-Report_with_security.pdf. Interstate Technology & Regulatory Council (ITRC), 2006. Technology Overview of Passive Sampler Technologies, DSP-4, Washington, D.C., 115 p. www.itrcweb.org/Documents/DSP_4.pdf. Jones, J.B. and Mulholland, P.J. (eds.), 2000. Streams and Ground Waters. Academic Press, San Diego, CA, 425 p. Kalbus, E., Reinstorf, F., and Schirmer, M., 2006. Measuring methods for groundwater-surface water interactions: a review. Hydrology and Earth System Sciences, v. 10, p. 873-887. Krupa, S.L., Belanger, T.V., Heck, H.H., Brock, J.T., and Jones, B.J., 1999. Krupaseep – the Next Generation Seepage Meter. In: Florida Department of Environmental Protection Ambient Newsletter, v. 3, no. 3, p. 7-9. www.floridadep.org/water/monitoring/docs/news/news9908.pdf. Kuwabara, J.S., Topping, B.R., Lynch, D.D., Carter, J.L., and Essaid, H.I., 2009. Benthic Nutrient Sources to Hypereutrophic Upper Klamath Lake, Oregon, USA. Environmental Toxicology and Chemistry, V. 28, No. 3, p. 516-524. Laskov, C., Herzog, C., Lewandowski, J., and Hupfer, M., 2007. Miniaturized photometrical methods for the rapid analysis of phosphate, ammonium, ferrous iron, and sulfate in pore water of fresh sediments. Limnology and Oceanography: Methods 4, p. 63-71. MacDonald, L.H., Durrant, L.R., and Jaffe, P.R., 2009. Phosphate and arsenic sequestration on iron oxides: The influence of iron reducing bacteria on phosphate and arsenic detention and release rates. In: www.princeton.edu/~lmacdona/iron-oxides.html. Accessed on 3/5/2009.

Page 33
Maleki, L.M, White, J.R., and Reddy, K.R., 2004. Nitrogen and Phosphorus Flux Rates from Sediment in the Lower St. Johns River Estuary. Journal of Environmental Quality, v. 33, p. 1545-1555. Martin, J. B., Hartl, K. M., Corbett, D. R., Swarzenski, P. W., and Cable, J. E., 2003. A multi-level pore-water sampler for permeable sediments. Journal of Sedimentary Research, v. 73, no. 1, p. 128-132. Momohara, D., 2008. Washington State Department of Ecology, Senior Chemist, Manchester Environmental Laboratory. Personal communication. Parsons, J., 2008. Washington State Department of Ecology, Aquatic Plant Specialist. Personal communication. Pickett, P. and Hood, S., 2008. Lake Whatcom Watershed Total Phosphorus and Bacteria Total Maximum Daily Loads: Water Quality Study Findings. Washington State Department of Ecology, Olympia, WA. Publication No. 08-03-024, 128 p. www.ecy.wa.gov/biblio/0803024.html. Pitz, C.F., 1999. Estimates of Nitrate-N Loading to South Puget Sound by Groundwater Discharge. Washington State Department of Ecology, Olympia, WA. Publication No. 99-348, 17 p. www.ecy.wa.gov/biblio/99348.html. Pitz, C.F., 2005. Lake Whatcom Total Maximum Daily Load Groundwater Study. Washington State Department of Ecology, Olympia, WA. Publication No. 05-03-001, 90 p. www.ecy.wa.gov/biblio/0503001.html. Pitz, C.F., 2006. An Evaluation of a Piezometer-based Constant-Head Injection Test for use in Groundwater/Surface Water Interaction Studies. Washington State Department of Ecology, Olympia, WA. Publication No. 06-03-042, 18 p. + app. www.ecy.wa.gov/biblio/0603042.html. Pitz, C.F., 2008. Quality Assurance Project Plan: High-resolution, Pore-water Sampling Near the Groundwater/Surface Water Interface. Washington State Department of Ecology, Olympia, WA. Publication No. 08-03-115, 29 p. www.ecy.wa.gov/biblio/0803115.html. Schuster, P.F., Reddy, M.M., LaBaugh, J.W., Parkhurst, R.S., Rosenberry, D.O., Winter, T.C., Antweiler, R.C., and Dean, W.E., 2003. Characterization of lake water and groundwater movement in the littoral zone of Williams Lake, a closed-basin lake in north central Minnesota. Hydrological Processes, vol. 17, p. 823-838. Sheibley, R.W., Duff, J.H., Jackman, A.P., and Triska, F.J., 2003. Inorganic nitrogen transformations in the bed of the Shingobee River, Minnesota: Integrating hydrologic and biological processes using sediment perfusion cores. Limnology and Oceanography, vol. 48, no. 3, p. 1129-1140.
Page 34
Simonds, F.W., Swarzenski, P.W., Rosenberry, D.O., Reich, C.D., and Paulson, A.J., 2008. Estimates of Nutrient Loading by Ground-Water Discharge into the Lynch Cove Area of Hood Canal, Washington. U.S. Geological Survey Scientific Investigations Report 2008-5078, 66 p. http://pubs.usgs.gov/sir/2008/5078/. Sinclair, K.A. and Kardouni, J.D., 2009. Surface-water/Groundwater Interactions and Near-stream Groundwater Quality along the Palouse River, South Fork Palouse River, and Paradise Creek. Washington State Department of Ecology, Olympia, WA. Publication No. 09-03-007, 71 p. www.ecy.wa.gov/biblio/0903007.html. Spiteri, C., Regnier, P., Slomp, C.P., and Charette, M.A., 2005. pH-dependent iron oxide precipitation in a subterranean estuary. Journal of Geochemical Exploration, v. 88, p. 399-403. Turner, B.L., Frossard, E., and Baldwin, D.S., eds., 2005. Organic Phosphorus in the Environment. CABI Publishing, CAB International, Cambridge, MA, USA, 399 p. Walecka-Hutchison, C., and Walworth, J.L., 2005. Quantification of in-situ trichloroethene dilution versus biodegradation using a novel chloride concentration technique. In: Environmental Chemistry: Green Chemistry and Pollutants in Ecosystems; E. Lichtfouse, J. Schwarzbauer, and D. Robert (eds.), Springer, Berlin, Germany, 769 p. Walter, D.A., Rea, B.A., Stollenwerk, K.G., and Savoie, J., 1996. Geochemical and Hydrologic Controls on Phosphorus transport in a sewage-contaminated sand and gravel aquifer near Ashumet Pond, Cape Cod, Massachusetts. U.S. Geological Survey Water Supply Paper 2463, 89 p. Wetzel, R.G., 1983. Limnology, Second Edition. Saunders College Publishing, Philadelphia, PA, 767 p. Winter, T.C., Harvey, J.W., Franke, O.L., and Alley, W.M., 1998. Ground Water and Surface Water – A Single Resource. U.S. Geological Survey Circular 1139, 79 p. http://pubs.usgs.gov/circ/circ1139/. Zimmerman, M.J., Massey, A.J., and Campo, K.W., 2005. Pushpoint Sampling for Defining Spatial and Temporal Variations in Contaminant Concentrations in Sediment Pore Water near the Ground-Water/Surface-Water Interface. U.S. Geological Survey Scientific Investigations Report 2005-5036, 75 p. http://pubs.usgs.gov/sir/2005/5036/pdf/sir2005_5036.pdf.

Page 35
Appendices

Page 36
This page is purposely left blank
Page 37
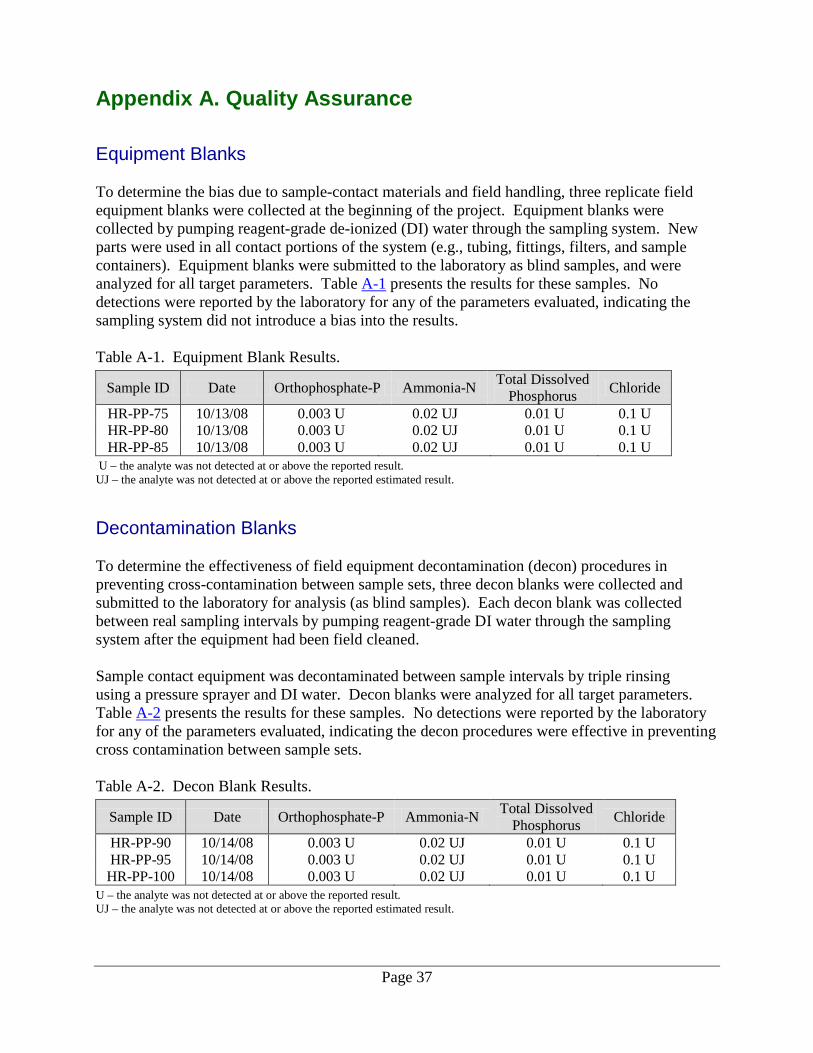
Appendix A. Quality Assurance Equipment Blanks To determine the bias due to sample-contact materials and field handling, three replicate field equipment blanks were collected at the beginning of the project. Equipment blanks were collected by pumping reagent-grade de-ionized (DI) water through the sampling system. New parts were used in all contact portions of the system (e.g., tubing, fittings, filters, and sample containers). Equipment blanks were submitted to the laboratory as blind samples, and were analyzed for all target parameters. Table A-1 presents the results for these samples. No detections were reported by the laboratory for any of the parameters evaluated, indicating the sampling system did not introduce a bias into the results. Table A-1. Equipment Blank Results.
Sample ID Date Orthophosphate-P Ammonia-N Total Dissolved Phosphorus Chloride
HR-PP-75 10/13/08 0.003 U 0.02 UJ 0.01 U 0.1 U HR-PP-80 10/13/08 0.003 U 0.02 UJ 0.01 U 0.1 U HR-PP-85 10/13/08 0.003 U 0.02 UJ 0.01 U 0.1 U
U – the analyte was not detected at or above the reported result. UJ – the analyte was not detected at or above the reported estimated result. Decontamination Blanks To determine the effectiveness of field equipment decontamination (decon) procedures in preventing cross-contamination between sample sets, three decon blanks were collected and submitted to the laboratory for analysis (as blind samples). Each decon blank was collected between real sampling intervals by pumping reagent-grade DI water through the sampling system after the equipment had been field cleaned. Sample contact equipment was decontaminated between sample intervals by triple rinsing using a pressure sprayer and DI water. Decon blanks were analyzed for all target parameters. Table A-2 presents the results for these samples. No detections were reported by the laboratory for any of the parameters evaluated, indicating the decon procedures were effective in preventing cross contamination between sample sets. Table A-2. Decon Blank Results.
Sample ID Date Orthophosphate-P Ammonia-N Total Dissolved Phosphorus Chloride
HR-PP-90 10/14/08 0.003 U 0.02 UJ 0.01 U 0.1 U HR-PP-95 10/14/08 0.003 U 0.02 UJ 0.01 U 0.1 U HR-PP-100 10/14/08 0.003 U 0.02 UJ 0.01 U 0.1 U
U – the analyte was not detected at or above the reported result. UJ – the analyte was not detected at or above the reported estimated result.

Page 38
Field Replicates To assist in evaluating the random variability introduced into the sample results by a combination of field and laboratory influences, three field split replicates (from the 10 cm, 25 cm, and 50 cm depth intervals) were collected and submitted to the laboratory as blind samples. Split replicates were collected by splitting the sample stream between like containers. Replicate samples were analyzed for all target laboratory parameters. Tables A-3 through A-6 present the results for these samples. The data indicates precision between replicate pairs was well within the target relative standard deviations (RSDs) (as % of mean) for all parameters (Pitz, 2008). Table A-3. Field Replicate Results for Orthophosphate-P.
Station Concentration Units Qual. RSD
as % of mean
HR-PP-10 0.0057 mg/L HR-PP-12.5 (Rep.) 0.0053 mg/L 5.1 HR-PP-25 0.036 mg/L HR-PP-30 (Rep.) 0.0375 mg/L 2.9 HR-PP-50 0.091 mg/L HR-PP-60 (Rep.) 0.103 mg/L 8.7
Mean RSD 5.6
Table A-4. Field Replicate Results for Ammonia-N.
Station Concentration Units Qual. RSD
as % of mean
HR-PP-10 1.28 mg/L J HR-PP-12.5 (Rep.) 1.39 mg/L J 5.8 HR-PP-25 0.362 mg/L J HR-PP-30 (Rep.) 0.346 mg/L J 3.2 HR-PP-50 0.829 mg/L J HR-PP-60 (Rep.) 0.788 mg/L J 3.6
Mean RSD 4.2
J – The analyte was positively identified; the associated concentration result is an estimate.
Page 39
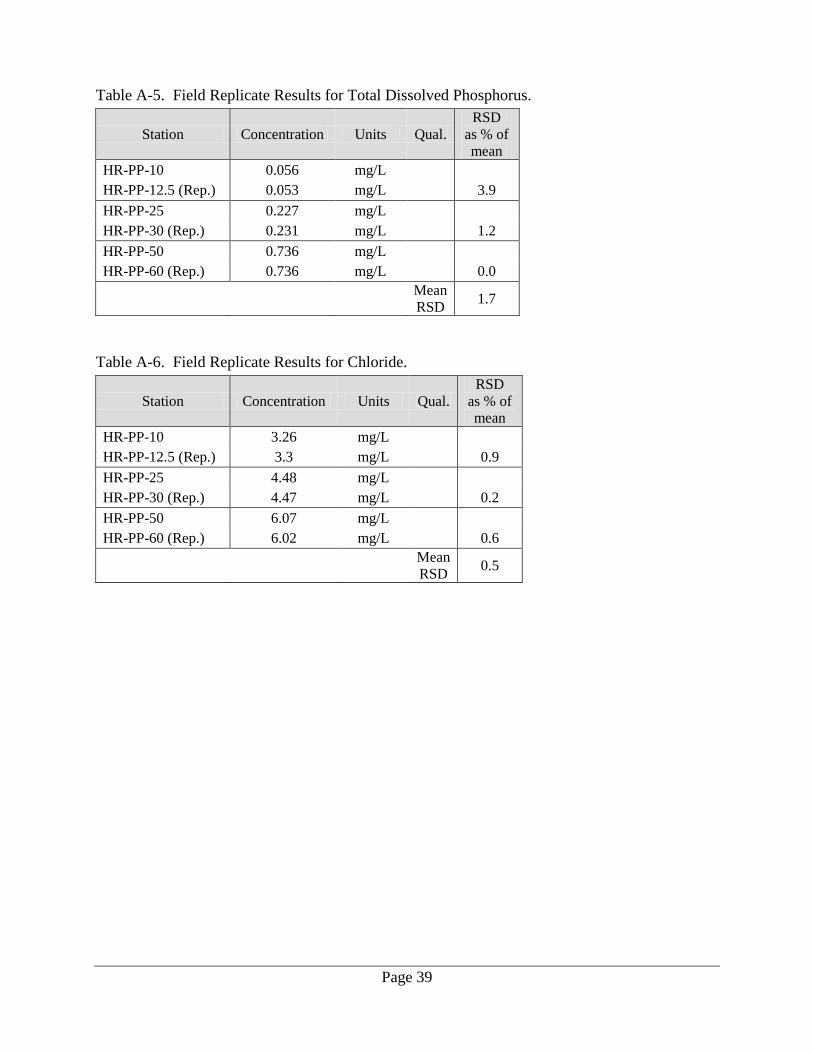
Table A-5. Field Replicate Results for Total Dissolved Phosphorus.
Station Concentration Units Qual. RSD
as % of mean
HR-PP-10 0.056 mg/L HR-PP-12.5 (Rep.) 0.053 mg/L 3.9 HR-PP-25 0.227 mg/L HR-PP-30 (Rep.) 0.231 mg/L 1.2 HR-PP-50 0.736 mg/L HR-PP-60 (Rep.) 0.736 mg/L 0.0
Mean RSD 1.7
Table A-6. Field Replicate Results for Chloride.
Station Concentration Units Qual. RSD
as % of mean
HR-PP-10 3.26 mg/L HR-PP-12.5 (Rep.) 3.3 mg/L 0.9 HR-PP-25 4.48 mg/L HR-PP-30 (Rep.) 4.47 mg/L 0.2 HR-PP-50 6.07 mg/L HR-PP-60 (Rep.) 6.02 mg/L 0.6
Mean RSD 0.5
Page 40
Appendix B. Glossary, Acronyms, and Abbreviations Advective flow (advection): The transport of a solute by the bulk motion of flowing groundwater.
Annular space: Open space between the outer casing of a well or piezometer and the adjacent sediments.
Anoxic: Depleted of oxygen.
Biotic: Produced or caused by living organisms.
Diffusion: The net transport of molecules from a region of higher concentration to one of lower concentration by random molecular motion.
Dissolved oxygen: A measure of the amount of oxygen dissolved in water.
Downgradient: The direction of flow, as defined by the hydraulic gradient.
Groundwater: Water in the subsurface that saturates the rocks and sediment in which it occurs. The upper surface of groundwater saturation is commonly termed the water table.
Groundwater discharge: The movement of groundwater from the subsurface to the surface by advective flow.
Hydraulic gradient: The difference in hydraulic head between two measuring points, divided by the distance between the two points.
Hydraulic head: The pressure exerted by a water mass at any given point. Total head is the sum of elevation head, pressure head, and velocity head.
pH: A measure of the acidity or alkalinity of water. A low pH value (0 to 7) indicates that an acidic condition is present, while a high pH (7 to 14) indicates a basic or alkaline condition. A pH of 7 is considered to be neutral. Since the pH scale is logarithmic, a water sample with a pH of 8 is ten times more basic than one with a pH of 7.
Piezometer: A small-diameter, non-pumping well used to collect groundwater quality samples and hydraulic head measurements.
Porewater: The water filling the spaces between grains of sediment.
Redox: Any chemical reaction which involves oxidation and reduction.
Specific conductance: A measure of water’s ability to conduct an electrical current. Specific conductance is related to the concentration and charge of dissolved ions in water; reported here in units of µS/cm @ 25°C.

Page 41
Total Maximum Daily Load (TMDL): A water cleanup plan. A distribution of a substance in a waterbody designed to protect it from exceeding water quality standards. A TMDL is equal to the sum of all of the following: (1) individual wasteload allocations for point sources, (2) the load allocations for nonpoint sources, (3) the contribution of natural sources, and (4) a margin of safety to allow for uncertainty in the wasteload determination. A reserve for future growth is also generally provided. Acronyms and Abbreviations Ammonia-N ammonia as nitrogen
Decon decontamination
EAP Environmental Assessment Program
Ecology Washington State Department of Ecology
EPA U.S. Environmental Protection Agency
GSI groundwater/surface water interface
GW groundwater
N nitrogen
Nitrate-N nitrite + nitrate as nitrogen
OP orthophosphate as phosphorus
P phosphorus
RSD relative standard deviation
SC specific conductance
S.U. standard unit
SW surface water
TDP total dissolved phosphorus


