Yang et al. Vol. 27, No. 5 /May 2010/J. Opt. Soc. Am. A 977
High-sensitivity molecular sensing usinghollow-core photonic crystal fiber and
surface-enhanced Raman scattering
Xuan Yang,1,2 Chao Shi,1,2 Damon Wheeler,3 Rebecca Newhouse,3 Bin Chen,1,2 Jin Z. Zhang,3 and Claire Gu1,2,*1Department of Electrical Engineering, University of California at Santa Cruz, Santa Cruz, California 95064, USA
2Advanced Studies Laboratories, NASA Ames Research Center, Moffett Field, California 94035, USA3Department of Chemistry and Biochemistry, University of California at Santa Cruz, Santa Cruz,
. INTRODUCTIONn recent years, photonic crystal fibers (PCF) havemerged as a promising platform for surface-enhancedaman scattering (SERS) sensors [1–7]. While SERS pro-ides the unique molecular selectivity and high sensitiv-ty, optical fibers have been used as SERS probes becausef their low cost, flexibility, compactness, reliability, andemote sensing capability [8–16]. In addition, the uniqueicrostructures of axially aligned air channels in PCFs
ot only provide the photonic bandgap for the confine-ent of light inside the fiber core, but also offer an excel-
ent platform for the interaction between the excitationight and the sample, both of which make it a potentiallyobust and sensitive probe for SERS sensing.
Generally, there are two kinds of PCF sensors based onERS: one is the solid-core photonic crystal fiber (SCPCF)
17–20] and the other is the hollow-core photonic crystalber (HCPCF) [21–26]. For SCPCF, the cladding holes aresually coated with metal nanoparticles and filled withhe analyte solution; the Raman signal is generated byhe interaction between the evanescent wave and thenalyte. However, as the energy of the evanescent wave iselatively weak, the most energy confined inside the cen-ral solid core will lead to a large Raman background ofilica. In a HCPCF the nanoparticles used as the SERSubstrate are usually mixed with the analyte solution andlled into the core (and possibly cladding) channel(s). Ashe particles interact directly with the excitation lightropagating inside the filled core channel, where the elec-romagnetic field is the strongest, most of the excitationight inside the PCF is involved in the generation of theERS signal from the analyte, thereby avoiding a strong
ackground signal from silica. To fill only the core chan-el, the cladding holes at one end of the PCF are sealed bysing a fusion splicer, and the sealed end of the fiber isipped into the mixed solution of nanoparticles and thenalyte. As a result of the capillary effect, the central hol-ow core is filled with the liquid for SERS detection. In ourecent study [23], a liquid core photonic crystal fiberLCPCF) probe was demonstrated to have a 100 timesensitivity enhancement, defined as the ratio between theERS signal obtained using the LCPCF and that obtainedy directly focusing the excitation beam into the sameixed solution. Although there were previous reports onsing hollow core fibers to enhance conventional Ramancattering [27–30], a systematic and quantitative analysisas not been given.In this paper, we experimentally demonstrate (in Sec-
ion 2) and theoretically analyze (in Section 3) two ap-roaches of using the HCPCF as SERS probes. The firstpproach fills the nanoparticles/analyte solution in all their channels of a HCPCF; and the second approach fillsnly the central core channel. Both the liquid-filledCPCF probe and the LCPCF are simulated using theIT MEEP code [31]. The simulation results explain the
xperimental findings, and provide guidelines for the de-ign of PCF SERS probes. Section 4 provides further dis-ussion, followed by conclusions drawn from our experi-ental and theoretical studies in Section 5. Although
reviously LCPCFs have been demonstrated to achieveigher sensitivities than that achievable with direct sam-ling, to our knowledge, this is the first time a concentra-ion as low as 10−10 M has been reported by using aCPCF SERS probe. In addition, we theoretically analyze
010 Optical Society of America
tbt
2ThTapsc
fsaaTn[
l[ctuamJmtpt�
vm1iata3
tRts1Nws
AFHdzHtesbeoH2RtlsS
2bmcplpHp12
icm
Fs
978 J. Opt. Soc. Am. A/Vol. 27, No. 5 /May 2010 Yang et al.
he reason behind the sensitivity enhancement to provideetter understanding and guidelines for future applica-ions.
. EXPERIMENTAL DEMONSTRATIONSwo approaches of using the HCPCF as SERS probesave been designed and experimentally demonstrated.he first approach is based on filling the nanoparticle/nalyte solution in all the air channels of a HCPCF. Suchrobes are called liquid-filled HCPCF SERS probes. Theecond approach is based on filling only the central corehannel, resulting in the LCPCF SERS probes.
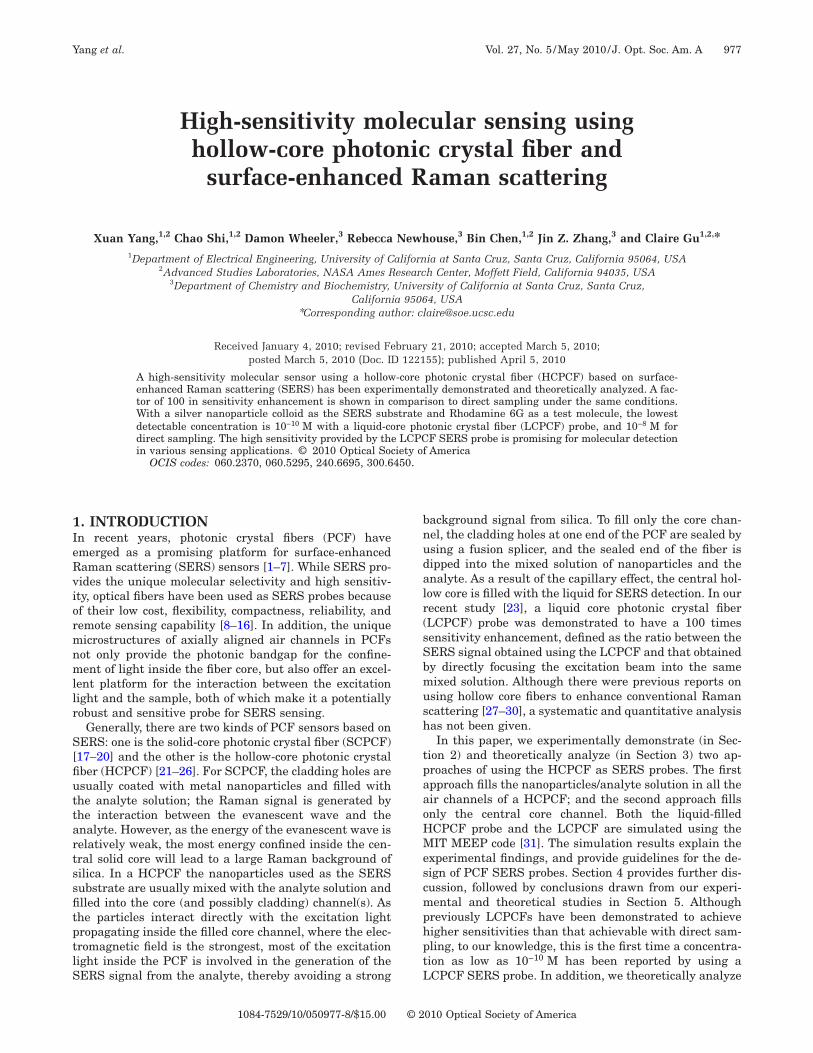
The HCPCF used in our experiments was purchasedrom Crystal fiber A/S (Model AIR-6-800) with its crossection shown in Fig. 1(a). The central core diameter isround 6 �m, the side length of cladding holes is 0.75 �m,nd the pitch distance between cladding holes is 1.6 �m.he fiber has a low transmission loss, indicating a photo-ic bandgap, in the wavelength range of 745 to 853 nmFig. 1(b)].
The silver nanoparticles (SNPs) used in the sample so-ution were synthesized using the Lee and Meisel protocol32]. Basically, silver nitrate was used as the metal pre-ursor and sodium citrate as the reducing agent. Forma-ion of the SNPs was monitored by UV-Vis spectroscopysing a HP 8452A spectrometer with 2 nm resolution. Theverage diameter of the SNPs is about 25 nm as deter-ined using a transmission electron microscope (Model
EOL JEM 1200EX). The nanoparticles made by thisethod in aqueous solution have a typical UV-Vis spec-
rum with the characteristic broad surface plasmon bandeaked around 405 nm. The concentration of SNPs usinghe Lee and Meisel method is estimated to be �3.7710−11 M.The sample solution in this study was prepared as pre-
iously reported [33] for various concentrations of R6Golecules �10−5 M–10−10 M�, and sodium chloride (NaCl,
0 mM) was added to induce aggregation of SNPs. Start-ng with aqueous R6G solution �10−4 M�, SNPs weredded to dilute the R6G solutions. 30 �L of the R6G solu-ion and 270 �L of the SNP colloid were mixed to gener-te 300 �L solutions of 10−5 M R6G molecules. Then,0 �L of the resulting solution was added to a 270 �L of
ig. 1. (Color online) (a) Cross sectional view of the Air-6-800 ppectrum of the HCPCF.
he SNP colloid again to obtain a sample solution with6G concentration of 10−6 M. Solutions of various concen-
rations from 10−7 M–10−10 M were prepared using aimilar method. The solutions were incubated for about0 min at room temperature and activated with 15 �LaCl solution for each sample. Raman measurementsere performed about 20 min after the introduction of
alt.
. Liquid-Filled HCPCF Probeor the liquid-filled HCPCF SERS probes, one end of theCPCF was cleaved carefully using a fiber cleaver to pro-uce a flat surface and the other end was cut using a ra-or blade, which does not affect the SERS performance ofCPCFs. For a fiber segment that is long enough to fit in
he fiber cleaver, both ends can be cleaved. The cleavednd of the HCPCF segment was dipped into the mixedample solution to allow the liquid to completely fill inoth the core and cladding channels due to the capillaryffect. Then the flat end was placed under the microscopef the Raman system. The total length of the liquid-filledCPCF segments used in our experiments varied frommm to 5 cm. The SERS signal was measured using aenishaw InVia Raman Microscope system and the exci-
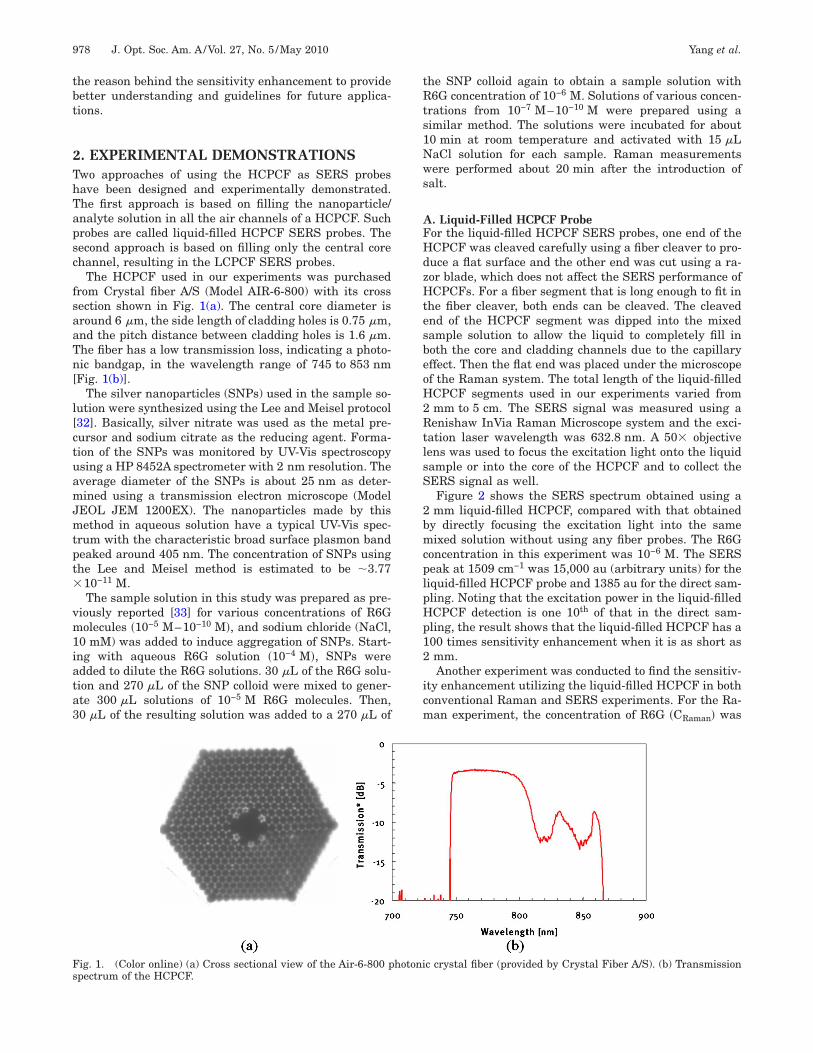
ation laser wavelength was 632.8 nm. A 50� objectiveens was used to focus the excitation light onto the liquidample or into the core of the HCPCF and to collect theERS signal as well.Figure 2 shows the SERS spectrum obtained using amm liquid-filled HCPCF, compared with that obtained
y directly focusing the excitation light into the sameixed solution without using any fiber probes. The R6G
oncentration in this experiment was 10−6 M. The SERSeak at 1509 cm−1 was 15,000 au (arbitrary units) for theiquid-filled HCPCF probe and 1385 au for the direct sam-ling. Noting that the excitation power in the liquid-filledCPCF detection is one 10th of that in the direct sam-ling, the result shows that the liquid-filled HCPCF has a00 times sensitivity enhancement when it is as short asmm.Another experiment was conducted to find the sensitiv-
ty enhancement utilizing the liquid-filled HCPCF in bothonventional Raman and SERS experiments. For the Ra-an experiment, the concentration of R6G �CRaman� was
c crystal fiber (provided by Crystal Fiber A/S). (b) Transmission
hotoni
4tibpHtpqt
f�tdftS
Hedqwwc3wpfia
reusa
et3Ss
Fc2
FeH
FlWH
Yang et al. Vol. 27, No. 5 /May 2010/J. Opt. Soc. Am. A 979
.18�10−2 M. For the SERS experiment, the concentra-ion of R6G �CSERS� was 10−6 M. Table 1 summarizes thentensity of the Raman peak at 1509 cm−1 measured inoth the conventional Raman �IRaman� and the SERS ex-eriments �ISERS�, with and without using the liquid-filledCPCF, respectively. The results indicate that the sensi-
ivity enhancement is 61 in the conventional Raman ex-eriment, and 97 in the SERS experiment. This will beuantitatively explained in more detail in the next sec-ion. Also, the enhancement factor (EF)
EF =ISERS/CSERS
IRaman/CRaman�1�
or the liquid-filled HCPCF is 6.88�104, while it is 4.33104 in direct sampling. This experiment demonstrates
hat the microstructures inside the liquid-filled HCPCFo not introduce any significant extra SERS enhancementactor, indicating similar electromagnetic field distribu-ion inside the liquid-filled HCPCF with and withoutNPs, except the difference in absorption coefficients.The sensitivity enhancement using liquid-filled
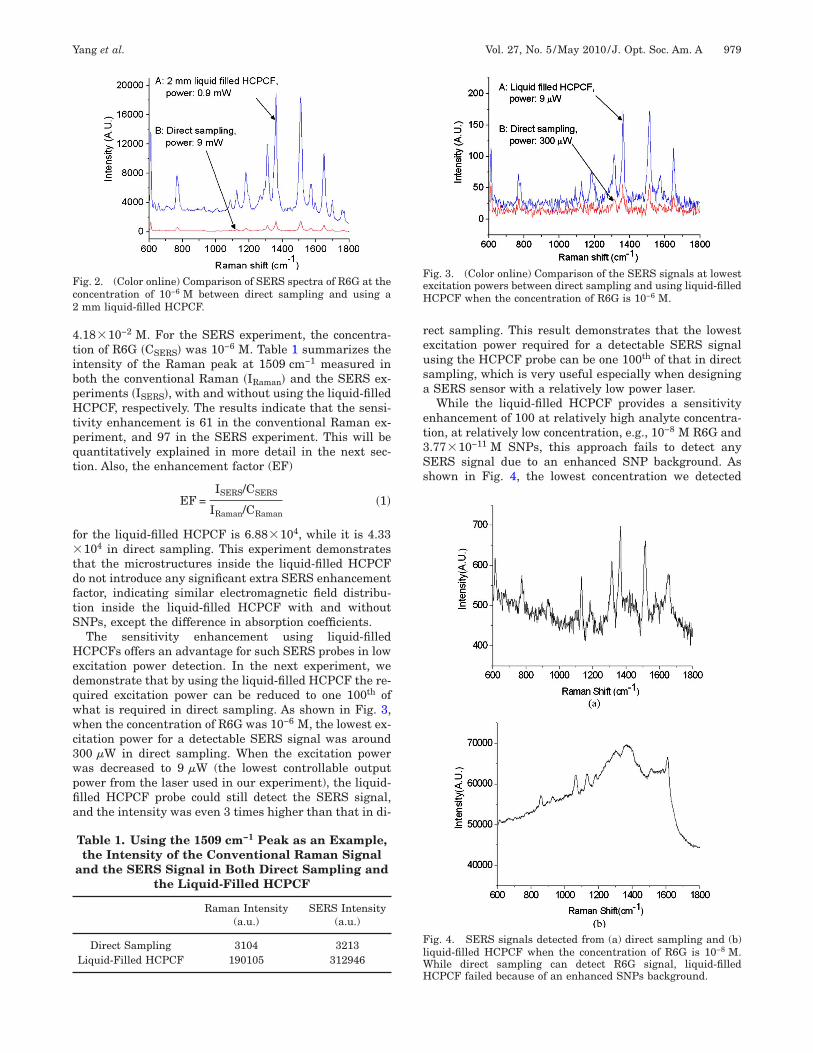
CPCFs offers an advantage for such SERS probes in lowxcitation power detection. In the next experiment, weemonstrate that by using the liquid-filled HCPCF the re-uired excitation power can be reduced to one 100th ofhat is required in direct sampling. As shown in Fig. 3,hen the concentration of R6G was 10−6 M, the lowest ex-
itation power for a detectable SERS signal was around00 �W in direct sampling. When the excitation poweras decreased to 9 �W (the lowest controllable outputower from the laser used in our experiment), the liquid-lled HCPCF probe could still detect the SERS signal,nd the intensity was even 3 times higher than that in di-
ig. 2. (Color online) Comparison of SERS spectra of R6G at theoncentration of 10−6 M between direct sampling and using amm liquid-filled HCPCF.
Table 1. Using the 1509 cm−1 Peak as an Example,the Intensity of the Conventional Raman Signal
and the SERS Signal in Both Direct Sampling andthe Liquid-Filled HCPCF
Raman Intensity(a.u.)
SERS Intensity(a.u.)
Direct Sampling 3104 3213Liquid-Filled HCPCF 190105 312946
ect sampling. This result demonstrates that the lowestxcitation power required for a detectable SERS signalsing the HCPCF probe can be one 100th of that in directampling, which is very useful especially when designingSERS sensor with a relatively low power laser.While the liquid-filled HCPCF provides a sensitivity
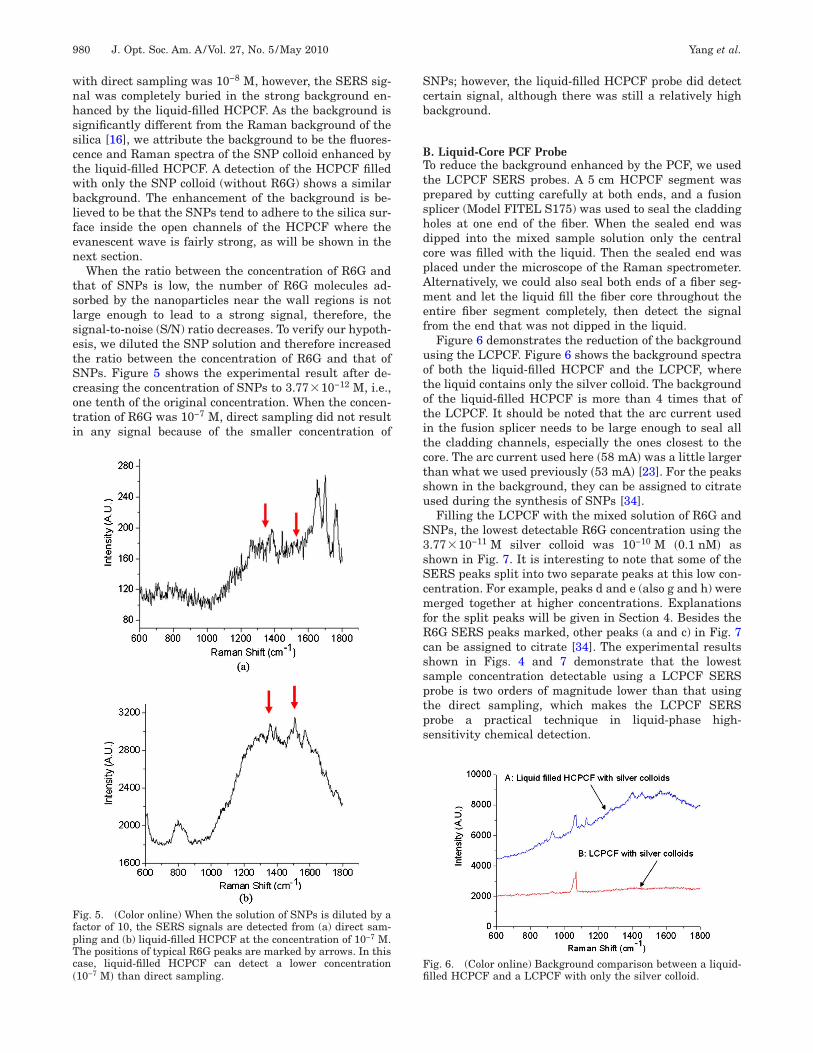
nhancement of 100 at relatively high analyte concentra-ion, at relatively low concentration, e.g., 10−8 M R6G and.77�10−11 M SNPs, this approach fails to detect anyERS signal due to an enhanced SNP background. Ashown in Fig. 4, the lowest concentration we detected
ig. 3. (Color online) Comparison of the SERS signals at lowestxcitation powers between direct sampling and using liquid-filledCPCF when the concentration of R6G is 10−6 M.
ig. 4. SERS signals detected from (a) direct sampling and (b)iquid-filled HCPCF when the concentration of R6G is 10−8 M.
hile direct sampling can detect R6G signal, liquid-filledCPCF failed because of an enhanced SNPs background.
wnhssctwblfen
tslsetScoti
Scb
BTtpshdcpAmef
uototitctsu
S3sScmfRcssptps
FfpTc�
Ffi
980 J. Opt. Soc. Am. A/Vol. 27, No. 5 /May 2010 Yang et al.
ith direct sampling was 10−8 M, however, the SERS sig-al was completely buried in the strong background en-anced by the liquid-filled HCPCF. As the background isignificantly different from the Raman background of theilica [16], we attribute the background to be the fluores-ence and Raman spectra of the SNP colloid enhanced byhe liquid-filled HCPCF. A detection of the HCPCF filledith only the SNP colloid (without R6G) shows a similarackground. The enhancement of the background is be-ieved to be that the SNPs tend to adhere to the silica sur-ace inside the open channels of the HCPCF where thevanescent wave is fairly strong, as will be shown in theext section.When the ratio between the concentration of R6G and
hat of SNPs is low, the number of R6G molecules ad-orbed by the nanoparticles near the wall regions is notarge enough to lead to a strong signal, therefore, theignal-to-noise (S/N) ratio decreases. To verify our hypoth-sis, we diluted the SNP solution and therefore increasedhe ratio between the concentration of R6G and that ofNPs. Figure 5 shows the experimental result after de-reasing the concentration of SNPs to 3.77�10−12 M, i.e.,ne tenth of the original concentration. When the concen-ration of R6G was 10−7 M, direct sampling did not resultn any signal because of the smaller concentration of
ig. 5. (Color online) When the solution of SNPs is diluted by aactor of 10, the SERS signals are detected from (a) direct sam-ling and (b) liquid-filled HCPCF at the concentration of 10−7 M.he positions of typical R6G peaks are marked by arrows. In thisase, liquid-filled HCPCF can detect a lower concentration10−7 M� than direct sampling.
NPs; however, the liquid-filled HCPCF probe did detectertain signal, although there was still a relatively highackground.
. Liquid-Core PCF Probeo reduce the background enhanced by the PCF, we usedhe LCPCF SERS probes. A 5 cm HCPCF segment wasrepared by cutting carefully at both ends, and a fusionplicer (Model FITEL S175) was used to seal the claddingoles at one end of the fiber. When the sealed end wasipped into the mixed sample solution only the centralore was filled with the liquid. Then the sealed end waslaced under the microscope of the Raman spectrometer.lternatively, we could also seal both ends of a fiber seg-ent and let the liquid fill the fiber core throughout the
ntire fiber segment completely, then detect the signalrom the end that was not dipped in the liquid.
Figure 6 demonstrates the reduction of the backgroundsing the LCPCF. Figure 6 shows the background spectraf both the liquid-filled HCPCF and the LCPCF, wherehe liquid contains only the silver colloid. The backgroundf the liquid-filled HCPCF is more than 4 times that ofhe LCPCF. It should be noted that the arc current usedn the fusion splicer needs to be large enough to seal allhe cladding channels, especially the ones closest to theore. The arc current used here �58 mA� was a little largerhan what we used previously �53 mA� [23]. For the peakshown in the background, they can be assigned to citratesed during the synthesis of SNPs [34].Filling the LCPCF with the mixed solution of R6G and
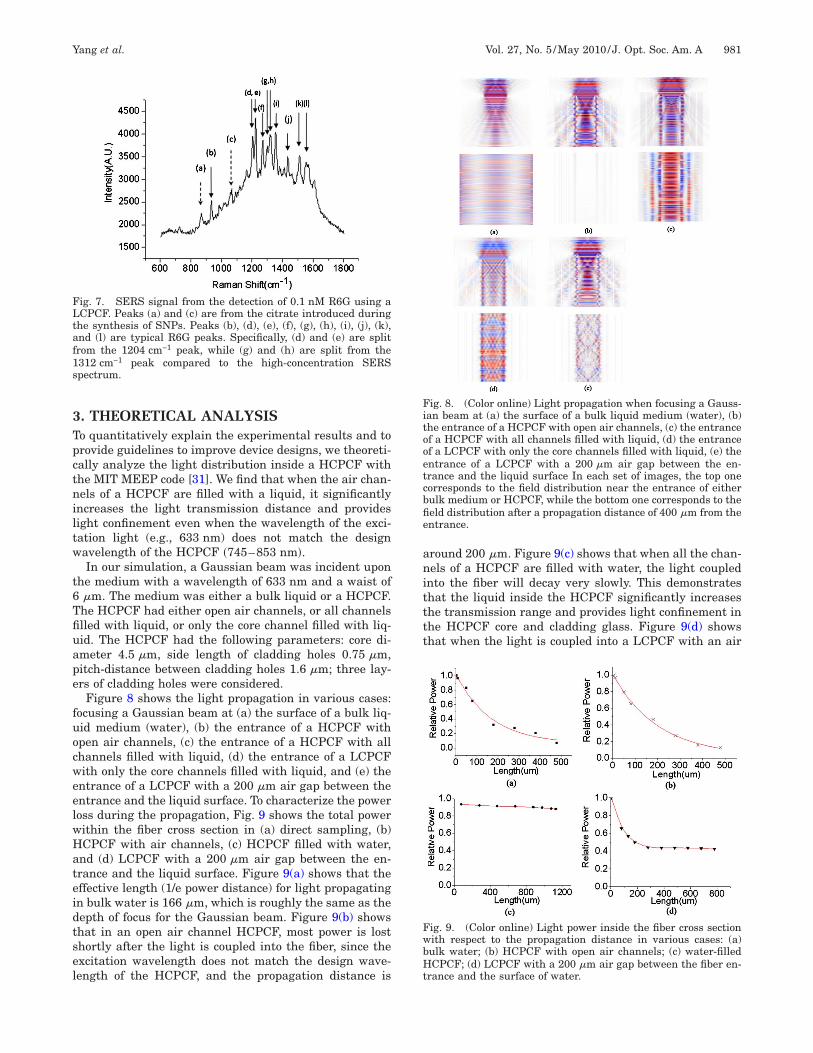
NPs, the lowest detectable R6G concentration using the.77�10−11 M silver colloid was 10−10 M �0.1 nM� ashown in Fig. 7. It is interesting to note that some of theERS peaks split into two separate peaks at this low con-entration. For example, peaks d and e (also g and h) wereerged together at higher concentrations. Explanations
or the split peaks will be given in Section 4. Besides the6G SERS peaks marked, other peaks (a and c) in Fig. 7
an be assigned to citrate [34]. The experimental resultshown in Figs. 4 and 7 demonstrate that the lowestample concentration detectable using a LCPCF SERSrobe is two orders of magnitude lower than that usinghe direct sampling, which makes the LCPCF SERSrobe a practical technique in liquid-phase high-ensitivity chemical detection.
ig. 6. (Color online) Background comparison between a liquid-lled HCPCF and a LCPCF with only the silver colloid.
3Tpctniltw
t6Tfiuape
fuocweelwHateidtsel
anitttt
Fitooetcbfie
FwbHt
FLtaf1s
Yang et al. Vol. 27, No. 5 /May 2010/J. Opt. Soc. Am. A 981
. THEORETICAL ANALYSISo quantitatively explain the experimental results and torovide guidelines to improve device designs, we theoreti-ally analyze the light distribution inside a HCPCF withhe MIT MEEP code [31]. We find that when the air chan-els of a HCPCF are filled with a liquid, it significantly
ncreases the light transmission distance and providesight confinement even when the wavelength of the exci-ation light (e.g., 633 nm) does not match the designavelength of the HCPCF �745–853 nm�.In our simulation, a Gaussian beam was incident upon
he medium with a wavelength of 633 nm and a waist of�m. The medium was either a bulk liquid or a HCPCF.he HCPCF had either open air channels, or all channelslled with liquid, or only the core channel filled with liq-id. The HCPCF had the following parameters: core di-meter 4.5 �m, side length of cladding holes 0.75 �m,itch-distance between cladding holes 1.6 �m; three lay-rs of cladding holes were considered.
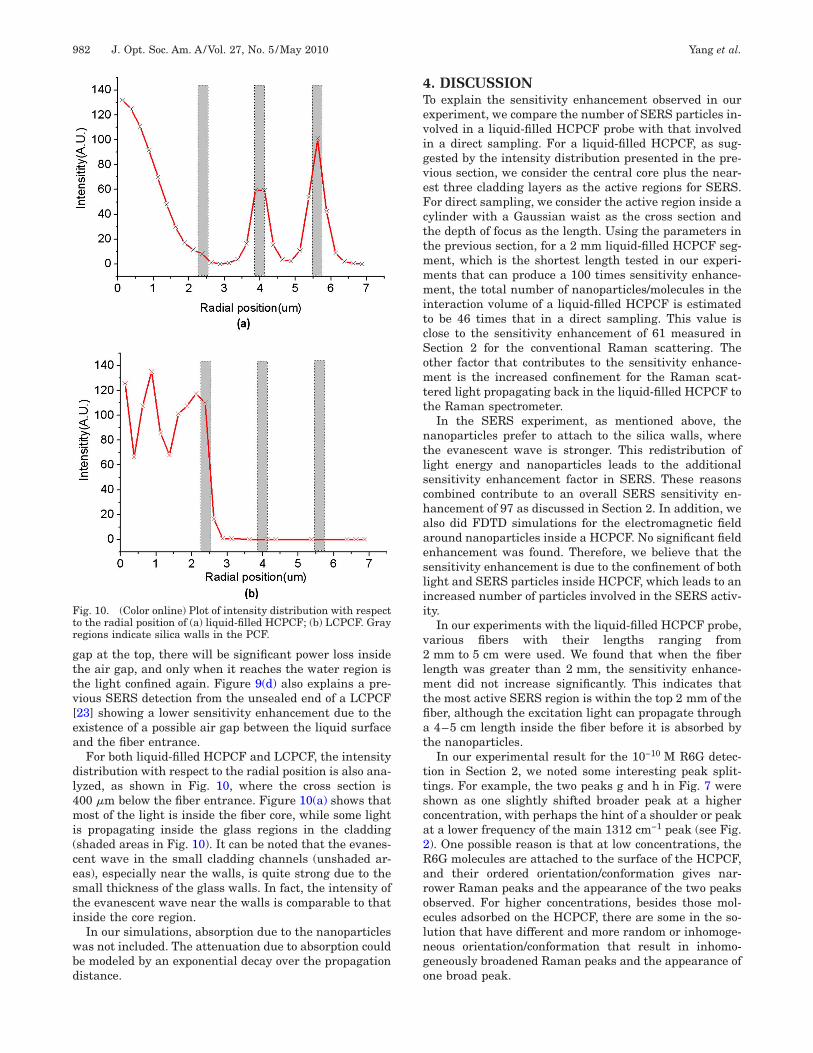
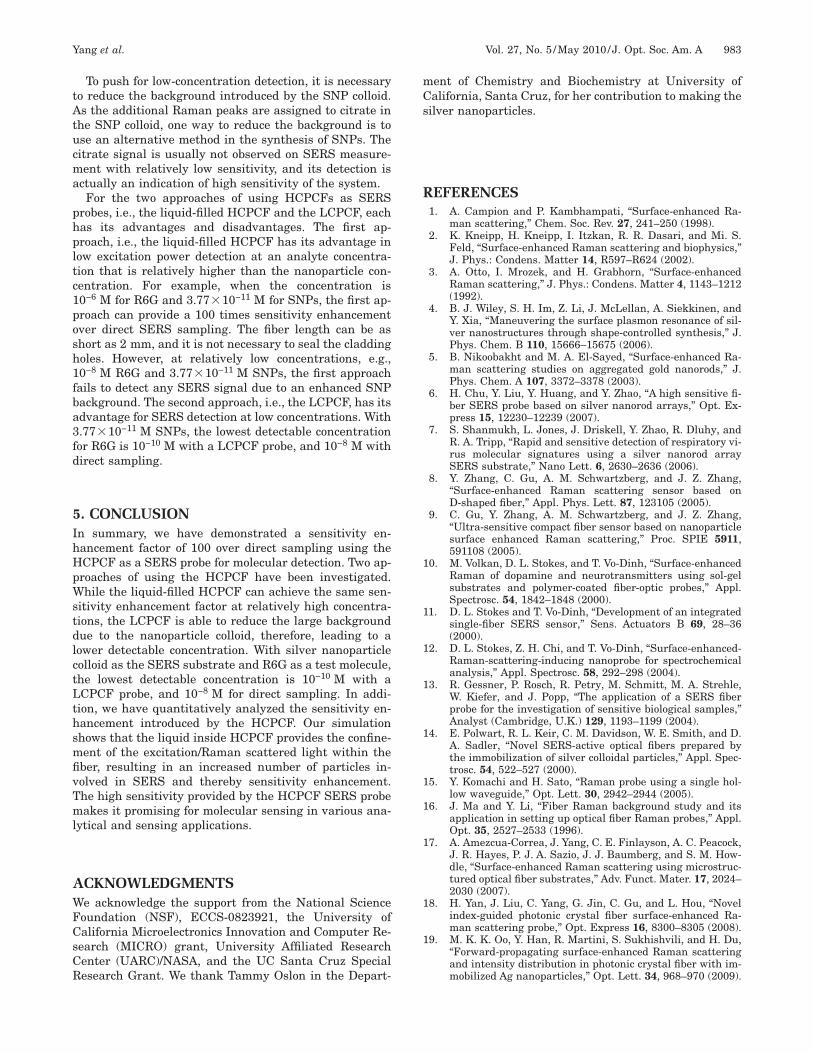
Figure 8 shows the light propagation in various cases:ocusing a Gaussian beam at (a) the surface of a bulk liq-id medium (water), (b) the entrance of a HCPCF withpen air channels, (c) the entrance of a HCPCF with allhannels filled with liquid, (d) the entrance of a LCPCFith only the core channels filled with liquid, and (e) thentrance of a LCPCF with a 200 �m air gap between thentrance and the liquid surface. To characterize the poweross during the propagation, Fig. 9 shows the total powerithin the fiber cross section in (a) direct sampling, (b)CPCF with air channels, (c) HCPCF filled with water,nd (d) LCPCF with a 200 �m air gap between the en-rance and the liquid surface. Figure 9(a) shows that theffective length (1/e power distance) for light propagatingn bulk water is 166 �m, which is roughly the same as theepth of focus for the Gaussian beam. Figure 9(b) showshat in an open air channel HCPCF, most power is losthortly after the light is coupled into the fiber, since thexcitation wavelength does not match the design wave-ength of the HCPCF, and the propagation distance is
ig. 7. SERS signal from the detection of 0.1 nM R6G using aCPCF. Peaks (a) and (c) are from the citrate introduced duringhe synthesis of SNPs. Peaks (b), (d), (e), (f), (g), (h), (i), (j), (k),nd (l) are typical R6G peaks. Specifically, (d) and (e) are splitrom the 1204 cm−1 peak, while (g) and (h) are split from the312 cm−1 peak compared to the high-concentration SERSpectrum.
round 200 �m. Figure 9(c) shows that when all the chan-els of a HCPCF are filled with water, the light coupled
nto the fiber will decay very slowly. This demonstrateshat the liquid inside the HCPCF significantly increaseshe transmission range and provides light confinement inhe HCPCF core and cladding glass. Figure 9(d) showshat when the light is coupled into a LCPCF with an air
ig. 8. (Color online) Light propagation when focusing a Gauss-an beam at (a) the surface of a bulk liquid medium (water), (b)he entrance of a HCPCF with open air channels, (c) the entrancef a HCPCF with all channels filled with liquid, (d) the entrancef a LCPCF with only the core channels filled with liquid, (e) thentrance of a LCPCF with a 200 �m air gap between the en-rance and the liquid surface In each set of images, the top oneorresponds to the field distribution near the entrance of eitherulk medium or HCPCF, while the bottom one corresponds to theeld distribution after a propagation distance of 400 �m from thentrance.
ig. 9. (Color online) Light power inside the fiber cross sectionith respect to the propagation distance in various cases: (a)ulk water; (b) HCPCF with open air channels; (c) water-filledCPCF; (d) LCPCF with a 200 �m air gap between the fiber en-
rance and the surface of water.
gttv[ea
dl4mi(cesti
wbd
4TevigveFcttmmmitcSomtt
ntlschaaeslii
v2lmtfiat
ttsca2Raroelngo
Ftr
982 J. Opt. Soc. Am. A/Vol. 27, No. 5 /May 2010 Yang et al.
ap at the top, there will be significant power loss insidehe air gap, and only when it reaches the water region ishe light confined again. Figure 9(d) also explains a pre-ious SERS detection from the unsealed end of a LCPCF23] showing a lower sensitivity enhancement due to thexistence of a possible air gap between the liquid surfacend the fiber entrance.For both liquid-filled HCPCF and LCPCF, the intensity
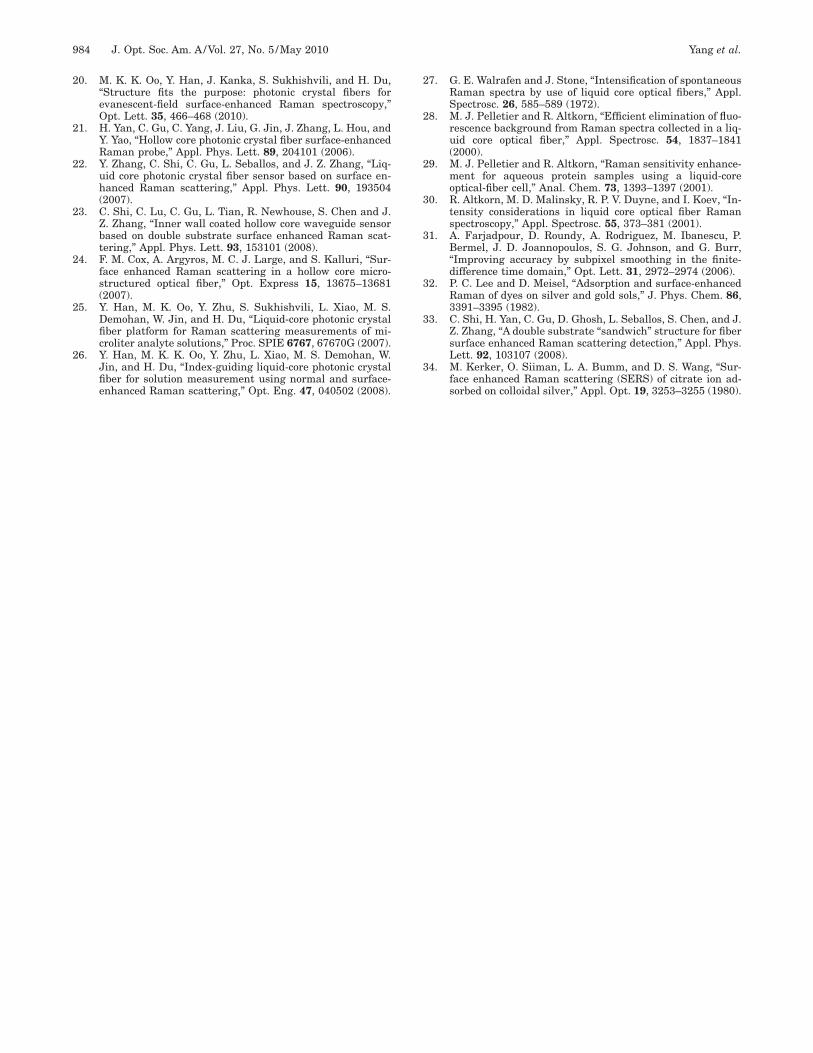
istribution with respect to the radial position is also ana-yzed, as shown in Fig. 10, where the cross section is00 �m below the fiber entrance. Figure 10(a) shows thatost of the light is inside the fiber core, while some light
s propagating inside the glass regions in the claddingshaded areas in Fig. 10). It can be noted that the evanes-ent wave in the small cladding channels (unshaded ar-as), especially near the walls, is quite strong due to themall thickness of the glass walls. In fact, the intensity ofhe evanescent wave near the walls is comparable to thatnside the core region.
In our simulations, absorption due to the nanoparticlesas not included. The attenuation due to absorption coulde modeled by an exponential decay over the propagationistance.
ig. 10. (Color online) Plot of intensity distribution with respecto the radial position of (a) liquid-filled HCPCF; (b) LCPCF. Grayegions indicate silica walls in the PCF.
. DISCUSSIONo explain the sensitivity enhancement observed in ourxperiment, we compare the number of SERS particles in-olved in a liquid-filled HCPCF probe with that involvedn a direct sampling. For a liquid-filled HCPCF, as sug-ested by the intensity distribution presented in the pre-ious section, we consider the central core plus the near-st three cladding layers as the active regions for SERS.or direct sampling, we consider the active region inside aylinder with a Gaussian waist as the cross section andhe depth of focus as the length. Using the parameters inhe previous section, for a 2 mm liquid-filled HCPCF seg-ent, which is the shortest length tested in our experi-ents that can produce a 100 times sensitivity enhance-ent, the total number of nanoparticles/molecules in the
nteraction volume of a liquid-filled HCPCF is estimatedo be 46 times that in a direct sampling. This value islose to the sensitivity enhancement of 61 measured inection 2 for the conventional Raman scattering. Thether factor that contributes to the sensitivity enhance-ent is the increased confinement for the Raman scat-
ered light propagating back in the liquid-filled HCPCF tohe Raman spectrometer.
In the SERS experiment, as mentioned above, theanoparticles prefer to attach to the silica walls, wherehe evanescent wave is stronger. This redistribution ofight energy and nanoparticles leads to the additionalensitivity enhancement factor in SERS. These reasonsombined contribute to an overall SERS sensitivity en-ancement of 97 as discussed in Section 2. In addition, welso did FDTD simulations for the electromagnetic fieldround nanoparticles inside a HCPCF. No significant fieldnhancement was found. Therefore, we believe that theensitivity enhancement is due to the confinement of bothight and SERS particles inside HCPCF, which leads to anncreased number of particles involved in the SERS activ-ty.
In our experiments with the liquid-filled HCPCF probe,arious fibers with their lengths ranging frommm to 5 cm were used. We found that when the fiber
ength was greater than 2 mm, the sensitivity enhance-ent did not increase significantly. This indicates that
he most active SERS region is within the top 2 mm of theber, although the excitation light can propagate through4–5 cm length inside the fiber before it is absorbed by
he nanoparticles.In our experimental result for the 10−10 M R6G detec-
ion in Section 2, we noted some interesting peak split-ings. For example, the two peaks g and h in Fig. 7 werehown as one slightly shifted broader peak at a higheroncentration, with perhaps the hint of a shoulder or peakt a lower frequency of the main 1312 cm−1 peak (see Fig.). One possible reason is that at low concentrations, the6G molecules are attached to the surface of the HCPCF,nd their ordered orientation/conformation gives nar-ower Raman peaks and the appearance of the two peaksbserved. For higher concentrations, besides those mol-cules adsorbed on the HCPCF, there are some in the so-ution that have different and more random or inhomoge-eous orientation/conformation that result in inhomo-eneously broadened Raman peaks and the appearance ofne broad peak.
tAtucma
phpltc1posh1fba3fd
5IhHpWstdlctLthsmfivTml
AWFCsCR
mCs
R
1
1
1
1
1
1
1
1
1
1
Yang et al. Vol. 27, No. 5 /May 2010/J. Opt. Soc. Am. A 983
To push for low-concentration detection, it is necessaryo reduce the background introduced by the SNP colloid.s the additional Raman peaks are assigned to citrate in
he SNP colloid, one way to reduce the background is tose an alternative method in the synthesis of SNPs. Theitrate signal is usually not observed on SERS measure-ent with relatively low sensitivity, and its detection is
ctually an indication of high sensitivity of the system.For the two approaches of using HCPCFs as SERS
robes, i.e., the liquid-filled HCPCF and the LCPCF, eachas its advantages and disadvantages. The first ap-roach, i.e., the liquid-filled HCPCF has its advantage inow excitation power detection at an analyte concentra-ion that is relatively higher than the nanoparticle con-entration. For example, when the concentration is0−6 M for R6G and 3.77�10−11 M for SNPs, the first ap-roach can provide a 100 times sensitivity enhancementver direct SERS sampling. The fiber length can be ashort as 2 mm, and it is not necessary to seal the claddingoles. However, at relatively low concentrations, e.g.,0−8 M R6G and 3.77�10−11 M SNPs, the first approachails to detect any SERS signal due to an enhanced SNPackground. The second approach, i.e., the LCPCF, has itsdvantage for SERS detection at low concentrations. With.77�10−11 M SNPs, the lowest detectable concentrationor R6G is 10−10 M with a LCPCF probe, and 10−8 M withirect sampling.
. CONCLUSIONn summary, we have demonstrated a sensitivity en-ancement factor of 100 over direct sampling using theCPCF as a SERS probe for molecular detection. Two ap-roaches of using the HCPCF have been investigated.hile the liquid-filled HCPCF can achieve the same sen-
itivity enhancement factor at relatively high concentra-ions, the LCPCF is able to reduce the large backgroundue to the nanoparticle colloid, therefore, leading to aower detectable concentration. With silver nanoparticleolloid as the SERS substrate and R6G as a test molecule,he lowest detectable concentration is 10−10 M with aCPCF probe, and 10−8 M for direct sampling. In addi-ion, we have quantitatively analyzed the sensitivity en-ancement introduced by the HCPCF. Our simulationhows that the liquid inside HCPCF provides the confine-ent of the excitation/Raman scattered light within the
ber, resulting in an increased number of particles in-olved in SERS and thereby sensitivity enhancement.he high sensitivity provided by the HCPCF SERS probeakes it promising for molecular sensing in various ana-
ytical and sensing applications.
CKNOWLEDGMENTSe acknowledge the support from the National Scienceoundation (NSF), ECCS-0823921, the University ofalifornia Microelectronics Innovation and Computer Re-earch (MICRO) grant, University Affiliated Researchenter (UARC)/NASA, and the UC Santa Cruz Specialesearch Grant. We thank Tammy Oslon in the Depart-
ent of Chemistry and Biochemistry at University ofalifornia, Santa Cruz, for her contribution to making theilver nanoparticles.
EFERENCES1. A. Campion and P. Kambhampati, “Surface-enhanced Ra-
man scattering,” Chem. Soc. Rev. 27, 241–250 (1998).2. K. Kneipp, H. Kneipp, I. Itzkan, R. R. Dasari, and Mi. S.
3. A. Otto, I. Mrozek, and H. Grabhorn, “Surface-enhancedRaman scattering,” J. Phys.: Condens. Matter 4, 1143–1212(1992).
4. B. J. Wiley, S. H. Im, Z. Li, J. McLellan, A. Siekkinen, andY. Xia, “Maneuvering the surface plasmon resonance of sil-ver nanostructures through shape-controlled synthesis,” J.Phys. Chem. B 110, 15666–15675 (2006).
5. B. Nikoobakht and M. A. El-Sayed, “Surface-enhanced Ra-man scattering studies on aggregated gold nanorods,” J.Phys. Chem. A 107, 3372–3378 (2003).
6. H. Chu, Y. Liu, Y. Huang, and Y. Zhao, “A high sensitive fi-ber SERS probe based on silver nanorod arrays,” Opt. Ex-press 15, 12230–12239 (2007).
7. S. Shanmukh, L. Jones, J. Driskell, Y. Zhao, R. Dluhy, andR. A. Tripp, “Rapid and sensitive detection of respiratory vi-rus molecular signatures using a silver nanorod arraySERS substrate,” Nano Lett. 6, 2630–2636 (2006).
8. Y. Zhang, C. Gu, A. M. Schwartzberg, and J. Z. Zhang,“Surface-enhanced Raman scattering sensor based onD-shaped fiber,” Appl. Phys. Lett. 87, 123105 (2005).
9. C. Gu, Y. Zhang, A. M. Schwartzberg, and J. Z. Zhang,“Ultra-sensitive compact fiber sensor based on nanoparticlesurface enhanced Raman scattering,” Proc. SPIE 5911,591108 (2005).
0. M. Volkan, D. L. Stokes, and T. Vo-Dinh, “Surface-enhancedRaman of dopamine and neurotransmitters using sol-gelsubstrates and polymer-coated fiber-optic probes,” Appl.Spectrosc. 54, 1842–1848 (2000).
1. D. L. Stokes and T. Vo-Dinh, “Development of an integratedsingle-fiber SERS sensor,” Sens. Actuators B 69, 28–36(2000).
2. D. L. Stokes, Z. H. Chi, and T. Vo-Dinh, “Surface-enhanced-Raman-scattering-inducing nanoprobe for spectrochemicalanalysis,” Appl. Spectrosc. 58, 292–298 (2004).
3. R. Gessner, P. Rosch, R. Petry, M. Schmitt, M. A. Strehle,W. Kiefer, and J. Popp, “The application of a SERS fiberprobe for the investigation of sensitive biological samples,”Analyst (Cambridge, U.K.) 129, 1193–1199 (2004).
4. E. Polwart, R. L. Keir, C. M. Davidson, W. E. Smith, and D.A. Sadler, “Novel SERS-active optical fibers prepared bythe immobilization of silver colloidal particles,” Appl. Spec-trosc. 54, 522–527 (2000).
5. Y. Komachi and H. Sato, “Raman probe using a single hol-low waveguide,” Opt. Lett. 30, 2942–2944 (2005).
6. J. Ma and Y. Li, “Fiber Raman background study and itsapplication in setting up optical fiber Raman probes,” Appl.Opt. 35, 2527–2533 (1996).
7. A. Amezcua-Correa, J. Yang, C. E. Finlayson, A. C. Peacock,J. R. Hayes, P. J. A. Sazio, J. J. Baumberg, and S. M. How-dle, “Surface-enhanced Raman scattering using microstruc-tured optical fiber substrates,” Adv. Funct. Mater. 17, 2024–2030 (2007).
8. H. Yan, J. Liu, C. Yang, G. Jin, C. Gu, and L. Hou, “Novelindex-guided photonic crystal fiber surface-enhanced Ra-man scattering probe,” Opt. Express 16, 8300–8305 (2008).
9. M. K. K. Oo, Y. Han, R. Martini, S. Sukhishvili, and H. Du,“Forward-propagating surface-enhanced Raman scatteringand intensity distribution in photonic crystal fiber with im-mobilized Ag nanoparticles,” Opt. Lett. 34, 968–970 (2009).
2
2
2
2
2
2
2
2
2
2
3
3
3
3
3
984 J. Opt. Soc. Am. A/Vol. 27, No. 5 /May 2010 Yang et al.
0. M. K. K. Oo, Y. Han, J. Kanka, S. Sukhishvili, and H. Du,“Structure fits the purpose: photonic crystal fibers forevanescent-field surface-enhanced Raman spectroscopy,”Opt. Lett. 35, 466–468 (2010).
1. H. Yan, C. Gu, C. Yang, J. Liu, G. Jin, J. Zhang, L. Hou, andY. Yao, “Hollow core photonic crystal fiber surface-enhancedRaman probe,” Appl. Phys. Lett. 89, 204101 (2006).
2. Y. Zhang, C. Shi, C. Gu, L. Seballos, and J. Z. Zhang, “Liq-uid core photonic crystal fiber sensor based on surface en-hanced Raman scattering,” Appl. Phys. Lett. 90, 193504(2007).
3. C. Shi, C. Lu, C. Gu, L. Tian, R. Newhouse, S. Chen and J.Z. Zhang, “Inner wall coated hollow core waveguide sensorbased on double substrate surface enhanced Raman scat-tering,” Appl. Phys. Lett. 93, 153101 (2008).
4. F. M. Cox, A. Argyros, M. C. J. Large, and S. Kalluri, “Sur-face enhanced Raman scattering in a hollow core micro-structured optical fiber,” Opt. Express 15, 13675–13681(2007).
5. Y. Han, M. K. Oo, Y. Zhu, S. Sukhishvili, L. Xiao, M. S.Demohan, W. Jin, and H. Du, “Liquid-core photonic crystalfiber platform for Raman scattering measurements of mi-croliter analyte solutions,” Proc. SPIE 6767, 67670G (2007).
6. Y. Han, M. K. K. Oo, Y. Zhu, L. Xiao, M. S. Demohan, W.Jin, and H. Du, “Index-guiding liquid-core photonic crystalfiber for solution measurement using normal and surface-enhanced Raman scattering,” Opt. Eng. 47, 040502 (2008).
7. G. E. Walrafen and J. Stone, “Intensification of spontaneousRaman spectra by use of liquid core optical fibers,” Appl.Spectrosc. 26, 585–589 (1972).
8. M. J. Pelletier and R. Altkorn, “Efficient elimination of fluo-rescence background from Raman spectra collected in a liq-uid core optical fiber,” Appl. Spectrosc. 54, 1837–1841(2000).
9. M. J. Pelletier and R. Altkorn, “Raman sensitivity enhance-ment for aqueous protein samples using a liquid-coreoptical-fiber cell,” Anal. Chem. 73, 1393–1397 (2001).
0. R. Altkorn, M. D. Malinsky, R. P. V. Duyne, and I. Koev, “In-tensity considerations in liquid core optical fiber Ramanspectroscopy,” Appl. Spectrosc. 55, 373–381 (2001).
1. A. Farjadpour, D. Roundy, A. Rodriguez, M. Ibanescu, P.Bermel, J. D. Joannopoulos, S. G. Johnson, and G. Burr,“Improving accuracy by subpixel smoothing in the finite-difference time domain,” Opt. Lett. 31, 2972–2974 (2006).
2. P. C. Lee and D. Meisel, “Adsorption and surface-enhancedRaman of dyes on silver and gold sols,” J. Phys. Chem. 86,3391–3395 (1982).
3. C. Shi, H. Yan, C. Gu, D. Ghosh, L. Seballos, S. Chen, and J.Z. Zhang, “A double substrate “sandwich” structure for fibersurface enhanced Raman scattering detection,” Appl. Phys.Lett. 92, 103107 (2008).
4. M. Kerker, O. Siiman, L. A. Bumm, and D. S. Wang, “Sur-face enhanced Raman scattering (SERS) of citrate ion ad-sorbed on colloidal silver,” Appl. Opt. 19, 3253–3255 (1980).