23
High Speed Rail Brotherhood of Locomotive Engineers and Trainmen

High Speed RailBrotherhood of Locomotive Engineers and Trainmen
John Tolman,Vice President & National Legislative Representative
National Association of State Legislative Board Chairmen
Timothy L. Smith,Chairman
William Verdeyen,1st Vice Chairman
Ken Kertesz,Secretary Treasurer
Terry Todd,2nd Vice Chairman
Tim Hanely,Region 1 Chairman
David Lavery,Region 2 Chairman
C. Edward Way,Region 3 Chairman
Mike Muscha,Region 4 Chairman

The photographs in this paper are for illustrative purposes only. The photograph on page 1 was provided by the BLET Public Relations Department. All other photos in this paper were provided courtesy of Greg Godfrey. Their use was to demonstrate the possibility of high speed rail in this country, and while the speeds these trains achieve will not be matched in the U.S. for years to come, we believe they provide a valuable example of the possibilities for high speed rail.
IntroductionThe Brotherhood of Locomotive Engineers and Train-men (BLET) represents 39,000 active locomotive engineers and trainmen on Class I, Class II, Class III, Passenger and Commuter railroads around the coun-try. The BLET, formerly the Brotherhood of Loco-motive Engineers, was founded in 1863 in Marshall, Michigan, and has been representing the interests of railroad workers for 146 years. On December 5, 2003, BLE members overwhelmingly voted to ratify a merger with the Teamsters. The merger took effect on January 1, 2004, creating the IBT Rail Conference and formally changing the name of BLE to BLET. The BLET is the founding member of the IBT Rail Conference.
Since the founding of our organization, we have been at the forefront of technological adaptation of the railroad industry and hope to continue to be so as the industry moves towards high speed rail in this nation.
Transportation As We Know ItThe Interstate Highway System was authorized by the Federal-Aid Highway Act of 1956. It had been lob-bied for by major U.S. automobile manufacturers and championed by President Dwight D. Eisenhower. Since then, we have spent billions building and maintaining one of the best highway systems in the world. The In-terstate Highway system cost $114 billion and took 35 years to complete. In today’s dollars, the system would cost $426 billion.
However, times have changed. In 1955, there were 65 million vehicles on U.S. highways. Today, there are over 246 million. It is projected that by the year 2055, there will be at least 400 million vehicles on our high-
way system. Congestion on our nation’s roadways is in a terrible state and will only get worse as our popula-tion grows. It is projected that by the year 2020, 90% of urban interstates will either be at or over capacity. Between 1995 and 2001, commute times over the same distance on U.S. highways increased 10%.
The Texas Transportation Institute says that $63 billion was wasted due to traffic congestion because of time lost and fuel used in 2005. Passenger miles on highways also increased 18.1% between 1997 and 2004.
Anyone who has flown recently knows the prob-lems in our nation’s airports – flight delays and cancel-lations, lost luggage, overcrowded planes. Only 82% of commercial flights were on time in February 2009 and most of these delays occurred because of overcrowded airspace along the East Coast.
The Case for High Speed RailThe impact on the environment could be lessened by switching from the current transportation strategy to one which will allow us to rely upon the benefits of mass transportation and inter-modal freight move-ment through High Speed Rail corridors. This system would be clean, affordable, and reliable. It would offer many benefits which would allow the U.S. to become less dependent on foreign oil. According to the Trans-
In 1955, there were 65 million vehicles on U.S. highways. Today there are over 246 million. It is projected that by the year 2055, there will be at least 400 million vehicles on our highway system.
High Speed Rail
1 Brotherhood of Locomotive Engineers and Trainmen

portation Energy Data Book, published by the Oak Ridge National Laboratory, in 2005, domestic airlines on average consumed 20.5% more energy per passen-ger-mile than Amtrak, while cars consumed 27.2% more than Amtrak. Looking at the other way around, Amtrak consumes 17.0% and 21.4% less energy per passenger-mile than airlines and cars, respectively. [One passenger-mile is one passenger traveling one mile.] Increasing the speed of trains increases their energy efficiency even further.
The solution to our transportation problems is not to build more roads or fly more planes. In essence, there is no reason why this country could not use the examples of the past in which our nation’s highway in-frastructure (which has a minimum speed of 45 mph) and airline structures were developed through the use of federal and state funds and apply them to our future -- creating a high speed rail system which will accom-modate passenger train operations up to 125 mph and inter-modal freight train movements at speeds greater than 70 mph.
As a transportation medium, rail networks date back to 1827. Many of those original lines are still in use today, nearly 200 years later. When considering the total cost of maintaining a rail network versus the inter-state freeway system, rail costs pennies on the dollar. Any investment into a passenger rail network could pay dividends for centuries to come.
History has shown, if you build passenger rail or increase passenger service in an area, ridership will also increase. In the 38 years since Amtrak was created in 1971, ridership has increased from 6,450,304 at its formation to the record level of 28.7 million passengers in fiscal year 2008. Fiscal year 2008 represented its sixth straight year of record ridership. When Amtrak added two state-financed round-trips between St. Louis and Chicago and one apiece between from Quincy and Carbondale to the Windy City, ridership spiked by 189,823 for the first two-thirds of the next Fiscal Year (2007), bringing the total passenger count in the state to 670,605. The same pattern held true in California. Just months after eight trains were added to the state-subsidized Amtrak service between Sacramento and the Bay Area, ridership on the 170-mile service now with 32 trains, was nearly 1.3 million in 2005, nearly triple the 460,000 passengers who rode those rails eight years previous.
Current ProjectsThe funding in both the stimulus and the FY09 omni-bus bill has enabled municipalities, states and multi-state compacts to apply for funding for commuter and high speed rail projects.
Among the projects in the development stages are the California high speed rail projects which will run north and south through the state. Voters in the state voted for a $9 billion bond measure in November 2008 to develop the corridor. Also under consideration is a high speed rail line from Las Vegas to Los Angeles.
Another corridor that is receiving state funding is the 3 C (Cleveland, Columbus and Cincinnati) cor-ridor in Ohio which received funds in the most recent Ohio Department of Transportation budget.
Amtrak consumes 17.0% and 21.4% less energy per passenger-mile than airlines and cars, respectively.
High Speed Rail
Brotherhood of Locomotive Engineers and Trainmen 2

The State of Florida hopes to use stimulus funds to develop a high speed line between Walt Disney World and Orlando International Airport.
Many other states hope to use funding to create or improve commuter rail lines, including New Jersey, Minnesota and Illinois.
There are 11 federally designated high speed rail corridors:
• theNortheastCorridor(BostontoWashington,D.C.);
• theCaliforniaCorridor(BayArea–LosAngeles–SanDiego);
• theEmpireCorridor(NYCtoBuffalo);
• thePacificNorthwestCorridor(Vancouver,B.C.toEugene,OR);
• theSouthCentralCorridor(SanAntonio,Austin,Dallas,LittleRock,OklahomaCity,Tulsa);
• theGulfCoastCorridor(Houston,NewOrleans,Mobile,Meridian,Birmingham);
• theChicagoHubNetwork(Chicago,TwinCities,St.Louis,KansasCity,Detroit,Cleveland,Columbus,Cincinnati,Louisville,Indianapolis);
• theFloridaCorridor(Orlando,Tampa,Miami);
• theKeystoneCorridor(Philadelphia,Harrisburg,Pittsburgh);
• theNorthernNewEnglandCorridor(Portland,Boston,Montreal);
• theSoutheastCorridor(Washington,Richmond,Raleigh,Charlotte,Atlanta,Columbia,Macon,Savannah,Birmingham,Jacksonville).
High Speed Rail
3 Brotherhood of Locomotive Engineers and Trainmen

The Obama AdministrationThe Obama Administration has expressed its support for passenger, commuter and high speed rail in the months since the inauguration. Passenger rail finally has a friend in the White House. On the eve of the inauguration, President Obama, Vice President Biden and their families rode a passenger train, run by BLET members, from Philadelphia to Washington, D.C. The administration has declared high speed rail as one of its priorities.
On April 16, 2009, President Obama, Vice Presi-dent Biden and Secretary of Transportation Ray LaHood, held a press conference to announce the administration’s proposal for high speed rail develop-ment in the United States. During the press conference, all three touted the benefits of high speed rail to our nation’s economic future, and noted that the $8 billion contained in the stimulus package was just a “down payment” on a high speed rail system for the U.S.
The President’s proposal identified several pieces of legislation as good first steps towards the development of high speed rail, including:
• TheFY2008AppropriationAct,whichestablishedanewIPRStateGrantProgram.
• TheRailSafetyImprovementActof2008(RSIA).
• ThePassengerRailInvestmentandImprovementActof2008(PRIIA).
• TheAmericanRecoveryandReinvestmentActof2009(ARRA).
The Administration identified a near-term invest-ment strategy which seeks to:
• Advancenewexpresshigh-speedcorridorservices(operatingspeedsabove150mphonprimarilydedi-catedtrack)inselectcorridorsof200–600miles.
• Developemergingandregionalhigh-speedcorridorservices(operatingspeedsupto90–110mphand110–150mphrespectively,onsharedanddedicatedtrack)incorridorsof100–500miles.
• Upgradereliabilityandserviceonconventionalinter-cityrailservices(operatingspeedsupto79–90mph).
The administration proposed three funding tracks:
• Projects. Provide grants to complete individual projects that are “ready to go” with preliminary engineering and environmental work completed.
• Corridorprograms. Enter into cooperative agree-ments to develop entire phases or geographic sections of corridor programs that have completed corridor plans and environmental documentation, and have a prioritized list of projects to meet the corridor objectives; this approach would involve additional Federal oversight and support.
• Planning. Enter into cooperative agreements for planning activities using non-ARRA appropria-tions funds, in order to create the corridor pro-gram and project pipeline needed to fully develop a high-speed rail network.
The April 16 press conference was just one example of the Administration’s public support for high speed rail. In announcing that Amtrak will receive $1.3 billion in grant funding from the recently enacted American Recovery and Reinvestment Act (ARRA) to expand pas-senger rail capacity, Vice President Biden reiterated the administration’s commitment to passenger rail. ARRA funding roughly doubles the size of Amtrak’s capital
The Administration identified a near-term investment strategy which seeks to:
• Advance new express high-speed corridor services (operating speeds above 150 mph on primar-ily dedicated track) in select corri-dors of 200–600 miles.
• Develop emerging and regional high-speed corridor services (operating speeds up to 90–110 mph and 110–150 mph respectively, on shared and dedicated track) in corridors of 100–500 miles.
• Upgrade reliability and service on conventional intercity rail services (operating speeds up to 79–90 mph).
High Speed Rail
Brotherhood of Locomotive Engineers and Trainmen 4

investment program over a two-year period. It will be used to upgrade railroad assets and infrastructure and for capital projects that expand passenger rail capacity.
“Over 28 million passengers ride Amtrak each year. That’s about 500,000 passengers a week – or 80,000 a day,” said Vice President Biden. “For too long, we haven’t made the investments we needed to make Amtrak as safe, as reliable, as secure as it can be. That ends now. The funds in the Recovery Act for Amtrak will help create jobs and at the same time, repair and update critical needs of our nation’s infrastructure.”
“This is the Obama Administration keeping its promise to America,” said Secretary LaHood. “We are investing in jobs that will allow Amtrak to add and modernize cars and engines and upgrade its tracks. We are getting transportation money to Americans quickly in order to get the American economy going again.”
The U.S. Congress has noted the administration’s priority and responded with record funding for high speed and passenger rail recently. High speed and passenger rail received $8 billion from the stimulus bill and an additional $5 billion in the fiscal year 2009 omnibus budget. The President noted that this funding was just the beginning.
BLET Position on High Speed RailThe BLET believes the implementation of a nation-wide high speed rail plan could greatly benefit both our membership and the country as a whole with a few adjustments to the current strategies.
Definition ChangeThe current definition of high speed rail relates to 125 mph and above passenger train operations. In the nearly forty years since the establishment of this definition, only one rail corridor (Acela-Northeast Corridor) has been built to that standard.
The BLET wants to change this definition so that high speed rail can include intermodal freight operations. The BLET believes that if we could include intermodal freight within the definition of high speed rail, we could build a system that would
The BLET believes that if we could include intermodal freight within the definition of high speed rail, we could build a system that would operate at speeds between 70 and 125 mph.
High Speed Rail
5 Brotherhood of Locomotive Engineers and Trainmen

operate at speeds between 70 and 125 mph. This system could raise the average intermodal speed, allow more frequent passenger train operations and gain the support of the freight railroads as it would benefit their operations. A high speed rail system which has restricted access grade crossing separation (which is how all interstate highways and the Northeast Corridor are defined) would allow the railroads to greatly increase the average intermodal speed from 17 mph, thereby allowing more opportunities per car to be loaded during the course of a year.
By increasing the speed of just one inter-modal train (which can be loaded approximately 10-12 times per year), the number of loadings per year could be increased. Each mile per hour improve-ment in speed translates into $100 million in efficiency gains including energy savings, according to General Electric in the NewYorkTimes. Raising volume and revenue along with better equipment utilization gives the railroad increased revenue. With the support of freight railroads and their per-mission to use current rights of way, the eminent domain concerns could be removed, thus decreas-ing the costs of the overall system.
Any system that operates in excess of 150 mph will not be commingled with inter-modal freight operations, and may not be supported by the freight railroads. Thus, we propose to change the definition of high speed rail to gain their support.
The freight railroads have often placed passen-ger trains running on freight lines at a operational disadvantage, even though there are legal safe-guards in place to prevent this. The BLET believes that the use of temporal separation would allow freight/passenger rail to operate on the same lines as an intermodal system and it would take away the questions about which would take precedence on a particular line. Temporal separation would provide a buffer so that freight can not operate on the line at the same time as passenger rail, without decreas-ing the safety of either or the ability to thrive in a competitive market.
Standardization of InfrastructureWe also believe that any new system must be stan-dardized so that a seamless network is created from coast to coast which can be integrated with the existing Amtrak and freight railroad infrastructure. During the inception of our nation’s railroad in-frastructure, the need for standardization was seen as imperative and we must continue to operate a seamless railroad system.
Engineer Must Remain On Board LocomotiveThe BLET believes that there must remain a locomotive engineer in the cab of any high speed
The BLET believes that there must remain a locomotive engineer in the cab of any high speed locomotive. While technology and automation have their place, it is not in the cab of a locomotive. The federally certified locomotive engineers and trainmen currently working on our nation’s railroads are highly skilled and well trained, and they must remain on the job, ensuring our nation’s citizens are kept safe.
Control cab of Amtrak engine.
High Speed Rail
Brotherhood of Locomotive Engineers and Trainmen 6

locomotive. While technology and automation have their place, it is not in the cab of a locomo-tive. The federally certified locomotive engineers and trainmen currently working on our nation’s railroads are highly skilled and well trained, and they must remain on the job, ensuring our nation’s citizens are kept safe.
Employees Must Be Given All Rights and Benefits Conferred to Railroad WorkersThe BLET also wants to ensure the jobs created through the creation of a high speed rail system are safeguarded for railroad workers, and ensures that all workers in the project are covered by federal laws relating to railroad workers, including the Railway Labor Act, Railroad Retirement Act and the Federal Employers Liability Act. All workers on a high speed railroad system must be considered to be railroad workers and be entitled to all of the rights and privileges conferred by that distinc-tion. We have, unfortunately, seen these rights taken away during the creation of new passenger/commuter rail systems built in recent years – even those built on existing rights of way – and would like for it to be mandated that all workers on these systems be railroad workers.
SummaryDevelopment of a high speed rail infrastructure will take time, money and patience. With the changes that we have proposed, the nation stands to gain from the implementation of high speed rail. It could increase our rail capacity and inter-modal speeds; eliminate congestion in our nation’s ports, highways and air-ports; provide a viable alternative to mass trans-portation issues throughout the country; lessen our dependence on foreign oil; reduce our environmental footprint; and create an estimated 47,000 permanent, good paying jobs for every $1 billion we spend devel-oping and maintaining the high speed rail system.
The bottom line is that high speed rail is the solution to resolving most of our major transportation challenges in this nation.
High Speed Rail
7 Brotherhood of Locomotive Engineers and Trainmen

Appendix: High Speed Railroads, Speeds and Kilometers Converted to Miles
Source: UIC “High Speed Lines in the World.” 4 June 2008. uic.asso.fr
United States of AmericaLine Limits
Max Speed KM
Max Speed MI
Year Opened
Total KM Total MI
Boston – New York – Washington 241.4 150.00 362 224.94
Planned
Line LimitsMax Speed
KMMax Speed
MIYear
OpenedTotal KM Total MI
Los Angeles – Sacramento 300 186.41 2025 900 559.23
In Operation 362 224.94 9919 6163.38
Under Construction 8295 5154.27
Planned 2395 1488.18 18753 11652.57
Total by 2025 2757 1713.12 36967 22970.23
BelgiumLine Limits
Max Speed KM
Max Speed MI
Year Opened
Total KM Total MI
Brussels – French Border 300 186.41 1997 72 44.74
Leuven – Liege 300 186.41 2002 65 40.39
137 85.13
Under Construction
Line LimitsMax Speed
KMMax Speed
MIYear
OpenedTotal KM Total MI
Liege – German Border 260 161.56 2008 36 22.37
Antwerp – Dutch Border 300 186.41 2008 36 22.37
72 22.74
Europe
High Speed Rail
Brotherhood of Locomotive Engineers and Trainmen viii

FranceLine Limits
Max Speed KM
Max Speed MI
Year Opened
Total KM Total MI
LGV Paris Sud Est 300 186.41 1981/1983 419 260.35
LGV Atlantique 300 186.41 1989/1990 291 180.82
LGV Contournement Lyon 300 186.41 1992/1994 121 75.19
LGV Nord – Europe 300 186.41 1994/1996 346 214.99
LGV Interconnexion IDF 300 186.41 1994/1996 104 64.62
LGV Mediterranee 320 198.84 2001 259 160.94
LGV East 320 198.84 2007 332 206.30
1872 1163.21
Under Construction
Line LimitsMax Speed
KMMax Speed
MIYear
OpenedTotal KM Total MI
(Figueres) Frontiere – Perpignan 300 186.41 2009 24 14.91
Haut – Bugey (amelioraton LC) 2009 65 40.39
Contournement Nimes –Montpellier
300 186.41 2012 70 43.50
LGV Dignon – Mulhouse 320 198.84 2012 140 86.99
299 185.79
Planned
Line LimitsMax Speed
KMMax Speed
MIYear
OpenedTotal KM Total MI
LGV Sud Europe Atlantique S 2013 120 74.56
LGV Bretagne – Pays de la Loire 2013 188 116.82
LGV Est – Europeenne(Second Phase)
2014/2015 100 62.14
LGV Poitiers – Limoges 2015 115 71.46
LGV Sud Europe Atlantique N 2016 180 111.85
LGV Bordeaux – Toulouse 2016 230 142.92
LGV Rhin – Rhone Br Est(Second Phase)
2015/2020 48 29.83
LGV PACA 2020 200 124.27
Interconnexion Sud IDF 2020 40 24.85
LGV Bordeaux – Espagne 2020 230 142.92
LGV Lyon – Turin 2020 150 93.21
LGV Montpellier – Perpignan 2022 150 93.21
LGV Picardie 2022 250 155.34
LGV Rhin – Rhone Branche S 2022 100 62.14
LGV Rhin – Rhone – Branche Ouest 2022 85 52.82
LGV Paris – Lyon Bis 2025 430 267.19
2616 1625.51
High Speed Rail
ix Brotherhood of Locomotive Engineers and Trainmen

Germany
Line LimitsMax Speed
KMMax Speed
MIYear
OpenedTotal KM Total MI
Fulda – Wurzburg 280 173.98 1988 90 55.92
Hannover – Fulda 280 173.98 1991/1994 248 154.10
Mannheim – Stuttgart 280 173.98 1985/1991 109 67.73
Hannover (Wolfsburg) – Berlin 250 155.34 1998 189 117.44
Koln – Frankfurt 300 186.41 2002/2004 197 122.41
Koln – Duren 250 155.34 2003 42 26.10
(Karlsruhe) Rastatt – Offenburg 250 155.34 2004 44 27.34
Liepzip – Grobers – (Erfurt) 250 155.34 2004 24 14.91
Hamburg – Berlin 230 142.92 2004 253 157.21
Nurenberg – Inglostadt 300 186.41 2006 89 55.30
1285 798.46
Under Construction
Line LimitsMax Speed
KMMax Speed
MIYear
OpenedTotal KM Total MI
Munchen – Augsburg 230 142.92 2010 62 38.53
(Leipzip/Halle) 300 186.41 2015 98 60.89
Nurnberg – Erfurt 250 155.34 2017 218 135.46
378 234.88
Planned
Line LimitsMax Speed
KMMax Speed
MIYear
OpenedTotal KM Total MI
(Karlsruhe) Offenburg – Basel 250 155.34 112 69.59
Frankfurt – Mannheim 300 186.41 81 50.33
Stuttgart – Ulm – Augsburg 250 155.34 166 103.15
Hamburg/Bremen – Hannover 300 186.41 114 70.84
(Hannover) Seelze – Minden 230 142.92 71 44.12
(Frankfurt) Hanau – Fulda/Wurzburg
300 186.41 126 78.29
690 416.32
High Speed Rail
Brotherhood of Locomotive Engineers and Trainmen x

Italy
Line LimitsMax Speed
KMMax Speed
MIYear
OpenedTotal KM Total MI
Rome – Florence (First Section) 250 155.34 1981 150 93.21
Rome – Florence (Second Section) 250 155.34 1984 74 45.98
Rome – Florence (Third Section) 250 155.34 1992 24 14.91
Rome – Naples 300 186.41 2006 220 136.70
Turin – Novara 300 186.41 2006 94 58.41
562 349.21
Under Construction
Line LimitsMax Speed
KMMax Speed
MIYear
OpenedTotal KM Total MI
Milan – Bologna 300 186.41 2008 182 113.09
Novara – Milan 300 186.41 2008 55 34.18
Florence – Bologna 300 186.41 2009 77 47.85
314 195.11
Planned
Line LimitsMax Speed
KMMax Speed
MIYear
OpenedTotal KM Total MI
Milan – Venice 245 152.24
Genoa – Milan 150
395 245.44
The NetherlandsUnder Construction
Line LimitsMax Speed
KMMax Speed
MIYear
OpenedTotal KM Total MI
Schipol – Rotterdamn – Belgian Border
300 186.41 2008 120 74.56
PolandPlanned
Line LimitsMax Speed
KMMax Speed
MIYear
OpenedTotal KM Total MI
Warsaw – Lodz – Wroclaw – Proznan
300 186.41 2015 500 310.69
Warsaw – Ktowice/Krakow 300 186.41 2015 212 131.73
712 442.42
High Speed Rail
xi Brotherhood of Locomotive Engineers and Trainmen
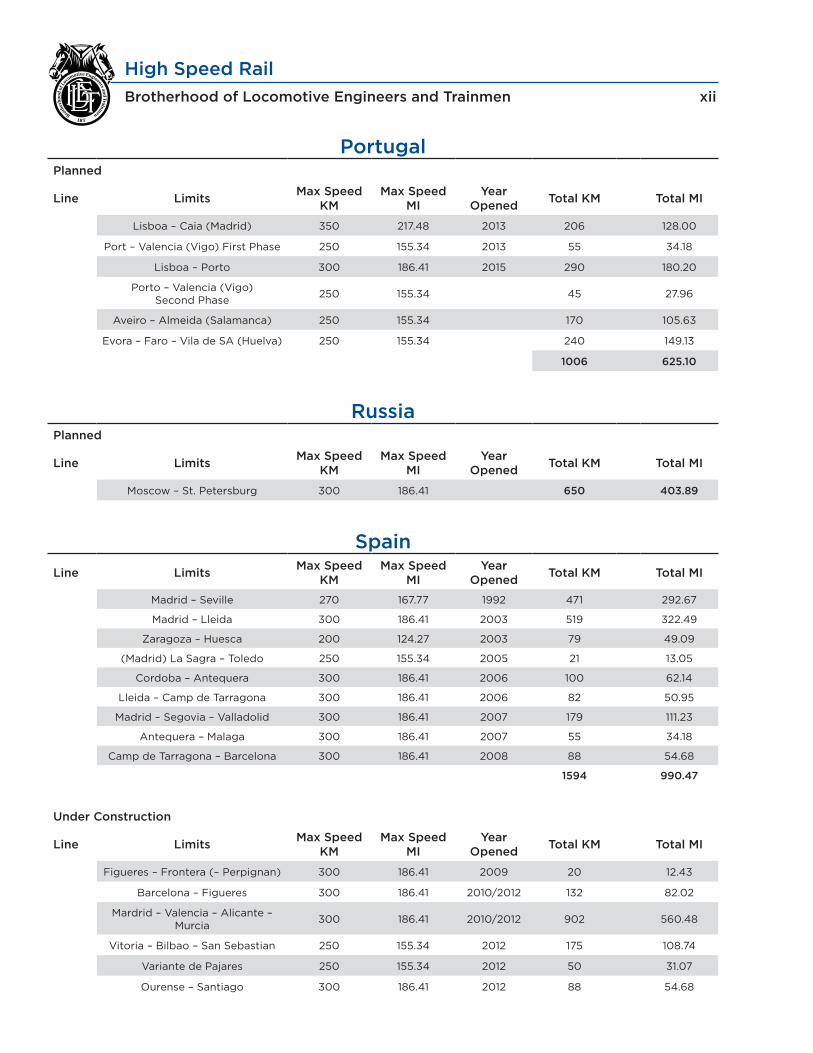
PortugalPlanned
Line LimitsMax Speed
KMMax Speed
MIYear
OpenedTotal KM Total MI
Lisboa – Caia (Madrid) 350 217.48 2013 206 128.00
Port – Valencia (Vigo) First Phase 250 155.34 2013 55 34.18
Lisboa – Porto 300 186.41 2015 290 180.20
Porto – Valencia (Vigo)Second Phase
250 155.34 45 27.96
Aveiro – Almeida (Salamanca) 250 155.34 170 105.63
Evora – Faro – Vila de SA (Huelva) 250 155.34 240 149.13
1006 625.10
RussiaPlanned
Line LimitsMax Speed
KMMax Speed
MIYear
OpenedTotal KM Total MI
Moscow – St. Petersburg 300 186.41 650 403.89
Spain
Line LimitsMax Speed
KMMax Speed
MIYear
OpenedTotal KM Total MI
Madrid – Seville 270 167.77 1992 471 292.67
Madrid – Lleida 300 186.41 2003 519 322.49
Zaragoza – Huesca 200 124.27 2003 79 49.09
(Madrid) La Sagra – Toledo 250 155.34 2005 21 13.05
Cordoba – Antequera 300 186.41 2006 100 62.14
Lleida – Camp de Tarragona 300 186.41 2006 82 50.95
Madrid – Segovia – Valladolid 300 186.41 2007 179 111.23
Antequera – Malaga 300 186.41 2007 55 34.18
Camp de Tarragona – Barcelona 300 186.41 2008 88 54.68
1594 990.47
Under Construction
Line LimitsMax Speed
KMMax Speed
MIYear
OpenedTotal KM Total MI
Figueres – Frontera (– Perpignan) 300 186.41 2009 20 12.43
Barcelona – Figueres 300 186.41 2010/2012 132 82.02
Mardrid – Valencia – Alicante – Murcia
300 186.41 2010/2012 902 560.48
Vitoria – Bilbao – San Sebastian 250 155.34 2012 175 108.74
Variante de Pajares 250 155.34 2012 50 31.07
Ourense – Santiago 300 186.41 2012 88 54.68
High Speed Rail
Brotherhood of Locomotive Engineers and Trainmen xii

Spain cont.Under Construction cont.
Line LimitsMax Speed
KMMax Speed
MIYear
OpenedTotal KM Total MI
Bobadilla – Granada 250 155.34 2012 109 67.73
La Coruna – Vigo 250 155.34 2012 158 98.18
Navalmoral – Caceres – Badajoz – Fr. Port
300 186.41 278 172.74
Sevilla – Cadiz 250 155.34 152 94.45
Hellin – Cieza(Variente de Camarillas)
250 155.34 27 16.78
Sevilla – Antequera 300 186.41 128 79.54
2219 1378.82
Planned
Line LimitsMax Speed
KMMax Speed
MIYear
OpenedTotal KM Total MI
Valladolid – Burgo – Vitoria 300 186.41 211 131.11
Venta de Banos – Leon – Asturias 238 147.89
Madrid – Navalmoral de la Mata 300 186.41 191 118.68
Almeria – Murcia 190 118.06
Valencia – Castellon 64 39.77
Olmedo – Zamora – Orense 300 186.41 2012 323 200.70
Palencia – Santander 300 186.41 201 124.90
Zaragoza – Castejon – Logrono 250 155.34 149 92.58
Castejon – Pamplona 300 186.41 75 46.60
Orense – Vigo (via Cerdedo) 250 155.34 60 37.28
1702 1057.57
SwedenPlanned
Line LimitsMax Speed
KMMax Speed
MIYear
OpenedTotal KM Total MI
Stockholm – Malmo/Goteborg 300 186.41 750 466.03
High Speed Rail
xiii Brotherhood of Locomotive Engineers and Trainmen

Switzerland
Line LimitsMax Speed
KMMax Speed
MIYear
OpenedTotal KM Total MI
Frutigen – Visp(Lotschberg Base Tunnel)
250 155.34 2007 35 21.75
Under Construction
Line LimitsMax Speed
KMMax Speed
MIYear
OpenedTotal KM Total MI
Erstfeld – Biasca(Gotthard Base Tunnel)
250 155.34 2017 57 35.42
Giubiasco – Lugano(Cenari Base Tunnel)
250 155.34 2019 15 9.32
72 44.74
United KingdomPlanned
Line LimitsMax Speed
KMMax Speed
MIYear
OpenedTotal KM Total MI
Fawkham Junction – Tunnel 300 186.41 2003 74 45.98
London – Southfleet Junction 300 186.41 2007 39 24.23
113 7021
High Speed Rail
Brotherhood of Locomotive Engineers and Trainmen xiv

China
Line LimitsMax Speed
KMMax Speed
MIYear
OpenedTotal KM Total MI
Quinhuangdao – Shenyang 200 124.27 2003 442 274.65
JInan – Quigdao 200 124.27 2006 (tests) 330 205.05
Jinan – Quigdao 250 155.34 2006 (tests) 60 37.28
832 516.98
Under Construction
Line LimitsMax Speed
KMMax Speed
MIYear
OpenedTotal KM Total MI
Beijing – Tianjing 300 186.41 2008 115 71.46
Wuhan – Guanzhou – Shenzhen 300 186.41 2010 1045 649.33
Shijiazhuang – Tia Yuan(Shi-Tai Line)
250 155.34 2010 190 118.06
Zhengzhou – Xian 250 155.34 2010 454 282.10
Hangzhou – Ningbo – Fuzhou – Shenzhen
250 155.34 2010 1600 994.19
3404 2115.15
Planned
Line LimitsMax Speed
KMMax Speed
MIYear
OpenedTotal KM Total MI
Beijing – Shanghai 350 217.48 2010 1320 20.21
Beijing – Wuhan 300 186.41 2010 1100 683.51
Harbin – Dalian 250 155.34 2010 905 562.34
Tianjin – Quinhuangdao 250 155.34 2010 260 161.56
Nanjung – Wuhan 250 155.34 2010 490 304.47
4075 2532.09
Taiwan
Line LimitsMax Speed
KMMax Speed
MIYear
OpenedTotal KM Total MI
Taipei – Koahsiung 300 186.41 2007 345 214.37
India
Line LimitsMax Speed
KMMax Speed
MIYear
OpenedTotal KM Total MI
Mumbai – Amehdabad 250 155.34 495 307.58
Asia
High Speed Rail
xv Brotherhood of Locomotive Engineers and Trainmen

Iran
Line LimitsMax Speed
KMMax Speed
MIYear
OpenedTotal KM Total MI
Tehran – Isfahan 250 155.34 475 295.15
Japan
Line LimitsMax Speed
KMMax Speed
MIYear
OpenedTotal KM Total MI
Tokaido Tokyo – Osaka 270 167.77 1964 515 320.01
San-yo Osaka – Okayama 270 167.77 1972 161 100.04
San-yo Okayama – Hakata 300 186.41 1975 393 244.20
Tohoku Omiya – Morioka 275 170.88 1982 465 288.94
Joetsu Omiya – Niigata 240 149.13 1982 270 167.77
Ueno – Omiya 110 68.35 1985 27 16.78
Tokyo – Ueno 110 68.35 1991 4 2.49
Yamagata Fukushima – Yamagata 130 80.78 1992 (MINI) 87 54.06
Akita Morioka – Akita 130 8078 1997 (MINI) 127 78.91
Hokuriku Takasaki – Nagano 260 161.56 1997 117 72.70
Yamagata Yamagata – Shinjo 130 80.78 1999 (MINI) 62 38.53
Tohoku Morioka – Hachinohe 260 161.56 2002 97 60.27
Kyushu Yatsuhiro – Kagoshima Chui 260 161.56 2004 127 78.91
2452 1523.60
Under Construction
Line LimitsMax Speed
KMMax Speed
MIYear
OpenedTotal KM Total MI
Tohoku Hachinohe – Shin Aomori 2011 82 50.95
Kyushu Hakata – Shin Yatsuhiro 2011 130 80.78
Hokuriku Nagano – Kanazawa 2015 229 142.29
Hokkaido Shin Aomori – Shin Hakodate 2016 149 92.58
590 366.61
Planned
Line LimitsMax Speed
KMMax Speed
MIYear
OpenedTotal KM Total MI
Hokkaido Shin Hakodate – Sapporo 211 131.11
Hokyriku Kanazawa – Osaka 254 157.83
Kyushu Hakata – Nagasaki 118 73.32
583 362.26
High Speed Rail
Brotherhood of Locomotive Engineers and Trainmen xvi

Saudi ArabiaPlanned
Line LimitsMax Speed
KMMax Speed
MIYear
OpenedTotal KM Total MI
Medina – Jeddah – Mecca 300 186.41 2015 550 341.75
South Korea
Line LimitsMax Speed
KMMax Speed
MIYear
OpenedTotal KM Total MI
Seoul – Daegu 300 186.41 2004 330 205.05
Under Construction
Line LimitsMax Speed
KMMax Speed
MIYear
OpenedTotal KM Total MI
Daegu – Pusan 300 186.41 82 50.95
TurkeyUnder Construction
Line LimitsMax Speed
KMMax Speed
MIYear
OpenedTotal KM Total MI
Ankara – Istanbul 250 155.34 2008 533 331.19
Ankara – Konya 250 155.34 212 131.73
745 462.92
Planned
Line LimitsMax Speed
KMMax Speed
MIYear
OpenedTotal KM Total MI
Ankara – Sivas 250 155.34 460 285.83
Ankara – Kayseri 250 155.34 175 108.74
Ankara – Izmir 250 155.34 624 387.74
Bandirma – Bursa – Ayazama – Osmaneli
250 155.34 190 118.06
Halkali – Bulgaria Border 250 155.34 230 142.92
1679 1043.28
High Speed Rail
xvii Brotherhood of Locomotive Engineers and Trainmen
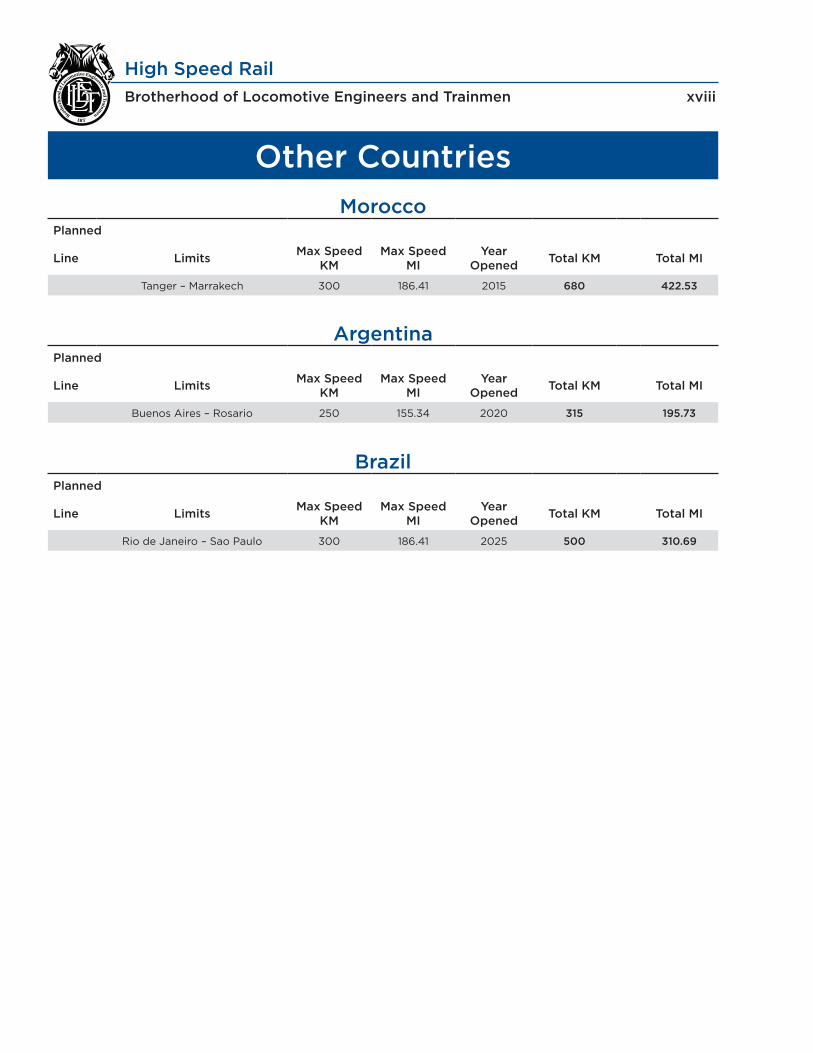
Other Countries
MoroccoPlanned
Line LimitsMax Speed
KMMax Speed
MIYear
OpenedTotal KM Total MI
Tanger – Marrakech 300 186.41 2015 680 422.53
ArgentinaPlanned
Line LimitsMax Speed
KMMax Speed
MIYear
OpenedTotal KM Total MI
Buenos Aires – Rosario 250 155.34 2020 315 195.73
BrazilPlanned
Line LimitsMax Speed
KMMax Speed
MIYear
OpenedTotal KM Total MI
Rio de Janeiro – Sao Paulo 300 186.41 2025 500 310.69
High Speed Rail
Brotherhood of Locomotive Engineers and Trainmen xviii

High Speed Rail
Notes Brotherhood of Locomotive Engineers and Trainmen
Notes

High Speed Rail
Brotherhood of Locomotive Engineers and Trainmen Notes
Notes


