High-Throughput Screening and Characterization of PhenolicCompounds in Stone Fruits Waste by LC-ESI-QTOF-MS/MSand Their Potential Antioxidant Activities
Yili Hong 1, Zening Wang 1, Colin J. Barrow 2 , Frank R. Dunshea 1,3 and Hafiz A. R. Suleria 1,2,*
1 School of Agriculture and Food, Faculty of Veterinary and Agricultural Sciences,The University of Melbourne, Parkville, VIC 3010, Australia; [email protected] (Y.H.);[email protected] (Z.W.); [email protected] (F.R.D.)
2 Centre for Chemistry and Biotechnology, School of Life and Environmental Sciences, Deakin University,Waurn Ponds, VIC 3217, Australia; [email protected]
3 Faculty of Biological Sciences, The University of Leeds, Leeds LS2 9JT, UK* Correspondence: [email protected]; Tel.: +61-470-439-670
Abstract: Stone fruits, including peach (Prunus persica L.), nectarine (Prunus nucipersica L.), plum(Prunus domestica L.) and apricot (Prunus armeniaca L.) are common commercial fruits in the market.However, a huge amount of stone fruits waste is produced throughout the food supply chain duringpicking, handling, processing, packaging, storage, transportation, retailing and final consumption.These stone fruits waste contain high phenolic content which are the main contributors to the an-tioxidant potential and associated health benefits. The antioxidant results showed that plum wastecontained higher concentrations of total phenolic content (TPC) (0.94 ± 0.07 mg gallic acid equiv-alents (GAE)/g) and total flavonoid content (TFC) (0.34 ± 0.01 mg quercetin equivalents (QE)/g),while apricot waste contained a higher concentration of total tannin content (TTC) (0.19 ± 0.03 mgcatechin equivalents (CE)/g) and DPPH activity (1.47 ± 0.12 mg ascorbic acid equivalents (AAE)/g).However, nectarine waste had higher antioxidant capacity in ferric reducing-antioxidant power(FRAP) (0.98 ± 0.02 mg AAE/g) and total antioxidant capacity (TAC) (0.91 ± 0.09 mg AAE/g) as-says, while peach waste showed higher antioxidant capacity in 2,2′-azino-bis-(3-ethylbenzothiazoline-6-sulfonic acid (ABTS) assay (0.43 ± 0.09 mg AAE/g) as compared to other stone fruits waste.Qualitative and quantitative phenolic analysis of Australian grown stone fruits waste were con-ducted by liquid chromatography coupled with electrospray-ionization quadrupole time-of-flightmass spectrometry (LC-ESI-QTOF-MS/MS) and HPLC-photodiode array detection (PDA). The LC-ESI-QTOF-MS/MS result indicates that 59 phenolic compounds were tentatively characterized inpeach (33 compounds), nectarine (28), plum (38) and apricot (23). The HPLC-PDA indicated thatp-hydroxybenzoic acid (18.64 ± 1.30 mg/g) was detected to be the most dominant phenolic acid andquercetin (19.68 ± 1.38 mg/g) was the most significant flavonoid in stone fruits waste. Hence, itcould be concluded that stone fruit waste contains various phenolic compounds and have antioxidantpotential. The results could support the applications of these stone fruit wastes in other food, feed,nutraceutical and pharmaceutical industries.
Keywords: fruit waste; stone fruits; phenolic compounds; LC-ESI-QTOF-MS/MS; HPLC-PDA
1. Introduction
Food waste is one of the main challenges and a world-wide problem. It may occurduring the whole food supply chain which is directly or indirectly related to producers,retailers and ultimate consumers [1]. According to the estimation of Edwards and Mer-cer [2], 44 million tons of food is wasted in Australia each year. It has also been reportedthat 25–40% of food is wasted throughout the food supply chain [3]. Fruit injuries, bruising,over-ripening during food transportation and storage are also some of main issues of food
waste [1,4]. In addition, rejected foods are also one of the main types of food waste; mostconsumers are generally reluctant to choose imperfect foods in terms of shape, color, size,appearance and freshness [5]. This fruit waste is rich in moisture content and biodegrad-able ingredients; it can produce unbearable gas and bacteria, which leads to greenhouseeffect and plague [6]. In order to reduce these impacts, extraction of phytochemicals fromdifferent fruit waste streams has been one of the recent focuses [7].
Stone fruits are rich in phytochemicals and are usually consumed directly or processedinto food products including jam, juices and so on [8]. Stone fruits are the members ofPrunus, which includes peach (Prunus persica L.), nectarine (Prunus nucipersica L.), plum(Prunus domestica L.) and apricot (Prunus armeniaca L.) [9]. They consist of a thin outer layer(epicarp), edible flesh (mesocarp) and a hard stone (endocarp) which encloses the seedin the center of the fruit [10]. Stone fruits contain various bioactive compounds, whichcan be classified as carotenoid, vitamin and phenolic and thiol compounds, and may havepotential antioxidant and anticancer activities [11]. For example, previous studies haveextracted and identified more than 30 phenolic compounds from peaches [12]. Presence ofthese diverse bioactives in stone fruits is attractive to consumers and stone fruits have a highsales volume in the market [8], which indicates that utilization and repurposing of theirwaste is one of the smartest ideas to improve the circular economy and food sustainability.
Phenolic compounds can be widely found in plants, and consist of an aromatic ringwith one or more hydroxyl substituents [13,14]. So far, there are more than 8000 kinds ofphenolic compounds which have been identified in plants, including flavonoids, phenolicacids, tannins etc. [15]. Although the specific metabolic mechanism of phenolic compoundsis unclear, previous studies reported that phenolic compounds have antioxidant, antibacte-rial and anticancer properties [16–18]. Previously, Zerva, et al. [19] confirmed that peachwaste is rich in carotenoids and phenolic compounds. Gil, et al. [20] argued that peachwaste contains a high concentration of β-carotene, ascorbic acid and phenolic compounds;furthermore, the antioxidant activity is mainly attributed to phenolic compounds. Pre-viously, Liu, et al. [8] demonstrated that peach peels have higher levels of antioxidantactivities than peach flesh because of their higher phenolic content. Michalska, et al. [21]found that the phenolic compounds in the pomace of plum are mainly procyanidin andcatechin. Furthermore, different stone fruits contain different bioactive compounds; forexample, the phenolic profile in plums and peaches varies greatly [22]. In addition, thecomposition of phenolics also changes during the maturity of stone fruits [23]. Therefore, itis necessary to characterize and quantify the phenolic compounds in stone fruits.
The antioxidant activity of phenolic compounds can be measured by scavenging freeradicals using in vitro assays which include the 2,2’-diphenyl-1-picrylhydrazyl (DPPH) assay,ferric reducing-antioxidant power (FRAP) assay and 2,2′-azino-bis-(3-ethylbenzothiazoline-6-sulfonic acid) (ABTS) radical cation decolorization assay [24,25]. The phenolic contentmay vary depending on the extraction method, the material, the solvent and the environ-ment [26]. Methanol, ethanol, acetone, ethyl acetate and aqueous mixtures of these solventsare commonly used for extraction [27]. Liquid chromatography coupled with electrospray-ionization quadrupole time-of-flight mass spectrometry (LC-ESI-QTOF-MS/MS) can beapplied to determine the phenolic profile in rejected stone fruits with high accuracy. High-pressure liquid chromatography (HPLC) in combination with a photodiode array detector(PDA) is used to quantify the particular phenolic compounds in fruits and vegetables [28].These two techniques can be considered to qualify and quantify the phenolic compoundsin stone fruits waste. Previously, Wu, et al. [29] characterized some major phenolic com-pounds including kaempferol, gallic acid and (+)-catechin in one of the peach cultivars(Xiahui-8) using LC-MS in China. Sójka, et al. [30] also identified some phenolic compoundsin dark blue plum including anthocyanins, neochlorogenic acid and chlorogenic acid inPoland. However, there is limited research published on Australian grown stone fruits andespecially rejected stone fruits waste.
In this research, the potential antioxidant activity of Australian grown stone fruitswaste including peach, nectarine, plum and apricot was examined. The objectives of
Antioxidants 2021, 10, 234 3 of 22
this study were to extract the phenolic compounds from stone fruits waste; measurethe total phenolic content (TPC), total flavonoid content (TFC), and total tannin content(TTC); analyzes the antioxidant activity by using DPPH, FRAP, ABTS and total antioxidantcapacity (TAC) assays; characterize the phenolic compounds by LC-ESI-QTOF-MS/MSanalysis and quantify from stone fruits waste using HPLC-PDA analysis. The outcome ofour study may provide possibilities for the utilization of stone fruits waste in other food,feed and pharmaceutical streams.
2. Materials and Methods2.1. Chemical and Reagents
Most of the chemicals used for phenolics extraction and characterization in this researchwere analytical grade and purchased from Sigma-Aldrich (Castle Hill, NSW, Australia). Folin-Ciocalteu reagent, aluminum chloride hexahydrate, 2,2’-diphenyl-1-picrylhydrazyl (DPPH),2,4,6-tripyridyl-s-triazine (TPTZ), 2,2′-azino-bis-(3-ethylbenzothiazoline-6-sulfonic acid), gal-lic acid, ascorbic acid, quercetin, vanillin, catechin, potassium persulfate and HCl werepurchased from Sigma-Aldrich (St. Louis, MO, USA). Ethanol, sodium carbonate, sulfuricacid, sodium acetate, acetic acid and ferric chloride (Fe[III]Cl3·6H2O) were purchasedfrom the Thermo Fisher (Scoresby, Melbourne, VIC, Australia). HPLC grade methanol,acetonitrile and acetic acid were purchased from Sigma-Aldrich (St. Louis, MO, USA).Phenolic acid and flavonoid standards, including caffeic acid, chlorogenic acid, gallicacid, p-hydroxybenzoic acid, protocatechuic acid, catechin, epicatechin, epicatechin gallate,kaempferol and quercetin were purchased from Sigma-Aldrich (St. Louis, MO, USA).
2.2. Sample Preparation
Stone fruit waste samples used in the proposed research project were mostly rejectedby the customers due to their low-grade quality in terms of shape, color, size, appearance,freshness, injuries and over ripeness but were not rotten. Samples of 2–3 kg of each stonefruits waste including peach (Prunus persica L.), nectarine (Prunus nucipersica L.), plum(Prunus domestica L.) and apricot (Prunus armeniaca L.) were collected from a local retailmarket in Melbourne, Australia. After removing the seeds and peels, samples were cleanedand crushed into small pieces, and prepared for extraction within 1–2 h. Pulps wereblended (1.5-L blender, Russell Hobbs Classic, model DZ-1613, Melbourne, VIC, Australia)into slurry, stored in silver flat Ziplock aluminum foil—vacuum sealing bags (Best supply,NSW, AU) and were kept at −20 ◦C for 2–3 weeks for further analysis.
2.3. Extraction of Phenolic Compounds
Extracts were prepared with ethanol (70%, 20mL) by modifying the protocol of Gu,et al. [31]. In short, extracts were shaken over 12 h in a shaking incubator (ZWYR-240,Labwit, Ashwood, Victoria, Australia) at 120 rpm, 4 ◦C and then centrifuged (ROTINA380R centrifuge, Hettich, Victoria, Australia) at 5000 rpm for 15 min. The supernatant wascollected and stored at −20 ◦C for further analysis.
2.4. Estimation of Phenolic Compounds and Antioxidant Assays
TPC, TFC and TTC were determined for phenolic compounds estimation, while DPPH,FRAP, and ABTS were measured for antioxidant capacity. All the assays were performedusing our previously modified method of Tang, et al. [32] in triplicate. The data wereobtained by the Multiskan® Go microplate reader (Thermo Fisher Scientific, Waltham,MA, USA).
2.4.1. Determination of Total Phenolic Content (TPC)
The TPC of stone fruits was determined by using the method of Severo, et al. [33]with modification. An amount of 25 µL Folin-Ciocalteu reagent (1:3 diluted with water)and 200 µL water was added to 25-µL extracts in triplicate in 96-well plates (Corning Inc.,Midland, NC, USA) and incubated for 5 min at room temperature. Then, 25 µL of 10%
Antioxidants 2021, 10, 234 4 of 22
(w/w) sodium carbonate was supplied to basify the mixture. After incubating at 25 ◦C for60 min, the absorbance was determined at 765 nm with a spectrophotometer plate reader(Thermo Fisher Scientific, Waltham, MA, USA). The TPC was expressed as mg of gallicacid equivalent (GAE) per gram fresh weight (mg GAE/g fw) of the sample using thecalibration curve of gallic acid standard (0–200 µg/mL).
2.4.2. Determination of Total Flavonoids Content (TFC)
The TFC in stone fruits was determined by the modified aluminum chloride method ofGouveia and Castilho [34]. An amount of 80 µL of 2% (w/v) aluminum chloride ethanolicsolution and 120 µL of 50 mg/mL sodium acetate solution were applied to 80 µL stonefruits extract in a 96-well plate, followed by incubation at room temperature in a darkroom for 2.5 h. The absorbance was measured at 440 nm. The TFC was expressed as mgof quercetin equivalent (QE) per gram fresh weight (mg QE/g fw) of the sample usingthe calibration curve of prepared with quercetin with concentrations ranging from 0 to50 µg/mL.
2.4.3. Determination of Total Tannins Content (TTC)
Based on the method of vanillin and the p-dimethylaminocinnamaldehyde method ofStavrou, et al. [35], TTC was determined by mixing 150 µL of 4% (w/v) methanolic vanillinsolution with a 25-µL diluted sample. Then, 25 µL of 32% (v/v) sulfuric acid in methanolwas supplied to the mixture in a 96-well plate. The absorbance was measured at 500 nmafter incubating at 25 ◦C for 15 min. The TTC was expressed as mg of catechin equivalent(CE) per gram fresh weight (mg CE/g fw) of the sample using the calibration curve ofcatechin (0–1000 µg/mL).
The DPPH free radical scavenging capacity was determined by modifying the methodof Sogi, et al. [36]. A 40-µL extract was added to 260 µL of 0.1-mM DPPH radical methanolsolution in a 96-well plate, followed by shaking vigorously. Then, the mixture was incu-bated for 30 min at 25 ◦C. The absorbance was determined at 517 nm. The DPPH freeradical scavenging capacity was expressed as mg of ascorbic acid equivalent (AAE) pergram fresh weight (mg AAE/g fw) of the sample using the calibration curve of ascorbicacid (0–50 µg/mL).
2.4.5. Ferric Reducing-Antioxidant Power (FRAP) Assay
The FRAP was assayed with a modified method of Sogi, et al. [36]. The FRAP methodevaluates the capacity of a material to reduce iron in the Fe3+–TPTZ complex (ferric-2,4,6-tripyridyl-s-Triazine) into Fe2+–TPTZ. The FRAP reagent was made from 20 mM FeCl3solution, 10 mM TPTZ (2,4,6-tripyridyl-s-triazine) solution and 300 mM sodium acetatesolution with a volume ratio of 1:1:10. An amount of 20 µL of sample was added to 280 µLFRAP reagent in a 96-well plate and incubated at 37 ◦C for 10 min. The absorbance wasdetermined at 593 nm. The FRAP was expressed as mg of ascorbic acid equivalent (AAE)per gram fresh weight (mg AAE/g fw) of the sample using the calibration curve preparedfrom ascorbic acid with concentrations ranging from 0 to 50 µg/mL.
The ABTS radical scavenging capacity is calculated by using ABTS radical cationdecolorization assay using the protocol of Peng, et al. [37]. ABTS cations were generatedby a mixture of 5 mL of 7 mmol/L of ABTS solution with 88 µL of a 140-mM potassiumpersulfate solution, which was incubated at 25 ◦C for 16 h in a dark area. The ABTS+
solution was then diluted with ethanol to obtain an initial absorbance of 0.70 at 734 nm.After that, 10 µL of the stone fruits sample was applied to 290-µL prepared ABTS+ solutionin a 96-well plate and incubated at room temperature for 6 min in the dark. After the
Antioxidants 2021, 10, 234 5 of 22
incubation, the absorbance was measured at 734 nm. The standard curve is also constructedby using ascorbic acid solution. The ABTS radical scavenging capacity was expressed asmg of ascorbic acid equivalent (AAE) per gram fresh weight (mg AAE/g fw) of the sampleusing the calibration curve prepared from ascorbic acid (0–150 µg/mL).
2.4.7. Total Antioxidant Capacity (TAC)
The TAC was estimated by modifying the phosphomolybdate method of Prieto,et al. [38]. Phosphomolybdate reagent was prepared by mixing H2SO4 (0.6 M), sodiumphosphate (0.028 M) and ammonium molybdate (0.004 M). A 40-µL extract was applied to260 µL of phosphomolybdate reagent in the 96-well plate. The absorbance was measuredat 695 nm after incubating at 95 ◦C for 10 min and cooling down to the room temperature.The TAC was expressed as mg of ascorbic acid equivalent (AAE) per gram fresh weight(mg AAE/g fw) of the sample using the calibration curve of ascorbic acid (0–200 µg/mL).
2.5. LC-ESI-QTOF-MS/MS Analysis
LC-ESI-QTOF-MS/MS characterization of the phenolic compounds in stone fruitswaste was performed by Agilent 1200 series HPLC (Agilent Technologies, CA, USA)equipped with an Agilent 6520 Accurate-Mass Q-TOF LC/MS (Agilent Technologies, CA,USA) by following the protocol of Suleria, et al. [39]. The separation of compounds isachieved by using Synergi Hydro-RP 80A LC reverse phase column with an internaldiameter of 250 mm × 4.6 mm and particle size of 4 µm (Phenomenex, Torrance, CA, USA).The Phenomenex C18 ODS guard column with an internal diameter of 4.0× 2.0 mm is usedto protect the column. The mobile phase A consisted of acetic acid/water solution (2:98,v/v), whereas mobile phase B was composed of acetonitrile/acetic acid/water (100:1:99,v/v/v). Mobile phases A and B were degassed at 25 ◦C for 15 min. The flow rate wasset to be 0.8 mL/min and the injection volume of each sample was 6 µL. Gradient elutionconditions were set by a mixture of mobile phase A and B as follows: 0–20 min, 10% B;20–30 min, 25% B; 30–40 min, 35% B; 40–70 min, 40% B; 70–75 min, 55% B; 75–77 min, 80%B; 77–79 min, 100% B; 79–82 min, 100% B; 82–85 min, 10% B. The column was equilibratedfor 3 min between each two injections.
For MS/MS, electrospray ionization (ESI) was utilized in operating both negativeand positive ion modes. The mass spectrometry conditions were performed as follows:the nebulizer gas pressure was 45 psi, the nitrogen gas temperature was 300 ◦C with a5 L/min flow rate, while the sheath gas temperature was 250 ◦C with an 11 L/min flowrate. The capillary and nozzle voltage were, respectively, set at 3.5 kV and 500 V. The massspectra were obtained over the m/z range of 50–1300 amu with collision energy (10, 15and 30 eV) for fragmentation. Data collection and analysis were performed using AgilentLC-MS-QTOF MassHunter data acquisition software version B.03.01.
2.6. HPLC-PDA Analysis
HPLC-PDA was carried out by using the method of Ma, et al. [40] to quantify thetargeted phenolic compounds in stone fruits samples, which was performed with Agilent1200 series HPLC (Agilent Technologies, CA, USA) equipped with a photodiode array(PDA) detector. Column and LC conditions were maintained as described above in LC-ESI-QTOF-MS/MS analysis except the sample injection volume is changed to 20 µL. ThePDA detector is used to detect sample compositions under 280 nm, 320 nm, and 370 nm forthe identification of hydroxybenzoic acids, hydroxycinnamic acids and flavonol groups,respectively. Individual phenolic compounds were quantified according to the calibrationcurves generated from standards. Results were expressed as µg/g of the sample. Dataacquisition and analysis were performed using Agilent LC-ESI-QTOF-MS/MS MassHunterdata acquisition software version B.03.01.
Antioxidants 2021, 10, 234 6 of 22
2.7. Statistical Analysis
Results were presented as mean ± standard deviation (SD) of triplicate experiments.One-way analysis of variance (ANOVA) was used to test whether there are significant differ-ences between mean values of different samples, followed by Tukey’s honestly significantdifferences (HSD) multiple rank test at p < 0.05, which was carried out by using MinitabStatistical software for Windows Version 19.0 (Minitab, LLC, State College, PA, USA).
3. Results and Discussion3.1. Phenolic Compounds Estimation (TPC, TFC and TTC)
Stone fruits have been reported to be rich in phenolic compounds [20,21]. In thisresearch, the phenolic content in four Australian grown stone fruits’ waste including peach,nectarine, plum and apricot were determined by TPC, TFC and TTC (Table 1). Plum wasteand apricot waste presented a higher phenolic content among all the samples, since plumwaste showed a significant higher TPC and TFC, and apricot waste displayed a higher TTCthan the others (p ≤ 0.05).
Table 1. Phenolic content and antioxidant activities in stone fruit samples.
Antioxidant Assays Peach Nectarine Plum Apricot
TPC (mg GAE/g) 0.47 ± 0.08 c 0.31 ± 0.05 d 0.94 ± 0.07 a 0.65 ± 0.12 b
TFC (mg QE/g) 0.18 ± 0.01 c 0.16 ± 0.09 c 0.34 ± 0.01 a 0.23 ± 0.07 b
TTC (mg CE/g) 0.07 ± 0.02 c 0.10 ± 0.06 b 0.09 ± 0.02 c 0.19 ± 0.03 a
DPPH (mg AAE/g) 0.98 ± 0.07 b 1.42 ± 0.04 a 0.94 ± 0.17 b 1.47 ± 0.12 a
FRAP (mg AAE/g) 0.54 ± 0.01 c 0.98 ± 0.02 a 0.63 ± 0.04 b 0.93 ± 0.04 a
ABTS (mg AAE/g) 0.43 ± 0.09 a 0.23 ± 0.04 b 0.21 ± 0.01 b 0.25 ± 0.11 b
TAC (mg AAE/g) 0.27 ± 0.10 d 0.91 ± 0.09 a 0.61 ± 0.12 b 0.54 ± 0.09 c
All data are the mean ± standard deviation of three replicates. Means followed by different letters (a, b, c, d) withinthe same row are significantly different (p ≤ 0.05) from each other by using one-way analysis of variance andTukey’s test. Data of stone fruit samples are reported on a fresh weight basis. GAE, gallic acid equivalents; QE,quercetin equivalents; CE, catechin equivalents; AAE, ascorbic acid equivalents.
In terms of TPC, all the samples were significantly different from each other (p ≤ 0.05).Plum waste (0.94 ± 0.07 mg GAE/g) contained the highest concentration of phenoliccompounds, followed by apricot, peach and nectarine. The previous results [41] alsoshowed that the TPC of Serbian grown “Cacanska secer” plum is higher than “J. H. Hale”peach and “Caldesi” nectarine. This may be due to the difference in phenolic compositionin different fruits. Since the skin of stone fruit is usually not eaten by humans. However,previous study has described that the peel of Chinese grown peach, which is Hujingmilucultivar (79.14 ± 4.81 mg GAE/100g), contains more phenolic compounds than peach flesh(25.28 ± 0.96 mg GAE/100g) [8]. Furthermore, compared with the previous study withTPC of Serbian grown plum, our data were slightly lower [41]. It has been reported thattotal phenolic content varies within cultivars [8]; the lower phenolic concentration in ourstudy may suggest that Australian grown stone fruits contain less phenolic compounds ascompared to Serbian grown stone fruits.
In TFC, plum waste (0.34 ± 0.01 mg QE/g) also showed significantly (p ≤ 0.05) higherconcentration among others; however, there was no significant difference between peachand nectarine. Previously, it has been reported that TFC of north-western Iranian grownplums ranged from 16.06 to 35.81 mg QE/100 g, which was almost similar to our results [42].However, compared with fresh Iranian peach, including “Zoodras”, “Kosari”, “Haj-kazemi”,
“Tak-daneh”, “Anjiri-ye-khouni” and “Zaferani”, our TFC results were slightly lower [43]. Thismay suggest that stone fruits waste contain less flavonoids as compared to fresh fruits. Itmight be due to conversion of parent flavonoids into other metabolites. Fruit maturity isalso one of the important factors, flavonoid content decrease significantly (around 40%)during ripening [44]. Rejected fruits are mostly over-ripen; therefore, they may have lessflavonoids as compared to fresh stone fruits.
Antioxidants 2021, 10, 234 7 of 22
As for TTC, apricot waste contained the highest tannins (0.19 ± 0.03 mg CE/g). Therewas non-significant difference between the tannin content of peach and plum (p ≤ 0.05).Compared with the previous research on apricot and “Papaz” plum growing in Turkey,our samples showed higher tannin content. It has been revealed that tannin concentrationvaries from varieties, geographical origin and environmental conditions [45]. In addition,the fruit storage conditions have a significant impact on tannin content. Peaches stored atlower temperatures (0–2 ◦C) retained more phenolic compounds [46], long storage durationcan also reduce phenolic compounds [46]. Moreover, tannin concentration may also beaffected by growing conditions, agronomical practices and water availability. Under waterscarcity and stress condition, the concentration of phenolic compounds normally increasedbecause of the plant defense mechanism [47].
3.2. Antioxidant Activities Estimation (DPPH, FRAP, ABTS and TAC)
The antioxidant activities were determined by DPPH, FRAP, ABTS and TAC, which arethe most preferred methods for the determination of antioxidant potential [37]. Accordingto DPPH assay, nectarine (1.42 ± 0.04 mg AAE/g) and apricot presented similar antioxi-dant potential which were significantly higher (p ≤ 0.05) than peach and plum samples(Table 1). Our DPPH results are consistent with previous study conducted on Californiangrown peach, plum and nectarine [20]. However, compared with another study on plum inNorth Pakistan, our DPPH value was slightly higher [48]. This variation could be explainedby the different extraction solvent used, cultivars, growing region and climatic conditions.The previous study used water and acetone to extract phenolic compounds, while we usedethanol for extraction of phenolic compounds. It may suggest that ethanol could be a bettersolvent for phenolics extraction.
The FRAP activity of nectarine (0.98 ± 0.02 mg AAE/g) and apricot was higher ascompared to other stone fruit samples. Compared with the “Gönci magyarkajszi” and “Pre-venta” apricot (1.76 AAE mg/ml) grown in Central Hungary, our stone fruits’ antioxidantpotential was lower might be due to the difference of varieties and growing region [49].In another study, FRAP of 27 different apricot cultivars ranged from 0.47 to 10.35 mmolAAE/L, which was also slightly lower than our result [50]. It has been emphasized that thevariation of reducing capacity could be due to diverse regions, cultivars and harvest yearand type of solvents used for extraction [50]. In addition, it was suggested that the FRAPactivity was associated with types of phenolics and their composition. The extractablephenolic compounds showed higher FRAP values as compared to non-extractable phenoliccompounds [51].
In ABTS, peach waste (0.43 ± 0.09 mg AAE/g) had the greatest radical scavengingcapacity (p ≤ 0.05) compared to other stone fruit waste. Compared with a previous study,ABTS of 17 Luxembourgish grown plum cultivars range from 195 to 386 mg AAE/100 g,our data was slightly higher than Kaulmann, et al. [52] study. The variation is due tothe extracted solvent of methanol, which was different from our 70% ethanolic extrac-tion. However, another study focused on dry apricot fruit in Jammu showed higherABTS [53]. In terms of TAC, nectarine waste (0.91 ± 0.09 mg AAE/g) presented the highestTAC value, followed by plum and apricot. The previous work about peach and apricotgrowing in Algeria showed lower antioxidant capacity as compared to our study [54].The variation could be related to differences in varieties and growing region and typeof solvent extraction. Another study on stone fruits of northern Greece showed slightlyhigher results of 15.13 ± 4.44 µmol AAE/g for plum, 14.16 ± 4.12 µmol AAE/g for peach,10.40 ± 0.56 µmol AAE/g for nectarine and 4.00 ± 0.80 µmol AAE/g for apricot as com-pared to our study [55]. The variation could be due to difference in solute to solvent ratio,grown region and cultivars. Furthermore, Hui, et al. [51] argued that extractable phenoliccompounds contribute more to total antioxidant capacity than non-extractable phenoliccompounds. Combined with our data, nectarine waste may contain more extractablephenolic compounds than other stone fruits waste.
Antioxidants 2021, 10, 234 8 of 22
3.3. Correlation between Phenolic Compounds and Antioxidant Assays
Correlation analysis was applied to explain the relationship between TPC, TFC, TTCand antioxidant assays (DPPH, FRAP, ABTS and TAC), performed with Pearson’s correla-tion test (Table 2). The TPC was strongly positively correlated with TFC (r = 0.982, p≤ 0.01),whereas DPPH is positively correlated with ABTS (r = 0.960, p ≤ 0.05). Since flavonoids arebenzo-γ-pyrone derivatives composed of polyphenolic and pyrane rings [56], the strongand positive correlation between TPC and TFC could indicate that phenolic content in stonefruits waste are composed of a high concentration of flavonoids. The similar relationshipbetween TPC and TFC was also confirmed in the previous study [41].
Table 2. Pearson’s correlation coefficients (r) for the relationships between antioxidant assays andphenolic content.
** Significant correlation with p ≤ 0.01; * Significant correlation with p ≤ 0.05.
In terms of antioxidant assays, DPPH and ABTS were applied to determine the freeradical scavenging capacity. The positive relationship between DPPH and ABTS has alsobeen confirmed in previous study [41]. However, another antioxidant assay, FRAP, was notstrongly correlated with DPPH and ABTS. Since these three assays measure the scavengingability differently, the stability of radicals and the mechanisms can influence the result [8].For instance, it has been reported that DPPH was applied to detect the hydrogen donator,while FRAP was based on electron transfer [57]. The difference between the result of FRAPand DPPH has also been found in the study of Dudonne, et al. [58].
However, the correlation between antioxidant activities and phenolic content wascontradictory. Some authors observed that there were strong correlations between antiox-idant activities and total phenolic content, whereas some represent low or no relation-ship [41,56,59]. Since we did not find a high correlation, it could be inferred that phenoliccompounds are not the only bioactive compounds in stone fruits waste which contributeto antioxidant activity. In addition, although plum had higher TPC and TFC value, theantioxidant activity of plum was lower. Since all the antioxidant assays are not only aimedat estimating phenolic compounds but all types of phytochemicals and bioactive com-pounds, the antioxidant results may be influenced by other phytochemicals, for example,the carotenoids [60]. However, we could conclude that stone fruits waste contains manyphenolics and has antioxidant potential. Therefore, we conducted LC-ESI-QTOF-MS/MSand HPLC-PDA to qualify and quantify phenolics present in stone fruits waste.
3.4. Phenolic Identification by LC-ESI-QTOF-MS/MS
LC-ESI-QTOF-MS/MS was applied to analyze the phenolic compounds from the stonefruits samples in negative and positive ionization modes. All the compounds identified in thestone fruits samples were based on the mass-to-charge (m/z) values of mass spectrometry innegative ionization and positive ionization modes (Supplementary data—Figures S1 and S2).The Agilent LC/MS MassHunter Qualitative Software and Personal Compound Databaseand Library (PCDL) with their online databases were applied to analyze the compounds.Among them, we selected compounds with a PCDL score more than 80 and a mass error<±5 ppm to conduct further characterization and verification.
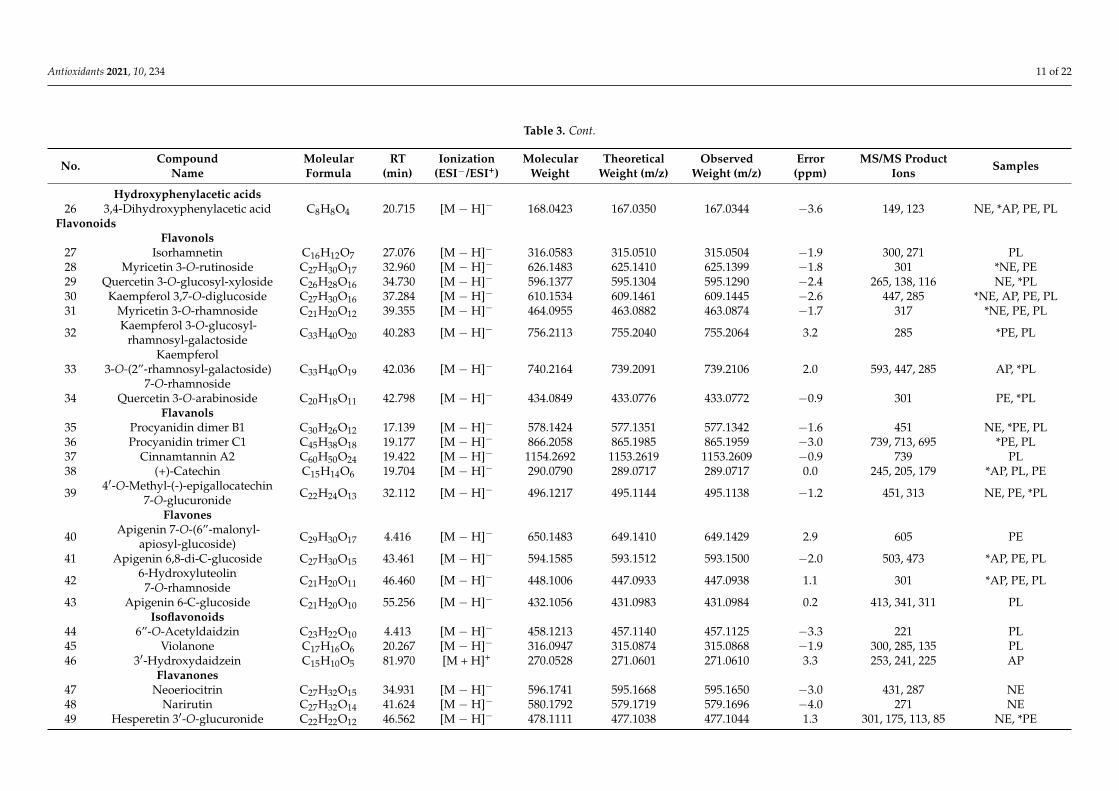
As shown in Table 3, identified compounds were listed along with their molecularformula, retention times, ionization modes, molecular weight, theoretical weight, observedwight, mass error and MS/MS product ions. LC-ESI-QTOF-MS/MS has tentatively char-
Antioxidants 2021, 10, 234 9 of 22
acterized 59 phenolic compounds in four stone fruits waste including 26 phenolic acids,28 flavonoids, 1 lignans and 4 other polyphenols.
3.4.1. MS/MS Based Characterization of Phenolic CompoundsPhenolic Cids
In terms of phenolic acids, four sub-classes have been found in stone fruit wastesamples, which includes 16 hydroxycinnamic acids, 6 hydroxybenzoic acids, 3 hydrox-yphenylpropanoic acids and 1 hydroxyphenylacetic acid.
Hydroxycinnamic acidsHydroxycinnamic acids, which are commonly found in different fruits, such as peach,
plum, blueberry and mango, have been reported to have antioxidant potential [61]. In thisstudy, 16 hydroxycinnamic acids were detected, which showed the largest number thanany other sub-classes.
The presence of 3-caffeoylquinic acid (Compound 6 with [M−H]− m/z at 353.0864) wasconfirmed by the product ions of m/z 253 [M−H−HCOOH− 3H2O (loss of 100 Da), m/z190 [M−H− C6H5O2 − 3H2O] (loss of 163 Da) and m/z 144 [M−H− C7H11O6 −H2O](loss of 209 Da) from the parent ion [62]. A similar compound, 3-caffeoylquinic acid waspreviously found in Chinese peach and nectarine by UPLC-ESI-QTOF-MS analysis andwas reported as natural antioxidant [63,64]. Ferulic acid (Compound 9) was presented innectarine, plum and apricot with [M−H]−m/z at 193.0501 in the negative ionization mode.The identification of ferulic acid was achieved by the MS2 experiment which displayed theproduct ions at m/z 178, m/z 149 and m/z 134, indicating the loss of CH3, CO2 and CH3with CO2 from the precursor, respectively [65]. Regarding to previous research, ferulic acidhas been characterized in fresh Japanese plums by HPLC [66]. Furthermore, ferulic acidwas reported to have the ability of free radical scavenging and inhibit the toxicity of freeradicals [67].
Compounds 7, 11, 13 which were characterized to be 3-feruloylquinic acid, 3-p-coumaroylquinic acid and caffeic acid, respectively, were reported in different stone fruitsin previous studies [29,66,68]. To our best knowledge, isoferulic acid 3-sulfate, cinnamicacid, caffeoyl glucose, 1-sinapoyl-2-feruloylgentiobiose and hydroxycaffeic acid (Com-pounds 2, 3, 4, 14, 15) were identified first time in stone fruits; however, they were alreadyreported in other plants. For example, isoferulic acid 3-sulfate and hydroxycaffeic acidhave been found in berries in previous studies [69,70], Compound 3 was reported in peachleaves, sesame and almond [71,72]. Moreover, Chokanan mango was reported to be rich incaffeoyl glucose (Compound 4) [73] and 1-Sinapoyl-2-feruloylgentiobiose (Compound 14)has been found in various of cruciferous vegetables [74].
Hydroxybenzoic acidsHydroxybenzoic acids were widely present in fruits and vegetables and were re-
ported to have antioxidant activity and have the potential to ameliorate cardiovasculardisorders [75].
In present work, six hydroxybenzoic acids were identified and tentatively character-ized. Compound 20 ([M − H]− m/z at 137.0240) and Compound 21 ([M − H]− m/z at153.0190) were tentatively characterized as 2-hydroxybenzoic acid and 2,3-dihydroxybenzoicacid based on the product ions at m/z 93 and at m/z 109, due to the loss of CO2 (44 Da)from the precursor ions [76,77]. In previous studies, these two phenolic acids have beenreported as important functional compounds in peach [78,79]. Compound 17, Compound18 and Compound 22 were tentatively characterized to be ellagic acid acetyl-xyloside, gallicacid 4-O-glucoside and 3-O-methylgallic acid, respectively. To the best of our knowledge,these compounds were identified for the first time in stone fruits; however, they alreadyreported in guava, raspberry and seaweed [80–82].
Antioxidants 2021, 10, 234 10 of 22
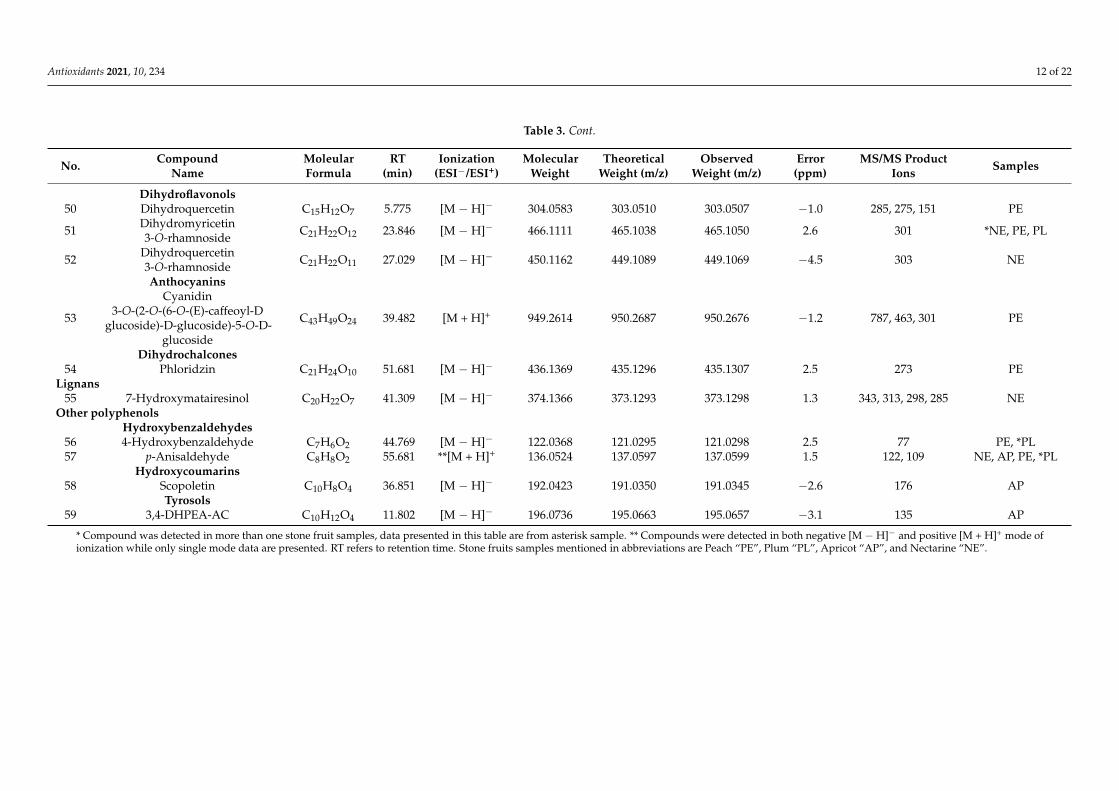
Table 3. Qualitative characterization of phenolic compounds in stone fruits waste by Liquid chromatography coupled with electrospray-ionization quadrupole time-of-flight massspectrometry (LC-ESI-QTOF-MS/MS).
* Compound was detected in more than one stone fruit samples, data presented in this table are from asterisk sample. ** Compounds were detected in both negative [M − H]− and positive [M + H]+ mode ofionization while only single mode data are presented. RT refers to retention time. Stone fruits samples mentioned in abbreviations are Peach “PE”, Plum “PL”, Apricot “AP”, and Nectarine “NE”.
Antioxidants 2021, 10, 234 13 of 22
Hydroxyphenylpropanoic acids and hydroxyphenylacetic acidsAccording to our results, three hydroxyphenylpropanoic acids and one hydroxypheny-
lacetic acid were tentatively characterized in stone fruit waste samples.Compound 23 (Dihydroferulic acid 4-O-glucuronide) was detected only in the negative
ionization mode with the [M − H]− precursor ions at m/z 371.0988. The characteristic lossof the glucuronide (176 Da) moiety was observed, which produced the product ions at m/z195 [83]. Most of the hydroxyphenylpropanoic acids and hydroxyphenylacetic acids weredetected for the first time in stone fruits waste. Two out of three hydroxyphenylpropanoicacid derivatives (Compound 24, 25) were detected only in peach and have been reportedin palm fruit [40]. Dihydroferulic acid 4-O-glucuronide (Compound 23) was reported inOpuntia ficus-indica fruit with antioxidant potential by Aruwa, et al. [84]. Compound 26was identified in all stone fruits and previously reported in different mango peel samplesby Peng, et al. [37].
Flavonoids
Focusing on flavonoids, eight sub-classes have been identified in stone fruit samples,including eight flavonols, five flavanols, four flavones, three isoflavonoids, three flavanones,three dihydroflavonols, one anthocyanin and one dihydrochalcone.
FlavonolsFlavonols are common flavonoids and have been found to have antioxidant and
antiatherogenic properties [85]. In this research, eight flavonols were tentatively character-ized. Isorhamnetin (Compound 27, [M − H]− at m/z 315.0504) was found only in plumin negative mode, and identified according to the product ions at m/z 300 and m/z 271,corresponding to the loss of CH3 and CO2 from the precursor [86]. To our best knowledge,it is the first time to report this compound in stone fruits; however, it was previously foundin citrus fruits [87]. Three kaempferol derivatives including Compound 30 (Kaempferol3,7-O-diglucoside), Compound 32 (Kaempferol 3-O-glucosyl-rhamnosyl-galactoside) andCompound 33 (Kaempferol 3-O-(2”-rhamnosyl-galactoside) 7-O-rhamnoside) were tenta-tively characterized in our study. These derivatives has been reported previously in peachand other fruit samples [88]. Compound 30 was also detected in all stone fruit samples andpreviously reported in saffron [89].
FlavanolsFlavanols are reported in many fruits and vegetables with antioxidant and cardio-
vascular disease prevention properties [90]. In this study, five flavanols were tentativelyidentified in stone fruits waste.
Compound 35 and Compound 36 were identified as procyanidin dimer B1 and pro-cyanidin trimer C1 appearing in most of the stone fruit waste samples based on the [M −H]− m/z at 577.1342 and [M − H]− m/z at 865.1959. The loss of 126 Da (phloroglucinol)from the precursor allowed the identification of procyanidin dimer B1 [91], while the iden-tification of a procyanidin trimer C1 was achieved by comparing the MS2 with a previousstudy [92], which showed product ions at m/z 739, m/z 713 and m/z 695, representing the126 Da loss of the heterocyclic ring fission (HRF) reaction, 152-Da loss of retro-Diels–Alder(RDA) and further loss of H2O. Procyanidin dimer B1 was found in peach, nectarine andplum as reported in the previous literature [63,66]. In contrast, procyanidin trimer C1 wasfirst identified in stone fruits but it was previously found in mutamba fruit [93]. Compound(37), which appeared only in plum, was identified as Cinnamtannin A2. To the best ofour knowledge, it was also found in stone fruits for the first time, but it has been reportedpreviously in strawberry [92]. Compound (38) was detected as (+)-catechin in apricot,plum and peach samples. It has been confirmed that (+)-catechin is mostly found in stonefruits including plum, apricot, peach and cherry [68].
Flavones, isoflavonoids and flavanonesFlavones are components of various of edible plants, including fruits and vegetables
and also present in beverages such as tea, wine and coffee. Because of their antioxidant,anti-microbial and anti-inflammatory activities, flavones could play an important role in
Antioxidants 2021, 10, 234 14 of 22
metabolic diseases [94]. In terms of stone fruits, we tentatively characterized four flavones,three isoflavonoids and three flavanones. Compound 40 presenting only in peach in thenegative mode was proposed as apigenin 7-O-(6”-malonyl-apiosyl-glucoside) based on the[M − H]− m/z at 649.1429 and confirmed by the product ions at m/z 605, correspondingto the loss of CO2 (44 Da) from the precursor ion [95]. Compound 47 was tentativelycharacterized as neoeriocitrin based on the precursor ions [M − H]− at m/z 595.1650. Inthe MS/MS experiment, neoeriocitrin was confirmed by product ions at m/z 431 [M − H− rhamnoside − H2O] and m/z 287 [M − H − rhamnoside − glucoside] [96]. To the bestof our knowledge, most of these derivatives were detected for the first time in stone fruitswaste. However, they could be found in other edible plants.
Compound 43, Apigenin 6-C-glucoside was detected in the plum sample, previousreported in Bryonia dioica and citrus fruits [97,98]. Another flavone (Compound 40) whichwas found in the peach sample was previously reported in tomato by Lucini, et al. [99].Two of the flavones (Compounds 41, 42) were found in apricot, peach, and plum andwere identified as apigenin 6,8-di-C-glucoside and 6-hydroxyluteolin 7-O-rhamnoside,respectively. Apigenin 6,8-di-C-glucoside was reported in tropical citrus fruits, while6-hydroxyluteolin 7-O-rhamnoside were found in dry seed, including sesame and sun-flower [100,101]. Compounds 44 and 45 were identified in peach and were previouslydetected in soy milk and roots of Pongamia pinnata, respectively [102,103]. Compound (46),found only in apricot, has been reported in pomegranate in a previous study [104]. Asfor flavanones, neoeriocitrin and narirutin were also detected in nectarine in our study.Previously, it has been reported that chinotto also contained neoeriocitrin [105], whilenarirutin was identified in citrus fruits [106].
Dihydroflavonols, dihydrochalcones and anthocyaninsDihydroflavonols, dihydrochalcones and anthocyanins were proved to have free radi-
cal scavenging capacity [107]. In our study, three dihydroflavonols, one dihydrochalconeand one anthocyanin have been identified in stone fruits.
Dihydroquercetin (Compound 50) and dihydromyricetin 3-O-rhamnoside (Compound52) and were detected in negative mode with [M − H]− m/z at 303.0507 and m/z 465.1050.The identity of dihydroquercetin was confirmed by the fragment ions at m/z 285, m/z275 and m/z 151, corresponding to the loss of H2O, CO and 152 Da loss by RDA cleav-age [108], while dihydromyricetin 3-O-rhamnoside was confirmed by the product ion atm/z 301 [M − H − rhamnose, loss of 164 Da] [109]. Two out of three dihydroflavonols(Compounds 50 and 54) were identified in the peach sample and these compounds werealready reported in different peach varieties [110]. Dihydroquercetin 3-O-rhamnoside(Compound 52) was found only in nectarine. Previously, it has also been reported in grapeskins [111]. Dihydromyricetin 3-O-rhamnoside (Compound 51) which was detected innectarine, peach and plum has been reported in the khat plant which grew in Ethiopia [112].
Lignans
Lignans are bioactive compounds with anti-inflammatory, anti-oxidant and anti-tumoractivities [113]. Only one lignan was tentatively characterized in our study. Compound 55was identified as 7-hydroxymatairesinol according to the [M − H]− at m/z 373.1298 in nec-tarine. As per our best knowledge, 7-hydroxymatairesinol was reported first time in stonefruits; however, it was found in various seeds, including sunflower and pumpkin [101].
Other polyphenols
As for other polyphenols, three sub-classes in stone fruits waste have been character-ized, which include two hydroxybenzaldehydes, one hydroxycoumarin and one tyrosol.
Compound 56 appeared both in peach and plum and was tentatively characterizedas 4-hydroxybenzaldehyde based on the precursor ion at [M − H]− at m/z 121.0298 andconfirmed based on the MS2 fragmentation, which exhibited the loss of CO2 from theprecursor, resulting in the product ion at m/z 77 [114]. It has been reported in sweetcherry, which is another stone fruit [115]. To the best of our knowledge, p-anisaldehyde
Antioxidants 2021, 10, 234 15 of 22
and scopoletin (Compounds 57 and 58) which were presented in different stone fruits,were first identified in stone fruits while they were previously found in hawthorn [116].3,4-DHPEA-AC (Compound 59), which belongs to tyrosol derivatives, has also been foundin olive oil [117].
The results of LC-ESI-QTOF-MS/MS illustrated that phenolic compounds are im-portant components of stone fruits, especially hydroxycinnamic acid derivatives, hydrox-ybenzoic acid derivatives, flavonols, flavanols and other polyphenols. These phenoliccompounds have significant free radical scavenging capacity and antioxidant activity.Hence, stone fruits waste may have antioxidant potential and could be used for functionalfoods, nutraceuticals and pharmaceuticals.
3.4.2. Distribution of Phenolic Compounds—Venn Diagram
As shown in Figure 1, Venn diagrams were applied to indicate the distribution of thephenolic compounds in four stone fruits’ waste. The comparison illustrated that there weredifferences between the composition of phenolic compounds in these four stone fruits.
Figure 1. Venn diagram of phenolic compounds presented in stone fruits waste samples. (A) showsthe relations of total phenolic compounds present in stone fruits waste; (B) shows the relations ofphenolic acids in present in stone fruits waste; (C) shows the relations of flavonoids present in stonefruits waste; (D) shows the relations of other phenolic compounds present in stone fruits waste.
Based on Figure 1A, a total of 232 phenolic compounds were identified in four stonefruits waste samples. Among them, 11.6% phenolic compounds were detected in allsamples. According to Figure 1B–D, 23.6% phenolic acids, 9.1% flavonoids and 6% otherphenolic compounds were found in all four samples, respectively. The proportion ofcommon characterized compounds of flavonoids in all stone fruits samples was similar
Antioxidants 2021, 10, 234 16 of 22
to that of the total phenolic compounds. This could indicate that, although the peach,nectarine, plum and apricot are different fruits, their compositions of flavonoids are likelyto be similar. However, the proportions of shared compounds of phenolic acids andother phenolic compounds were different from that of total phenolic compounds. It couldbe argued that phenolic acids and other phenolic compounds contributed more to thedifferences in phenolic compounds and antioxidant activities among these stone fruits.In addition, by comparing the shared compounds between any two stone fruits samples,the phenolic composition of peach and nectarine were similar. However, the compositionof apricot was different from that of peach, nectarine and plum. Previous study has alsoreported that the composition of antioxidants in peach and apricot were significantlydifferent [118]. Furthermore, it has been found that genotype, pre-harvest, post-harvestand climatic conditions could influence the phenolic profile of stone fruits [119,120].
By conducting the Venn diagram, we could argue that the composition of phenoliccompounds is different among four stone fruits. However, the influence of specific phenoliccompounds and related bioactivities should be investigated in future research.
3.5. HPLC-PDA Analysis
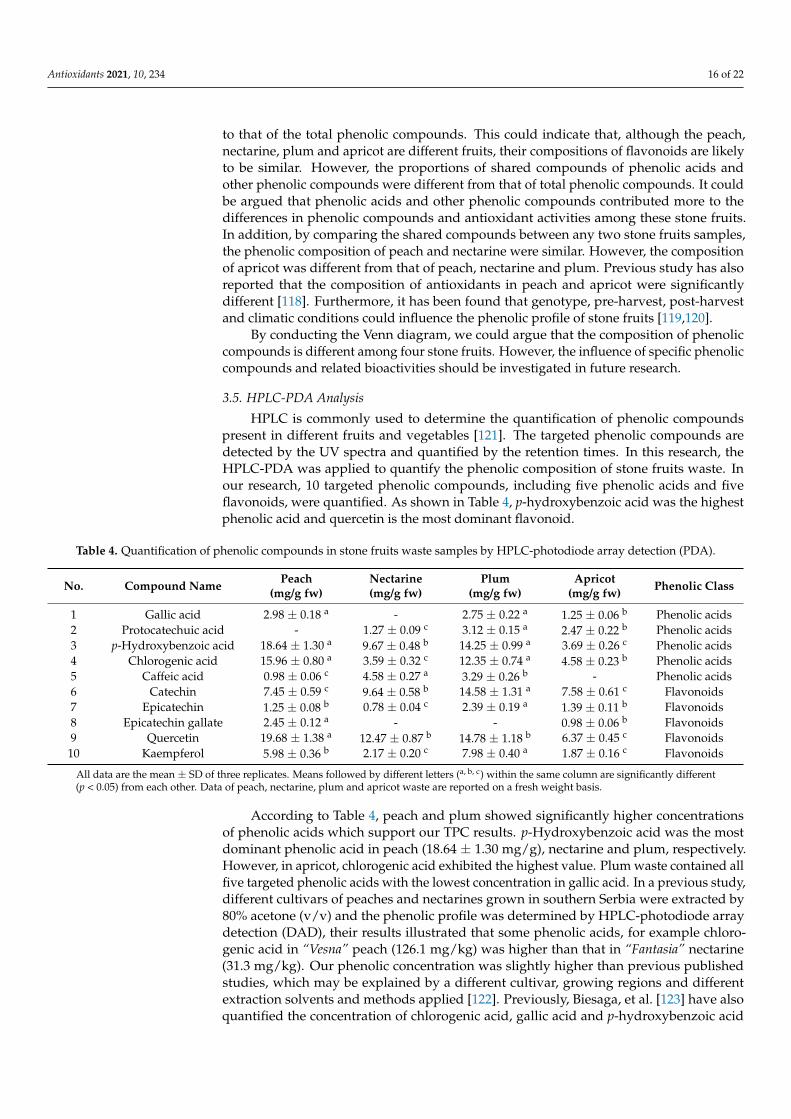
HPLC is commonly used to determine the quantification of phenolic compoundspresent in different fruits and vegetables [121]. The targeted phenolic compounds aredetected by the UV spectra and quantified by the retention times. In this research, theHPLC-PDA was applied to quantify the phenolic composition of stone fruits waste. Inour research, 10 targeted phenolic compounds, including five phenolic acids and fiveflavonoids, were quantified. As shown in Table 4, p-hydroxybenzoic acid was the highestphenolic acid and quercetin is the most dominant flavonoid.
Table 4. Quantification of phenolic compounds in stone fruits waste samples by HPLC-photodiode array detection (PDA).
No. Compound Name Peach(mg/g fw)
Nectarine(mg/g fw)
Plum(mg/g fw)
Apricot(mg/g fw) Phenolic Class
1 Gallic acid 2.98 ± 0.18 a - 2.75 ± 0.22 a 1.25 ± 0.06 b Phenolic acids2 Protocatechuic acid - 1.27 ± 0.09 c 3.12 ± 0.15 a 2.47 ± 0.22 b Phenolic acids3 p-Hydroxybenzoic acid 18.64 ± 1.30 a 9.67 ± 0.48 b 14.25 ± 0.99 a 3.69 ± 0.26 c Phenolic acids4 Chlorogenic acid 15.96 ± 0.80 a 3.59 ± 0.32 c 12.35 ± 0.74 a 4.58 ± 0.23 b Phenolic acids5 Caffeic acid 0.98 ± 0.06 c 4.58 ± 0.27 a 3.29 ± 0.26 b - Phenolic acids6 Catechin 7.45 ± 0.59 c 9.64 ± 0.58 b 14.58 ± 1.31 a 7.58 ± 0.61 c Flavonoids7 Epicatechin 1.25 ± 0.08 b 0.78 ± 0.04 c 2.39 ± 0.19 a 1.39 ± 0.11 b Flavonoids8 Epicatechin gallate 2.45 ± 0.12 a - - 0.98 ± 0.06 b Flavonoids9 Quercetin 19.68 ± 1.38 a 12.47 ± 0.87 b 14.78 ± 1.18 b 6.37 ± 0.45 c Flavonoids10 Kaempferol 5.98 ± 0.36 b 2.17 ± 0.20 c 7.98 ± 0.40 a 1.87 ± 0.16 c Flavonoids
All data are the mean ± SD of three replicates. Means followed by different letters (a, b, c) within the same column are significantly different(p < 0.05) from each other. Data of peach, nectarine, plum and apricot waste are reported on a fresh weight basis.
According to Table 4, peach and plum showed significantly higher concentrationsof phenolic acids which support our TPC results. p-Hydroxybenzoic acid was the mostdominant phenolic acid in peach (18.64 ± 1.30 mg/g), nectarine and plum, respectively.However, in apricot, chlorogenic acid exhibited the highest value. Plum waste contained allfive targeted phenolic acids with the lowest concentration in gallic acid. In a previous study,different cultivars of peaches and nectarines grown in southern Serbia were extracted by80% acetone (v/v) and the phenolic profile was determined by HPLC-photodiode arraydetection (DAD), their results illustrated that some phenolic acids, for example chloro-genic acid in “Vesna” peach (126.1 mg/kg) was higher than that in “Fantasia” nectarine(31.3 mg/kg). Our phenolic concentration was slightly higher than previous publishedstudies, which may be explained by a different cultivar, growing regions and differentextraction solvents and methods applied [122]. Previously, Biesaga, et al. [123] have alsoquantified the concentration of chlorogenic acid, gallic acid and p-hydroxybenzoic acid
Antioxidants 2021, 10, 234 17 of 22
from Polish grown plums at different ripening stages and reported that the concentrationof phenolic acids decrease during ripening.
In terms of flavonoids, peach and plum also contain higher concentration than others,which confirms the TFC result. Quercetin was the most dominant flavonoid in peach(19.68 ± 1.38 mg/g), nectarine and plum while catechin is the highest flavonoid in apri-cot. Moreover, peach contained more flavonoids than nectarine was in agreement of theprevious study [122]. Preciously, Campbell and Padilla-Zakour [118] conducted HPLCto determine several flavonoids in canned American grown peaches and apricots whichwere extracted by methanol/water solution. However, the concentration of flavonoidsin “Harogem” apricot were higher than that in “Redhaven” peach, which is different toour research. Regarding the catechin and epicatechin, the concentration of catechin washigher than epicatechin in all four Australian grown stone fruits waste. Previously, Liao,et al. [124] quantified the concentration of catechin and epicatechin in Georgian grownpeach cultivars, including “Carored”, “Golden Prince”, “Ruby Prince”, “August Prince” and“O’Henry” and confirmed that catechin and epicatechin in peach were higher than nectarine.The difference in results could be due to different extraction method and type of solventsand samples [125].
4. Conclusions
Based on this research, it is concluded that plum waste contained higher concentra-tions of total phenolic compounds and flavonoids than other stone fruit wastes, whileapricot had higher concentration of tannins. Moreover, nectarine had higher antioxidantcapacity in DPPH, FRAP and TAC assays as compared to other stone fruit waste. TheLC-ESI-QTOF-MS/MS showed phenolic profiling in stone fruit waste while HPLC-PDAconfirmed that targeted phenolic compounds were significantly higher in plum and peachas compared to other stone fruit waste. In short, the obtained results could support theapplications and repurposing of stone fruits waste for functional foods, feed, nutraceuticalsand pharmaceutical industries.
Supplementary Materials: The following are available online at https://www.mdpi.com/2076-3921/10/2/234/s1. Figure S1: LC-ESI-QTOF-MS/MS basic peak chromatograph (BPC) for characteriza-tion of phenolic compounds of stone fruits waste. Figure S2: Extracted ion chromatogram of stonefruits waste samples and their mass spectra.
Author Contributions: Conceptualization, methodology, formal analysis, validation and investiga-tion, Y.H., Z.W. and H.A.R.S.; resources, H.A.R.S., C.J.B. and F.R.D.; writing—original draft prepara-tion, Y.H. and H.A.R.S.; writing—review and editing, Y.H., Z.W., C.J.B., H.A.R.S. and F.R.D.; supervi-sion, H.A.R.S., and F.R.D.; idea-sharing, H.A.R.S.; C.J.B. and F.R.D.; funding acquisition, H.A.R.S.,F.R.D. and C.J.B. All authors have read and agreed to the published version of the manuscript.
Funding: This research was funded by the University of Melbourne under the “McKenzie FellowshipScheme” (Grant No. UoM-18/21), the “Richard WS Nicholas Agricultural Science Scholarship” andthe “Faculty Research Initiative Funds” funded by the Faculty of Veterinary and Agricultural Sciences,The University of Melbourne, Australia and “The Alfred Deakin Research Fellowship” funded byDeakin University, Australia.
Institutional Review Board Statement: Not applicable.
Informed Consent Statement: Not applicable.
Data Availability Statement: The data presented in this study are available in the supplementary material.
Acknowledgments: We would like to thank Nicholas Williamson, Shuai Nie and Michael Leemingfrom the Mass Spectrometry and Proteomics Facility, Bio21 Molecular Science and BiotechnologyInstitute, the University of Melbourne, VIC, Australia for providing access and support for the use ofHPLC-PDA and LC-ESI-QTOF-MS/MS and data analysis.
Conflicts of Interest: The authors declare no conflict of interest.
References1. Parfitt, J.; Barthel, M.; Macnaughton, S. Food waste within food supply chains: Quantification and potential for change to 2050.
Philos. Trans. R. Soc. B Biol. Sci. 2010, 365, 3065–3081. [CrossRef] [PubMed]2. Edwards, F.; Mercer, D. Food waste in australia: The freegan response. Sociol. Rev. 2012, 60, 174–191. [CrossRef]3. Devin, B.; Richards, C. Food waste, power, and corporate social responsibility in the australian food supply chain. J. Bus. Ethics
2018, 150, 199–210. [CrossRef]4. Riva, S.C.; Opara, U.O.; Fawole, O.A. Recent developments on postharvest application of edible coatings on stone fruit: A review.
Sci. Hortic. 2020, 262, 109074. [CrossRef]5. Aschemann-Witzel, J.; De Hooge, I.; Amani, P.; Bech-Larsen, T.; Oostindjer, M. Consumer-related food waste: Causes and
potential for action. Sustainability 2015, 7, 6457–6477. [CrossRef]6. Dhillon, G.S.; Kaur, S.; Brar, S.K. Perspective of apple processing wastes as low-cost substrates for bioproduction of high value
products: A review. Renew. Sustain. Energy Rev. 2013, 27, 789–805. [CrossRef]7. Cheok, C.Y.; Mohd Adzahan, N.; Abdul Rahman, R.; Zainal Abedin, N.H.; Hussain, N.; Sulaiman, R.; Chong, G.H. Current trends
of tropical fruit waste utilization. Crit. Rev. Food Sci. Nutr. 2018, 58, 335–361. [CrossRef] [PubMed]8. Liu, H.; Jiang, W.; Cao, J.; Ma, L. Evaluation of antioxidant properties of extractable and nonextractable polyphenols in peel and
flesh tissue of different peach varieties. J. Food Process. Preserv. 2018, 42, e13624. [CrossRef]9. Wills, R.B.; Scriven, F.M.; Greenfield, H. Nutrient composition of stone fruit (prunus spp.) cultivars: Apricot, cherry, nectarine,
peach and plum. J. Sci. Food Agric. 1983, 34, 1383–1389. [CrossRef] [PubMed]10. LaRue, J.H. Peaches, Plums, and Nectarines: Growing and Handling for Fresh Market; UCANR Publications: Davis, CA, USA, 1989;
Volume 3331.11. Noratto, G.; Porter, W.; Byrne, D.; Cisneros-Zevallos, L. Identifying peach and plum polyphenols with chemopreventive potential
against estrogen-independent breast cancer cells. J. Agric. Food Chem. 2009, 57, 5219–5226. [CrossRef]12. Tomás-Barberán, F.A.; Ruiz, D.; Valero, D.; Rivera, D.; Obón, C.; Sánchez-Roca, C.; Gil, M.I. Health benefits from pomegranates
and stone fruit, including plums, peaches, apricots and cherries. Bioact. Fruit: Health Benefits Funct. Foods 2013, 19, 125–167.13. Urquiaga, I.; Leighton, F. Plant polyphenol antioxidants and oxidative stress. Biol. Res. 2000, 33, 55–64. [CrossRef] [PubMed]14. Abbas, M.; Saeed, F.; Anjum, F.M.; Afzaal, M.; Tufail, T.; Bashir, M.S.; Ishtiaq, A.; Hussain, S.; Suleria, H.A.R. Natural polyphenols:
An overview. Int. J. Food Prop. 2017, 20, 1689–1699. [CrossRef]15. Balasundram, N.; Sundram, K.; Samman, S. Phenolic compounds in plants and agri-industrial by-products: Antioxidant activity,
occurrence, and potential uses. Food Chem. 2006, 99, 191–203. [CrossRef]16. Chung, K.-T.; Wong, T.Y.; Wei, C.-I.; Huang, Y.-W.; Lin, Y. Tannins and human health: A review. Crit. Rev. Food Sci. Nutr. 1998, 38,
[CrossRef] [PubMed]18. Rasul Suleria, H.A.; Sadiq Butt, M.; Muhammad Anjum, F.; Saeed, F.; Batool, R.; Nisar Ahmad, A. Aqueous garlic extract and its
phytochemical profile; special reference to antioxidant status. Int. J. Food Sci. Nutr. 2012, 63, 431–439. [CrossRef] [PubMed]19. Zerva, E.; Abatis, D.; Skaltsounis, A.; Fokialakis, N. Development and application of a methodology for the recovery of high
added value products from peach industry waste. Planta Med. 2012, 78, PJ98. [CrossRef]20. Gil, M.I.; Tomás-Barberán, F.A.; Hess-Pierce, B.; Kader, A.A. Antioxidant capacities, phenolic compounds, carotenoids, and
vitamin c contents of nectarine, peach, and plum cultivars from california. J. Agric. Food Chem. 2002, 50, 4976–4982. [CrossRef]21. Michalska, A.; Wojdyło, A.; Majerska, J.; Lech, K.; Brzezowska, J. Qualitative and quantitative evaluation of heat-induced changes
in polyphenols and antioxidant capacity in prunus domestica l. By-products. Molecules 2019, 24, 3008. [CrossRef]22. Vizzotto, M.; Cisneros-Zevallos, L.; Byrne, D.H.; Ramming, D.W.; Okie, W. Large variation found in the phytochemical and
antioxidant activity of peach and plum germplasm. J. Am. Soc. Hortic. Sci. 2007, 132, 334–340. [CrossRef]23. Senter, S.; Robertson, J.; Meredith, F. Phenolic compounds of the mesocarp of cresthaven peaches during storage and ripening. J.
Food Sci. 1989, 54, 1259–1268. [CrossRef]24. Subbiah, V.; Zhong, B.; Nawaz, M.A.; Barrow, C.J.; Dunshea, F.R.; Suleria, H.A. Screening of phenolic compounds in australian
grown berries by lc-esi-qtof-ms/ms and determination of their antioxidant potential. Antioxidants 2021, 10, 26. [CrossRef]25. Wang, Z.; Barrow, C.J.; Dunshea, F.R.; Suleria, H.A.R. A comparative investigation on phenolic composition, characterization and
antioxidant potentials of five different australian grown pear varieties. Antioxidants 2021, 10, 151. [CrossRef] [PubMed]26. Naczk, M.; Shahidi, F. Extraction and analysis of phenolics in food. J. Chromatogr. A 2004, 1054, 95–111. [CrossRef]27. Yu, J.; Ahmedna, M.; Goktepe, I. Effects of processing methods and extraction solvents on concentration and antioxidant activity
of peanut skin phenolics. Food Chem. 2005, 90, 199–206. [CrossRef]28. Šeruga, M.; Novak, I.; Jakobek, L. Determination of polyphenols content and antioxidant activity of some red wines by differential
pulse voltammetry, hplc and spectrophotometric methods. Food Chem. 2011, 124, 1208–1216. [CrossRef]29. Wu, X.; An, X.; Yu, M.; Ma, R.; Yu, Z. 1-methylcyclopropene treatment on phenolics and the antioxidant system in postharvest
peach combined with the liquid chromatography/mass spectrometry technique. J. Agric. Food Chem. 2018, 66, 6364–6372.[CrossRef] [PubMed]
30. Sójka, M.; Kołodziejczyk, K.; Milala, J.; Abadias, M.; Viñas, I.; Guyot, S.; Baron, A. Composition and properties of the polyphenolicextracts obtained from industrial plum pomaces. J. Funct. Foods 2015, 12, 168–178. [CrossRef]
34. Gouveia, S.; Castilho, P.C. Antioxidant potential of artemisia argentea l’hér alcoholic extract and its relation with the phenoliccomposition. Food Res. Int. 2011, 44, 1620–1631. [CrossRef]
35. Stavrou, I.J.; Christou, A.; Kapnissi-Christodoulou, C.P. Polyphenols in carobs: A review on their composition, antioxidantcapacity and cytotoxic effects, and health impact. Food Chem. 2018, 269, 355–374. [CrossRef]
36. Sogi, D.S.; Siddiq, M.; Greiby, I.; Dolan, K.D. Total phenolics, antioxidant activity, and functional properties of ‘tommy atkins’mango peel and kernel as affected by drying methods. Food Chem. 2013, 141, 2649–2655. [CrossRef] [PubMed]
37. Peng, D.; Zahid, H.F.; Ajlouni, S.; Dunshea, F.R.; Suleria, H.A. Lc-esi-qtof/ms profiling of australian mango peel by-productpolyphenols and their potential antioxidant activities. Processes 2019, 7, 764. [CrossRef]
38. Prieto, P.; Pineda, M.; Aguilar, M. Spectrophotometric quantitation of antioxidant capacity through the formation of a phospho-molybdenum complex: Specific application to the determination of vitamin e. Anal. Biochem. 1999, 269, 337–341. [CrossRef][PubMed]
39. Suleria, H.A.; Barrow, C.J.; Dunshea, F.R. Screening and characterization of phenolic compounds and their antioxidant capacity indifferent fruit peels. Foods 2020, 9, 1206. [CrossRef] [PubMed]
40. Ma, C.; Dunshea, F.R.; Suleria, H.A. Lc-esi-qtof/ms characterization of phenolic compounds in palm fruits (jelly and fishtail palm)and their potential antioxidant activities. Antioxidants 2019, 8, 483. [CrossRef] [PubMed]
41. Mitic, V.; Ilic, M.; Dimitrijevic, M.; Cvetkovic, J.; Ciric, S.; Jovanovic, V.S. Chemometric characterization of peach, nectarine andplum cultivars according to fruit phenolic content and antioxidant activity. Fruits 2016, 71, 57–66. [CrossRef]
42. Amin Morabbi, N.; Rashid, J. Free radical scavenging capacity and antioxidant activity of methanolic and ethanolic extracts ofplum (prunus domestica l.) in both fresh and dried samples. Avicenna J. Phytomedicine 2014, 4, 343–353.
43. Jafar, H.; Shabnam, F.; Gholamreza, D. Fruit quality, bioactive compounds and antioxidant capacity of 6 iranian peach cultivars.Res. Plant. Biol. 2013, 3, 6–16.
44. Hui, L.; Jiankang, C.; Weibo, J. Changes in phenolics and antioxidant property of peach fruit during ripening and responses to1-methylcyclopropene. Postharvest Biol. Technol. 2015, 108, 111–118.
45. Nowicka, P.; Wojdylo, A. Content of bioactive compounds in the peach kernels and their antioxidant, anti-hyperglycemic,anti-aging properties. Eur. Food Res. Technol. 2019, 245, 1123–1136. [CrossRef]
46. Hui, L.; Weibo, J.; Jiankang, C.; Yucai, L. Effect of chilling temperatures on physiological properties, phenolic metabolism andantioxidant level accompanying pulp browning of peach during cold storage. Sci. Hortic. 2019, 255, 175–182.
47. Mitra, R.; Vercambre, G.; Gholamhossein, D.; Mohammad, B.; Majid, A.; Genard, M. Water scarcity conditions affect peach fruitsize and polyphenol contents more severely than other fruit quality traits. J. Sci. Food Agric. 2015, 95, 1055–1065.
48. Shan, S.; Huang, X.; Shah, M.H.; Abbasi, A.M. Evaluation of polyphenolics content and antioxidant activity in edible wild fruits.BioMed Res. Int. 2019, 1–11. [CrossRef] [PubMed]
49. Hegedüs, A.; Pfeiffer, P.; Papp, N.; Abrankó, L.; Blázovics, A.; Pedryc, A.; Stefanovits-Bányai, É. Accumulation of antioxidants inapricot fruit through ripening: Characterization of a genotype with enhanced functional properties. Biol. Res. 2011, 44, 339–344.[CrossRef] [PubMed]
50. Hegedus, A.; Engel, R.; Abranko, L.; Balogh, E.; Blazovics, A.; Herman, R.; Halasz, J.; Ercisli, S.; Pedryc, A.; Stefanovits-Banyai, E.Antioxidant and antiradical capacities in apricot (prunus armeniaca l. ) fruits: Variations from genotypes, years, and analyticalmethods. J. Food Sci. 2010, 75, C722–C730. [CrossRef]
51. Hui, L.; Weibo, J.; Jiankang, C.; Yucai, L. Changes in extractable and non-extractable polyphenols and their antioxidant propertiesduring fruit on-tree ripening in five peach cultivars. Hortic. Plant. J. 2019, 5, 137–144.
52. Kaulmann, A.; Jonville, M.C.; Schneider, Y.J.; Hoffmann, L.; Bohn, T. Carotenoids, polyphenols and micronutrient profiles ofbrassica oleraceae and plum varieties and their contribution to measures of total antioxidant capacity. Food Chem. 2014, 240–250.[CrossRef] [PubMed]
54. Saoudi, S.; Khennouf, S.; Mayouf, N.; Amira, S.; Dahamna, S.; Hosni, K. Phytochemical screening and in vivo and in vitroevaluation antioxidant capacity of fargaria ananassa, prunus armeniaca and prunus persica fruits growing in algeria. Prog. Nutr.2020, 22, 236–252.
55. Petridis, A.; Koukourikou, M.; Sotiropoulos, T.; Stylianidis, D. Antioxidant activity of fruits produced in northern greece.HortScience 2010, 1341–1344. [CrossRef]
56. Yurong, M.; Huihua, H. Characterisation and comparison of phenols, flavonoids and isoflavones of soymilk and their correlationswith antioxidant activity. Int. J. Food Sci. Technol. 2014, 49, 2290–2298.
57. Apak, R.; Gueclue, K.; Demirata, B.; Oezyuerek, M.; Celik, S.E.; Bektasoglu, B.; Berker, K.I.; Oezyurt, D. Comparative evaluationof various total antioxidant capacity assays applied to phenolic compounds with the cuprac assay. Molecules 2007, 12, 1496–1547.[CrossRef] [PubMed]
58. Dudonne, S.; Vitrac, X.; Coutiere, P.; Woillez, M.; Merillon, J.M. Comparative study of antioxidant properties and total phenoliccontent of 30 plant extracts of industrial interest using dpph, abts, frap, sod, and orac assays. J. Agric. Food Chem. 2009, 57,1768–1774. [CrossRef] [PubMed]
59. Stratil, P.; Klejdus, B.; Kubán, V. Determination of phenolic compounds and their antioxidant activity in fruits and cereals. Talanta2007, 71, 1741–1751. [CrossRef]
60. Floegel, A.; Kim, D.-O.; Chung, S.-J.; Koo, S.I.; Chun, O.K. Comparison of abts/dpph assays to measure antioxidant capacity inpopular antioxidant-rich us foods. J. Food Compos. Anal. 2011, 24, 1043–1048. [CrossRef]
62. Lin, H.; Zhu, H.; Tan, J.; Wang, H.; Wang, Z.; Li, P.; Zhao, C.; Liu, J. Comparative analysis of chemical constituents of moringaoleifera leaves from china and india by ultra-performance liquid chromatography coupled with quadrupole-time-of-flight massspectrometry. Molecules 2019, 24, 942. [CrossRef]
63. Chongting, G.; Jinfeng, B.; Xuan, L.; Jian, L.; Xinye, W.; Ye, X. Polyphenol metabolic diversity of chinese peach and nectarineat thinned and ripe stages by uplc-esi-q-tof-ms combined with multivariate statistical analysis. J. Food Compos. Anal. 2020,90, 103502.
64. Gonçalves, B.; Moeenfard, M.; Rocha, F.; Alves, A.; Estevinho, B.N.; Santos, L. Microencapsulation of a natural antioxidant fromcoffee—chlorogenic acid (3-caffeoylquinic acid). Food Bioprocess. Technol. 2017, 10, 1521–1530. [CrossRef]
65. Wang, J.; Jia, Z.; Zhang, Z.; Wang, Y.; Liu, X.; Wang, L.; Lin, R. Analysis of chemical constituents of melastoma dodecandrum lour.By uplc-esi-q-exactive focus-ms/ms. Molecules 2017, 22, 476. [CrossRef] [PubMed]
66. Jaiswal, R.; Karaköse, H.; Rühmann, S.; Goldner, K.; Neumüller, M.; Treutter, D.; Kuhnert, N. Identification of phenoliccompounds in plum fruits (prunus salicina l. And prunus domestica l.) by high-performance liquid chromatography/tandemmass spectrometry and characterization of varieties by quantitative phenolic fingerprints. J. Agric. Food Chem. 2013, 61,12020–12031. [CrossRef] [PubMed]
67. Mancuso, C.; Santangelo, R. Ferulic acid: Pharmacological and toxicological aspects. Food Chem. Toxicol. 2014, 65, 185–195.[CrossRef] [PubMed]
68. Redondo, D.; Arias, E.; Oria, R.; Venturini, M.E. Thinned stone fruits are a source of polyphenols and antioxidant compounds. J.Sci. Food Agric. 2017, 97, 902–910. [CrossRef]
69. Ludwig, I.A.; Mena, P.; Calani, L.; Borges, G.; Pereira-Caro, G.; Bresciani, L.; Del Rio, D.; Lean, M.E.J.; Crozier, A. New insightsinto the bioavailability of red raspberry anthocyanins and ellagitannins. Free Radic. Biol. Med. 2015, 89, 758–769. [CrossRef]
70. Zadernowski, R.; Naczk, M.; Nesterowicz, J. Phenolic acid profiles in some small berries. J. Agric. Food Chem. 2005, 53, 2118–2124.[CrossRef]
71. Mokrani, A.; Cluzet, S.; Madani, K.; Pakina, E.; Gadzhikurbanov, A.; Mesnil, M.; Monvoisin, A.; Richard, T. Hplc-dad-ms/msprofiling of phenolics from different varieties of peach leaves and evaluation of their antioxidant activity: A comparative study.Int. J. Mass Spectrom. 2019, 445, 116192. [CrossRef]
72. Khezeli, T.; Daneshfar, A.; Sahraei, R. A green ultrasonic-assisted liquid–liquid microextraction based on deep eutectic solvent forthe hplc-uv determination of ferulic, caffeic and cinnamic acid from olive, almond, sesame and cinnamon oil. Talanta 2016, 150,577–585. [CrossRef] [PubMed]
73. Santhirasegaram, V.; Razali, Z.; George, D.S.; Somasundram, C. Effects of thermal and non-thermal processing on phenoliccompounds, antioxidant activity and sensory attributes of chokanan mango (mangifera indica l.) juice. Food Bioprocess. Technol.2015, 8, 2256–2267. [CrossRef]
74. Zhifeng, L.; Hui Wen, L.; Xu, L.; Dong, L.; Qi, W.; Dejian, H.; Choon Nam, O. Profiling of phenolic compounds and antioxidantactivity of 12 cruciferous vegetables. Molecules 2018, 23, 1139.
75. Juurlink, B.H.J.; Azouz, H.J.; Aldalati, A.M.Z.; AlTinawi, B.M.H.; Ganguly, P. Hydroxybenzoic acid isomers and the cardiovascularsystem. Nutr. J. 2014, 13, 63. [CrossRef]
77. Wang, X.; Yan, K.; Ma, X.; Li, W.; Chu, Y.; Guo, J.; Li, S.; Zhou, S.; Zhu, Y.; Liu, C. Simultaneous determination and pharmacokineticstudy of protocatechuic aldehyde and its major active metabolite protocatechuic acid in rat plasma by liquid chromatography-tandem mass spectrometry. J. Chromatogr. Sci. 2016, 54, 697–705. [CrossRef] [PubMed]
78. Brar, J.; Gupta, N.; Gill, M. Effect of pre and post-harvest treatments of salicylic acid on quality characteristics of peach (prunuspersica l.) fruits during storage. Progress. Hortic. 2014, 46, 217–221.
79. Pokotylo, I.; Kravets, V.; Ruelland, E. Salicylic acid binding proteins (sabps): The hidden forefront of salicylic acid signalling. Int.J. Mol. Sci. 2019, 20. [CrossRef] [PubMed]
80. Diaconeasa, Z.; Florica, R.; Rugina, D.; Lucian, C.; Socaciu, C. Hplc/pda–esi/ms identification of phenolic acids, flavonolglycosides and antioxidant potential in blueberry, blackberry, raspberries and cranberries. J. Food Nutr. Res. 2014, 2, 781–785.[CrossRef]
81. Cuadrado-Silva, C.T.; Pozo-Bayon, M.A.; Osorio, C. Targeted metabolomic analysis of polyphenols with antioxidant activity insour guava (psidium friedrichsthalianum nied.) fruit. Molecules 2017, 22, 11. [CrossRef]
82. Rajauria, G.; Foley, B.; Abu-Ghannam, N. Identification and characterization of phenolic antioxidant compounds from brownirish seaweed himanthalia elongata using lc-dad–esi-ms/ms. Innov. Food Sci. Emerg. Technol. 2016, 37, 261–268. [CrossRef]
83. Sasot, G.; Martínez-Huélamo, M.; Vallverdú-Queralt, A.; Mercader-Martí, M.; Estruch, R.; Lamuela-Raventós, R.M. Identificationof phenolic metabolites in human urine after the intake of a functional food made from grape extract by a high resolutionltq-orbitrap-ms approach. Food Res. Int. 2017, 100, 435–444. [CrossRef]
84. Aruwa, C.E.; Amoo, S.; Kudanga, T. Phenolic compound profile and biological activities of southern african opuntia ficus-indicafruit pulp and peels. LWT 2019, 111, 337–344. [CrossRef]
85. Borochov-Neori, H.; Judeinstein, S.; Greenberg, A.; Volkova, N.; Rosenblat, M.; Aviram, M. Antioxidant and antiatherogenicproperties of phenolic acid and flavonol fractions of fruits of ‘amari’ and ‘hallawi’ date (phoenix dactylifera l.) varieties. J. Agric.Food Chem. 2015, 63, 3189–3195. [CrossRef] [PubMed]
86. Lin, L.-Z.; Mukhopadhyay, S.; Robbins, R.J.; Harnly, J.M. Identification and quantification of flavonoids of mexican oregano(lippia graveolens) by lc-dad-esi/ms analysis. J. Food Compos. Anal. 2007, 20, 361–369. [CrossRef] [PubMed]
87. Abad-García, B.; Garmón-Lobato, S.; Berrueta, L.A.; Gallo, B.; Vicente, F. On line characterization of 58 phenolic compounds incitrus fruit juices from spanish cultivars by high-performance liquid chromatography with photodiode-array detection coupledto electrospray ionization triple quadrupole mass spectrometry. Talanta 2012, 99, 213–224. [CrossRef] [PubMed]
88. Mokrani, A.; Krisa, S.; Cluzet, S.; Da Costa, G.; Temsamani, H.; Renouf, E.; Mérillon, J.-M.; Madani, K.; Mesnil, M.; Monvoisin, A.;et al. Phenolic contents and bioactive potential of peach fruit extracts. Food Chem. 2016, 202, 212–220. [CrossRef] [PubMed]
89. Guijarro-Díez, M.; Castro-Puyana, M.; Crego, A.L.; Marina, M.L. A novel method for the quality control of saffron through thesimultaneous analysis of authenticity and adulteration markers by liquid chromatography-(quadrupole-time of flight)-massspectrometry. Food Chem. 2017, 228, 403–410. [CrossRef] [PubMed]
90. Heiss, C.; Keen, C.L.; Kelm, M. Flavanols and cardiovascular disease prevention. Eur. Heart J. 2010, 31, 2583–2592. [CrossRef][PubMed]
91. Lv, Q.; Luo, F.; Zhao, X.; Liu, Y.; Hu, G.; Sun, C.; Li, X.; Chen, K. Identification of proanthocyanidins from litchi (litchi chinensissonn.) pulp by lc-esi-q-tof-ms and their antioxidant activity. PLoS ONE 2015, 10, e0120480. [CrossRef]
92. Enomoto, H.; Takahashi, S.; Takeda, S.; Hatta, H. Distribution of flavan-3-ol species in ripe strawberry fruit revealed bymatrix-assisted laser desorption/ionization-mass spectrometry imaging. Molecules 2020, 25, 103. [CrossRef]
93. Pereira, G.A.; Arruda, H.S.; de Morais, D.R.; Peixoto Araujo, N.M.; Pastore, G.M. Mutamba (guazuma ulmifolia lam.) fruit as anovel source of dietary fibre and phenolic compounds. Food Chem. 2020, 310, 125857. [CrossRef]
94. Singh, M.; Kaur, M.; Silakari, O. Flavones: An important scaffold for medicinal chemistry. Eur. J. Med. Chem. 2014, 84, 206–239.[CrossRef]
95. Pool, I.E.H.; Lopez, N.A.P. Evaluation of the Change in the Content and Profile of Phenolic Compounds in Capsicum Chinense in Interactionwith the Phytopathogenic Oomycete Pythium Ultimum; Research and Assistance Center for Technology and Design of the State ofJalisco: Guadalajara, Mexico, 2019.
96. Zeng, X.; Su, W.; Zheng, Y.; Liu, H.; Li, P.; Zhang, W.; Liang, Y.; Bai, Y.; Peng, W.; Yao, H. Uflc-q-tof-ms/ms-based screening andidentification of flavonoids and derived metabolites in human urine after oral administration of exocarpium citri grandis extract.Molecules 2018, 23, 895. [CrossRef] [PubMed]
97. Barros, L.; Dueñas, M.; Ferreira, I.C.F.R.; Maria Carvalho, A.; Santos-Buelga, C. Use of hplc–dad–esi/ms to profile phenoliccompounds in edible wild greens from portugal. Food Chem. 2011, 127, 169–173. [CrossRef]
99. Lucini, L.; Rocchetti, G.; Kane, D.; Trevisan, M. Phenolic fingerprint allows discriminating processed tomato products and tracingdifferent processing sites. Food Control 2017, 73, 696–703. [CrossRef]
100. Roowi, S.; Crozier, A. Flavonoids in tropical citrus species. J. Agric. Food Chem. 2011, 59, 12217–12225. [CrossRef] [PubMed]101. Ghisoni, S.; Chiodelli, G.; Rocchetti, G.; Kane, D.; Lucini, L. Uhplc-esi-qtof-ms screening of lignans and other phenolics in dry
seeds for human consumption. J. Funct. Foods 2017, 34, 229–236. [CrossRef]102. Toro-Funes, N.; Odriozola-Serrano, I.; Bosch-Fusté, J.; Latorre-Moratalla, M.L.; Veciana-Nogués, M.T.; Izquierdo-Pulido, M.;
Vidal-Carou, M.C. Fast simultaneous determination of free and conjugated isoflavones in soy milk by uhplc–uv. Food Chem. 2012,135, 2832–2838. [CrossRef] [PubMed]
103. Wen, R.; Lv, H.; Jiang, Y.; Tu, P. Anti-inflammatory isoflavones and isoflavanones from the roots of pongamia pinnata (l.) pierre.Bioorganic Med. Chem. Lett. 2018, 28, 1050–1055. [CrossRef] [PubMed]
104. Fellah, B.; Rocchetti, G.; Senizza, B.; Giuberti, G.; Bannour, M.; Ferchichi, A.; Lucini, L. Untargeted metabolomics reveals changesin phenolic profile following in vitro large intestine fermentation of non-edible parts of punica granatum L. Food Res. Int. 2020,128, 108807. [CrossRef] [PubMed]
105. Barreca, D.; Bellocco, E.; Caristi, C.; Leuzzi, U.; Gattuso, G. Elucidation of the flavonoid and furocoumarin composition andradical-scavenging activity of green and ripe chinotto (citrus myrtifolia raf.) fruit tissues, leaves and seeds. Food Chem. 2011, 129,1504–1512. [CrossRef]
106. Cao, W.; Ye, L.-H.; Cao, J.; Xu, J.-J.; Peng, L.-Q.; Zhu, Q.-Y.; Zhang, Q.-Y.; Hu, S.-S. Quantitative analysis of flavanones from citrusfruits by using mesoporous molecular sieve-based miniaturized solid phase extraction coupled to ultrahigh-performance liquidchromatography and quadrupole time-of-flight mass spectrometry. J. Chromatogr. A 2015, 1406, 68–77. [CrossRef] [PubMed]
107. Pascual-Teresa, D.; Moreno, D.A.; García-Viguera, C. Flavanols and anthocyanins in cardiovascular health: A review of currentevidence. Int. J. Mol. Sci. 2010, 11, 1679–1703. [CrossRef] [PubMed]
108. Chen, G.; Li, X.; Saleri, F.; Guo, M. Analysis of flavonoids in rhamnus davurica and its antiproliferative activities. Molecules 2016,21, 1275. [CrossRef] [PubMed]
109. Ivanova, V.; Dörnyei, Á.; Márk, L.; Vojnoski, B.; Stafilov, T.; Stefova, M.; Kilár, F. Polyphenolic content of vranec wines producedby different vinification conditions. Food Chem. 2011, 124, 316–325. [CrossRef]
110. Zhou, D.; Liu, Q.; Peng, J.; Tu, S.; Pan, L.; Tu, K. Metabolic analysis of phenolic profiles reveals the enhancements of anthocyaninsand procyanidins in postharvest peach as affected by hot air and ultraviolet c. Postharvest Biol. Technol. 2020, 167, 111227.[CrossRef]
111. Liang, N.-N.; He, F.; Bi, H.-Q.; Duan, C.-Q.; Reeves, M.J.; Wang, J. Evolution of flavonols in berry skins of different grape cultivarsduring ripening and a comparison of two vintages. Eur. Food Res. Technol. 2012, 235, 1187–1197. [CrossRef]
112. Getasetegn, M. Chemical composition of catha edulis (khat): A review. Phytochem. Rev. 2016, 15, 907–920. [CrossRef]113. Rodríguez-García, C.; Sánchez-Quesada, C.; Toledo, E.; Delgado-Rodríguez, M.; Gaforio, J.J. Naturally lignan-rich foods: A
dietary tool for health promotion? Molecules 2019, 24, 917. [CrossRef]114. Wang, Y.; Vorsa, N.; Harrington, P.d.B.; Chen, P. Nontargeted metabolomic study on variation of phenolics in different cranberry
cultivars using uplc-im–hrms. J. Agric. Food Chem. 2018, 66, 12206–12216. [CrossRef]115. Huimin, Z.; Quan, L.; Guang, Q.; Zhilang, Q.; Zhuang, W.; Xiaopeng, W. Optimizing the supercritical carbon dioxide extraction of
of three crataegus species (hawthorn) and their in vitro biological activities. J. Sci. Food Agric. 2020, 100, 1998–2006. [CrossRef][PubMed]
117. Becerra-Herrera, M.; Sánchez-Astudillo, M.; Beltrán, R.; Sayago, A. Determination of phenolic compounds in olive oil: Newmethod based on liquid–liquid micro extraction and ultra high performance liquid chromatography-triple–quadrupole massspectrometry. LWT Food Sci. Technol. 2014, 57, 49–57. [CrossRef]
118. Campbell, O.E.; Padilla-Zakour, O.I. Phenolic and carotenoid composition of canned peaches (prunus persica) and apricots(prunus armeniaca) as affected by variety and peeling. Food Res. Int. 2013, 54, 448–455. [CrossRef]
119. Cevallos-Casals, B.A.; Byrne, D.; Okie, W.R.; Cisneros-Zevallos, L. Selecting new peach and plum genotypes rich in phenoliccompounds and enhanced functional properties. Food Chem. 2006, 96, 273–280. [CrossRef]
120. Cantín, C.M.; Moreno, M.A.; Gogorcena, Y. Evaluation of the antioxidant capacity, phenolic compounds, and vitamin c content ofdifferent peach and nectarine [prunus persica (l.) batsch] breeding progenies. J. Agric. Food Chem. 2009, 57, 4586–4592. [CrossRef]
121. Brito, A.; Ramirez, J.E.; Areche, C.; Sepúlveda, B.; Simirgiotis, M.J. Hplc-uv-ms profiles of phenolic compounds and antioxidantactivity of fruits from three citrus species consumed in northern chile. Molecules 2014, 19, 17400–17421. [CrossRef]
122. Stojanovic, B.T.; Mitic, S.S.; Stojanovic, G.S.; Mitic, M.N.; Kostic, D.A.; Paunovic, D.D.; Arsic, B.B. Phenolic profile and antioxidantactivity of pulp and peel from peach and nectarine fruits. Not. Bot. Horti Agrobot. Cluj-Napoca 2016, 44, 175–182. [CrossRef]
123. Biesaga, M.; Ochnik, U.; Pyrzynska, K.J.J.o.s.s. Analysis of phenolic acids in fruits by hplc with monolithic columns. J. Sep. Sci.2007, 30, 2929–2934. [CrossRef] [PubMed]
124. Liao, X.; Greenspan, P.; Pegg, R.B.J.F.c. Characterizing the phenolic constituents and antioxidant capacity of georgia peaches. J.Sep. Sci. 2019, 271, 345–353. [CrossRef] [PubMed]
125. Turkmen, N.; Velioglu, Y.S.; Sari, F.; Polat, G. Effect of extraction conditions on measured total polyphenol contents and antioxidantand antibacterial activities of black tea. Molecules 2007, 12, 484–496. [CrossRef] [PubMed]