High Winds Generated by Bow Echoes. Part I: Overview of the Omaha Bow Echo5 July 2003 Storm during BAMEX
ROGER M. WAKIMOTO
National Center for Atmospheric Research, Boulder, Colorado
HANNE V. MURPHEY AND ALBERT NESTER
Department of Atmospheric Sciences, University of California, Los Angeles, Los Angeles, California
DAVID P. JORGENSEN
National Oceanic and Atmospheric Administration/National Severe Storms Laboratory, Norman, Oklahoma
NOLAN T. ATKINS
Department of Meteorology, Lyndon State College, Lyndonville, Vermont
(Manuscript received 1 July 2005, in final form 10 January 2006)
ABSTRACT
An analysis of a bow echo that produced damaging winds exceeding F1 in intensity on the Fujita scalenear Omaha, Nebraska, is shown. Part I of this study presents a combination of airborne Doppler-derivedwind syntheses with a comprehensive damage survey in order to document the generation of strong windsat the surface. A detailed kinematic analysis of the evolution of a quasi-linear convective system into abow-shaped and, subsequently, a spearhead echo is shown for the first time. It is hypothesized that a large,cyclonic bookend vortex (70–80 km in diameter) north of the bow apex enhanced the rear-inflow jet andinitiated the “bowing process.” A hook-shaped echo and mesovortex formed at the apex of a bowedsegment of the convective line and was located to the north of the swath of strong damage rated greater thanF1 in damage intensity. The peak single-Doppler radial velocity recorded by the tail radar was 43 m s�1 inthe low-level outflow near the apex of the bow echo. The regions of the strongest single-Doppler velocitiesat the lowest grid level were not always associated with the most intense damage at the surface. Thisdiscrepancy may be related to the development of a stable nocturnal boundary layer that prevented thestrong outflow winds from reaching the surface. An intensifying rear-inflow jet was revealed in vertical crosssections through the bow echo. The relationship between mesovortices and strong surface winds is exam-ined in Part II.
1. Introduction
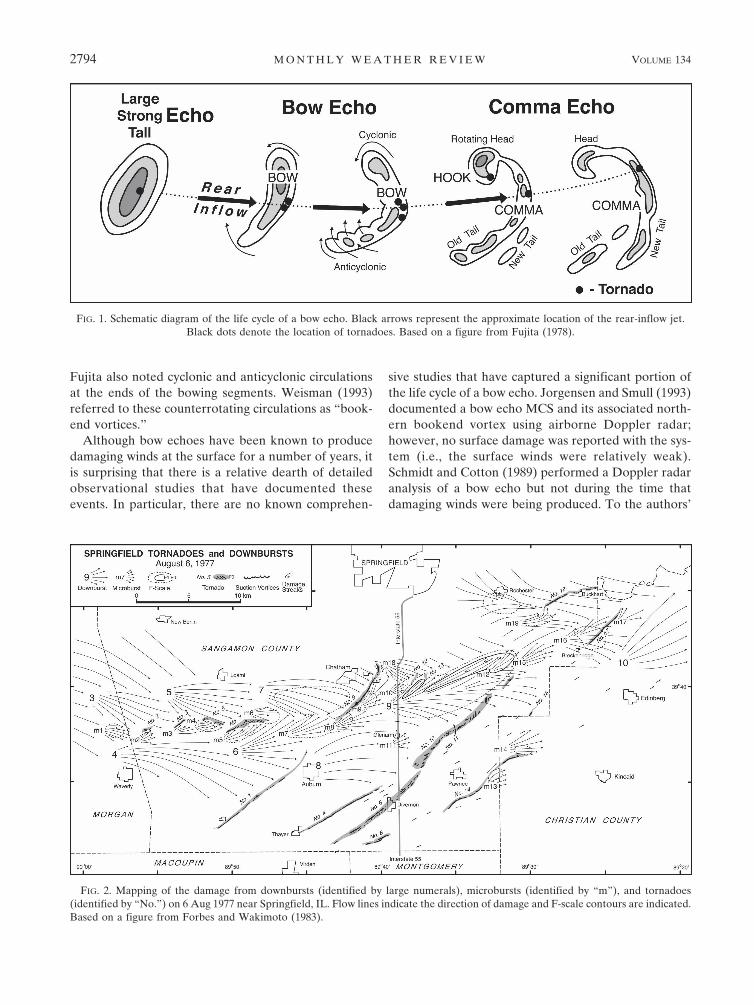
Nolen (1959) and Hamilton (1970) first noted therelationship between bow-shaped convective systems[referred to as a line-echo wave pattern (LEWP)] andstraight-line damaging surface winds and tornadoes.Subsequently, Fujita (1978) documented the kinematicstructure and time evolution of the radar echo of amesoscale convective system (MCS) that he referred to
as a bow echo (Fig. 1). He showed that bow echoeswere frequently associated with straight-line wind dam-age or downbursts at the surface. Indeed, severe bowecho events can result in significant property damageand loss of life over an extended region and representone of the more common modes of convective organi-zation associated with severe weather (e.g., Fujita andWakimoto 1981; Johns and Hirt 1987; Przybylinski1995; Weisman 2001; Jorgensen and Weckwerth 2003).The MCS usually begins as a single large or small groupof strong convective cells (Klimowski et al. 2004),evolves into a bow-shaped line segment, as an associ-ated surface cold pool expands, and finally becomes acomma-shaped echo in its declining stage (Fig. 1).
Corresponding author address: Roger M. Wakimoto, NCAR/EOL, P.O. Box 3000, Boulder CO 80307.E-mail: [email protected]
Fujita also noted cyclonic and anticyclonic circulationsat the ends of the bowing segments. Weisman (1993)referred to these counterrotating circulations as “book-end vortices.”
Although bow echoes have been known to producedamaging winds at the surface for a number of years, itis surprising that there is a relative dearth of detailedobservational studies that have documented theseevents. In particular, there are no known comprehen-
sive studies that have captured a significant portion ofthe life cycle of a bow echo. Jorgensen and Smull (1993)documented a bow echo MCS and its associated north-ern bookend vortex using airborne Doppler radar;however, no surface damage was reported with the sys-tem (i.e., the surface winds were relatively weak).Schmidt and Cotton (1989) performed a Doppler radaranalysis of a bow echo but not during the time thatdamaging winds were being produced. To the authors’
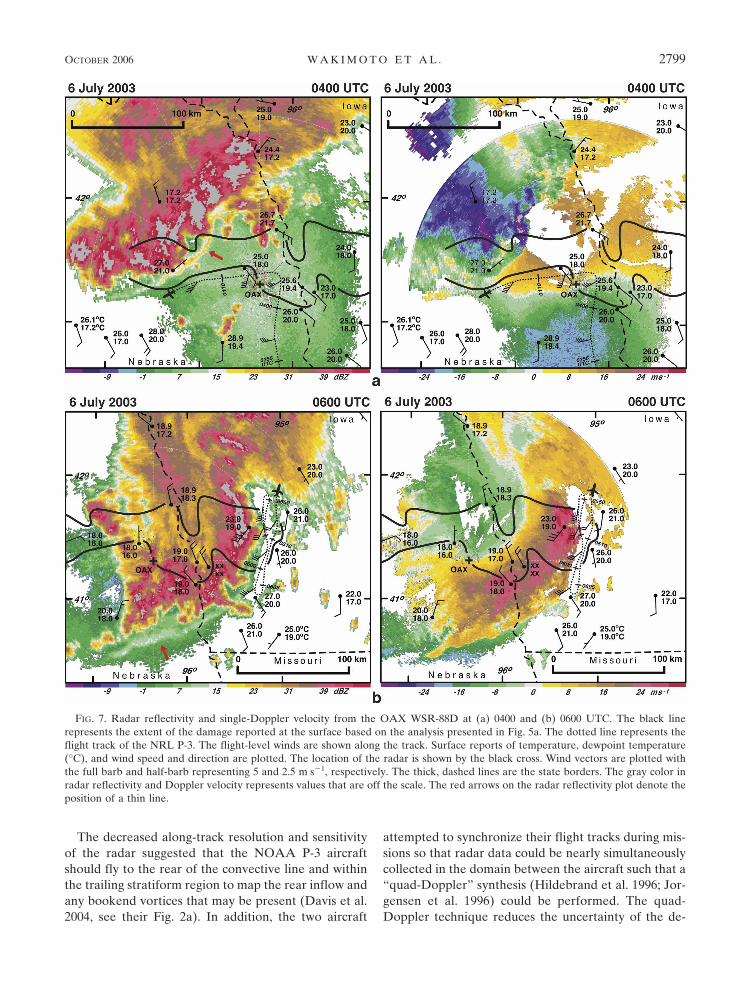
FIG. 2. Mapping of the damage from downbursts (identified by large numerals), microbursts (identified by “m”), and tornadoes(identified by “No.”) on 6 Aug 1977 near Springfield, IL. Flow lines indicate the direction of damage and F-scale contours are indicated.Based on a figure from Forbes and Wakimoto (1983).
FIG. 1. Schematic diagram of the life cycle of a bow echo. Black arrows represent the approximate location of the rear-inflow jet.Black dots denote the location of tornadoes. Based on a figure from Fujita (1978).
2794 M O N T H L Y W E A T H E R R E V I E W VOLUME 134
knowledge, only Fujita (1979, 1981) has presented amulti-Doppler radar study of a severe bow echo while itproduced destructive winds and a tornado; however, itwas only for one analysis time and was confined to asingle height. There have been a number of studies thathave used single-Doppler radar to examine bow echoesand their relationship to damaging winds at the surface(e.g., Burgess and Smull 1990; Przybylinski 1995; At-kins et al. 2004).
Bow echoes are associated with a storm-relative rear-inflow jet and rear-inflow notch (Fujita 1978; Smull andHouze 1987; Schmidt and Cotton 1989; Jorgensen andSmull 1993; Przybylinski 1995). The jet with its core atthe apex of the bow is associated with the bulging andacceleration of the radar echoes. Chong et al. (1987),Weisman (1992), Lafore and Moncrieff (1989), Lin andJohnson (1994), and Klimowski (1994) have shown thatthe rear inflow is largely driven by processes occurringwithin the MCS.
The prevailing hypothesis has been that the descend-ing rear-inflow jet, upon reaching the surface, was pri-marily responsible for the damaging winds (e.g., Bur-gess and Smull 1990; Weisman 1993; Przybylinski 1995).Indeed, extensive aerial and ground surveys of damagein the aftermath of bow echoes revealed large regionsof destruction that could be attributed to a descendingrear-inflow jet (e.g., Fujita 1978). Embedded withinthese extensive areas of damage, however, were pock-ets or swaths of more extreme or concentrated destruc-tion that occurred on a much smaller scale, as shown byForbes and Wakimoto (1983). A detailed damage mapfrom their study is shown in Fig. 2. The damage wasattributed to 10 downbursts and 19 microbursts, withthe latter often in close proximity to a number of thetornado tracks. These smaller-scale damage patternscould not be readily attributed to the descending rear-inflow jet. Other damage surveys presented by Fujita(1978, 1981), Fujita and Wakimoto (1981), and Funk etal. (1999) supported the results shown in Fig. 2. Theexistence of two scales of downdrafts within MCSs wasfirst noted by Zipser (1977) and Houze (1977).
Wakimoto (2001) hypothesized that these small
swaths might be associated with the convective-scaledowndrafts (i.e., microbursts) produced by thunder-storms within the leading convective line [also sug-gested by Fujita (1978) and Burgess and Smull (1990)].In contrast, Weisman and Trapp (2003) and Trapp andWeisman (2003) hypothesized, based on numericalsimulations, that damage often attributed to mi-crobursts was induced by strong low-level mesovorti-ces. The intense low-level winds appeared to be accel-erated by the large horizontal pressure gradients gen-erated by these mesovortices rather than by intensedowndrafts. This close relationship between straight-line winds and intense mesovortices is supported by thesurvey presented in Fig. 2. Note that several tornadoes
FIG. 3. Thermodynamic sounding launched from Omaha at2300 UTC 5 Jul 2003. The thick, black line represents the path ofa displaced parcel from the surface. Wind vectors are plotted withthe flag, full barb, and half-barb representing 25, 5, and 2.5 m s�1,respectively.
TABLE 1. ELDORA scanning mode.
Antenna rotation rate (° s�1) 140No. of samples 24PRF (Hz) 2000/2500Gate length (m) 150Sweep-angle beam spacing (°) 1.4Along-track data spacing (m) �300Max range (km) 60Max unambiguous velocities (�m s�1) 77.2Min detectable signal at 10 km (dBZ ) ��15
TABLE 2. NOAA P-3 tail radar scanning mode.
Antenna rotation rate (° s�1) 60No. of samples 32PRF (Hz) 2133/3200Gate length (m) 150Sweep-angle beam spacing (°) 0.75Along-track data spacing (m) �1200Max range (km) 46.8Max unambiguous velocities (�m s�1) 51.5Min detectable signal at 10 km (dBZ ) �0
OCTOBER 2006 W A K I M O T O E T A L . 2795
in the figure are accompanied by microburst damageimmediately to the south of the track.
A squall line developed over eastern Nebraska in theevening of 5 July 2003 during the Bow Echo and Me-soscale Convective Vortex (MCV) Experiment(BAMEX; Davis et al. 2004) and was observed by twoDoppler radar–equipped turboprop aircraft from�0430 to 0800 UTC. One of the goals of the experimentwas to sample bow echo systems that are associatedwith damaging winds at the surface. The radar echoassociated with the line assumed a bow shape nearOmaha, Nebraska (OAX), during the time that numer-ous high wind reports were received by the NationalWeather Service (NWS). High-resolution Doppler ra-dar measurements were made of the bow echo while itwas creating damage rated F1 in intensity (Fujita 1981).Part I of this study presents the overall evolution of the5 July storm (hereafter, referred to as the Omaha bowecho). High-spatial-resolution Doppler analyses of aquasi-linear convective system that subsequently as-sumes a bow shape and its relationship with the overallsurface damage are documented. This is the first timethat such an analysis has been presented. A mesovortexand accompanying hook-shaped echo appendage devel-oped near the apex of a segment of the line that as-sumed a bow shape. A large region of intense surfacedamage was documented at the apex during the timethat the vertical vorticity associated with the mesovor-tex was the strongest. The second part of the study
provides a detailed analysis of the mesovortices thatwere resolved in the Doppler wind syntheses and theirrelationship to intense damage swaths at the surface.
Section 2 discusses BAMEX and the airborne Dopp-ler radars deployed during the experiment. The envi-ronmental conditions, storm evolution, and damagesurvey are shown in section 3. Section 4 presents single-and multi-Doppler radar analyses of the bow echo. Asummary and discussion is presented in section 5.
2. BAMEX and the airborne Doppler radars
a. BAMEX
The field phase of BAMEX took place in spring andsummer of 2003 and was based at MidAmerica St.Louis Airport in Mascoutah, Illinois (near St. Louis,Missouri). The objective of the experiment was tosample the multiscale aspects of two types of MCSsthroughout a majority of their life cycles (Davis et al.2004). One type of MCS was the bow echo systems thatare associated with damaging winds at the surface, andthe other type was those systems that produced long-lived MCVs. The experiment relied on the deploymentof mobile ground-based and airborne observing plat-forms because MCSs can develop over an extended re-gion and travel over large distances (e.g., Laing andFritsch 1997). Unfortunately, the ground-based plat-forms were unable to intercept the 5–6 July Omaha
FIG. 4. Isochrone analysis of the Omaha bow echo. The 40-dBZ contour is drawn at 1-h intervals. Different linetypes are drawn in order to distinguish the echo at the various times. The flight track of the NRL P-3 is shown.
2796 M O N T H L Y W E A T H E R R E V I E W VOLUME 134
bow echo so the following analysis is centered on thecapabilities of the aircraft.
b. ELDORA
The National Center for Atmospheric Research(NCAR) maintains and operates a 3-cm airborneDoppler radar [Electra Doppler Radar (ELDORA)].ELDORA is equipped with two back-to-back antennasmounted within the tail section of a Naval ResearchLaboratory (NRL) P-3 aircraft. The antennas scan ver-tically and the beams are directed slightly fore and aftof normal to the fuselage of the aircraft by �18.5°. Theantenna scan pattern is conical as the aircraft movesforward. ELDORA uses a multiple-beam scanningtechnique, which is a variation of the fore–aft scanning
technique (FAST; Jorgensen et al. 1996), in order tocollect data that can be used in a dual-Doppler windsynthesis. A list of ELDORA’s scanning parametersduring BAMEX is shown in Table 1. For more infor-mation regarding ELDORA’s hardware and design,the interested reader is referred to Hildebrand et al.(1994, 1996).
A principal limitation of an airborne Doppler radaris its along-track data or beam-intersecting spacing,which is a function of the antenna rotation rate andaircraft ground speed. The fore and aft beams inter-sected with a spacing of �300 m for ELDORA. An-other limitation is the time lag between intersectingfore and aft beams. For a typical aircraft ground speedof �120 m s�1, the time lag is �1 min (10 km)�1 of
FIG. 5. Map of the surface damage produced by the Omaha bow echo. The map was compiled based on several days of aerial andground surveys throughout the region. (a) The location of the map is indicated by the hatched box in the inset. (b) An enlargement ofthe boxed-in region on the east side of (a) is shown. The flow lines represent the direction of fallen trees or structural damage. The outerextent of the damage as well as the regions rated F0 and F1 in damage intensity are indicated in the figures. The black arrows in (b)represent individual vectors of damage to trees or structures. The black dot in (a) and (b) denotes the location of the HNR automatedsurface station.
OCTOBER 2006 W A K I M O T O E T A L . 2797
range. For example, if the leading convective line were�15 km from the aircraft, the time lag would be 90 s.Stationarity of the processes must be assumed duringthis lag. This is not an uncommon assumption in dual-Doppler analyses.
The flight plan for the NRL P-3 was to fly relativelystraight and level racetrack patterns at low levels [�1.6km above ground level (AGL); hereafter, all heightsare AGL]. The tracks were long (�100 km) and flowngenerally within 10–15 km ahead of the leading edge ofthe convective line. The flight pattern required the air-craft to fly along and parallel to the advancing gustfront (the front was often positioned as close as 2–3 kmfrom the aircraft). These tracks were a challenge toexecute owing to the nonlinear nature of many of theboundaries and the possibility that the gust front could“surge out” ahead of the bow echo in response tostrong outflow winds. Accordingly, the mission scientistwas required to make continuous corrections to the air-craft heading in flight.
The main advantage of the NRL P-3 flight track wasthe ability to resolve the detailed kinematic structure ofthe bow echo over an extended path with its ELDORAradar. The main disadvantage was the time required toexecute one leg (12–13 min), which decreased the tem-poral resolution (time required to complete a subse-quent leg). The uniqueness of the dataset collected by
flying extended legs far outweighed the degradation ofthe temporal resolution for the analyses presentedhere.
There were two reasons that justified the NRLP-3’s position out ahead of the storm system. First,ELDORA is capable of detecting echoes and Dopplervelocities within the “clear air” (Wakimoto et al. 1996).This capability was critical because the gust front couldbe devoid of precipitation scatterers. Second, the along-track resolution of ELDORA was sufficient to resolvemesovortices forming along the gust front if they werepresent.
c. NOAA P-3
The National Oceanic and Atmospheric Administra-tion (NOAA) operates a P-3 that is equipped with anairborne Doppler radar (Jorgensen et al. 1983). Thisairborne radar also uses FAST, which allows for thecollection of Doppler velocity data that can be synthe-sized into a wind field. However, the along-track dataspacing is greater than that for ELDORA owing to therelatively slow antenna scan rate (see Table 2) and thelack of a second transmitter to simultaneously collectfore and aft beams. The sensitivity of the NOAA P-3Doppler radar is also less than that of ELDORA(Table 2); accordingly, it cannot detect many clear-airechoes.
FIG. 6. Time series of mean wind speed and direction, temperature, dewpoint temperature, and pressure from theHNR automated surface station. The peak gusts are shown by the open circles. Wind speed and direction are 2-minrunning averages based on data collected every second. The peak gust is the highest 5-s-averaged wind speed forthe preceding 10 min. The range of wind speeds associated with F0 damage intensity is shown on the figure. Thelocation of the station is shown in Fig. 5.
2798 M O N T H L Y W E A T H E R R E V I E W VOLUME 134
The decreased along-track resolution and sensitivityof the radar suggested that the NOAA P-3 aircraftshould fly to the rear of the convective line and withinthe trailing stratiform region to map the rear inflow andany bookend vortices that may be present (Davis et al.2004, see their Fig. 2a). In addition, the two aircraft
attempted to synchronize their flight tracks during mis-sions so that radar data could be nearly simultaneouslycollected in the domain between the aircraft such that a“quad-Doppler” synthesis (Hildebrand et al. 1996; Jor-gensen et al. 1996) could be performed. The quad-Doppler technique reduces the uncertainty of the de-
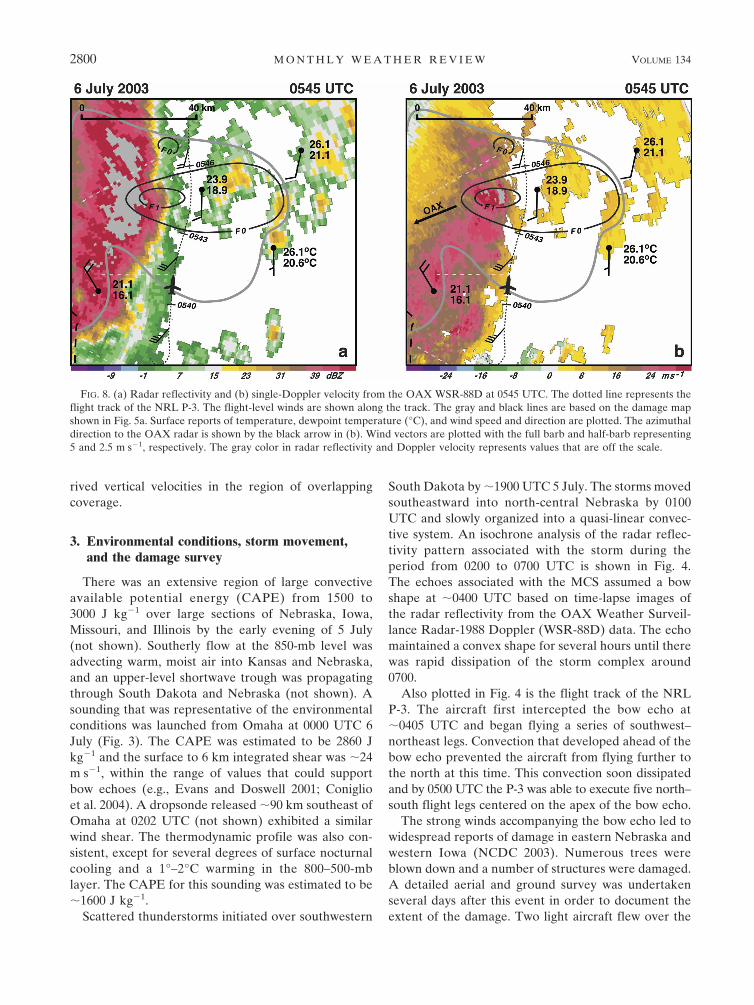
FIG. 7. Radar reflectivity and single-Doppler velocity from the OAX WSR-88D at (a) 0400 and (b) 0600 UTC. The black linerepresents the extent of the damage reported at the surface based on the analysis presented in Fig. 5a. The dotted line represents theflight track of the NRL P-3. The flight-level winds are shown along the track. Surface reports of temperature, dewpoint temperature(°C), and wind speed and direction are plotted. The location of the radar is shown by the black cross. Wind vectors are plotted withthe full barb and half-barb representing 5 and 2.5 m s�1, respectively. The thick, dashed lines are the state borders. The gray color inradar reflectivity and Doppler velocity represents values that are off the scale. The red arrows on the radar reflectivity plot denote theposition of a thin line.
OCTOBER 2006 W A K I M O T O E T A L . 2799
Fig 7 live 4/C
rived vertical velocities in the region of overlappingcoverage.
3. Environmental conditions, storm movement,and the damage survey
There was an extensive region of large convectiveavailable potential energy (CAPE) from 1500 to3000 J kg�1 over large sections of Nebraska, Iowa,Missouri, and Illinois by the early evening of 5 July(not shown). Southerly flow at the 850-mb level wasadvecting warm, moist air into Kansas and Nebraska,and an upper-level shortwave trough was propagatingthrough South Dakota and Nebraska (not shown). Asounding that was representative of the environmentalconditions was launched from Omaha at 0000 UTC 6July (Fig. 3). The CAPE was estimated to be 2860 Jkg�1 and the surface to 6 km integrated shear was �24m s�1, within the range of values that could supportbow echoes (e.g., Evans and Doswell 2001; Coniglioet al. 2004). A dropsonde released �90 km southeast ofOmaha at 0202 UTC (not shown) exhibited a similarwind shear. The thermodynamic profile was also con-sistent, except for several degrees of surface nocturnalcooling and a 1°–2°C warming in the 800–500-mblayer. The CAPE for this sounding was estimated to be�1600 J kg�1.
Scattered thunderstorms initiated over southwestern
South Dakota by �1900 UTC 5 July. The storms movedsoutheastward into north-central Nebraska by 0100UTC and slowly organized into a quasi-linear convec-tive system. An isochrone analysis of the radar reflec-tivity pattern associated with the storm during theperiod from 0200 to 0700 UTC is shown in Fig. 4.The echoes associated with the MCS assumed a bowshape at �0400 UTC based on time-lapse images ofthe radar reflectivity from the OAX Weather Surveil-lance Radar-1988 Doppler (WSR-88D) data. The echomaintained a convex shape for several hours until therewas rapid dissipation of the storm complex around0700.
Also plotted in Fig. 4 is the flight track of the NRLP-3. The aircraft first intercepted the bow echo at�0405 UTC and began flying a series of southwest–northeast legs. Convection that developed ahead of thebow echo prevented the aircraft from flying further tothe north at this time. This convection soon dissipatedand by 0500 UTC the P-3 was able to execute five north–south flight legs centered on the apex of the bow echo.
The strong winds accompanying the bow echo led towidespread reports of damage in eastern Nebraska andwestern Iowa (NCDC 2003). Numerous trees wereblown down and a number of structures were damaged.A detailed aerial and ground survey was undertakenseveral days after this event in order to document theextent of the damage. Two light aircraft flew over the
FIG. 8. (a) Radar reflectivity and (b) single-Doppler velocity from the OAX WSR-88D at 0545 UTC. The dotted line represents theflight track of the NRL P-3. The flight-level winds are shown along the track. The gray and black lines are based on the damage mapshown in Fig. 5a. Surface reports of temperature, dewpoint temperature (°C), and wind speed and direction are plotted. The azimuthaldirection to the OAX radar is shown by the black arrow in (b). Wind vectors are plotted with the full barb and half-barb representing5 and 2.5 m s�1, respectively. The gray color in radar reflectivity and Doppler velocity represents values that are off the scale.
2800 M O N T H L Y W E A T H E R R E V I E W VOLUME 134
Fig 8 live 4/C
affected area on two consecutive days. Ground surveysof the region were also performed over a 2.5-day pe-riod. The results of the surveys are presented in Fig. 5.The direction of each fallen tree and large limb in theaffected area was plotted. Damage intensity was deter-mined by the number and size of downed trees in aparticular region. The dotted line in Fig. 5 representsthe region beyond which no damage was documented.There were several areas rated greater than F0 in dam-age intensity on the Fujita scale (Fujita 1981). The areabetween the dotted line and the F0 contour was char-acterized by sporadic damage (e.g., large limbs brokenoff and an occasional tree down). The alignment of thedamage vectors is shown by the flow lines, but it wassubjectively assessed as not meeting the F0 criteria ow-ing to the lack of continuous damage in the region.There was a significant area of damage rated greaterthan F1 located �20 km southwest of Harlan, Iowa(HNR), and two isolated pockets of damage rated F1 innorthern Omaha. The documentation of the surfacedamage in the aftermath of the Omaha bow echo isimportant because it represents the “ground truth”when compared to the wind syntheses of the Dopplerradar data to be shown later.
The Omaha bow echo created an east–west swath ofdamage in eastern Nebraska and western Iowa that was�50 km wide and over 200 km long. These dimensionsare comparable to the well-documented northern Wis-consin damage survey performed by Fujita (1978). It isalso consistent with other cases shown by Fujita (1978,1981), Fujita and Wakimoto (1981), and Forbes andWakimoto (1983). The flow arrows suggest that thedamaging winds were from the northwest near Colum-bus, Nebraska. The damaging winds slowly shift and arefrom a westerly direction near the Missouri River intowestern Iowa (Fig. 5a). No tornado tracks were docu-mented during the survey owing to the absence of anylinear damage tracks or circulation patterns in thedowned trees (see Fujita 1981; Forbes and Wakimoto1983). The relative absence of damage immediately tothe east of the Missouri River does not appear to berelated to topography. Instead, it appears to be a resultof a temporary weakening of the near-surface windsfollowed by a reintensification of the descending rear-inflow jet and the development of a bow echo apex thatis documented in section 4.
An enlargement of the area experiencing the greatestdamage in western Iowa is enlarged in Fig. 5b. Theindividual vectors of fallen trees/limbs and structuraldamage are shown. The characteristic diffluent pattern(as shown by the gray arrows, see also Fujita 1981) isevident in the region rated �F0 in damage intensity.
There was also a pronounced microburst pattern in thedamage �15 km northwest of Harlan. Fortunately,there was an automated weather station located nearHNR and within the F0 region. The time series of datareveals that the surface wind direction shifts fromsoutherly to westerly after the passage of the gust front(Fig. 6). The temperature and dewpoint temperatureboth show a characteristic drop and the pressure rose.The mean wind speed and peak gust increased withinthe cold air. The range of wind speeds that are associ-ated with F0 in damage intensity is indicated in Fig. 6.Unfortunately, there were several time intervals whenno peak gusts were recorded at the HNR station. Thevalues that are plotted, however, all lie within the F0range. This is consistent with the aerial and groundsurvey, which rated the damage in this region betweenF0 and F1. It should be noted that the survey shown inFig. 5 was finalized before examining the HNR winddata. Hence, the latter provided an independent checkof the estimated damage intensity scale even though
FIG. 9. Multi-Doppler wind synthesis that combines radar datarecorded by the NOAA P-3 and NRL P-3 at 0435:02–0450:17UTC at 1.6 km AGL. Storm-relative winds are plotted. The radarreflectivity is from the WSR-88D located at Omaha (position in-dicated by the black cross). Gray lines are radar reflectivity withvalues �30 dBZ shaded light gray and �50 dBZ shaded dark gray.Aircraft tracks are depicted by the thin dashed lines. The damageat the surface is based on the results presented in Fig. 5a and isshown by the dotted and solid black lines.
OCTOBER 2006 W A K I M O T O E T A L . 2801
such comparisons should be viewed with caution(Doswell and Burgess 1988).
4. Radar analyses
a. Single-Doppler analyses
The radar reflectivity and single-Doppler velocitydata from the OAX WSR-88D at 0400 and 0600 UTCare shown in Fig. 7. Also plotted on the figure are thesurface weather data and damage/no-damage boundarybased on the results presented in Fig. 5. Surface tem-peratures were a few degrees colder than the valuesshown in the sounding launched from Omaha (Fig. 3),suggesting that the environmental air at low levels hadstabilized. Accordingly, the comparison of single-Doppler velocities with the damage survey illustrated inthis figure is important. It is possible that the high winds
measured by the radar at the lowest elevation angleremained aloft and may not be reaching the surfaceowing to the ambient stratification.
A gust front was apparent as a thin line of radarreflectivity and as a gradient of Doppler velocities (Wil-son and Schreiber 1986). The winds behind the front at0400 UTC were strong with magnitudes �40 m s�1
(Fig. 7a). Note that there is no obvious relationshipbetween the regions of high Doppler velocities and thedamage reported at the surface. This may, in part, bedue to the height of the center of the beam above theground (�1 km) at long ranges from the radar location.The NRL P-3 flight track is also plotted on Fig. 7 andillustrates that several flight legs were flown close to theapex of a bowing segment of the convective line (Fig.7b). An enlargement of the bow apex at 0545 UTC,when the winds were producing an extensive area ofdamage rated greater than F1 in intensity, is shown in
FIG. 10. Dual-Doppler wind synthesis at 0510:01–0522:20 UTC at 400 m AGL. (a) Storm-relative winds superimposed onto radarreflectivity and (b) ground-relative winds superimposed onto single-Doppler velocities. Vertical vorticity (dashed lines) and velocity(solid black lines) are plotted on both figures. The dotted line represents the flight track of the NRL P-3. The damage at the surfaceis based on the results presented in Fig. 5a and is shown by the dashed red, solid red, and magenta lines. The black box is enlarged inPart II. The gray line indicates the position of a vertical cross section shown in Fig. 11. The viewing angle of the radar is shown in (b).
2802 M O N T H L Y W E A T H E R R E V I E W VOLUME 134
Fig 10 live 4/C
Fig. 8. The strongest Doppler velocities away from theradar were near the apex and confined within the re-gion outlined by the F1 isopleth. This is an example ofthe good agreement between the measured wind speedsand the damage survey.
b. Multi-Doppler analyses
As previously mentioned, there were a total of fiveELDORA legs flown along the leading edge of theconvective region. Two additional wind syntheses werecreated by merging the data collected by ELDORAand the NOAA P-3 radar. Fortunately, these data cap-tured the evolution of the MCS from a quasi-linearconvective system to a bow echo. The comparison ofthe Doppler analysis with the damage survey facilitates
the understanding of where the strongest low-levelwinds are generated. The details of the wind synthesesare presented in the appendix.
1) 0435:02–0450:17 UTC
An analysis of the dual-Doppler wind synthesis thatcombines the data collected by ELDORA and theNOAA P-3 radar from 0435 to 0450 UTC at 1.6 km isshown in Fig. 9. The relatively coarse resolution of thisDoppler analysis provided an opportunity to import thereflectivity data from the nearby WSR-88D radar lo-cated at Omaha in order to minimize the effects ofattenuation suffered by the airborne radars. As statedin the appendix, the imposed filtering on the wind fieldeffectively removes smaller-scale features (e.g., meso-
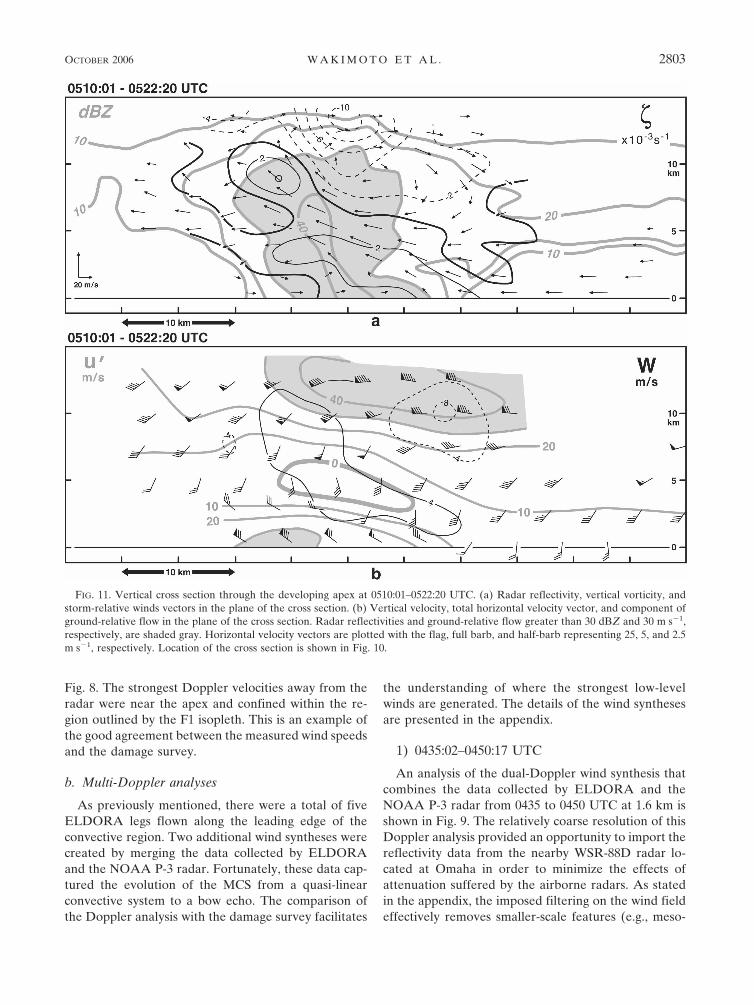
FIG. 11. Vertical cross section through the developing apex at 0510:01–0522:20 UTC. (a) Radar reflectivity, vertical vorticity, andstorm-relative winds vectors in the plane of the cross section. (b) Vertical velocity, total horizontal velocity vector, and component ofground-relative flow in the plane of the cross section. Radar reflectivities and ground-relative flow greater than 30 dBZ and 30 m s�1,respectively, are shaded gray. Horizontal velocity vectors are plotted with the flag, full barb, and half-barb representing 25, 5, and 2.5m s�1, respectively. Location of the cross section is shown in Fig. 10.
OCTOBER 2006 W A K I M O T O E T A L . 2803
vortices). As a result, only the system-scale circulationsare resolved.
A rear-inflow jet (10–15 m s�1) centered within therear-inflow notch is shown. The ground-relativestrength of this jet was 30–35 m s�1 and is seen extend-ing toward the bow apex and the damage reported atthe surface. The damage covered a large region at thistime but was rated �F0. A shear zone is evident alongthe northeastern edge of the rear inflow; however, noclosed circulation is readily apparent in the wind field.Accordingly, this period may best be described as theincipient stages of the cyclonic bookend vortex. Thetwo aircraft were too far apart at this time to constructa true quad-Doppler wind synthesis of the convectiveline because there was little overlap of the analysis do-mains.
2) 0510:01–0522:20 UTC
The first ELDORA-only pass along the leading edgeof the line of intense convection is shown in Fig. 10. The
storm was approaching the western suburbs of Omahaat this time (refer to Fig. 5) and the outflow winds werecausing minor damage in the countryside. Single-Doppler velocities toward the radar in the postfrontalair were �40 m s�1. The viewing angle of the antennawas fortuitous because it was nearly parallel to the post-frontal wind field shown in Fig. 10b. Therefore, thesingle-Doppler velocities approximate the full compo-nent of the wind.
Both the storm- (Fig. 10a) and ground- (Fig. 10b)relative winds are presented because the latter is re-sponsible for the damage presented in Fig. 5. The con-vection was quasi linear at this time and there was ashift from southerly to northwesterly winds across thegust front (Fig. 10b), consistent with the time seriesshown in Fig. 6. The position of the gust front is shownby the boundary between the negative and positivesingle-Doppler velocities located �10 km to the west ofthe flight track (Fig. 10b). Updrafts along the gust frontwere �6 m s�1, and there were several regions where
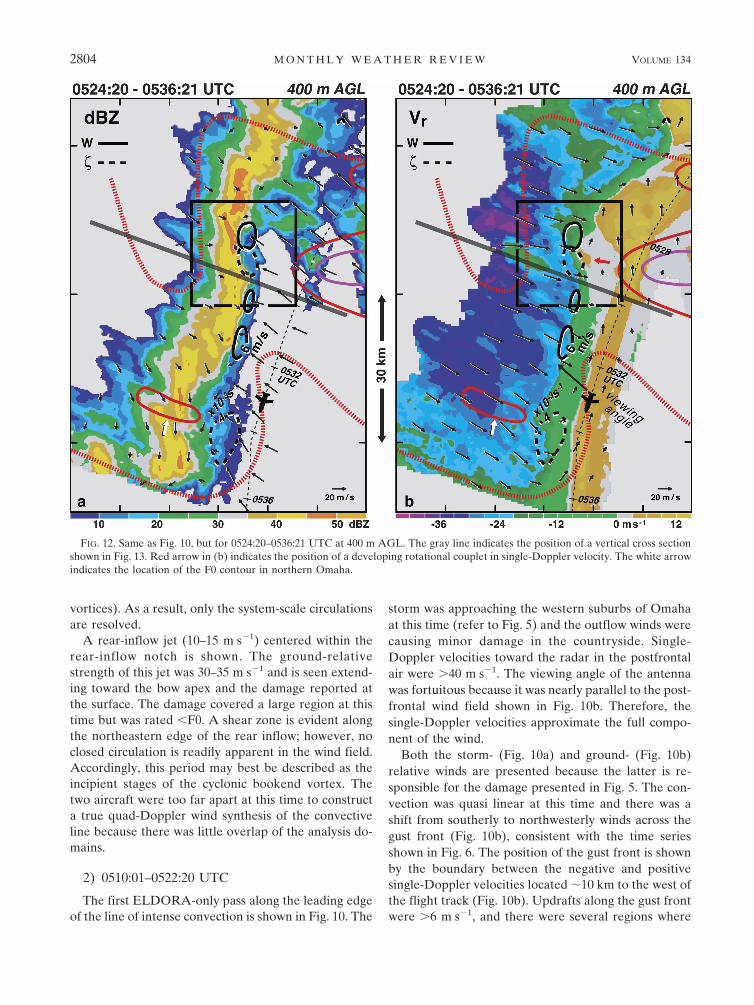
FIG. 12. Same as Fig. 10, but for 0524:20–0536:21 UTC at 400 m AGL. The gray line indicates the position of a vertical cross sectionshown in Fig. 13. Red arrow in (b) indicates the position of a developing rotational couplet in single-Doppler velocity. The white arrowindicates the location of the F0 contour in northern Omaha.
2804 M O N T H L Y W E A T H E R R E V I E W VOLUME 134
Fig 12 live 4/C
the vertical vorticity was �4 � 10�3 s�1. It should benoted that a comparison of the echo patterns shown inFigs. 7 and 10 illustrates the importance of attenuationthat is common when scanning a severe storm with anX-band aircraft radar (e.g., Hildebrand et al. 1981).Fortunately, Doppler velocities were not as severelyimpacted and were typically recorded at a greater rangefrom the radar.
An approximate west–east vertical cross section wasproduced in the region where the apex of the bow echowould subsequently develop (Fig. 11). The classicalmodel of the flow within a squall line associated with atrailing stratiform region is apparent (e.g., Houze et al.1989). A layer of upward-sloping, front-to-rear flowatop a rear-inflow jet is evident in Fig. 11. There wasweak cyclonic vorticity at the interface between thesetwo flows (Fig. 11a) and the updrafts were �4 m s�1.The ground-relative winds at low levels were �40 m s�1
from the north-northwest, and the component in theplane of the cross section was �30 m s�1 (Fig. 11b). Thekinematic depth of the outflow was �3 km.
3) 0524:20–0536:21 UTC
A segment of the convective line, �30 km in length,has begun to “bow out” based on the data collectedduring the southerly pass by the aircraft. The formationof a bow at this time agrees with the increase in damagereported east of the Missouri River as indicated by thedamage contours superimposed onto the analysis (Fig.12). This was also the time when F0 and F1 damage wasoccurring in northeast Omaha (indicated by the whitearrow). There is a region of cyclonic vorticity �4 �10�3 s�1 located east of the F0 damage contour. Thiscyclonic vorticity was also apparent but was locatedfurther to the west in the earlier analysis time (Fig.10a). This vorticity feature appears to support the hy-
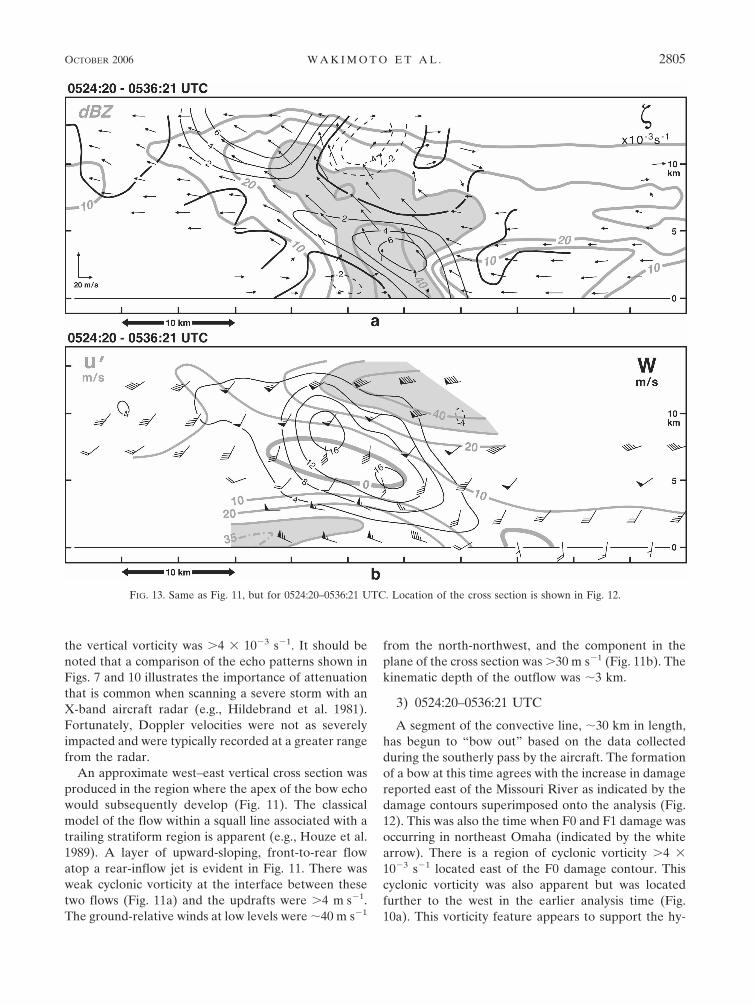
FIG. 13. Same as Fig. 11, but for 0524:20–0536:21 UTC. Location of the cross section is shown in Fig. 12.
OCTOBER 2006 W A K I M O T O E T A L . 2805
pothesis advanced by Trapp and Weisman (2003) thatthe strongest surface damage occurs in close associa-tion with mesoscale circulations/mesovortices that de-velop along the outflow boundary. Another maximumin vorticity can be seen to the north and within theblack box in Fig. 12. This region of cyclonic vorticity isbeing produced by a developing mesovortex. Indeed, asmall rotational couplet can be identified along theoutflow boundary (highlighted by the red arrow inFig. 12b).
A vertical cross section through the developing apexat this time (Fig. 13) reveals a pronounced change in thekinematic structure compared with the earlier time.The outflow winds are now �4 km in depth. The com-ponent of flow in the plane of the cross section is alsostronger (Fig. 13b), suggesting that the rear inflow isintensifying. The region of positive vertical velocitieshas increased and there has also been a dramatic in-crease in the updraft magnitude, which is �16 m s�1.The vertical vorticity along the outflow boundary hasincreased to �6 � 10�3 s�1 (Fig. 13a).
4) 0538:00–0548:26 UTC
The third pass by the Omaha bow echo representsthe time when the damage rated �F1 was occurring inwestern Iowa. There is a convex shape to the convectiveline (�80 km in length) with the apex of the bow echolocated in the black box in Fig. 14. The mesovortex hasincreased in intensity and is now associated with verti-cal vorticity �8 � 10�3 s�1 and is located on the north-ern edge of the F1 contour. A feature that resembles ahook echo has developed at the apex and is collocatedwith the mesovortex. This represents clear evidencethat a relationship exists between the strongest surfacedamage and mesovortices. Note that the single-Doppler velocity plot, once again, is not a good proxyfor identifying the regions that would be subject to thestrongest damaging winds. The largest area of strong,negative Doppler velocities is located in the northernsection of the domain; however, this corresponds to anarea rated �F0 in damage intensity. This emphasizesthe importance of comparing the damage survey with
FIG. 14. Same as Fig. 10, but for 0538:00–0548:26 UTC at 400 m AGL. Surface wind report from HNR is shown on thesingle-Doppler velocity plot. Red arrow denotes the F0 contour associated with a microburst.
2806 M O N T H L Y W E A T H E R R E V I E W VOLUME 134
Fig 14 live 4/C
the Doppler wind synthesis at the lowest grid level toverify the intensity of the winds at the surface. Thestrong correspondence of vertical vorticity and surfacedamage suggests that azimuthal shears (or noting ve-locity couplets in a plot of storm-relative single-Dopp-ler velocities) are a better field to examine rather thannoting the locations of the peak ground-relative veloc-ities shown in Fig. 14b. The vertical cross sectionthrough the apex (not shown) reveals a continuing trendof the outflow winds to intensify and deepen. The maxi-mum updraft speeds at the apex increased to �20 m s�1.
5) 0549:56–0602:23 AND 0604:26–0614:42 UTC
The distortion in the convective line was even morepronounced by the fourth flight leg (Fig. 15). The apexhas assumed a shape that is reminiscent of a spearheadecho—a radar echo with a pointed appendage extend-ing in the direction of echo motion (Fujita and Byers
1977; Fujita 1985). Its appearance is largely a result ofthe horizontal advection of precipitation by the rota-tional flow of the vortex. The gust front (indicated bythe thin line and highlighted by the red arrows in Fig.15a) is ahead of the convective line except near theapex of the bow echo. This is consistent with the con-ceptualization that the line is surging forward in thevicinity of the apex in response to strong rear inflow.
There is another smaller bow-shaped segment of theline near the location of the microburst shown in Fig. 5b(highlighted by the white arrow in Fig. 15). A pocket ofstrong, negative Doppler velocities is located slightlyeast of the F0 contour, and a cyclonic vorticity isopleth(�4 � 10�3 s�1) suggests the presence of a mesovortex.The difficulty of flying near the leading edge of a bowecho is well illustrated in Fig. 15. The flight track showsthat the aircraft veered away from the apex at �0554UTC to avoid penetrating the echo.
A raw vertical scan by ELDORA oriented approxi-
FIG. 15. Same as Fig. 10, but for 0549:56–0602:23 UTC at 400 m AGL. Surface wind report from HNR is shown on the single-Dopplervelocity plot. The northern and southern black boxes are enlarged in Part II. The red arrows indicate the position of the thin lineassociated with the gust front. The white arrow indicates the position of a small bowing segment of the convective line located near amicroburst. The gray line shows the location of a range–height indicator (RHI) scan presented in Fig. 16.
OCTOBER 2006 W A K I M O T O E T A L . 2807
Fig 15 live 4/C
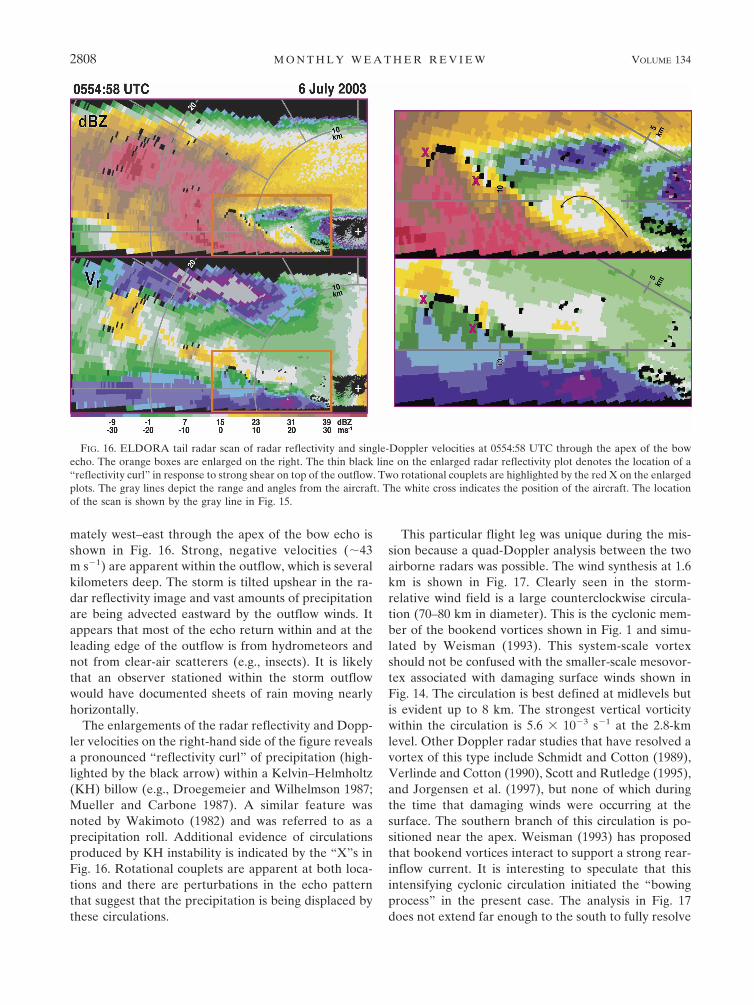
mately west–east through the apex of the bow echo isshown in Fig. 16. Strong, negative velocities (�43m s�1) are apparent within the outflow, which is severalkilometers deep. The storm is tilted upshear in the ra-dar reflectivity image and vast amounts of precipitationare being advected eastward by the outflow winds. Itappears that most of the echo return within and at theleading edge of the outflow is from hydrometeors andnot from clear-air scatterers (e.g., insects). It is likelythat an observer stationed within the storm outflowwould have documented sheets of rain moving nearlyhorizontally.
The enlargements of the radar reflectivity and Dopp-ler velocities on the right-hand side of the figure revealsa pronounced “reflectivity curl” of precipitation (high-lighted by the black arrow) within a Kelvin–Helmholtz(KH) billow (e.g., Droegemeier and Wilhelmson 1987;Mueller and Carbone 1987). A similar feature wasnoted by Wakimoto (1982) and was referred to as aprecipitation roll. Additional evidence of circulationsproduced by KH instability is indicated by the “X”s inFig. 16. Rotational couplets are apparent at both loca-tions and there are perturbations in the echo patternthat suggest that the precipitation is being displaced bythese circulations.
This particular flight leg was unique during the mis-sion because a quad-Doppler analysis between the twoairborne radars was possible. The wind synthesis at 1.6km is shown in Fig. 17. Clearly seen in the storm-relative wind field is a large counterclockwise circula-tion (70–80 km in diameter). This is the cyclonic mem-ber of the bookend vortices shown in Fig. 1 and simu-lated by Weisman (1993). This system-scale vortexshould not be confused with the smaller-scale mesovor-tex associated with damaging surface winds shown inFig. 14. The circulation is best defined at midlevels butis evident up to 8 km. The strongest vertical vorticitywithin the circulation is 5.6 � 10�3 s�1 at the 2.8-kmlevel. Other Doppler radar studies that have resolved avortex of this type include Schmidt and Cotton (1989),Verlinde and Cotton (1990), Scott and Rutledge (1995),and Jorgensen et al. (1997), but none of which duringthe time that damaging winds were occurring at thesurface. The southern branch of this circulation is po-sitioned near the apex. Weisman (1993) has proposedthat bookend vortices interact to support a strong rear-inflow current. It is interesting to speculate that thisintensifying cyclonic circulation initiated the “bowingprocess” in the present case. The analysis in Fig. 17does not extend far enough to the south to fully resolve
FIG. 16. ELDORA tail radar scan of radar reflectivity and single-Doppler velocities at 0554:58 UTC through the apex of the bowecho. The orange boxes are enlarged on the right. The thin black line on the enlarged radar reflectivity plot denotes the location of a“reflectivity curl” in response to strong shear on top of the outflow. Two rotational couplets are highlighted by the red X on the enlargedplots. The gray lines depict the range and angles from the aircraft. The white cross indicates the position of the aircraft. The locationof the scan is shown by the gray line in Fig. 15.
2808 M O N T H L Y W E A T H E R R E V I E W VOLUME 134
Fig 16 live 4/C
the anticyclonic vortex. However, anticyclonic turningof the winds at the southern part of the domain suggeststhat part of the circulation is being sampled.
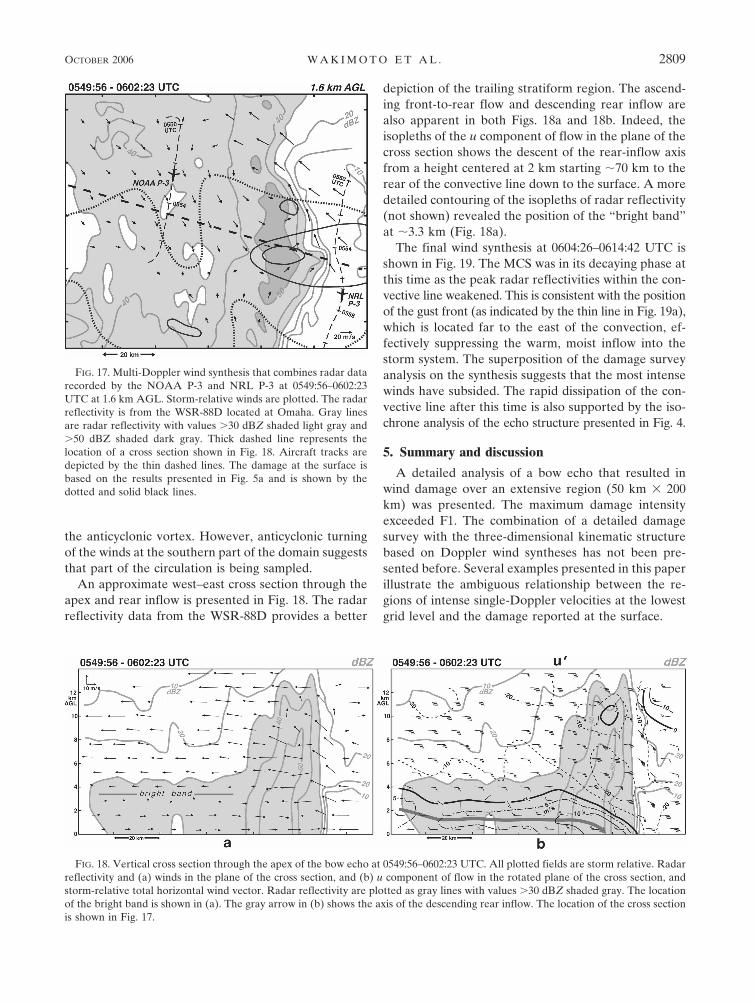
An approximate west–east cross section through theapex and rear inflow is presented in Fig. 18. The radarreflectivity data from the WSR-88D provides a better
depiction of the trailing stratiform region. The ascend-ing front-to-rear flow and descending rear inflow arealso apparent in both Figs. 18a and 18b. Indeed, theisopleths of the u component of flow in the plane of thecross section shows the descent of the rear-inflow axisfrom a height centered at 2 km starting �70 km to therear of the convective line down to the surface. A moredetailed contouring of the isopleths of radar reflectivity(not shown) revealed the position of the “bright band”at �3.3 km (Fig. 18a).
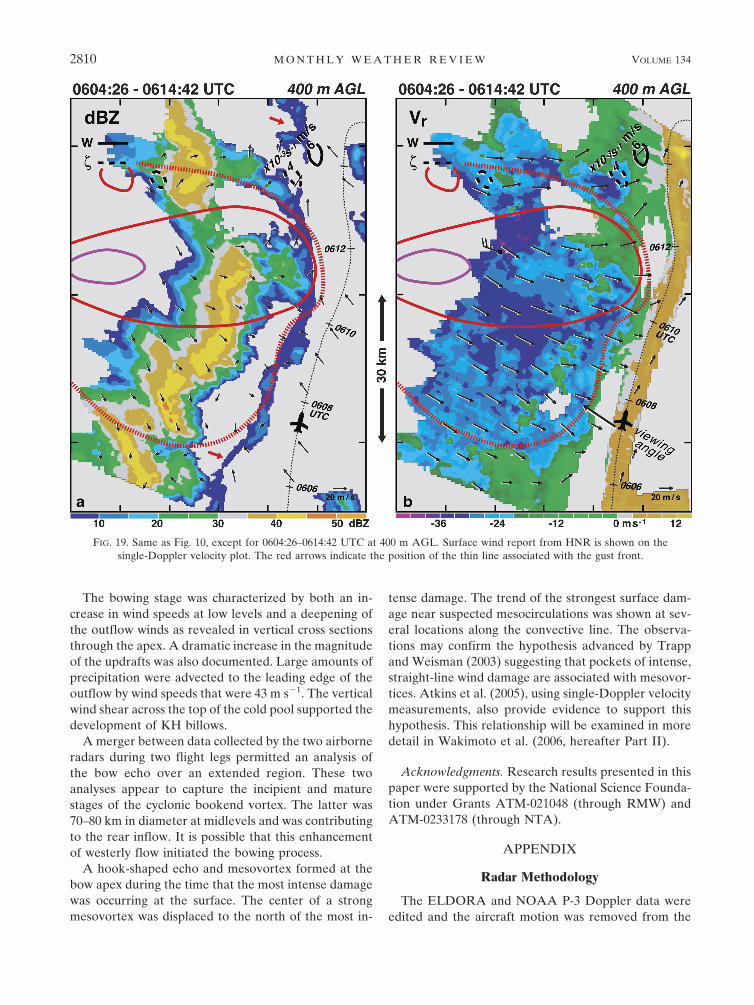
The final wind synthesis at 0604:26–0614:42 UTC isshown in Fig. 19. The MCS was in its decaying phase atthis time as the peak radar reflectivities within the con-vective line weakened. This is consistent with the positionof the gust front (as indicated by the thin line in Fig. 19a),which is located far to the east of the convection, ef-fectively suppressing the warm, moist inflow into thestorm system. The superposition of the damage surveyanalysis on the synthesis suggests that the most intensewinds have subsided. The rapid dissipation of the con-vective line after this time is also supported by the iso-chrone analysis of the echo structure presented in Fig. 4.
5. Summary and discussion
A detailed analysis of a bow echo that resulted inwind damage over an extensive region (50 km � 200km) was presented. The maximum damage intensityexceeded F1. The combination of a detailed damagesurvey with the three-dimensional kinematic structurebased on Doppler wind syntheses has not been pre-sented before. Several examples presented in this paperillustrate the ambiguous relationship between the re-gions of intense single-Doppler velocities at the lowestgrid level and the damage reported at the surface.
FIG. 17. Multi-Doppler wind synthesis that combines radar datarecorded by the NOAA P-3 and NRL P-3 at 0549:56–0602:23UTC at 1.6 km AGL. Storm-relative winds are plotted. The radarreflectivity is from the WSR-88D located at Omaha. Gray linesare radar reflectivity with values �30 dBZ shaded light gray and�50 dBZ shaded dark gray. Thick dashed line represents thelocation of a cross section shown in Fig. 18. Aircraft tracks aredepicted by the thin dashed lines. The damage at the surface isbased on the results presented in Fig. 5a and is shown by thedotted and solid black lines.
FIG. 18. Vertical cross section through the apex of the bow echo at 0549:56–0602:23 UTC. All plotted fields are storm relative. Radarreflectivity and (a) winds in the plane of the cross section, and (b) u component of flow in the rotated plane of the cross section, andstorm-relative total horizontal wind vector. Radar reflectivity are plotted as gray lines with values �30 dBZ shaded gray. The locationof the bright band is shown in (a). The gray arrow in (b) shows the axis of the descending rear inflow. The location of the cross sectionis shown in Fig. 17.
OCTOBER 2006 W A K I M O T O E T A L . 2809
The bowing stage was characterized by both an in-crease in wind speeds at low levels and a deepening ofthe outflow winds as revealed in vertical cross sectionsthrough the apex. A dramatic increase in the magnitudeof the updrafts was also documented. Large amounts ofprecipitation were advected to the leading edge of theoutflow by wind speeds that were 43 m s�1. The verticalwind shear across the top of the cold pool supported thedevelopment of KH billows.
A merger between data collected by the two airborneradars during two flight legs permitted an analysis ofthe bow echo over an extended region. These twoanalyses appear to capture the incipient and maturestages of the cyclonic bookend vortex. The latter was70–80 km in diameter at midlevels and was contributingto the rear inflow. It is possible that this enhancementof westerly flow initiated the bowing process.
A hook-shaped echo and mesovortex formed at thebow apex during the time that the most intense damagewas occurring at the surface. The center of a strongmesovortex was displaced to the north of the most in-
tense damage. The trend of the strongest surface dam-age near suspected mesocirculations was shown at sev-eral locations along the convective line. The observa-tions may confirm the hypothesis advanced by Trappand Weisman (2003) suggesting that pockets of intense,straight-line wind damage are associated with mesovor-tices. Atkins et al. (2005), using single-Doppler velocitymeasurements, also provide evidence to support thishypothesis. This relationship will be examined in moredetail in Wakimoto et al. (2006, hereafter Part II).
Acknowledgments. Research results presented in thispaper were supported by the National Science Founda-tion under Grants ATM-021048 (through RMW) andATM-0233178 (through NTA).
APPENDIX
Radar Methodology
The ELDORA and NOAA P-3 Doppler data wereedited and the aircraft motion was removed from the
FIG. 19. Same as Fig. 10, except for 0604:26–0614:42 UTC at 400 m AGL. Surface wind report from HNR is shown on thesingle-Doppler velocity plot. The red arrows indicate the position of the thin line associated with the gust front.
2810 M O N T H L Y W E A T H E R R E V I E W VOLUME 134
Fig 19 live 4/C
velocity field using the Solo II software package (Oyeet al. 1995). The data were then corrected for naviga-tional errors using a technique developed by Testud etal. (1995). The along-track data spacing and sweep-angle beam spacing for ELDORA during BAMEXwere �300 m and 1.4°, respectively. The latter led to aneffective sampling of �600 m in the vertical for thedistances from the radar used in this study. Accord-ingly, the ELDORA-only wind syntheses shown in thispaper were interpolated onto a grid with a horizontaland vertical grid spacing of 400 and 600 m, respectively.For the analyses that merged ELDORA and NOAAP-3 data (0435–0450 and 0549–0602 UTC flight legs),the interpolation grid was 1.2 km in the horizontal by600 m in the vertical. The data were time–space ad-justed to account for the overall storm motion. The firstsynthesis used 290° at 21 m s�1. The two subsequentsynthesis times used 285° at 22 m s�1 during the bowingstage of the MCS. The last three synthesis times used285° at 20 m s�1. A Cressman filter (Cressman 1959)was applied during the interpolation process with a ra-dius of influence of 400 m in the horizontal and 600 min the vertical (1200 m in the horizontal and 600 m inthe vertical for the combined datasets). Sensitivity stud-ies with larger radii of influence did not significantlyalter the results. The lowest level was chosen to be at400 m AGL.
The synthesis of the radar data was performed usingCustom Editing and Display of Reduced Information inCartesian Space (CEDRIC; Mohr et al. 1986). The in-tent of this wind synthesis was to provide the generalflow features associated with the developing bow echo.Accordingly, a four-step Leise filter (Leise 1982) wasapplied to the Doppler wind field. This filter effectivelyremoves wavelengths less than 6.4 km. (A three-stepLeise filter was applied to the combined datasets, whicheffectively removes wavelengths less than 9.6 km.) Thehydrometeor fall speeds were estimated from the re-flectivity terminal fall speed relationship established byJoss and Waldvogel (1970) with a correction for theeffects of air density (Foote and du Toit 1969). Verticalvelocities were obtained from the horizontal conver-gence in a variational sense (O’Brien 1970) such that anintegration of the anelastic continuity equation metboth the upper and lower boundary conditions of w �0 m s�1. The radar reflectivity from the Omaha WSR-88D was incorporated into the analysis that mergedELDORA and NOAA P-3 data owing to the attenua-tion problems experienced by both airborne radars.
REFERENCES
Atkins, N. T., J. M. Arnott, R. W. Przybylinski, R. A. Wolf, andB. D. Ketcham, 2004: Vortex structure and evolution within
bow echoes. Part I: Single-Doppler and damage analysis ofthe 29 June 1998 derecho. Mon. Wea. Rev., 132, 2224–2242.
——, C. S. Bouchard, R. W. Przybylinski, R. J. Trapp, and G.Schmocker, 2005: Damaging surface wind mechanism withinthe 10 June 2003 Saint Louis bow echo during BAMEX.Mon. Wea. Rev., 133, 2275–2296.
Burgess, D. W., and B. F. Smull, 1990: Doppler radar observationsof a bow echo associated with a long-track severe windstorm.Preprints, 16th Conf. on Severe Local Storms, KananaskisPark, AB, Canada, Amer. Meteor. Soc., 203–208.
Chong, M., P. Amayenc, G. Scialom, and J. Testud, 1987: A tropi-cal squall line observed during the COPT 81 experiment inwest Africa. Part I: Kinematic structure inferred from dual-Doppler radar data. Mon. Wea. Rev., 115, 670–694.
Coniglio, M. C., D. J. Stensrud, and M. B. Richman, 2004: Anobservational study of derecho-producing convective storms.Wea. Forecasting, 19, 320–337.
Cressman, G. P., 1959: An operational objective analysis system.Mon. Wea. Rev., 87, 367–374.
Davis, C., and Coauthors, 2004: The Bow Echo and MCV Experi-ment: Observations and opportunities. Bull. Amer. Meteor.Soc., 85, 1075–1093.
Doswell, C. A., and D. W. Burgess, 1988: On some issues ofUnited States tornado climatology. Mon. Wea. Rev., 116,495–501.
Droegemeier, K. K., and R. B. Wilhelmson, 1987: Numericalsimulation of thunderstorm outflow dynamics. Part I: Out-flow sensitivity experiments and turbulence dynamics. J. At-mos. Sci., 44, 1180–1210.
Evans, J. S., and C. A. Doswell III, 2001: Examination of derechoenvironments using proximity soundings. Wea. Forecasting,16, 329–342.
Foote, G. B., and P. S. du Toit, 1969: Terminal velocity of rain-drops aloft. J. Appl. Meteor., 8, 249–253.
Forbes, G. S., and R. M. Wakimoto, 1983: A concentrated out-break of tornadoes, downbursts and microbursts, and impli-cations regarding vortex classification. Mon. Wea. Rev., 111,220–235.
Fujita, T. T., 1978: Manual of downburst identification for projectNIMROD. University of Chicago SMRP Research Paper156, 104 pp.
——, 1979: Objective, operation, and results of Project NIMROD.Preprints, 11th Conf. on Severe Local Storms, Kansas City,MO, Amer. Meteor. Soc., 259–266.
——, 1981: Tornadoes and downbursts in the context of general-ized planetary scales. J. Atmos. Sci., 38, 1511–1534.
——, 1985: The downburst. University of Chicago SMRP Re-search Paper 210, 122 pp.
——, and H. R. Byers, 1977: Spearhead echo and downbursts inthe crash of an airliner. Mon. Wea. Rev., 105, 129–146.
——, and R. M. Wakimoto, 1981: Five scales of airflow associatedwith a series of downbursts of 16 July 1980. Mon. Wea. Rev.,109, 1438–1456.
Funk, T. W., K. E. Darmofal, J. D. Kirkpatrick, V. L. DeWald,R. W. Przybylinski, G. K. Schmocker, and Y.-J. Lin, 1999:Storm reflectivity and mesocyclone evolution associated withthe 15 April 1994 squall line over Kentucky and southernIndiana. Wea. Forecasting, 14, 976–993.
Hamilton, R. E., 1970: Use of detailed intensity radar data inmesoscale surface analysis of the 4 July 1969 storm in Ohio.Preprints, 14th Conf. on Radar Meteorology, Tucson AZ,Amer. Meteor. Soc., 339–342.
Hildebrand, P. H., R. A. Oye, and R. E. Carbone, 1981: X-band vs
OCTOBER 2006 W A K I M O T O E T A L . 2811
C-band aircraft radar: The relative effects of beamwidth andattenuation in severe storm situations. J. Appl. Meteor., 20,1353–1361.
——, C. A. Walther, C. L. Frush, J. Testud, and F. Baudin, 1994:The ELDORA/ASTRAIA airborne Doppler weather radar:Goals, design and first field tests. Proc. IEEE, 82, 1873–1890.
——, and Coauthors, 1996: The ELDORA/ASTRAIA airborneDoppler weather radar: High-resolution observations fromTOGA COARE. Bull. Amer. Meteor. Soc., 76, 213–232.
Houze, R. A., 1977: Structure and dynamics of a tropical squall-line system. Mon. Wea. Rev., 105, 1540–1567.
——, S. A. Rutledge, M. I. Biggerstaff, and B. F. Smull, 1989: In-terpretation of Doppler weather radar displays of midlatitudemesoscale convective systems. Bull. Amer. Meteor. Soc., 70,608–619.
Johns, R. H., and W. D. Hirt, 1987: Derechoes: Widespread con-vectively induced windstorms. Wea. Forecasting, 2, 32–49.
Jorgensen, D. P., and B. F. Smull, 1993: Mesovortex circulationsseen by airborne Doppler radar within a bow-echo mesoscaleconvective system. Bull. Amer. Meteor. Soc., 74, 2146–2157.
——, and T. M. Weckwerth, 2003: Forcing and organization ofconvective systems. Radar and Atmospheric Science: A Col-lection of Essays in Honor of David Atlas. Meteor. Monogr.,No. 52, Amer. Meteor. Soc., 75–113.
——, P. H. Hildebrand, and C. L. Frush, 1983: Feasibility test ofan airborne pulse-Doppler meteorological radar. J. ClimateAppl. Meteor., 22, 744–757.
——, T. Matejka, and J. D. DuGranrut, 1996: Multi-beam tech-niques for deriving wind fields from airborne Doppler radars.J. Meteor. Atmos. Phys., 59, 83–104.
——, M. L. LeMone, and S. B. Trier, 1997: Structure and evolu-tion of the 22 February 1993 TOGA COARE squall line:Aircraft observations of precipitation, circulation, and sur-face energy fluxes. J. Atmos. Sci., 54, 1961–1985.
Joss, J., and D. Waldvogel, 1970: Raindrop size distribution andDoppler velocities. Preprints, 14th Conf. on Radar Meteorol-ogy, Tucson, AZ, Amer. Meteor. Soc., 153–156.
Klimowski, B. A., 1994: Initiation and development of rear inflowwithin the 28–29 June 1989 North Dakota mesoconvectivesystem. Mon. Wea. Rev., 122, 765–779.
——, M. R. Hjelmfelt, and M. J. Bunker, 2004: Radar observa-tions of the early evolution of bow echoes. Wea. Forecasting,19, 727–734.
Lafore, J.-P., and M. W. Moncrieff, 1989: A numerical investiga-tion of the organization and interaction of the convective andstratiform regions of tropical squall lines. J. Atmos. Sci., 46,521–544.
Laing, A. G., and J. M. Fritsch, 1997: The global population ofmesoscale convective complexes. Quart. J. Roy. Meteor. Soc.,123, 389–405.
Leise, J. A., 1982: A multidimensional scale-telescoped filter anddata extension package. NOAA Tech. Memo. ERL WPL-82,19 pp.
Lin, X., and R. J. Johnson, 1994: Heat and moisture budgets andcirculation characteristics of a frontal squall line. J. Atmos.Sci., 51, 1661–1681.
Mohr, C. G., L. J. Miller, R. L. Vaughn, and H. W. Frank, 1986:The merger of mesoscale datasets into a common Cartesianformat for efficient and systematic analysis. J. Atmos. Oce-anic Technol., 3, 143–161.
Mueller, C. K., and R. E. Carbone, 1987: Dynamics of a thunder-storm outflow. J. Atmos. Sci., 44, 1879–1898.
NCDC, 2003: Storm Data. Vol. 45, No. 7, 478 pp.Nolen, R. H., 1959: A radar pattern associated with tornadoes.
Bull. Amer. Meteor. Soc., 40, 277–279.O’Brien, J. J., 1970: Alternative solutions to the classical vertical
velocity problem. J. Appl. Meteor., 9, 197–203.Oye, R., C. Mueller, and S. Smith, 1995: Software for radar trans-
lation, visualization, editing and interpolation. Preprints, 27thConf. on Radar Meteorology, Vail, CO, Amer. Meteor. Soc.,359–364.
Przybylinski, R. W., 1995: The bow echo: Observations, numericalsimulations, and severe weather detection methods. Wea.Forecasting, 10, 203–218.
Schmidt, J. M., and W. R. Cotton, 1989: A high plains squall lineassociated with severe surface winds. J. Atmos. Sci., 46, 281–302.
Scott, J. D., and S. A. Rutledge, 1995: Doppler radar observationsof an asymmetric mesoscale convective system and associatedvortex couplet. Mon. Wea. Rev., 123, 3437–3457.
Smull, B. F., and R. A. Houze Jr., 1987: Rear inflow in squall lineswith trailing stratiform precipitation. Mon. Wea. Rev., 115,2869–2889.
Testud, J., P. H. Hildebrand, and W.-C. Lee, 1995: A procedure tocorrect airborne Doppler radar data for navigation errorsusing the echo returned from the earth’s surface. J. Atmos.Oceanic Technol., 12, 800–820.
Trapp, R. J., and M. L. Weisman, 2003: Low-level mesovorticeswithin squall lines and bow echoes. Part II: Their genesis andimplications. Mon. Wea. Rev., 131, 2804–2823.
Verlinde, J., and W. R. Cotton, 1990: A mesoscale vortex coupletobserved in the trailing anvil of a multicellular convectivecomplex. Mon. Wea. Rev., 118, 993–1010.
Wakimoto, R. M., 1982: The life cycle of thunderstorm gust frontsas viewed with Doppler radar and rawinsonde data. Mon.Wea. Rev., 110, 1060–1082.
——, 2001: Convectively driven high wind events. Severe Convec-tive Storms, Meteor. Monogr., No. 50, Amer. Meteor. Soc.,255–298.
——, W.-C. Lee, H. B. Bluestein, C.-H. Liu, and P. H. Hilde-brand, 1996: ELDORA observations during VORTEX 95.Bull. Amer. Meteor. Soc., 77, 1465–1481.
——, H. V. Murphey, C. A. Davis, and N. T. Atkins, 2006: Highwinds generated by bow echoes. Part II: The relationshipbetween the mesovortices and damaging straight-line winds.Mon. Wea. Rev., 134, 2813–2829.
Weisman, M. L., 1992: The role of convectively generated rear-inflow jets in the evolution of long-lived mesoconvective sys-tems. J. Atmos. Sci., 49, 1826–1847.
——, 1993: The genesis of severe, long-lived bow echoes. J. At-mos. Sci., 50, 645–670.
——, 2001: Bow echoes: A tribute to T. T. Fujita. Bull. Amer.Meteor. Soc., 82, 97–116.
——, and R. J. Trapp, 2003: Low-level mesovortices within squalllines and bow echoes. Part I: Overview and sensitivity toenvironmental vertical wind shear. Mon. Wea. Rev., 131,2779–2803.
Wilson, J. W., and W. E. Schreiber, 1986: Initiation of convectivestorms at radar-observed boundary-layer convergence lines.Mon. Wea. Rev., 114, 2516–2536.
Zipser, E. J., 1977: Mesoscale and convective-scale downdrafts asdistinct components of squall-line structure. Mon. Wea. Rev.,105, 1568–1589.
2812 M O N T H L Y W E A T H E R R E V I E W VOLUME 134