40
Higher Education in Australia A review of reviews from Dawkins to today Opportunity through learning

Higher Education in Australia A review of reviews from Dawkins to today
Opportunity through learning
ISBN
978-1-76028-431-2 [PDF] 978-1-76028-432-9 [DOCX]
With the exception of the Commonwealth Coat of Arms, the Department’s logo, any material protected by a trade mark and where otherwise noted all material presented in this document is provided under a Creative Commons Attribution 3.0 Australia (http://creativecommons.org/licenses/by/3.0/au/) licence.
The details of the relevant licence conditions are available on the Creative Commons website (accessible using the links provided) as is the full legal code for the CC BY 3.0 AU licence (http://creativecommons.org/licenses/by/3.0/au/legalcode).
The document must be attributed as Higher Education Funding in Australia, Department of Education and Training, Canberra 2015.

Contents Executive Summary ................................................................................................................................. 4
1. Australia’s higher education system today ......................................................................................... 5
2. Reviews of Australia’s higher education funding system ................................................................. 11
1988 Higher Education: a Policy Statement (Dawkins white paper) ................................................ 11
1998 Learning for Life: review of higher education financing and policy (West Review) ................ 14
2002 Review of Higher Education in Australia (Nelson Review)....................................................... 16
2008 Review of Australian Higher Education (Bradley Review) ....................................................... 19
2011 Higher Education Base Funding Review (Lomax-Smith Review).............................................. 21
2014 Report of the National Commission of Audit ........................................................................... 23
2014 Review of the Demand Driven Funding System (Kemp-Norton Review)................................. 25
3. Timeline of change and reform in Australia’s higher education system .......................................... 28
4. International responses to funding pressures in higher education .................................................. 34
United Kingdom ................................................................................................................................ 35
Germany ............................................................................................................................................ 36
Japan ................................................................................................................................................. 37
New Zealand ..................................................................................................................................... 38

Higher Education in Australia
4
Executive Summary The challenge of funding a high quality higher education system, ensuring it has the capacity to help meet the increasing demand for high level skills in our economy and the aspirations of our students, has been an ongoing concern for successive Australian governments over many years.
This paper reviews the findings and recommendations of significant reviews of Australia’s higher education funding system from the 1988 Dawkins white paper through to the 2014 Review of the Demand Driven Funding System. It summarises the challenges identified and responses proposed across that period as well as some recent international literature about higher education reform.
What is clear from the survey of major reviews from 1988 to the present is the similarity of issues that were of concern to governments of the day. Successive governments have sought to build and fund a higher education system to meet the need for high level skills and innovative research for the Australian economy.
The challenge for all governments has been how to enable greater numbers of students to access the benefits higher education offers – in terms of employment, earnings, social and cultural opportunities – while ensuring the system remains fair, high quality and affordable for both individuals and taxpayers.
The number of domestic higher education students has more than doubled since 1989, reaching just over a million in 2014. International students comprised another 350,000 students in 2014. As student numbers have grown, they have come from more diverse social, economic and academic backgrounds. The number of providers and their diversity has also grown, with around 20 new public universities since the late 1980s and the emergence of significant numbers of non-university providers.
The proportion of the Australian working age population with a bachelor degree or higher qualification has tripled since 1989 to just over 25 per cent.
Direct Australian Government funding for teaching, learning and research has grown both in absolute and real terms, rising from $3.2 billion in 1989 to $15.4 billion in 2014, more than doubling when adjusted for inflation.
Australia is not unique in facing this growth and higher education systems around the world are increasingly moving from elite to mass systems, and beyond to universal systems.

Higher Education in Australia
5
1. Australia’s higher education system today The Australian higher education system comprises both public and private universities, Australian branches of overseas universities, and other non-university higher education providers (NUHEPs). At present, there are 172 registered higher education providers:
• 37 public Australian universities • 3 private Australian universities • 1 private university of specialisation • 2 overseas universities • 129 NUHEPs1
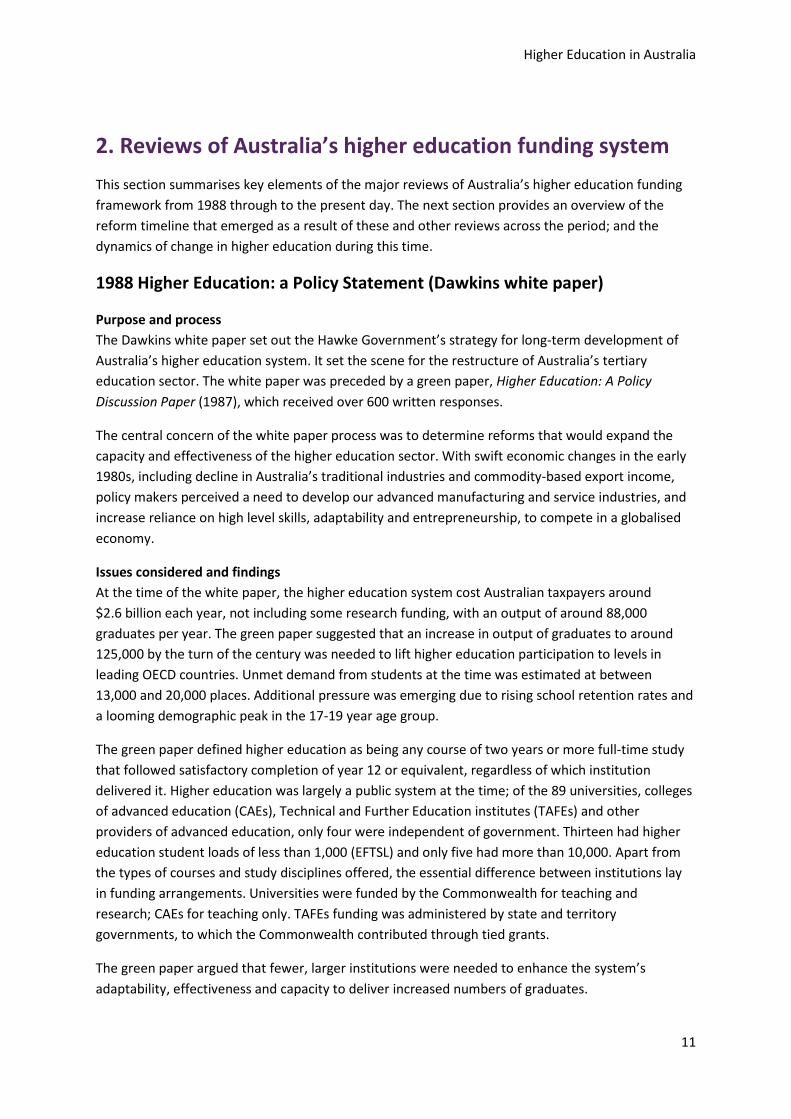
Students Around 1.4 million students were enrolled in higher education in 2014. Of these, nearly 350,000 were international students.
Figure 1: Higher education enrolments 2014
Source: Department of Education and Training
1 TEQSA National Register of Higher Education Providers, www.teqsa.gov.au/national-register (accessed 20/10/2015).
Higher Education in Australia
6
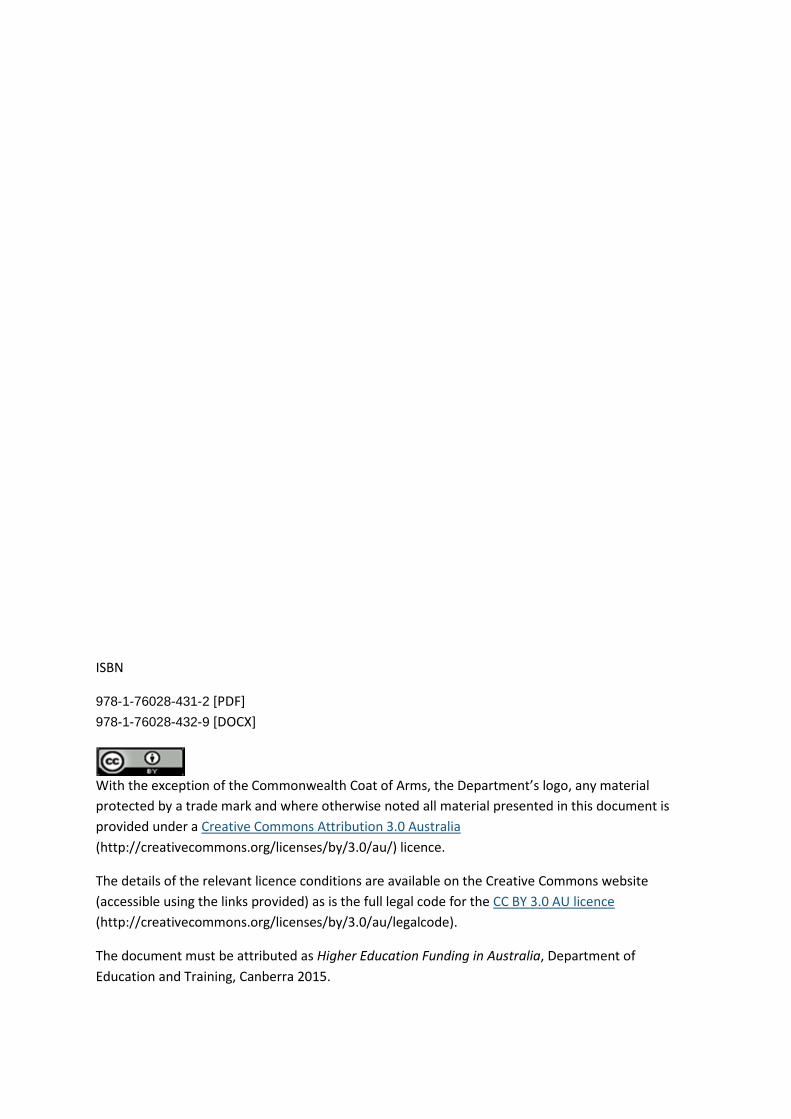
The vast majority of students (92 per cent) are enrolled with universities. The current market share for domestic students is presented in Figure 2 which shows the vast majority (85 per cent) of students study at metropolitan universities. Regional non-university providers have the smallest share of enrolments (0.04 per cent).
Figure 2: Domestic students Equivalent Full-Time Student Load (EFTSL) by provider type and metro/regional, 2014
Source: Department of Education and Training2
Student numbers in all course levels have grown strongly over the past decade from around 718 000 domestic students in 2005 to just over 1 million in 2014. Enrolments in enabling courses have also increased from 6,000 in 2003 to 24,000 in 2014. The majority of students at universities and non-university FEE-HELP providers are enrolled in bachelor degrees. Twenty-five per cent of students at non-university FEE-HELP providers are undertaking diploma qualifications. The majority of students at non-FEE-HELP providers are enrolled in graduate diplomas.
In 2014, regional undergraduate students comprised 149,6003 (20.1 per cent) of 745,700 equivalent full-time domestic undergraduate students. In the same year, Indigenous students made up 1.5 per cent of domestic undergraduate students, and low socio-economic status students (SES)4 made up 17.5 per cent. Regional and outer metropolitan universities typically have higher proportions of low SES students.
2 Universities includes all Table A, B and C providers. Regional Universities includes Charles Sturt, Southern Cross, New England, Federation, Central Queensland, Southern Queensland, Sunshine Coast, Batchelor, Charles Darwin. Regional non-university providers includes Blue Mountains IHMS and SAE Institute/Qantm College Byron Bay campus. 3 2011 Australian Statistical Geography Standard, ASGS, methodology. 4 2011 SEIFA methodology.
611,133
74,099
33,808323
Universities Metropolitan
Universities Regional
Non-University providersMetropolitan
Non-University providersRegional
Higher Education in Australia
7
Funding The Australian Government is the major funder of higher education. Total funding provided by the Government in 2014 was around $15.4 billion – with grant payments of approximately $10 billion and HELP student loan payments of approximately $5.5 billion.
Higher education earned just over two thirds of Australia’s $18 billion in education export income in 2014-15. Education has been Australia’s largest service export for a number of years and it continues to grow.
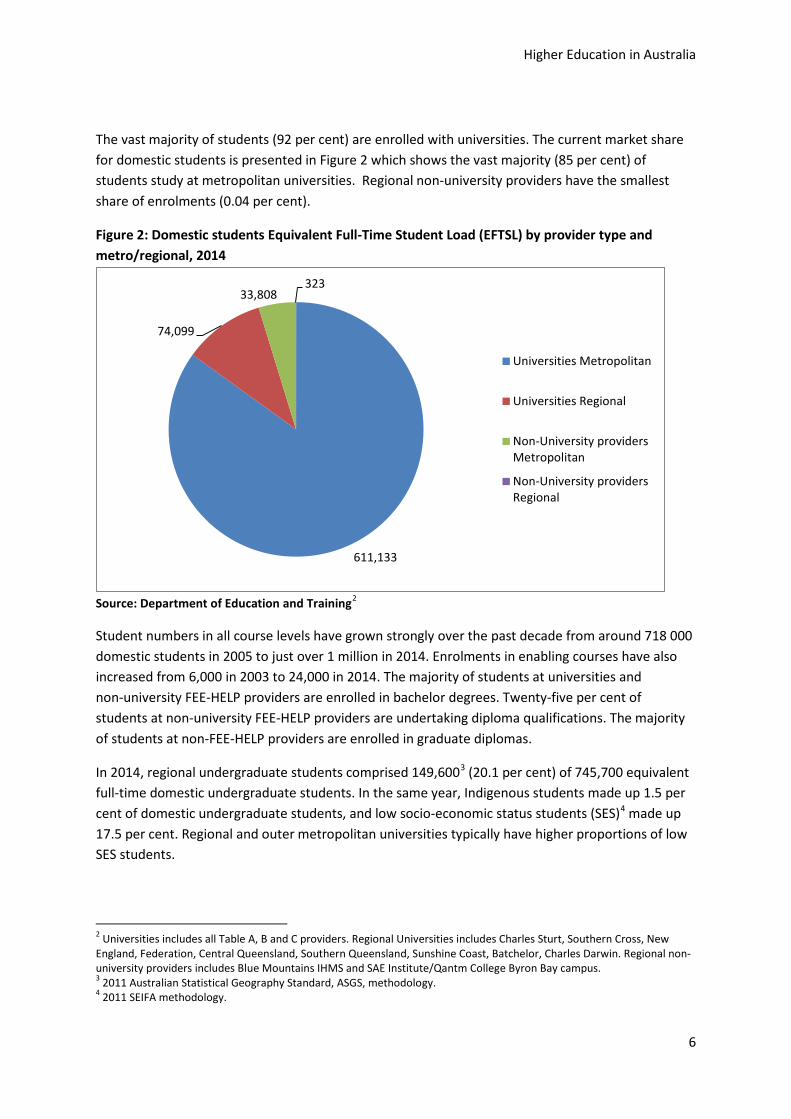
In 2014, public universities reported total revenues of $27.8 billion5, with a net operating result of $1.9 billion6 – a decrease of 5.4 per cent compared to the 2013 result of $2.0 billion. The principal sources of revenue included Australian Government grants (41 per cent), student contributions (mostly from HELP student loans provided by the Government – 22 per cent), and overseas students (16 per cent). There is significant variation in these figures across institutions. Private universities and NUHEPs are more reliant on other sources of income with up to around half coming from non-government sources.
Figure 3: Sources of revenue for public universities, 2003 to 2014 ($A billions)
Source: Department of Education and Training7
5 includes vocational education and training (VET) operations of dual sector providers 6 Department of Education (2015), ‘Finance 2014 – Financial reports of Higher Education Providers 7 The 2008 peak in ‘Other’ is due to an amount of $1.8 billion for the accounting treatment of actuarial changes to deferred government superannuation liabilities (defined benefit obligations) which were impacted by the global financial crisis.

Higher Education in Australia
8
Since 2012 public universities have been able to enrol unlimited numbers of students in Commonwealth-supported bachelor degree places (CSPs), except in medicine. CSPs for sub-bachelor and postgraduate course work qualifications and medicine courses are allocated by the Government.
Forty-four higher education providers (HEPs) (including all 37 public universities) currently offer CSPs to domestic students. The Government subsidises a CSP by paying part of the fees for the place directly to the HEP and the student pays the remainder of the fees through a ‘student contribution’ amount, mostly deferred through HELP loans (see below). Currently, the Government subsidises, on average, around 60 per cent of the actual cost of higher education and the student pays the remaining amount (student contribution amount) to the approved provider.
Student contribution amounts are capped by the Government, the level of which is determined by the unit of study being undertaken (Table 1). While HEPs can charge less than the capped amount, few (if any) do so and this makes the cap the effective price for students.
Table 1: Government and student contributions for a Commonwealth-supported place in 2015
Discipline Contribution per Equivalent Full-Time Student Load (EFTSL)
Student maximum
Government
Total
Per cent paid by student
Humanities $6,256 $5,539 $11,795 53%
Law, accounting, administration, economics, commerce $10,440 $1,994 $12,434 84%
Mathematics, statistics, $8,917 $9,800 $18,717 48%
Behavioural science, social studies $6,256 $9,800 $16,056 39%
Education $6,256 $10,196 $16,452 38%
Clinical psychology, foreign languages, visual and performing arts
$6,256 $12,053 $18,309 34%
Allied health $8,917 $12,053 $20,970 43%
Computing, built environment, other health $8,917 $9,800 $18,717 48%
Nursing $6,256 $13,456 $19,712 32%
Science $8,917 $17,136 $26,053 34%
Engineering, surveying $8,917 $17,136 $26,053 34%
Agriculture $8,917 $21,748 $30,665 29%
Medicine, dentistry, veterinary science $10,440 $21,748 $32,188 32% Source: Department of Education and Training
While the Australian Government sets the maximum student contribution amount for CSPs, it does not place restrictions on maximum fees for domestic students that are not subsidised by CSPs (i.e. those students in full-fee paying places). There are also no restrictions on maximum fees for international students in any course. It is at the provider’s discretion to determine the level of tuition fees it will charge for their courses provided they don’t charge less than Commonwealth supported students.

Higher Education in Australia
9
HELP loans Most domestic students undertaking higher education are eligible for Government provided income-contingent loans through the Higher Education Loan Programme (HELP) to pay for their tuition fees. Eligible students do not need to pay any tuition fees up front. The type of loan they can access depends on the type of provider they are studying at, and the level of qualification being undertaken.
Under the umbrella of the HELP scheme, HECS-HELP is the loan scheme for eligible Commonwealth supported students (i.e. a student in a CSP) (previously known as ‘HECS’). FEE-HELP is the loan for eligible fee paying students in a non-subsidised course. Other loan types cover VET students, expenses relating to student services and amenities fees and overseas study expenses.
Providing the eligibility requirements are met, there is no cap to the amount of study a Commonwealth supported student can undertake and no limit on the loan amount they can access under the HECS-HELP scheme. For most students accessing FEE-HELP, the lifetime borrowing limit in 2015 is $97,728 and for students enrolled in medicine, dentistry or veterinary science it is $122,162.
Individuals with a HELP debt start repaying their accumulated HELP debt when their income is above the minimum repayment threshold for compulsory repayment ($54,126 in 2015-16). Compulsory repayments are calculated as a percentage of a person’s repayment income.
Table 2: Repayment rates for 2015-16 financial year
2015-2016 Repayment income Repayment rate (% of repayment income)
Below $54,126 Nil
$54,126 - $60,292 4.0% $60,293 - $66,456 4.5% $66,457 - $69,949 5.0% $69,950 - $75,190 5.5% $75,191 - $81,432 6.0% $81,433 - $85,718 6.5% $85,719 - $94,331 7.0%
$94,332 - $100,519 7.5% $100,520 and above 8.0%
Source: Australian Taxation Office8
There is no real interest charged on a person’s HELP debt, although it is adjusted on 1 June each year to reflect changes in the Consumer Price Index, which maintains the real value of the debt.
At 30 June 2015, HELP debtors owed the Commonwealth Government $44.12 billion. The Government also estimates the ‘fair value’ of the total HELP debt, which takes account of the debt
8 Australian Taxation Office (2015) ‘HELP and TSL repayment thresholds and rates’, ATO website, available at: https://www.ato.gov.au/Rates/HELP,-TSL-and-SFSS-repayment-thresholds-and-rates/?page=2#HELP_and_TSL_repayment_thresholds_and_rates
Higher Education in Australia
10
not expected to be repaid and cost associated with providing the loan at a concessional interest rate. At 30 June 2015, the fair value of the HELP debt was $30.44 billion.
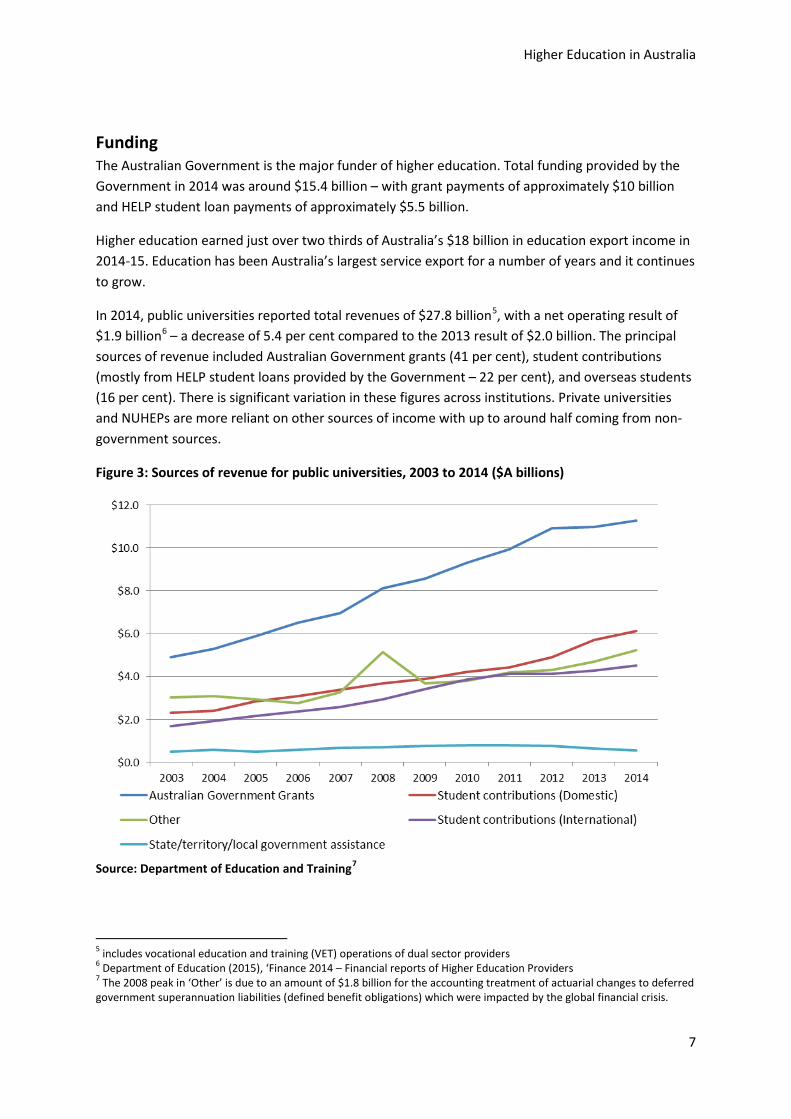
Providers The Tertiary Education Quality and Standards Agency (TEQSA) oversees registration of all providers as Australia’s national higher education regulator. Those providers are diverse in size – half have fewer than 500 EFTSL student load and nearly a quarter have more than 5,000 EFTSL.
Figure 4: Higher education providers by size of student load (EFTSL), 2013
Source: TEQSA9
Information – QILT The Quality Indicators for Learning and Teaching (QILT) is an Australian Government programme which brings together data from higher education students and graduates around Australia, including international students studying in Australia.
The QILT website, www.qilt.edu.au, allows students to compare provider performance at the study area level, across twelve key indicators of quality teaching and learning practices, including:
• overall satisfaction of current students • overall satisfaction of recent graduates • rates of students moving into full-time employment after graduation • the median salary received by recent graduates.
9 TEQSA (2015) Statistics Report on TEQSA Registered Higher Education Providers
Higher Education in Australia
11
2. Reviews of Australia’s higher education funding system This section summarises key elements of the major reviews of Australia’s higher education funding framework from 1988 through to the present day. The next section provides an overview of the reform timeline that emerged as a result of these and other reviews across the period; and the dynamics of change in higher education during this time.
1988 Higher Education: a Policy Statement (Dawkins white paper)
Purpose and process The Dawkins white paper set out the Hawke Government’s strategy for long-term development of Australia’s higher education system. It set the scene for the restructure of Australia’s tertiary education sector. The white paper was preceded by a green paper, Higher Education: A Policy Discussion Paper (1987), which received over 600 written responses.
The central concern of the white paper process was to determine reforms that would expand the capacity and effectiveness of the higher education sector. With swift economic changes in the early 1980s, including decline in Australia’s traditional industries and commodity-based export income, policy makers perceived a need to develop our advanced manufacturing and service industries, and increase reliance on high level skills, adaptability and entrepreneurship, to compete in a globalised economy.
Issues considered and findings At the time of the white paper, the higher education system cost Australian taxpayers around $2.6 billion each year, not including some research funding, with an output of around 88,000 graduates per year. The green paper suggested that an increase in output of graduates to around 125,000 by the turn of the century was needed to lift higher education participation to levels in leading OECD countries. Unmet demand from students at the time was estimated at between 13,000 and 20,000 places. Additional pressure was emerging due to rising school retention rates and a looming demographic peak in the 17-19 year age group.
The green paper defined higher education as being any course of two years or more full-time study that followed satisfactory completion of year 12 or equivalent, regardless of which institution delivered it. Higher education was largely a public system at the time; of the 89 universities, colleges of advanced education (CAEs), Technical and Further Education institutes (TAFEs) and other providers of advanced education, only four were independent of government. Thirteen had higher education student loads of less than 1,000 (EFTSL) and only five had more than 10,000. Apart from the types of courses and study disciplines offered, the essential difference between institutions lay in funding arrangements. Universities were funded by the Commonwealth for teaching and research; CAEs for teaching only. TAFEs funding was administered by state and territory governments, to which the Commonwealth contributed through tied grants.
The green paper argued that fewer, larger institutions were needed to enhance the system’s adaptability, effectiveness and capacity to deliver increased numbers of graduates.

Higher Education in Australia
12
The Government commissioned a Committee on Higher Education Funding, led by former NSW Premier Neville Wran, to develop options on how to fund the expansion sought, including consideration of contributions from students, graduates, their parents and employers.
Recommendations and Government response The white paper set out the Government’s commitment to ‘growth and quality enhancement across the whole of the education and training system’10. It proposed a unified national system of higher education comprising public institutions of a minimum size (2,000 EFTSL). Those with common or adjacent sites were expected to merge under a single management structure. Consolidation proposals would be considered on the basis of educational benefits as well as efficiency grounds. Private institutions receiving Commonwealth funding were excluded from these requirements.
Benchmarks of 5,000 and 8,000 EFTSL, respectively, were adopted as indicative sizes at which the Commonwealth would consider funding a broad range of teaching activities, and research activity across the entire profile of offered disciplines.
In May 1988, the Wran Committee recommended the introduction of student contributions, to be made through the tax system. Once a student’s taxable income reached the average for all working Australians, they would pay an additional two per cent tax until 20 per cent of the cost of their higher education was met. The Committee recommended three different levels of contributions, broadly depending on delivery costs in the discipline: $1500, $2500 and $3000 per year. The Committee recommended both the contribution and the threshold above which repayments were to be made be maintained in real terms. It recommended options be developed for industry to contribute to education and training costs through levy arrangements. The Committee considered that seeking contributions from individuals and businesses that directly benefited from the education was a more equitable way of funding growth in the system than asking taxpayers to pay the whole cost.
In August 1988 the Government announced it had accepted most of the Wran Committee's recommendations and introduced the Higher Education Contributions Scheme (HECS) from 1 January 1989. The Government initially set a single contribution rate of $1800, with a 15 per cent discount if the student contribution was paid up-front.
Outcome of reforms The reforms that flowed from the white paper process saw the reorganisation of higher education in Australia. The ‘binary system’ of universities and CAEs was abolished. The number of institutions providing higher education dropped from 73 in 1987 (not counting TAFEs) with an average size of 5,300 students, to 38 in 1991 with an average of 14,000 students. Block grants for teaching and learning, which had previously varied by institution, were gradually made consistent by discipline according to a new relative funding model. The number of students the Commonwealth would support was determined by the Government.
10 The Hon John Dawkins MP, Higher Education: a policy statement, AGPS, Canberra, 1988, p3
Higher Education in Australia
13
In the period immediately following the introduction of HECS, the number of commencing and total domestic students increased more rapidly with nearly 10 per cent growth in total enrolments in each of the first two years. Growth continued at a more modest rate between 4 per cent and 1.2 per cent through to 1998.
The introduction in the 1987-88 Budget of capacity for institutions to charge fees for postgraduate courses provided incentives for the provision of a wider variety of employment-related courses. Following the white paper, the initial focus was on getting additional school leavers into higher education. Increased places were allocated to higher degrees in the 1991-1993 triennium in response to concern about the unmet demand for higher level skills – including academic staff11.
Total government funding increased from $3.2 billion in 1989 to $5.5 billion a decade later and HECS became an important contributor to the mix of public funding, rising from 16.3 per cent of total higher education funding in its first year to 43.0 per cent in 2014.
The capacity to offer additional full-fee places to international students was introduced in 1986. Despite these new higher cost places, international students increased by 129 per cent from 1987 to 1992. Subsidised places for international students were abolished from 1990.
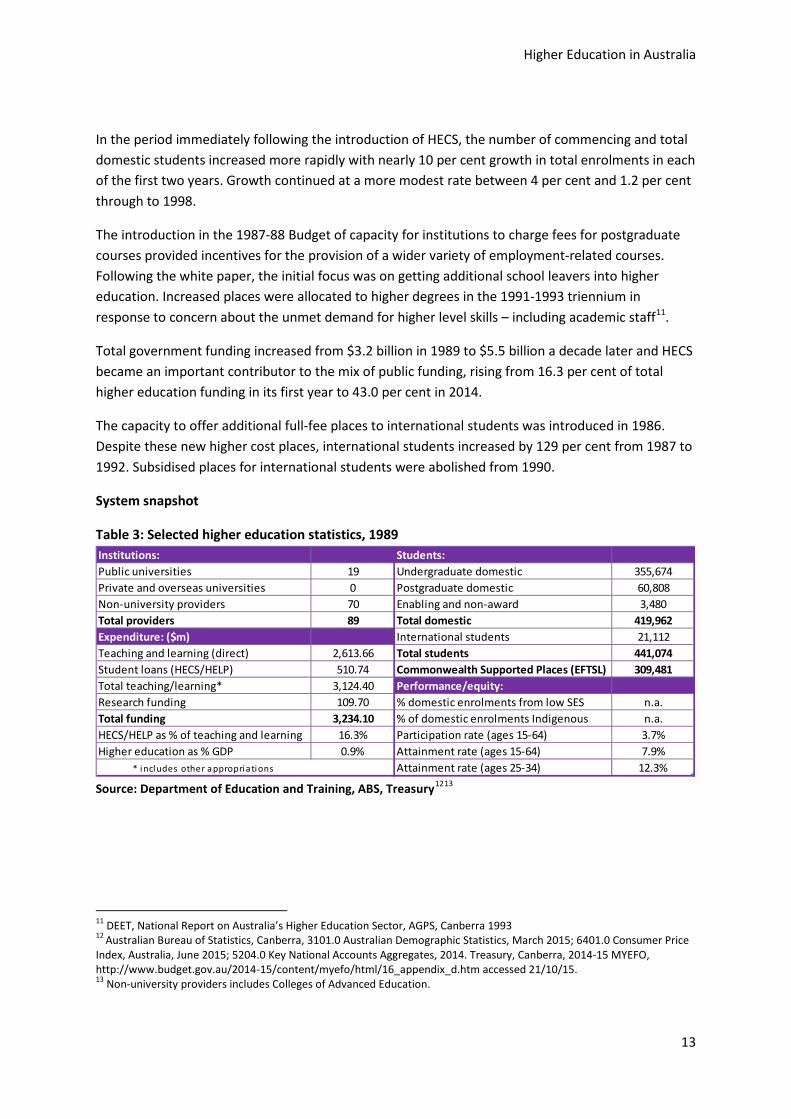
System snapshot
Table 3: Selected higher education statistics, 1989
Source: Department of Education and Training, ABS, Treasury1213
11 DEET, National Report on Australia’s Higher Education Sector, AGPS, Canberra 1993 12 Australian Bureau of Statistics, Canberra, 3101.0 Australian Demographic Statistics, March 2015; 6401.0 Consumer Price Index, Australia, June 2015; 5204.0 Key National Accounts Aggregates, 2014. Treasury, Canberra, 2014-15 MYEFO, http://www.budget.gov.au/2014-15/content/myefo/html/16_appendix_d.htm accessed 21/10/15. 13 Non-university providers includes Colleges of Advanced Education.
Institutions: Students: Public universities 19 Undergraduate domestic 355,674Private and overseas universities 0 Postgraduate domestic 60,808Non-university providers 70 Enabling and non-award 3,480Total providers 89 Total domestic 419,962Expenditure: ($m) International students 21,112Teaching and learning (direct) 2,613.66 Total students 441,074Student loans (HECS/HELP) 510.74 Commonwealth Supported Places (EFTSL) 309,481Total teaching/learning* 3,124.40 Performance/equity:Research funding 109.70 % domestic enrolments from low SES n.a.Total funding 3,234.10 % of domestic enrolments Indigenous n.a.HECS/HELP as % of teaching and learning 16.3% Participation rate (ages 15-64) 3.7%Higher education as % GDP 0.9% Attainment rate (ages 15-64) 7.9%
* includes other appropriations Attainment rate (ages 25-34) 12.3%
Higher Education in Australia
14
1998 Learning for Life: review of higher education financing and policy (West Review)
Purpose and process The first major review of the higher education sector since the Dawkins white paper, the West Review examined the processes shaping higher education. The review aimed to identify options for the financing of higher education teaching and research, and for providing Commonwealth funding to higher education institutions that would enable the sector to meet Australia’s economic and social needs over the following two decades.
The Howard Government established the review in January 1997, with a panel led by Roderick West AM. The panel consulted widely both nationally and internationally, held a series of roundtables and considered nearly 600 submissions. Its report, Learning for Life, was released in April 1998.
Issues considered and findings The panel concluded that the sector would face a range of pressures over the next two decades, including technological innovation, heightened community expectations, increased demand from both domestic and international students, and increased competition including the entry of new providers. It considered that the policy and funding framework at the time was inadequate to enable the sector to respond to these pressures. In particular, the panel identified:
• Inconsistencies in approach: the number of subsidised students, course mix, and funding rates per student relied on centrally-determined government targets. As a result, institutions could not effectively respond to student needs and demographic movements. There was an inconsistent approach to eligibility, with separate arrangements for postgraduate fee paying, domestic undergraduate fee paying and overseas fee paying students. Artificial boundaries existed between higher and vocational education that discouraged a strategic view of tertiary education as a whole.
• Inappropriate incentives: the funding framework meant institutions had more incentive to invest in research than quality teaching. With centrally-determined targets, there was little incentive for universities to be innovative in teaching and administration. Institutions had strong incentives to solve funding issues by approaching governments rather than by improving use of their assets, new delivery mechanisms or attracting new students.
• Management deficiencies: institutions suffered from outdated governance arrangements with insufficient experience and skills in the management of large organisations. Institutions had poor understanding of their own cost structures.
• Equity issues: despite improvements in the participation of equity groups, people from Indigenous, low SES and rural and regional backgrounds remained under-represented.
• Barriers to competition: entry into the market for higher education remained heavily restricted, with access to government grants and income-contingent loans limited to public university students. This was a major disincentive for students wishing to study at private institutions, as they had to pay the full cost either up-front or through commercial loans. Private institutions also had limited access to self-accreditation, which gave existing universities a competitive edge.
Higher Education in Australia
15
• Limited funding sources: there was a pressing need for Australian universities to invest in new technologies and other infrastructure in order to be competitive with overseas institutions. But compared to universities in the United States, Australian universities had small endowments and limited access to private equity investment and capital markets. Legislative requirements hindered opportunities for universities to raise the funds they needed.
Recommendations and response The panel made 38 recommendations. The most notable was a gradual move towards a ’student-centred‘ approach, with a lifetime tertiary learning entitlement, a demand driven funding system, access to government grants and income-contingent loans for students at both public and private providers, and the deregulation of public university fees. Other recommendations included:
• transfer of funding for vocational education from the states to the Commonwealth • the establishment of the Australian Research Council as an independent body with increased
accountability and transparency • promotion of an enhanced teaching culture in higher education institutions to balance the
established research culture • maintenance of the average level of public funding per undergraduate EFTSL for the medium
term, with regular reviews to take account of movements in costs • provision of grants for teaching and learning as a flat amount within three broad course
categories • a requirement for institutions to publish information about their performance in order to
assist prospective students in choosing where to study • establishment of an independent complaints procedure, possibly in the form of a Higher
Education Ombudsman, to support students • ability for private higher education institutions to become self-accrediting bodies with the
same powers in this respect as public universities • freeing up the university asset base to promote the more flexible use of resources • establishment of a loan fund to finance major programs of innovation and structural change,
including technological investments associated with such changes • maintenance and growth of public funding for higher education infrastructure.
Although there was consideration of the recommendations, the Government did not make a formal response to the West Review. The funding framework for teaching and learning remained largely unchanged over the next few years, but the Government established a new national quality agency (AUQA, 2000) and responded to a number of West’s recommendations in research policy. Reforms to the ARC and research training were adopted in the policy statement Knowledge and Innovation (1999) and legislated in 2001. The Government responded to the call for increased infrastructure funding in the innovation plan Backing Australia’s Ability (2001), which provided an additional $583 million over five years for university infrastructure. Backing Australia’s Ability also funded additional places for STEM students and introduced the Postgraduate Education Loans Scheme for postgraduate full-fee coursework students.

Higher Education in Australia
16
Outcome of reforms As the Government did not adopt the West Review’s central recommendations on teaching and learning, the review led to few changes to funding policy for coursework students. Its major legacy was to raise fundamental issues of access, competition, funding adequacy and sustainability that were taken up in later reviews. Some of its ideas, notably funding driven by student demand, were to reappear in modified form and be realised over the next two decades.
System snapshot
Table 4: Selected higher education statistics, 1998
Source: Department of Education and Training, ABS, Treasury
2002 Review of Higher Education in Australia (Nelson Review)
Purpose and process This review, announced by the Howard government in April 2002, incorporated a range of different reports and discussion papers. The review commenced with a discussion paper, Higher Education at the Crossroads, followed by six issues papers and a Productivity Commission report, University Resourcing: Australia in an International Context. The review held 48 forums in all capital cities and some regional centres and received over 700 written submissions.
Issues considered and findings Higher Education at the Crossroads and the Issues Paper Setting Firm Foundations, which focussed on financing higher education, identified pressures on the sector including that:
• course provision costs had increased substantially, due to local and international pressures • students from disadvantaged backgrounds, including Indigenous students and students from
low socioeconomic backgrounds, remained underrepresented in higher education • levels of attrition were around 30 per cent • institutions were over-enrolling students, beyond agreed targets, affecting quality • universities had inappropriate governance arrangements with an identified lack of financial
and corporate expertise
Institutions: Students: Public universities 36 Undergraduate domestic 473,770Private and overseas universities 2 Postgraduate domestic 117,435Non-university providers 47 Enabling and non-award 8,465Total providers 85 Total domestic 599,670Expenditure: ($m) International students 72,183Teaching and learning (direct) 3,690.72 Total students 671,853Student loans (HECS/HELP) 1,373.49 Commonwealth Supported Places (EFTSL) 412,395Total teaching/learning* 5,064.21 Performance/equity:Research funding 447.43 % domestic enrolments from low SES n.a.Total funding 5,511.64 % of domestic enrolments Indigenous n.a.HECS/HELP as % of teaching and learning 27.1% Participation rate (ages 15-64) 4.8%Higher education as % GDP 0.9% Attainment rate (ages 15-64) 14.3%
* includes other appropriations Attainment rate (ages 25-34) 19.3%

Higher Education in Australia
17
• funding arrangements were based on historical student places and problems in the existing funding model, which could not respond effectively to changes in demand.
Setting Firm Foundations outlined options for reform of the funding system, including:
• a discipline-based model, under which the Government would set a maximum number of places, and distribute these places to universities by agreement
• fee deregulation, where the government would set the maximum number of places and base rates for student contributions. Universities would set their own fees. Those that didn’t increase fees above the base would receive additional government funding
• flat rate learning entitlements, in conjunction with fee deregulation, to be used at the students institution of their choice
• variable rate learning entitlements, where the entitlement would depend on the course for which it was used.
This paper also considered the appropriate balance between public and private funding of higher education and the return on investment for the government and students. It concluded this question did not have an optimum answer; that the balance should be determined by government based on the benefits that flow from public investment and competing demands on the public purse.
The Productivity Commission report compared Australian universities to those in selected other countries. It found that:
• graduation rates of Australian universities were in the middle of OECD countries, with PhD graduations higher than many and similar to the USA and the UK
• the student to teacher ratio was higher in Australia than other countries in the study • Australian academic salaries were comparable to many on a purchasing power basis • total expenditure on tertiary education in Australia was around 1.5 per cent of GDP, which
was lower than the USA, New Zealand, Sweden and Canada, but higher than the UK • there were large differences in resourcing for universities included in the study, especially
where large private institutions attract philanthropic and investment income • some other countries had moved away from block funding research to competitive and
performance-based funding. Some had tried to separate teaching and research funding • demand for student places was regulated in all except New Zealand and some US states • Australian universities received more of their funding from students’ private contributions
than those in most comparable countries (though less than in the USA, Japan and Korea).
Recommendations and government response The Government’s response, Our Universities: Backing Australia’s Future (2003) outlined the reforms announced in the 2003-04 Budget in response to the review under four priorities – sustainability; quality; equity; and diversity:
• per-student funding under the new CGS to replace block grants for teaching and learning
Higher Education in Australia
18
• increased Commonwealth contributions per student place by 2.5 per cent from 2005, building to a 7.5 per cent increase by 2007, conditional on adherence to new governance protocols and compliance with the Commonwealth workplace relations policies
• 30 per cent increase in maximum student contributions except for those studying national priority fields (nursing and teaching)
• universities were permitted to set their own student contributions up to the maximum set by the Commonwealth, ostensibly promoting competition in fees
• a regional loading component to the CGS • increase in the proportion of full fee-paying students allowable in institutions, from a
maximum of 25 per cent of places in each course to 50 per cent • access to income contingent loans for full fee-paying students (FEE-HELP) and those studying
abroad (OS-HELP) • new scholarship programmes for disadvantaged students • establishment of a National Institute for Learning and Teaching in Higher Education • a new Learning and Teaching Performance Fund • increased equity funding including new Indigenous Staff Scholarships and establishment of
the Indigenous Higher Education Advisory Council • additional funding for the Higher Education Equity Programme.
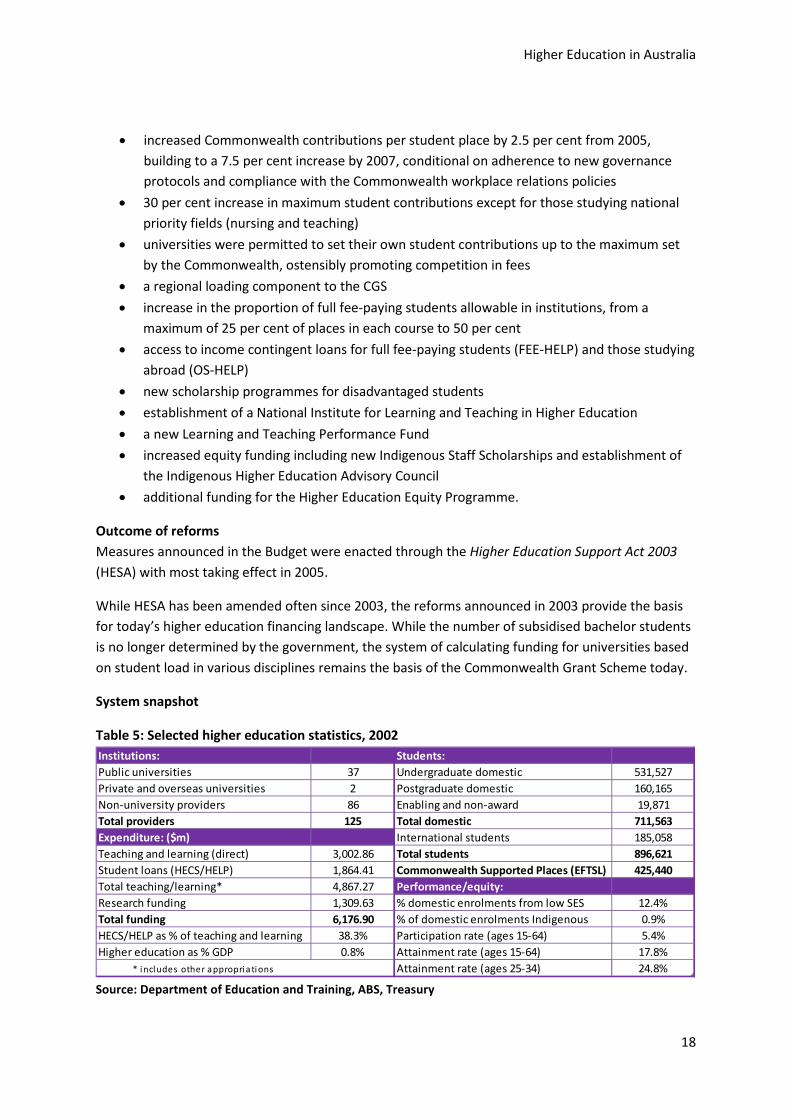
Outcome of reforms Measures announced in the Budget were enacted through the Higher Education Support Act 2003 (HESA) with most taking effect in 2005.
While HESA has been amended often since 2003, the reforms announced in 2003 provide the basis for today’s higher education financing landscape. While the number of subsidised bachelor students is no longer determined by the government, the system of calculating funding for universities based on student load in various disciplines remains the basis of the Commonwealth Grant Scheme today.
System snapshot
Table 5: Selected higher education statistics, 2002
Source: Department of Education and Training, ABS, Treasury
Institutions: Students: Public universities 37 Undergraduate domestic 531,527Private and overseas universities 2 Postgraduate domestic 160,165Non-university providers 86 Enabling and non-award 19,871Total providers 125 Total domestic 711,563Expenditure: ($m) International students 185,058Teaching and learning (direct) 3,002.86 Total students 896,621Student loans (HECS/HELP) 1,864.41 Commonwealth Supported Places (EFTSL) 425,440Total teaching/learning* 4,867.27 Performance/equity:Research funding 1,309.63 % domestic enrolments from low SES 12.4%Total funding 6,176.90 % of domestic enrolments Indigenous 0.9%HECS/HELP as % of teaching and learning 38.3% Participation rate (ages 15-64) 5.4%Higher education as % GDP 0.8% Attainment rate (ages 15-64) 17.8%
* includes other appropriations Attainment rate (ages 25-34) 24.8%

Higher Education in Australia
19
2008 Review of Australian Higher Education (Bradley Review)
Purpose and process This review examined the state of the Australian higher education system against international best practice. It explored the future direction of the sector, its capacity to meet the needs of the Australian community and economy, and the options available for ongoing reform. The Government established an expert panel led by Professor Denise Bradley AC in March 2008, and the panel reported in December that year. In undertaking the review the panel consulted with higher education providers, representative bodies within the sector, state and territory governments, business, industry and the broader public. The panel received more than 450 formal responses and submissions. It also commissioned a variety of reports from the public and private sectors on funding, research, demographic, engagement and international issues.
Issues considered and findings The review considered whether Australia’s higher education system was capable of:
• appropriately contributing to the innovation and productivity gains required for long term economic development and growth
• ensuring that there is a broad-based tertiary education system producing professionals for both national and local labour market needs.
The government asked the panel to advise on how reform of the sector and changes to regulation and funding arrangements could achieve objectives including:
• a diverse, globally focused and competitive higher education sector delivering opportunities to students throughout Australia
• an enhanced contribution by the higher education sector to national productivity, increased participation in the labour market and response to the needs of industry
• improved funding arrangements for higher education teaching, taking into account public and private benefits and contributions
• wider access to higher education with participation by students from all backgrounds • upholding of quality standards by both public and private providers.
The panel concluded that while the Australian higher education system had great strengths, it faced emerging threats which required decisive action. With government investment declining in real terms due to low indexation levels, the increased use of competitive funding and a complex and inconsistent web of eligibility criteria, public institutions were increasingly reliant on non-government funding sources to maintain their activities. These sources were inadequate to maintain a quality system and the consequences were evident in high student-staff ratios, declining student satisfaction rates, low operating margins, cross-subsidisation of research by teaching funds and static or falling participation rates among Indigenous, low SES and regional Australians.
While the panel welcomed the growth in international students, it was concerned at the institutional reliance on international fee income as the stream was vulnerable to geopolitical developments.

Higher Education in Australia
20
Since domestic student contributions had been recently increased, the panel did not think it appropriate to recommend a further increase in private contributions. Instead, taking into account the above issues and noting Australia’s low ranking on OECD comparisons of public investment in higher education, the panel concluded that a 10 per cent increase in government base funding was appropriate. The panel also made a number of recommendations aimed at stabilising institutional finances and promoting quality and equity.
Recommendations and government response The report made 46 recommendations, including:
• introduction of student demand-driven funding, initially for undergraduate courses at public universities but expanding to postgraduate coursework courses and other providers contingent upon a national tertiary regulator being in place
• a 10 per cent increase in base funding for teaching and learning, accompanied by a new indexation system and revised subject clusters to better reflect the relative delivery costs;
• retention of maximum caps on student contributions • the continued ability for public institutions to offer full-fee courses for domestic
undergraduate students • increased access and participation funding and performance-based funding against agreed
targets • student incentives to enrol in nursing and teaching courses • a tertiary entitlement funding model across both higher and vocational education, including
income-contingent loans for VET diplomas • an increase in the loan fee on FEE-HELP from 20 to 25 per cent • increases in government funding for research infrastructure, research student places and
international research students • increased funding for regional higher education and a feasibility study into the establishment
of a national regional university • establishment of a national regulatory body responsible for all tertiary education and
training • a revised Australian Qualifications Framework (AQF) • an accountability framework between the government and providers.
The Rudd Government released its response, Transforming Australia’s Higher Education System, in May 2009. The government accepted most of the recommendations in part or in their entirety, including the introduction of participation and equity targets, accountability through compact arrangements, increased research infrastructure funding, a review into base funding (2011), the establishment of a national regulator (TEQSA, 2011), a new grant indexation system (HEGI, 2012) and the provision of demand driven funding for bachelor courses at public institutions (2012). The government did not accept the recommendation to retain full-fee paying domestic places at public universities.
Higher Education in Australia
21
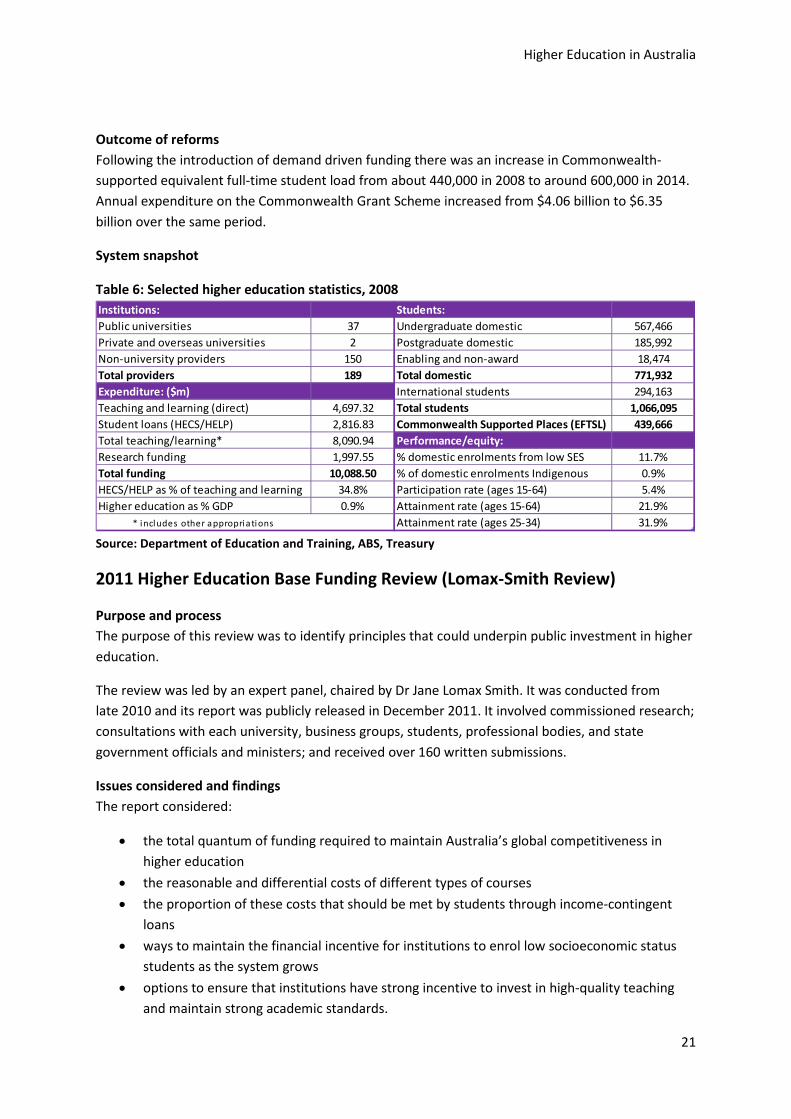
Outcome of reforms Following the introduction of demand driven funding there was an increase in Commonwealth-supported equivalent full-time student load from about 440,000 in 2008 to around 600,000 in 2014. Annual expenditure on the Commonwealth Grant Scheme increased from $4.06 billion to $6.35 billion over the same period.
System snapshot
Table 6: Selected higher education statistics, 2008
Source: Department of Education and Training, ABS, Treasury
2011 Higher Education Base Funding Review (Lomax-Smith Review)
Purpose and process The purpose of this review was to identify principles that could underpin public investment in higher education.
The review was led by an expert panel, chaired by Dr Jane Lomax Smith. It was conducted from late 2010 and its report was publicly released in December 2011. It involved commissioned research; consultations with each university, business groups, students, professional bodies, and state government officials and ministers; and received over 160 written submissions.
Issues considered and findings The report considered:
• the total quantum of funding required to maintain Australia’s global competitiveness in higher education
• the reasonable and differential costs of different types of courses • the proportion of these costs that should be met by students through income-contingent
loans • ways to maintain the financial incentive for institutions to enrol low socioeconomic status
students as the system grows • options to ensure that institutions have strong incentive to invest in high-quality teaching
and maintain strong academic standards.
Institutions: Students: Public universities 37 Undergraduate domestic 567,466Private and overseas universities 2 Postgraduate domestic 185,992Non-university providers 150 Enabling and non-award 18,474Total providers 189 Total domestic 771,932Expenditure: ($m) International students 294,163Teaching and learning (direct) 4,697.32 Total students 1,066,095Student loans (HECS/HELP) 2,816.83 Commonwealth Supported Places (EFTSL) 439,666Total teaching/learning* 8,090.94 Performance/equity:Research funding 1,997.55 % domestic enrolments from low SES 11.7%Total funding 10,088.50 % of domestic enrolments Indigenous 0.9%HECS/HELP as % of teaching and learning 34.8% Participation rate (ages 15-64) 5.4%Higher education as % GDP 0.9% Attainment rate (ages 15-64) 21.9%
* includes other appropriations Attainment rate (ages 25-34) 31.9%

Higher Education in Australia
22
The expert panel considered that base funding – that is, Commonwealth Grants Scheme funding plus student contributions, should adequately fund the direct and indirect costs of teaching, scholarship and base capability in research. The panel estimated that on average universities used six per cent of their base funding from undergraduate places to support base capability in research.
Research commissioned for the review found that base funding was on average adequate to meet the costs of teaching and scholarship, but not necessarily for each field of education or institution.
In relation to funding sustainability, it found that several of the ‘clusters’ of fields of education in the funding framework were underfunded. It acknowledged cost pressures on the sector including staff costs, the cost of work-integrated learning, and the cost of emerging and future infrastructure, which the panel considered to be one of the major pressures on universities.
The review considered various models of financing student contributions, including student taxes and increased tax rates. In relation to HELP student loans, it found that HELP loan schemes were highly effective, and should remain in place.
Recommendations and government response Changes recommended in the report included:
• The average level of base funding per place be increased to improve the quality of higher education teaching and maximise the sector’s potential to contribute to national productivity and economic growth.
• Identified areas of underfunding to be addressed in the disciplines of accounting, administration, economics, commerce, medicine, veterinary science, agriculture, dentistry, and visual and performing arts.
• The number of funding clusters be reduced to reflect the convergence of costs of delivery. • Commonwealth supported places in postgraduate courses be funded at the same rate as for
undergraduate courses, in line with current practice at the time. • Base funding for non-university provision of higher education courses be adjusted down by
up to 10 per cent in recognition that these providers are not required to undertake research. • An additional amount of approximately 2 per cent of base funding per annum be distributed
on the basis of student load to support appropriately resourced facilities and to reflect the higher standard required of contemporary teaching and learning spaces.
• The balance of student and government contributions should be set at a fixed proportion with students contributing 40 per cent and the Government contributing 60 per cent of the funding for each Commonwealth supported place.
• The participation component of the Higher Education Participation and Partnerships Program (HEPPP) should be uncapped and paid on a demand driven basis to universities as a low socioeconomic status (SES) loading on base funding.
• Maximum student contribution amounts should remain capped.
In January 2013 the Gillard Government accepted the intent of the principles outlined in the report, but considered no significant change to the current arrangements were required. The department

Higher Education in Australia
23
also conducted a consultation on the allocation and funding of postgraduate places in 2011, but no action arose out of this consultation.
Changes introduced by the Government that aligned with recommendations of the report included:
• an increase in Higher Education Participation and Partnerships Programme funding • an increase in the enabling loading to a rate equivalent to 2010 rate.
System snapshot
Table 7: Selected higher education statistics, 2011
Source: Department of Education and Training, ABS, Treasury
2014 Report of the National Commission of Audit
Purpose and process Following the change of government at the 2013 federal election, the National Commission of Audit was established to review the performance, functions and roles of the Commonwealth and make recommendations to achieve efficiencies, productivity improvements and savings across all areas of Commonwealth expenditure.
The Commission, chaired by Tony Shepherd AO, conducted its work from late 2013 to early 2014. It consulted the community through a public submissions process. Twenty submissions were received from universities, non-university higher education providers and related peak bodies.
Issues considered and findings The Commission considered whether there were areas of unnecessary duplication across governments, areas where Commonwealth involvement is inappropriate or no longer needed, and opportunities to improve overall efficiency and effectiveness.
The Commission found that Commonwealth investment in higher education contributes to a more agile and productive workforce, resulting in higher tax revenues, reduced unemployment costs and improved international competitiveness. However, a large proportion of the benefits of higher education accrue directly to individual students through improved employment prospects and higher lifetime incomes. It estimated the Commonwealth pays 59 per cent of domestic bachelor
Institutions: Students: Public universities 36 Undergraduate domestic 648,483Private and overseas universities 5 Postgraduate domestic 215,142Non-university providers 133 Enabling and non-award 24,806Total providers 174 Total domestic 888,431Expenditure: ($m) International students 332,577Teaching and learning (direct) 5,691.47 Total students 1,221,008Student loans (HECS/HELP) 3,802.66 Commonwealth Supported Places (EFTSL) 517,776Total teaching/learning* 9,831.01 Performance/equity:Research funding 2,694.61 % domestic enrolments from low SES 12.1%Total funding 12,525.62 % of domestic enrolments Indigenous 1.0%HECS/HELP as % of teaching and learning 38.7% Participation rate (ages 15-64) 5.9%Higher education as % GDP 0.9% Attainment rate (ages 15-64) 23.7%
* includes other appropriations Attainment rate (ages 25-34) 35.0%
Higher Education in Australia
24
degree tuition costs while students contribute 41 per cent. It considered rebalancing the public and private contributions to higher education costs was warranted given the substantial private benefit.
The Commission judged that enhanced competition from allowing universities to determine their own prices should improve efficiency and drive innovation and quality improvements for students. However, questions around whether market forces in Australia are sufficient to yield distinct price differentiation between courses and universities were noted. Given current university behaviour, the lack of price sensitivity among domestic undergraduate students, and examples of international experience, the Commission noted there was a risk deregulation could lead to significant fee increases. This would result in the Government being worse off through increased HELP student loan liabilities and would potentially impact equity of access. It could also risk student outcomes if universities shift entry standards away from a focus on ability toward a focus on price.
The Commission believed the design of HELP passes on additional and unnecessary costs to the Commonwealth. As the interest rate on outstanding HELP loans is below the Commonwealth government borrowing rate, an additional subsidy is provided to students. Bad and doubtful debts make up around 17 per cent of HELP loans each year – as a result of people not earning enough to hit the repayment threshold, moving overseas, or dying before repaying the loan. The proportion written off in bad and doubtful debts may increase over time, given the growing number of students accessing HELP and the increasing average debt per student.
The Commission advised against the idea of selling off student HELP debt to the private sector as a means of easing budget pressures. Given the risk profile of HELP debt as an investment, it would need to be sold for less than it was worth, leaving the Government’s financial position worse off. Additionally, this would reduce the flexibility of future governments to undertake further reforms of the student loan arrangements.
The Commission also found that the uncapping of bachelor places in 2012, whilst improving access for those who might otherwise not have pursued higher education, may have led to a decrease in entry standards. Uncapping places with open-ended HELP may provide a commercial motivator for universities to lower standards in order to enable an increase in student numbers.
Recommendations The Commission made the following recommendations to better reflect the private benefits of higher education and improve performance of the sector:
• decrease the proportion of higher education costs paid by the Commonwealth through the Commonwealth Grants Scheme from 59 per cent to 45 per cent and increase the average proportion of costs paid by students from 41 per cent to 55 per cent
• develop options for partial or full deregulation of fees for bachelor degrees, taking into account any relevant recommendations of the Review of the Demand Driven Funding System
• change existing HELP arrangements to increase repayment rates by lowering the income threshold at which student loans are repaid and ensuring interest rates reflect the Commonwealth’s full costs in making these loans, including the cost of bad and doubtful debts.
Higher Education in Australia
25
Without making formal recommendations on research funding, the Commission suggested public investment in research should be strategically directed to more narrowly defined national priority areas, cooperative research centres should be abolished and funding rolled into the Australian Research Council, minor research funding programmes and sector-specific grants should be abolished or consolidated as and that there would be benefits from providing greater certainty of the Government’s longer-term commitment to funding critical research infrastructure.
Outcome of suggestions National priorities for research were released by the Prime Minister, the Minister for Education and Training, and the Minister for Industry and Science in May 2015. Cooperative Research Centres (CRCs) have been reviewed and in October 2015 the Minister for Innovation and Science announced a new CRC Advisory Committee would be appointed to implement the recommendations. The 2014-15 and 2015-16 Budget included measures consolidating research programmes. The 2015-16 Budget included two additional years of funding for the National Cooperative Research Infrastructure Strategy and commissioning of a review of that programme. Reviews of research funding policy and research training have also been commissioned.
2014 Review of the Demand Driven Funding System (Kemp-Norton Review)
Purpose and process The purpose of this review was to examine the impact of the demand driven funding system on higher education provision in Australia and to make recommendations on funding arrangements.
The review was conducted by the Hon Dr David Kemp and Mr Andrew Norton from late 2013 to early 2014. It involved consultation through a public submissions process and meetings with key stakeholders including universities, non-university higher education providers, TAFEs, peak bodies and student organisations.
Issues considered and findings The review considered the effectiveness of implementation of the demand driven funding system and its outcomes to date. It found the demand driven system was generally performing well and was meeting the demand for skills in the economy. It concluded that not all student demand was being met, given capacity constraints in some courses; nor should it where a student is unsuited to a course. It noted the number of commencing undergraduates had increased steadily from 2009 as caps on student places were eased, and then largely removed in 2012.
The review concluded that Commonwealth Supported Place (CSP) funding and student contribution rates were adequate to meet delivery costs in most disciplines, though noted some concerns regarding engineering and health subjects – particularly those requiring clinical training. Noting the increase in Commonwealth Grant Scheme outlays from $4.1 billion in 2009 to $6.1 billion in 2013 and a projected further increase to $7.2 billion in 2016-17, the review acknowledged the Budget impact of uncapping CSPs.
Higher Education in Australia
26
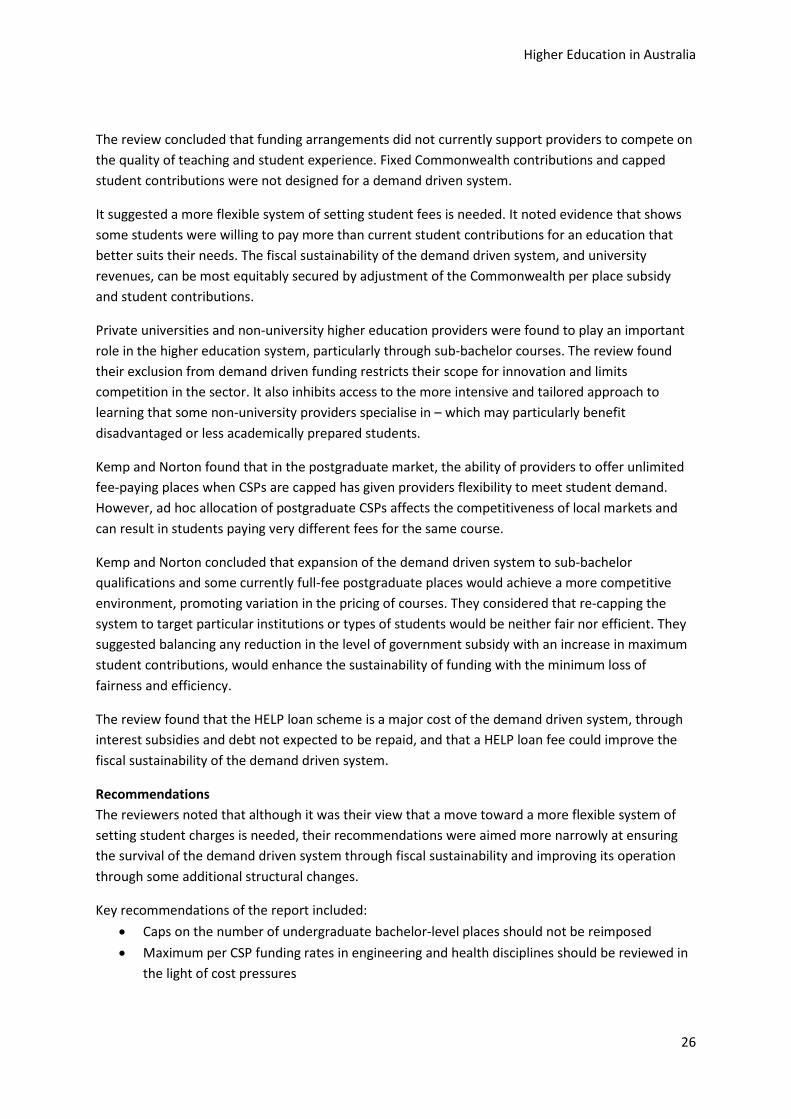
The review concluded that funding arrangements did not currently support providers to compete on the quality of teaching and student experience. Fixed Commonwealth contributions and capped student contributions were not designed for a demand driven system.
It suggested a more flexible system of setting student fees is needed. It noted evidence that shows some students were willing to pay more than current student contributions for an education that better suits their needs. The fiscal sustainability of the demand driven system, and university revenues, can be most equitably secured by adjustment of the Commonwealth per place subsidy and student contributions.
Private universities and non-university higher education providers were found to play an important role in the higher education system, particularly through sub-bachelor courses. The review found their exclusion from demand driven funding restricts their scope for innovation and limits competition in the sector. It also inhibits access to the more intensive and tailored approach to learning that some non-university providers specialise in – which may particularly benefit disadvantaged or less academically prepared students.
Kemp and Norton found that in the postgraduate market, the ability of providers to offer unlimited fee-paying places when CSPs are capped has given providers flexibility to meet student demand. However, ad hoc allocation of postgraduate CSPs affects the competitiveness of local markets and can result in students paying very different fees for the same course.
Kemp and Norton concluded that expansion of the demand driven system to sub-bachelor qualifications and some currently full-fee postgraduate places would achieve a more competitive environment, promoting variation in the pricing of courses. They considered that re-capping the system to target particular institutions or types of students would be neither fair nor efficient. They suggested balancing any reduction in the level of government subsidy with an increase in maximum student contributions, would enhance the sustainability of funding with the minimum loss of fairness and efficiency.
The review found that the HELP loan scheme is a major cost of the demand driven system, through interest subsidies and debt not expected to be repaid, and that a HELP loan fee could improve the fiscal sustainability of the demand driven system.
Recommendations The reviewers noted that although it was their view that a move toward a more flexible system of setting student charges is needed, their recommendations were aimed more narrowly at ensuring the survival of the demand driven system through fiscal sustainability and improving its operation through some additional structural changes.
Key recommendations of the report included: • Caps on the number of undergraduate bachelor-level places should not be reimposed • Maximum per CSP funding rates in engineering and health disciplines should be reviewed in
the light of cost pressures
Higher Education in Australia
27
• All higher education providers should be eligible for CSPs when they and relevant courses have been approved by the Tertiary Education Quality Standards Agency
• Non-university providers accepting CSPs should do so with the same constraints as public universities – e.g. unable to offer full-fee courses to domestic undergraduates
• Sub-bachelor higher education courses should be included in the demand driven system • Caps on CSPs should be removed from postgraduate courses that have clear community
benefit but offer modest financial rewards for graduates. Other postgraduate courses should be offered on an entirely full-fee basis.
System snapshot
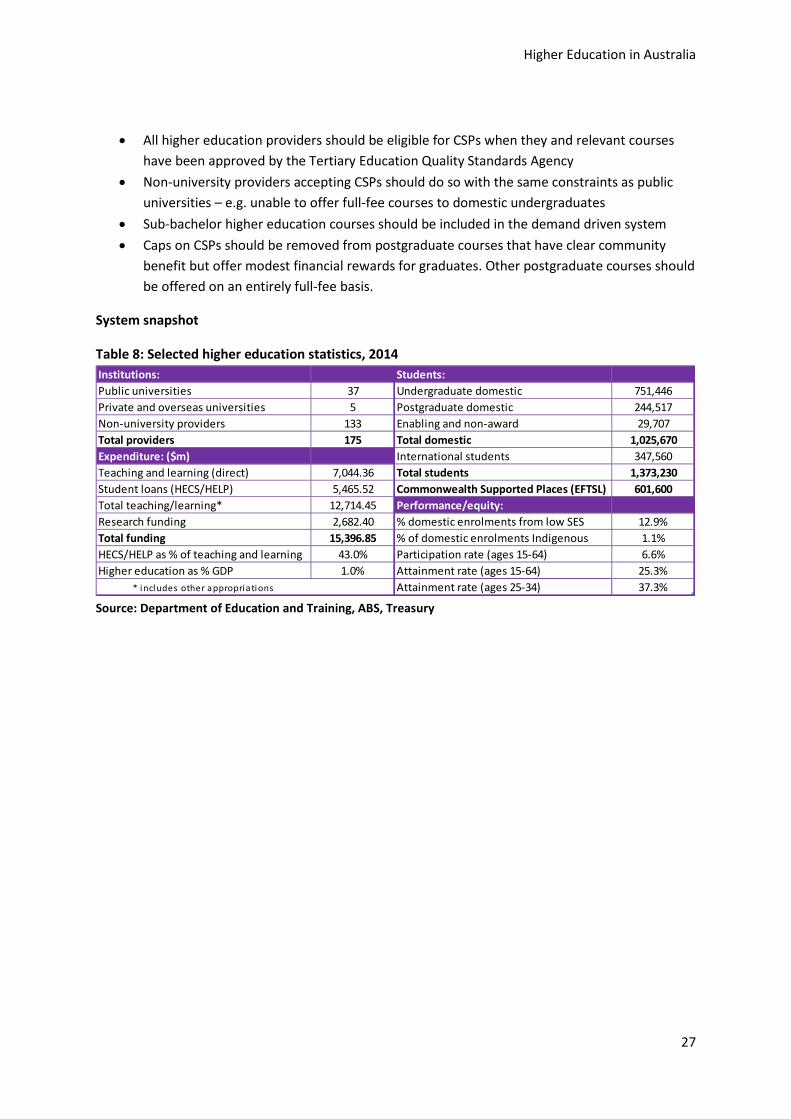
Table 8: Selected higher education statistics, 2014
Source: Department of Education and Training, ABS, Treasury
Institutions: Students: Public universities 37 Undergraduate domestic 751,446Private and overseas universities 5 Postgraduate domestic 244,517Non-university providers 133 Enabling and non-award 29,707Total providers 175 Total domestic 1,025,670Expenditure: ($m) International students 347,560Teaching and learning (direct) 7,044.36 Total students 1,373,230Student loans (HECS/HELP) 5,465.52 Commonwealth Supported Places (EFTSL) 601,600Total teaching/learning* 12,714.45 Performance/equity:Research funding 2,682.40 % domestic enrolments from low SES 12.9%Total funding 15,396.85 % of domestic enrolments Indigenous 1.1%HECS/HELP as % of teaching and learning 43.0% Participation rate (ages 15-64) 6.6%Higher education as % GDP 1.0% Attainment rate (ages 15-64) 25.3%
* includes other appropriations Attainment rate (ages 25-34) 37.3%

Higher Education in Australia
28
3. Timeline of change and reform in Australia’s higher education system One thing that stands out from the survey of major funding policy reviews from the 1988 Dawkins white paper through to the 2014 Kemp-Norton Review is the similarity of the issues that were of concern to governments of the day:
• the need for additional high level skills in the economy to fuel productivity and innovation and deal with technological change
• how to expand access to quality higher education to ever greater numbers of students from ever more diverse social, economic and academic backgrounds
• managing an increasingly large higher education system with a diversity of institutional missions and characteristics
• finding the resources necessary to fund the higher education teaching, learning and research in generally constrained budgetary circumstances
• determining the appropriate balance between public and private contributions to higher education funding.
Over the period covered by the reviews canvassed in this paper, Australia’s higher education system has grown in terms of both students and funding. Total domestic students have more than doubled from 420,000 in 1989 to just over 1 million in 2014. Commonwealth supported students students also nearly doubled from 402,400 (309,500 EFTSL) in 1989 to 793,300 (601,600 EFTSL) in 2014.
International students have risen from just over 21,000 in 1989 to nearly 350,000 in 2014.
Figure 5: Enrolled students 1989-2014
Source: Department of Education and Training
The level of participation in higher education by domestic students has risen from 3.7 per cent of the population aged 15 to 64 in 1989 to 6.6 per cent in 2014. The rate of bachelor or higher degree
0
200,000
400,000
600,000
800,000
1,000,000
1,200,000
1,400,000
1,600,000
1989
1990
1991
1992
1993
1994
1995
1996
1997
1998
1999
2000
2001
2002
2003
2004
2005
2006
2007
2008
2009
2010
2011
2012
2013
2014
Commonwealth supported Other domestic International

Higher Education in Australia
29
attainment has increased from 7.9 per cent to 25.3 per cent of people aged 15 to 64 and from 12.3 per cent to 37.3 per cent for those aged 25 to 34.
Figure 6: Domestic higher education participation and bachelor or higher attainment 1989-2014
Source: Department of Education and Training, ABS14
Australian Government funding for teaching and learning and research has grown both in absolute and real terms over the period. Prior to 2001, operating grants to higher education institutions included funding for the direct costs of research activity. Total funding to institutions, including research grants was $3.2 billion in 1989 and $15.4 billion in 2014. In 2014 dollars, that represents an increase in real terms of 238 per cent from $6.5 billion in 1989.
Figure 7: Teaching and learning grants, HELP loans and university research funding 1989-201415
Source: Department of Education and Training16, ABS17
14 Australian Bureau of Statistics, 3101.0 Australian Demographic Statistics, Canberra, March 2015 15 Does not include student income support paid to higher education students. Care should be taken when comparing across years. For example, 1989 to 2001 Operating Grants contained a component for Research. 16 Prior to 2001, some research funding was included in operating grants. 17 Australian Bureau of Statistics, 6401.0 Consumer Price Index, Australia, Canberra, June 2015
0%
5%
10%
15%
20%
25%
30%
35%
40%
1989
1990
1991
1992
1993
1994
1995
1996
1997
1998
1999
2000
2001
2002
2003
2004
2005
2006
2007
2008
2009
2010
2011
2012
2013
2014
Participation rate 15-64 yo Attainment rate 15-64 yo Attainment rate 25-34 yo
0
2
4
6
8
10
12
14
16
181989
1990
1991
1992
1993
1994
1995
1996
1997
1998
1999
2000
2001
2002
2003
2004
2005
2006
2007
2008
2009
2010
2011
2012
2013
2014
$b
Teaching & Learning Grants HELP Loans Research Total in 2014 Dollars

Higher Education in Australia
30
Commonwealth higher education funding, including grants for teaching and learning, research funding and student loans, remained relatively steady as a proportion of Gross Domestic Product (GDP), at around 1 per cent throughought the period 1989 to 2014. It peaked in 1994 at 1.06 per cent before declining slightly from the late 1990s, dropping as low as 0.78 per cent of GDP in 2004. In recent years this has increased again, standing at 0.97 per cent of GDP in 2014. These figures do not include amounts paid to students as income support payments. If these were included, the proportion would be higher.
Figure 8: Higher education funding as a proportion of GDP 1989-2014
Source: Department of Education and Training, ABS18
Along with the major reviews summarised in the preceding section, a range of other policy reviews over the period have considered more specific issues. For example, two departmental issues papers, Rationalising Responsibility for Higher Education in Australia (2004) and Building Better Foundations (2005) addressed the regulatory responsibilities of the Commonwealth and the states for universities, and the suitability of these arrangements.
The 2012 Review of Higher Education Access and Outcomes for Aboriginal and Torres Strait Islander People (Behrendt Review) saw the introduction of targets and strategies for improving Aboriginal and Torres Strait Islander access and outcomes. Although still quite recent, there have subsequently been small increases in the proportion of Indigenous students, Indigenous retention rates and Indigenous staffing at public universities.
In May 2013 the Government commissioned an independent review to consider ways to reduce the regulatory burden on higher education providers. The Lee Dow-Braithwaite Review of Higher Education Regulation was made public in August 2013. The Government accepted all of its recommendations.
The timeline below highlights the most significant changes to higher education funding policy over the period 1988 to the present.
18 Australian Bureau of Statistics, 5204.0 Key National Accounts Aggregates, Canberra, 2014, GDP current prices
0.0%
0.2%
0.4%
0.6%
0.8%
1.0%
1.2%
1989
1990
1991
1992
1993
1994
1995
1996
1997
1998
1999
2000
2001
2002
2003
2004
2005
2006
2007
2008
2009
2010
2011
2012
2013
2014
Percentage of GDP

Higher Education in Australia
31
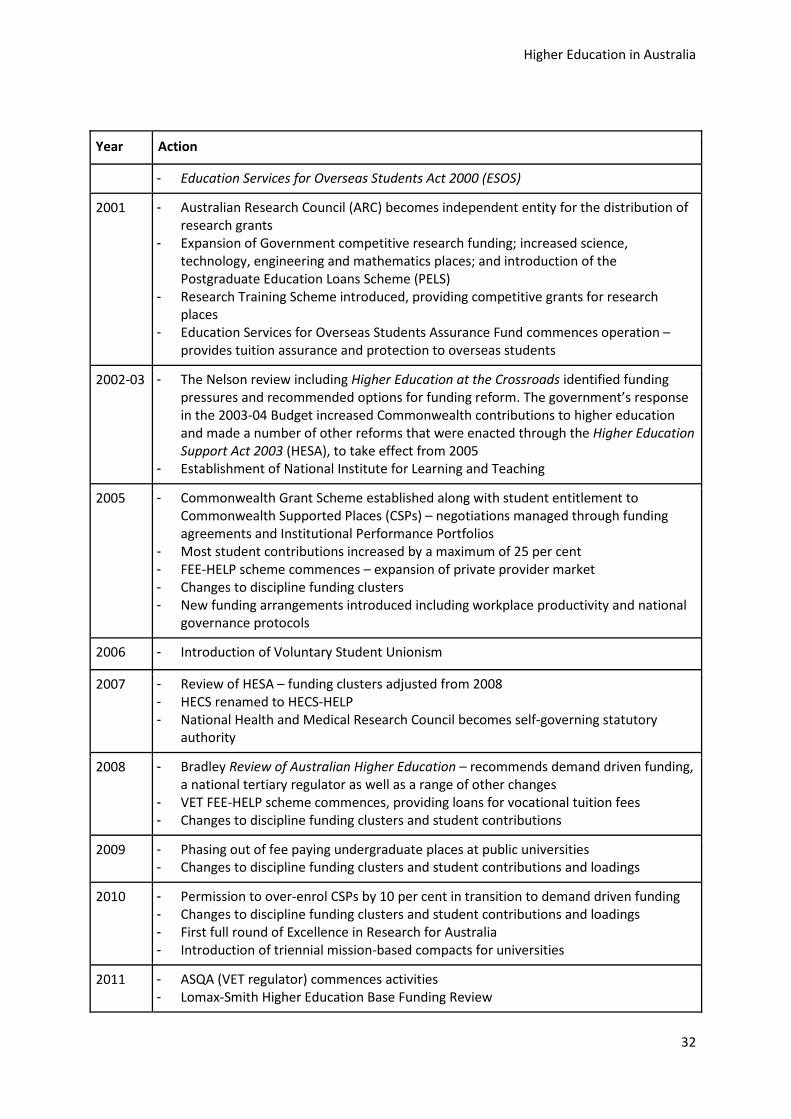
Timeline of significant reform in Australia’s higher education system19 Year Action
1987 - Higher education: a policy discussion paper (a green paper) suggested an increase in output of graduates to around 125,000 by the turn of the century and fewer, larger higher education institutions
1988 - Higher education: a policy statement (a white paper containing the Government’s policy proposals following consideration of public and sector responses to the green paper) proposed a unified national higher education system and made a commitment to growth in the system.
- The Committee on Higher Education Funding (the Wran Committee) developed options for funding the expansion sought in the number of higher education students
- Passage of Higher Education Funding Act 1988, the basis of higher education funding until 2003
- Students pay $250 Higher Education Administration Charge - Government establishes National Board for Education, Employment and Training
(NBEET), including its advisory bodies the Higher Education Council and Australian Research Council (ARC)
1989 - Introduction of the Unified National System and conversion of Centres for Advanced Education to universities
- Introduction of the Higher Education Contribution Scheme (HECS), with a flat annual student contribution of $1,800 (about $3,600 in 2015 dollars), equivalent to about 20 per cent of average per student costs
- Direct Commonwealth funding of higher education institutions conducted via individual negotiations between universities and the department, monitored by the Higher Education Council
1990-1995
- Relative Funding Model gradually introduces consistent undergraduate grant funding by discipline at all universities, becoming the basis for Triennial Funding Rounds
- Institutions gradually permitted to charge unregulated fees for most postgraduate coursework courses
1994 - Australian Postgraduate Awards introduced
1995 - Australian Qualifications Framework established
1997 - Differential HECS introduced, with three ‘bands’ of student contribution by course according to future graduate earnings ($3300/$4700/$5500)
1998 - West Review Learning for Life recommends increased tuition fee flexibility and demand driven funding
- Introduction of full-fee domestic student places at public universities, initially capped at 25 per cent of a course enrolments
2000 - Formal abolition of NBEET and its advisory councils - Australian Universities Quality Agency (AUQA) commences
19 Based, in part, on Lee Dow and Braithwaite, Review of Higher Education Regulation, pp. 6-8.
Higher Education in Australia
32
Year Action
- Education Services for Overseas Students Act 2000 (ESOS)
2001 - Australian Research Council (ARC) becomes independent entity for the distribution of research grants
- Expansion of Government competitive research funding; increased science, technology, engineering and mathematics places; and introduction of the Postgraduate Education Loans Scheme (PELS)
- Research Training Scheme introduced, providing competitive grants for research places
- Education Services for Overseas Students Assurance Fund commences operation – provides tuition assurance and protection to overseas students
2002-03 - The Nelson review including Higher Education at the Crossroads identified funding pressures and recommended options for funding reform. The government’s response in the 2003-04 Budget increased Commonwealth contributions to higher education and made a number of other reforms that were enacted through the Higher Education Support Act 2003 (HESA), to take effect from 2005
- Establishment of National Institute for Learning and Teaching
2005 - Commonwealth Grant Scheme established along with student entitlement to Commonwealth Supported Places (CSPs) – negotiations managed through funding agreements and Institutional Performance Portfolios
- Most student contributions increased by a maximum of 25 per cent - FEE-HELP scheme commences – expansion of private provider market - Changes to discipline funding clusters - New funding arrangements introduced including workplace productivity and national
governance protocols
2006 - Introduction of Voluntary Student Unionism
2007 - Review of HESA – funding clusters adjusted from 2008 - HECS renamed to HECS-HELP - National Health and Medical Research Council becomes self-governing statutory
authority
2008 - Bradley Review of Australian Higher Education – recommends demand driven funding, a national tertiary regulator as well as a range of other changes
- VET FEE-HELP scheme commences, providing loans for vocational tuition fees - Changes to discipline funding clusters and student contributions
2009 - Phasing out of fee paying undergraduate places at public universities - Changes to discipline funding clusters and student contributions and loadings
2010 - Permission to over-enrol CSPs by 10 per cent in transition to demand driven funding - Changes to discipline funding clusters and student contributions and loadings - First full round of Excellence in Research for Australia - Introduction of triennial mission-based compacts for universities
2011 - ASQA (VET regulator) commences activities - Lomax-Smith Higher Education Base Funding Review

Higher Education in Australia
33
Year Action
- Review of Funding for Postgraduate Places - Knight Review of the Student Visa Program - Launch of MyUniversity website - Overseas Students Ombudsman commences
2012 - TEQSA commences activities. First providers given re-registration - Full demand driven funding system introduced for bachelor places (caps remain for
sub-bachelor and CSP postgraduate places) - Abolition of Student Learning Entitlement, which limited Commonwealth support to
seven years of full-time study - Office of Learning and Teaching replaces Australian Learning and Teaching Council - Tuition Protection Scheme introduced for international students - Removal of requirement that RTOs have credit transfer arrangements with higher
education providers to access VET FEE-HELP - PhillipsKPA Review of Reporting Requirements for Universities
2013 - Reviews of Higher Education Standards and National VET Standards - Lee Dow Braithwaite Review of Higher Education Regulation - McKeon Review of Health and Medical Research - TEQSA Risk Assessments first round completed - Launch of MySkills website
2014 - National Commission of Audit recommends rebalancing of government/student contribution and consideration of options for partial or full deregulation
- Kemp Norton Review of the Demand Driven System - 2014-15 Budget proposes expansion of demand driven funding to sub-bachelor
courses and private providers, fee deregulation for CSPs and other changes
2015 - Launch of QILT website - Reforms to VET FEE-HELP announced - Government announced a new institute for teaching and learning to be located in the
sector and a national consultation to discuss its implementation.

Higher Education in Australia
34
4. International responses to funding pressures in higher education Australia is not alone in facing pressure to sustain its higher education sector. Across the world countries are facing similar issues, even if their higher education systems are vastly different.
OECD analysis shows that there is a wide range of approaches to tuition fees and public support for students. In this analysis Australia is grouped with Canada, the Netherlands, New Zealand, the UK and the US as countries which have well-developed student support systems with relatively high tuition fees; compared, for example, with the Nordic countries which have no or low tuition fees (although high tax rates). Other countries such as Japan and Korea are classified as having high tuition fees but less developed student support systems.20
The most important international drivers for change in higher education funding are economic. Economic development and structural change are driving the need for more highly skilled workers across all economies. This is resulting in increased demand for higher education qualifications. Holding such qualifications is becoming the norm rather than the domain of a small elite. The UK’s 2010 Browne report noted that 50 years previously only 6 per cent of UK young people went on to higher education21. In 2014, this figure was close to 40 per cent.22 Similarly in Japan the enrolment rate for 18 year olds was around 36 per cent throughout the 1970s and 1980s but then increased to 45 per cent in 1995 and 55 per cent by 2013.23 National governments have facilitated or encouraged the trend in various ways, with a highly educated workforce seen as necessary to compete in a globalised, knowledge-based economy.
Globalisation is another international driver of change in higher education, as employment, workers, students and research become more mobile and competition between countries and institutions for the brightest students and most talented researchers intensifies.
Economic change and globalisation are leading to increased demand for higher education places by school leavers as well as by mature aged workers whose skills are becoming outdated as the international labour market changes. In addition, individual countries have their own pressures for higher education funding reform including demographic, financial and social drivers. Some of the readily available information on more recent reviews and reform directions in other countries is outlined below.
20 Based on analysis of indicator B5 in OECD, Education at a Glance, www.oecd.org/edu/eag.htm. 21 John Browne, Securing a sustainable future for higher education, an independent review of higher education funding and student finance, 12 October 2010, www.independent.gov.uk/browne-report 22 UK Department for Business Innovation and Skills, Participation rates in higher education, 24 April 2013, https://www.gov.uk/government/uploads/system/uploads/attachment_data/file/191902/13-p140-HEIPR_TABLES_2011-12.xls 23 Amanu Ikuo, in Nippon.com, Globalization and higher education reforms in Japan: the obstacles to greater international competitiveness, 3 November 2014, http://nippon.com/en/in-depth/a02801

Higher Education in Australia
35
United Kingdom
2006 reforms In response to concerns that public investment in higher education was not keeping step with demand, in the mid-2000s the UK adopted limited student fees as well as income contingent loans for full-time students. This was accompanied by equity measures for low income students. Fees, which came into effect in 2006, were capped. At the time it was envisaged that actual fees would vary between institutions, however, by 2010 all institutions had moved to charge the maximum fee allowed24.
The 2010 Browne report The Browne report concluded that the 2006 changes had increased income for higher education institutions without reducing demand from students. UK research found that allowing students to defer the payment of fees combined with improved student financial support had offset the impact of fees. However, Browne found that the contribution made by graduates as a result of the 2006 changes had not reduced the reliance of the system on public funding. Further, Browne argued the balance of funding did not reflect the private and public benefits of higher education.
Other problems included that investment in higher education at that time was insufficient to deal with the international challenge and the UK’s competitive edge was being threatened by advances being made elsewhere. Browne said that failing to expand participation in higher education would result in a reduction in the UK’s standard of living. With capped fees, institutions had little scope to access additional funds through tuition fees in order to invest in improved quality and student experience. Unmet demand for higher education places was expected to increase. Support for part-time students was inadequate, there had been limited progress on fair access and the higher education system was not responsive enough to the changing skill needs of the economy.
The Browne report proposed: • more investment in higher education - and that this should come from graduates • no cap on fees • an increase in living cost support for low income students and new support for part-time
students • higher education institutions actively compete for students; with safeguards including the
enforcement of baseline quality standards and better information for students • funding follow the student rather than being provided as block grants.
Post 2010 While accepting most of Browne’s proposals, the UK government did not accept uncapped fees and increased the cap on student fees in 2012. This resulted in a trebling of student fees at most institutions.25 After the cap was raised and fees increased, there was an initial fall in overall
24 Browne, ibid 25 Jack Grove, Nine out of 10 universities opt to charge maximum fee, Times Higher Education, 11 July 2013, http://www.timeshighereducation.co.uk/news/nine-out-of-10-universities-opt-to-charge-maximum-fee/2005624.article

Higher Education in Australia
36
enrolments (around 8.7 per cent); however, demand from school leavers remained strong, including those from non-affluent backgrounds. Overall, university applications rose by two per cent for admission in 2013-14. The most significant fall in participation was from mature age students undertaking a second degree, as they are not eligible for student loans.26 Participation of disadvantaged young people in higher education is still significantly lower than that of non-disadvantaged young people. However, this rate has been increasing steadily over time despite increasing cost to students.27
The overall impact of the reforms is difficult to gauge, however. In 2012-13, there were 6.4 per cent more students studying at UK higher education institutions than in 2003-04.28 However, student numbers fluctuated during this period. 2009-10 saw the largest year-on-year increase of 4.1 per cent, then after some stability at this peak between 2009-10 and 2011-12, numbers decreased by 6.3 per cent in 2012-13.
Germany The Higher Education Pact 2020 is a joint federal/state initiative, reflecting the shared responsibility for higher education in Germany. The pact has created a needs-based study provision, to support the expansion of higher education in Germany. The expansion is required because of a marked increase in recent years in the number of school-leavers applying for university places. This is reported to have arisen from the abolition of military conscription in 2011 and the fast-tracking of some secondary school leavers at the same time.29
The pact has supported a doubling of new entrants from 2007 to 2010 with a further 624,000 additional places created from 2011 to 2015.30
From the 2014-15 academic year tuition fees were phased out, and from January 2015 the German federal government was to assume responsibility for the funding of all grants and loans to university and secondary school students nationwide. This aimed to release the Länder (regional states) of their traditional 35 per cent financial contribution, which the federal government wants the Länder to invest instead in improving infrastructure in schools and universities.
Also, from the 2016-17 academic year students will be eligible for significantly improved benefits and subsidies. This includes an increased ceiling on a student support package that is 50 per cent grant, 50 per cent means-tested loan and an increase in rent subsidies. Students and vocational
26 Nick Hilman, A comparison of student loans in England and Australia, Higher Education Policy Institute HEPI Report 66, April 2014, http://www.hepi.ac.uk/wp-content/uploads/2014/04/FINAL-AUSTRALIA-PIECE.pdf 27 Higher Education Funding Council for England, Trends in young participation in higher education, October 2013, http://www.hefce.ac.uk/media/hefce/content/pubs/2013/201328/HEFCE_2013_28.pdf 28 Universities UK, Patterns and trends in higher education 2014, December 2014, http://www.universitiesuk.ac.uk/highereducation/Documents/2014/PatternsAndTrendsInUKHigherEducation2014.pdf 29 Frances Mechan-Schmit, German reforms give students ‘substantial’ financial boost, Times Higher Education, 2 October 2014, https://www.timeshighereducation.com/.../german-reforms.../2016024.art. 30 Lohmar, B & Eckhardt, T, The Education System in the Federal Republic of Germany 2012/2013. Standing Conference of the Ministers of Education and Cultural Affairs, 2014, http://www.kmk.org/fileadmin/doc/Dokumentation/Bildungswesen_en_pdfs/dossier_en_ebook.pdf
Higher Education in Australia
37
trainees will also be able to earn more and to own more assets while remaining eligible for government benefits. An estimated additional 110,000 tertiary and secondary students will be eligible once the new measures have taken effect.
As a result of the recent changes, expenditure on higher education teaching and research increased from 25.5 billion Euros (A$39 billion31) in 2009 to 30 billion Euros (A$46 billion) in 201132. Total students went from just over 2 million in 2009 to 2.2 million in 2011; and further increased to over 2.6 million in 201433.
Japan The Japanese government is implementing new reforms of Japan’s 86 public national universities. Although these comprise only 20 per cent of Japan’s universities they are among the best performers and enrol more than half of all postgraduate students. Ten of the 11 Japanese universities in the Times Higher Education top 400 for 2013-14 were national universities.
The national universities were released from direct supervision of the Ministry of Education in 2004 and became corporate entities. They are allocated a certain level of public funding each year and can compete with other universities for other funding. They also obtain funding from tuition, donations and research arrangements. 34
The drivers for higher education reform in Japan have been identified as the international trends towards universal participation in higher education; marketisation of higher education and economic globalisation.
Local Japanese factors include demographic swings – there was rapid growth of 18 year olds between the mid-1980s and 1992 and then a return to mid-1980s levels; an economic slump since the early 1990s during which Japan has fallen behind the rest of the developed world in IT and globalisation – meaning universities need to improve their quality and research; a deregulatory government agenda under which public funding is more competitive; and Japan’s decreased standing on international university rankings. There is also concern about low participation by mature aged students and the slow development of graduate level education in Japan. 35
The Abe government aims to lift the number of Japanese universities in the top 100 from 2 to 10. 36
During 2015, all national universities will be asked to self-nominate in one of three new categories:
i. Universities with world-class teaching and research ii. Universities with world-class teaching and research in specific fields
31 Currency converted using RBA’s published rates for 23 October 2015 as published at http://www.rba.gov.au/statistics/frequency/exchange-rates.html 32 Federal Ministry of Education and Research, Education and Research in Figures 2014, Bonn, 2014 33 Ibid 34 Amanu Ikuo, ibid 35 ibid 36 Mitsuru Obe, Japan rethinks higher education in skills push, The Wall Street Journal, 2 August 2015. http://www.wsj.com/articles/japan-rethinks-higher-education-in-skills-pish-14385711

Higher Education in Australia
38
iii. Universities contributing to revitalising the local economy.
Universities will then be evaluated and funded based on standards devised for each category. The new system is to be operating by 2018. University presidents have also been given additional funding and autonomy to manage institutions.
Separately, the government’s Council on Industrial Competitiveness has recommended that research-intensive universities be given more freedom to raise fees and work more closely with industry.
These reforms are part of the Abe government’s broader reform agenda to revitalise the economy and respond to demographic challenges.
New Zealand Higher education policy in New Zealand has seen substantial change over the last two decades, transforming the sector from an elite university system to a mass tertiary system. In the 1990s, policy emphasis was on market competition, increased participation, student choice and the private returns of higher education. The government introduced private contributions, supported a greater role for private providers and removed caps on publicly-subsidised higher education places. In the 2000s, whilst retaining an emphasis on competition and market forces, the focus shifted to lowering costs and moving toward a more centrally steered system that was able to address national needs.37 This included a reintroduction of caps on the number of subsidised places in 2004.38
As a result of these reforms throughout the 1990s and early 2000s, New Zealand experienced significant growth in participation in higher education which many considered to be ‘over-enrolment’; along with significant growth in government expenditure. However, this growth in participation steadily slowed from the mid to late 2000s.
Changes to tuition fees were a key part of New Zealand’s higher education reforms. Tuition fees were deregulated alongside the implementation of an income contingent loan scheme in 1992. This resulted in a continuing increase in tuition fees. The government secured university agreement to freeze student fees from 1999 in exchange for increased government funding. In 2003, the government began annually setting both a maximum fee limit and a maximum amount that fees could increase if they were below the maximum.39 In 2011, the government removed the maximum fee limit but retained the restriction on annual increases. This limit has been set at 3 per cent for 2016, having previously been at the 4 per cent mark.40
37 Maureen McLaughlin, Tertiary education policy in New Zealand, Fulbright Report, 2003, http://www.fulbright.org.nz/wp-content/uploads/2011/12/axford2002_mclaughlin.pdf 38 Roger Smyth, 20 years in the life of a small higher education system, 17 September 2012, http://www.slideshare.net/OECDEDU/20-years-in-the-life-of-a-small-tertiary-education-system-attaining-and-sustaining-mass-tertiary-education-lessons-from-the-new-zealand-experience-roger-smyth 39 New Zealand Government, Fee and course costs maxima, http://www.beehive.govt.nz/Documents/Files/Frequently%20Asked%20Questions%20and%20Answers.doc 40 New Zealand Treasury, 2015 Budget information release, July 2015 http://www.treasury.govt.nz/downloads/pdfs/b15-info/b15-3177139.pdf
Higher Education in Australia
39
New Zealand also made changes to its student loan repayment arrangements to address the increasing share of overdue payments and defaults from overseas based borrowers. 41 In 2010 an enhanced compliance system for overseas-based borrowers was introduced. More recently, fixed repayment obligations and higher repayment thresholds were applied to these borrowers, as well as a border arrest system for the most non-compliant with high levels of repayment default.
In recent years, attention has focused on higher quality outcomes from the tertiary education system, particularly completion rates and employment outcomes. There is also a focus on boosting achievement of Maori and Pasifika students. In addition there has been emphasis on increasing participation in disciplines identified as national priorities, such as engineering, and addressing underfunding of high cost disciplines such as science and agriculture. 42 This forms part of the government’s strategy to ensure providers deliver more of the skills and knowledge New Zealand needs to drive economic growth.
41 New Zealand Government, Lifting student loan repayments from overseas-based borrowers, 16 May 2013, http://www.beehive.govt.nz/release/lifting-student-loan-repayments-overseas-based-borrowers 42 New Zealand Government, Further $113m boost for tertiary education, skills, 21 May 2015, http://www.beehive.govt.nz/release/further-113m-boost-tertiary-education-skills


