Instructions for the completion of Section 1 are given on Page two of your question and answer booklet SQ25/H/02.
Record your answers on the answer grid on Page three of your question and answer booklet.
Before leaving the examination room you must give your question and answer booklet to the Invigilator; if you do not you may lose all the marks for this paper.
Instructions for completion of Section 1 are given on Page two.
SECTION 2 — 80 marks
Attempt ALL questions.
Write your answers in the spaces provided. Additional space for answers and rough work is provided at the end of this booklet. If you use this space, write clearly the number of the question you are attempting. Any rough work must be written in this booklet. You should score through your rough work when you have written your fair copy.
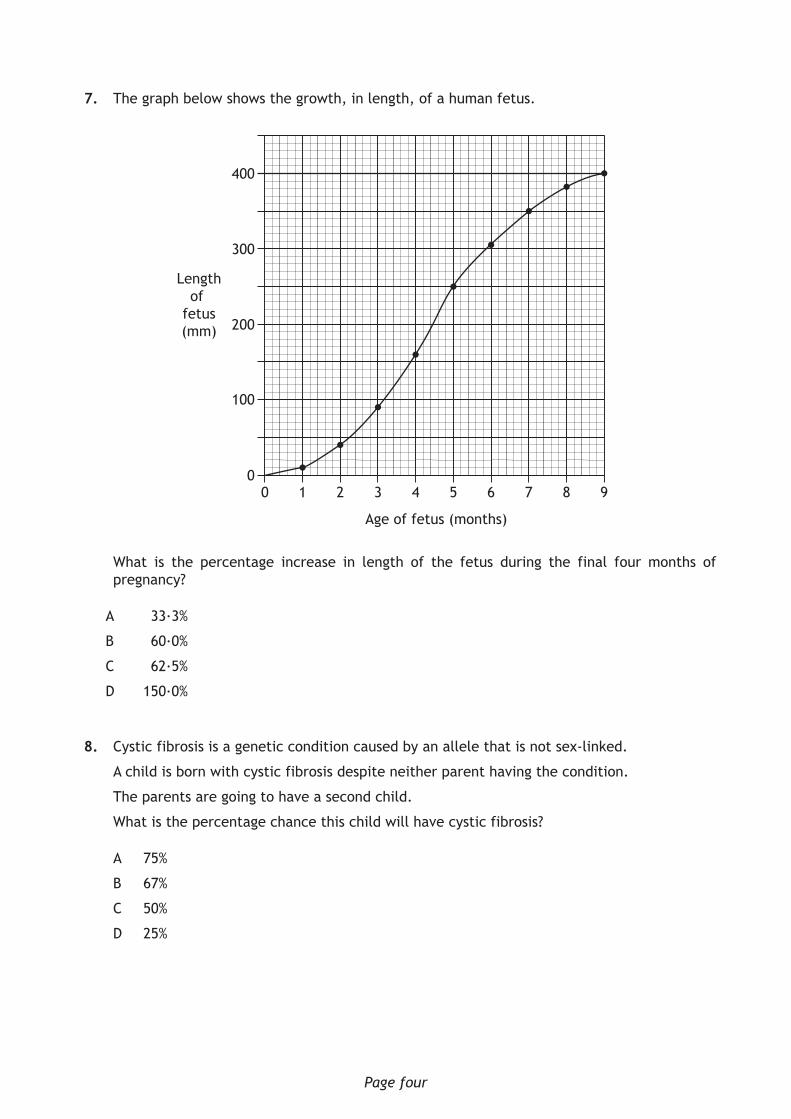
Use blue or black ink.
Before leaving the examination room you must give this booklet to the Invigilator; if you do not, you may lose all the marks for this paper.
SQ25/H/01
H NationalQualicationsSPECIMEN ONLY
Date — Not applicable
Duration — 2 hours and 30 minute
*SQ25H0102*
The questions for Section 1 are contained in the question paper SQ25/H/02.Read these and record your answers on the answer grid on Page three opposite.Do NOT use gel pens.
1. The answer to each question is either A, B, C or D. Decide what your answer is, then fill in the appropriate bubble (see sample question below).
2. There is only one correct answer to each question.
3. Any rough working should be done on the additional space for answers and rough work at the end of this booklet.
Sample Question
The digestive enzyme pepsin is most active in the
A mouth
B stomach
C duodenum
D pancreas.
The correct answer is B—stomach. The answer B bubble has been clearly filled in (see below).
A B C D
Changing an answer
If you decide to change your answer, cancel your first answer by putting a cross through it (see below) and fill in the answer you want. The answer below has been changed to D.
A B C D
If you then decide to change back to an answer you have already scored out, put a tick (3) to the right of the answer you want, as shown below:
A B C D
or
A B C D
SECTION 1 — 20 marks
Page two
*SQ25H0103*
SECTION 1 — Answer Grid
A B C D
1
2
3
4
5
6
7
8
9
10
11
12
13
14
15
16
17
18
19
20
*OBJ20AD1*
Page three
*SQ25H0104*
MARKS DO NOT WRITE IN
THIS MARGIN
Page four
SECTION 2 — 80 marks
Attempt ALL questions
Note that question 14 contains a choice.
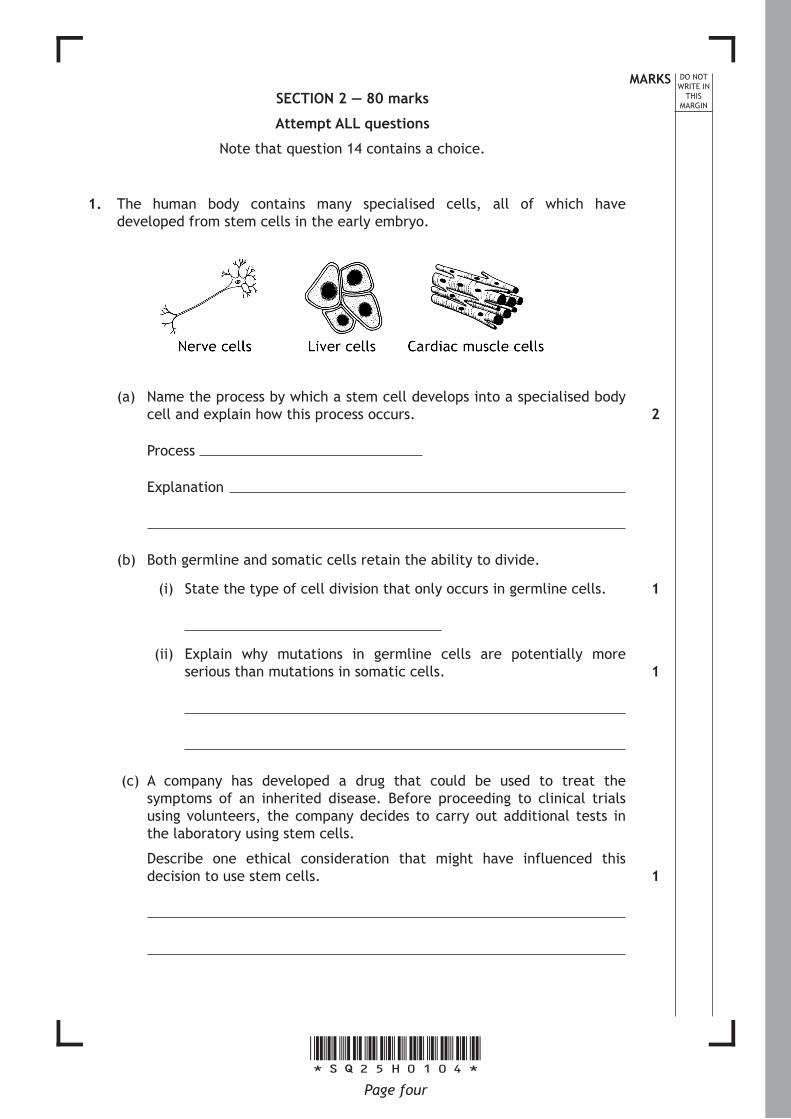
1. The human body contains many specialised cells, all of which have developed from stem cells in the early embryo.
(a) Name the process by which a stem cell develops into a specialised body cell and explain how this process occurs.
Process
Explanation
(b) Both germline and somatic cells retain the ability to divide.
(i) State the type of cell division that only occurs in germline cells.
(ii) Explain why mutations in germline cells are potentially more serious than mutations in somatic cells.
(c) A company has developed a drug that could be used to treat the symptoms of an inherited disease. Before proceeding to clinical trials using volunteers, the company decides to carry out additional tests in the laboratory using stem cells.
Describe one ethical consideration that might have influenced this decision to use stem cells.
2
1
1
1
MARKS DO NOT WRITE IN
THIS MARGIN
*SQ25H0105*Page five
2. The diagram below shows stages in the synthesis of a polypeptide.
stage 1
primary mRNA
transcript
ChromosomalDNA
maturemRNA
transcript
synthesisedpolypeptide
stage 2 stage 3
(a) Name the enzyme that catalyses stage 1 of this process.
(b) Name stage 3 and state the exact location where it occurs within a cell.
Name
Location
(c) (i) Explain why the primary mRNA transcript is so much shorter than chromosomal DNA.
(ii) Explain why the mature mRNA transcript is shorter than the primary mRNA transcript.
1
1
1
1
*SQ25H0106*
MARKS DO NOT WRITE IN
THIS MARGIN
Page six
3. An experiment was carried out to investigate the effect of substrate concentration on the production of an end-product in an enzyme controlled reaction.
The enzyme urease was used which breaks down urea into ammonia.
urease urea amonia
Urease and urea solutions were mixed together and added to test tubes containing agar jelly as shown in the diagram below.
rubber stopper
urease and ureasolution
agar jellycontainingindicator
Five different concentrations of urea solution were added.
During the reaction the ammonia produced diffused through the agar jelly changing the indicator from yellow to blue.
The length of the agar jelly stained blue was measured after the experiment had been allowed to run for 48 hours.
The results of the experiment are shown in the table below.
Urea concentration added (molar)
Average length of agar jelly stained blue (mm)
0·03 2
0·06 4
0·13 8
0·25 16
0·50 32
MARKS DO NOT WRITE IN
THIS MARGIN
*SQ25H0107*Page seven
3. (continued)
(a) Plot a line graph to illustrate the results of the experiment.
(Additional graph paper, if required, can be found on Page twenty-six)
(b) (i) Name one variable that should be controlled when setting up this experiment.
(ii) Name one variable that should be kept constant during the 48 hours of this experiment.
(c) Give the feature of this experiment that makes the results reliable.
(d) Explain why the test tubes were left for 48 hours before the results were obtained.
2
1
1
1
1
*SQ25H0108*
MARKS DO NOT WRITE IN
THIS MARGIN
Page eight
3. (continued)
(e) State one conclusion that can be drawn from the results of this experiment.
(f) Using the information in the table, predict the length of agar jelly that would have been stained blue if a 0·75 molar urea solution had been used in the experiment.
Space for calculation
mm
(g) Thiourea is a competitive inhibitor of urease.
In another experiment, a test tube of agar jelly was set up containing the urease solution, 0·5 molar urea solution and thiourea.
After 48 hours only 7mm of agar jelly had turned blue.
(i) Explain why less agar jelly turned blue in this experiment than in the first experiment, which also used a 0·5 molar urea solution.
(ii) Suggest why 7mm of agar jelly turned blue in this experiment.
1
1
1
1
MARKS DO NOT WRITE IN
THIS MARGIN
*SQ25H0109*Page nine
4. The diagram below represents the glycolysis stage of respiration in a muscle cell.
(a) Phase 1 is the energy investment stage of glycolysis while phase 2 is the energy pay-off stage of glycolysis.
Describe what happens during the energy investment and energy pay-off phases of glycolysis.
Energy investment phase
Energy pay-off phase
(b) Once pyruvate has been formed it can be converted into two different compounds, depending on the conditions.
Name one of these compounds and state under what conditions it would be produced.
(c) Many athletes take creatine supplements to improve their sporting performance.
State whether sprinters or marathon runners would gain the greatest benefit from taking creatine and give a reason for your choice.
Athlete
Reason
2
2
1
*SQ25H0110*
MARKS DO NOT WRITE IN
THIS MARGIN
Page ten
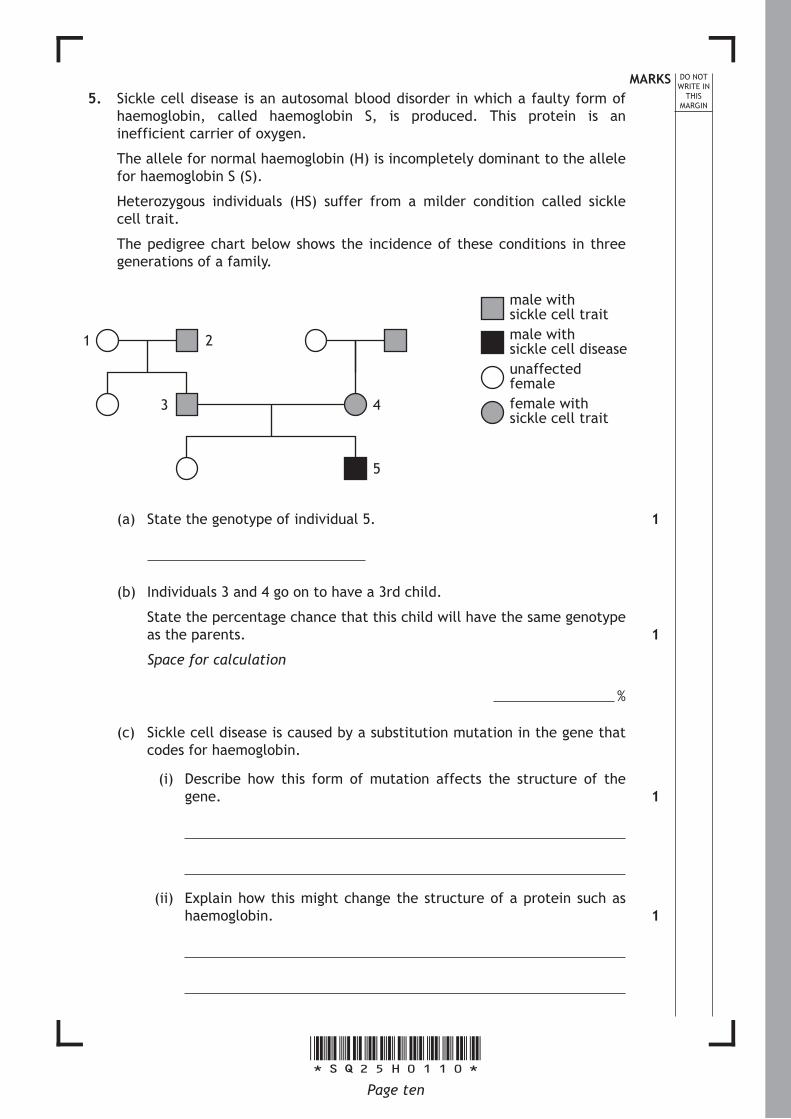
5. Sickle cell disease is an autosomal blood disorder in which a faulty form of haemoglobin, called haemoglobin S, is produced. This protein is an inefficient carrier of oxygen.
The allele for normal haemoglobin (H) is incompletely dominant to the allele for haemoglobin S (S).
Heterozygous individuals (HS) suffer from a milder condition called sickle cell trait.
The pedigree chart below shows the incidence of these conditions in three generations of a family.
male with sickle cell trait
1 2
3 4
5
male with sickle cell diseaseunaffectedfemalefemale with sickle cell trait
(a) State the genotype of individual 5.
(b) Individuals 3 and 4 go on to have a 3rd child.
State the percentage chance that this child will have the same genotype as the parents.
Space for calculation
%
(c) Sickle cell disease is caused by a substitution mutation in the gene that codes for haemoglobin.
(i) Describe how this form of mutation affects the structure of the gene.
(ii) Explain how this might change the structure of a protein such as haemoglobin.
1
1
1
1
MARKS DO NOT WRITE IN
THIS MARGIN
*SQ25H0111*Page eleven
5. (continued)
(d) During IVF treatment, it is possible to detect single gene disorders in fertilised eggs before they are implanted into the mother.
Give the term that describes this procedure.
(e) It has been discovered that the gene that codes for fetal haemoglobin is unaffected by the substitution mutation that causes sickle cell disease.
This gene is “switched off” at birth.
Use this information to suggest how a drug designed to treat sickle cell disease in young children could function.
1
1
*SQ25H0112*
MARKS DO NOT WRITE IN
THIS MARGIN
Page twelve
6. The diagram below represents a section through an artery.
lumen
Elastictissue
Muscletissue
X
(a) Describe how the presence of muscle tissue in the artery wall helps to control the flow of blood around the body.
(b) Describe how an atheroma forming under layer X may lead to the formation of a blood clot and state the possible effects of this.
Space for answer
1
5
MARKS DO NOT WRITE IN
THIS MARGIN
*SQ25H0113*Page thirteen
7. The graph below shows how an individual’s heart rate and stroke volume changed as their oxygen uptake increased during exercise.
KEYheart ratestroke volume
Rate of oxygen uptake (litres/minute)
0 0·4 0·8 1·2
160
140 160
140
120
100
80
Stroke volume (cm3)
Heart rate (beats per minute)
180
120
100
80
601·6 2·0 2·4
(a) (i) State the individual’s heart rate when the rate of oxygen uptake was 1·2 litres/minute.
(ii) Using data from the graph, describe how the stroke volume changed as oxygen uptake increased.
(iii) State the stroke volume when the heart rate was 110 beats per minute.
cm3
1
1
1
*SQ25H0114*
MARKS DO NOT WRITE IN
THIS MARGIN
Page fourteen
7. (continued)
(b) Calculate the cardiac output when the rate of oxygen uptake was 2·4 litres per minute.
Space for calculation
litres/min
(c) (i) When the individual’s blood pressure was measured an hour after exercise, a reading of 140/90 mm/Hg was recorded.
Explain why two figures are given for a blood pressure reading.
(ii) The individual was diagnosed as having high blood pressure.
One of the effects of this was that their ankles regularly swelled up due to a build-up of tissue fluid.
Explain the link between high blood pressure and the build-up of tissue fluid.
1
1
2
MARKS DO NOT WRITE IN
THIS MARGIN
*SQ25H0115*Page fifteen
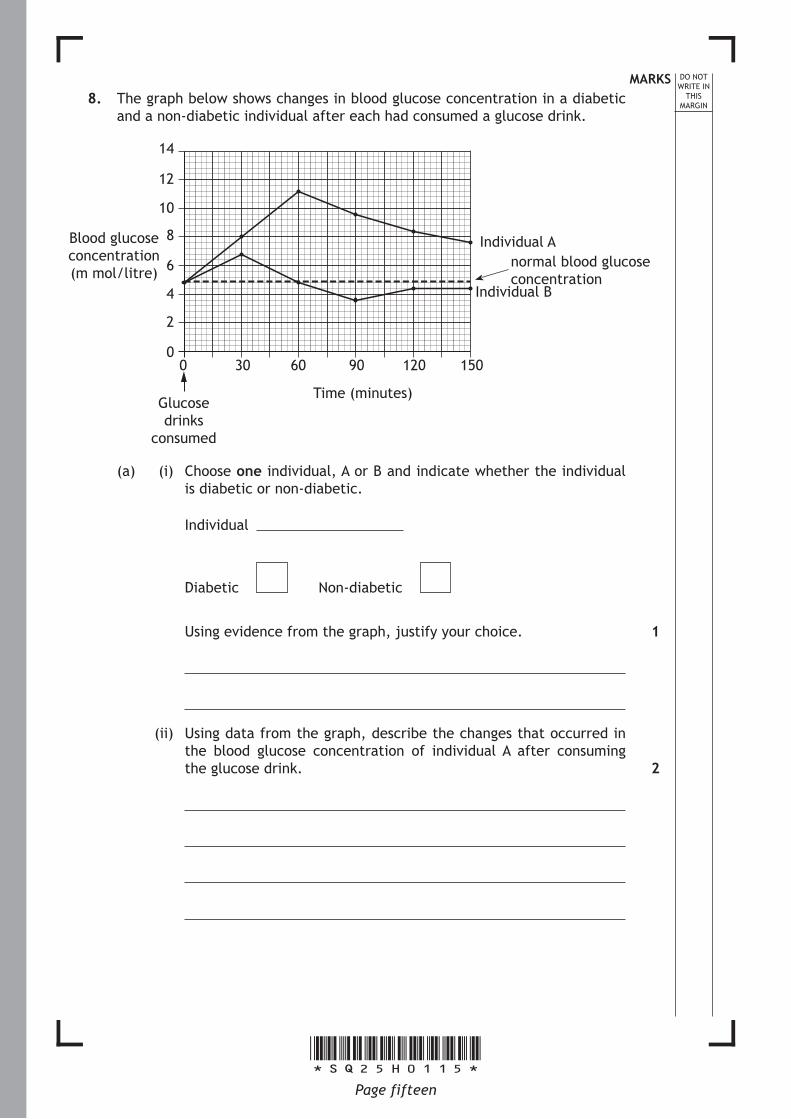
8. The graph below shows changes in blood glucose concentration in a diabetic and a non-diabetic individual after each had consumed a glucose drink.
Time (minutes)
0 30 60
10
8 Individual A
Individual B
normal blood glucose concentration
Blood glucose concentration (m mol/litre)
Glucose drinks
consumed
6
4
2
0
14
12
90 120 150
(a) (i) Choose one individual, A or B and indicate whether the individual is diabetic or non-diabetic.
Individual
Diabetic Non-diabetic
Using evidence from the graph, justify your choice.
(ii) Using data from the graph, describe the changes that occurred in the blood glucose concentration of individual A after consuming the glucose drink.
1
2
*SQ25H0116*
MARKS DO NOT WRITE IN
THIS MARGIN
Page sixteen
8. (continued)
(b) Describe the role of insulin in the development of type 1 and type 2 diabetes.
Type 1
Type 2
2
MARKS DO NOT WRITE IN
THIS MARGIN
*SQ25H0117*Page seventeen
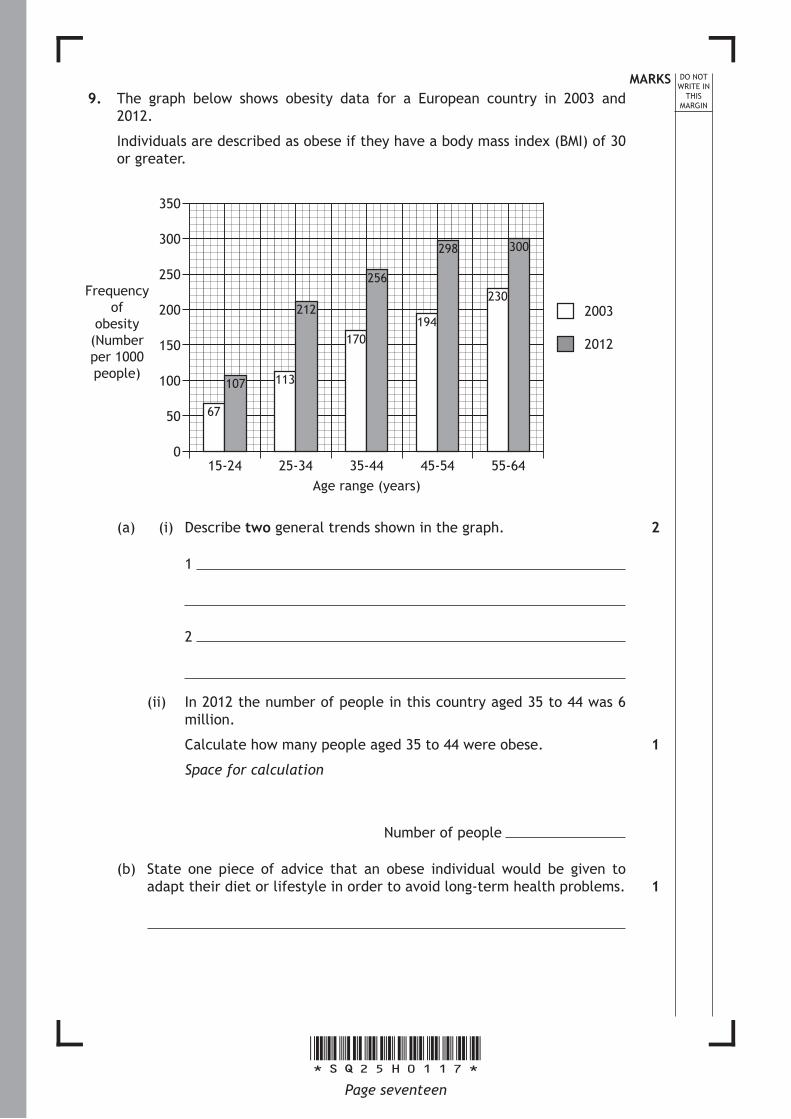
9. The graph below shows obesity data for a European country in 2003 and 2012.
Individuals are described as obese if they have a body mass index (BMI) of 30 or greater.
Frequencyof
obesity(Numberper 1000people)
2003
2012
15-24 25-34 35-44 45-54 55-64Age range (years)
350
300
250
200
150
100
50
0
67
107 113
212
170
256
194
298
230
300
(a) (i) Describe two general trends shown in the graph.
1
2
(ii) In 2012 the number of people in this country aged 35 to 44 was 6 million.
Calculate how many people aged 35 to 44 were obese.
Space for calculation
Number of people
(b) State one piece of advice that an obese individual would be given to adapt their diet or lifestyle in order to avoid long-term health problems.
2
1
1
*SQ25H0118*
MARKS DO NOT WRITE IN
THIS MARGIN
Page eighteen
10. A student carried out an investigation into the effect of age on learning ability.
Eight children from three different age groups were each given five attempts to complete a twenty-piece jigsaw puzzle.
The fastest times that they achieved are shown in the table below.
Fastest time achieved (seconds)
8-year-olds 12-year-olds 16-year-olds
123 97 99
98 68 74
111 75 62
138 112 67
87 93 84
136 83 101
79 75 58
120 81 55
average 111·5 75·0
(a) Calculate the average fastest time achieved by the 12 year-old children and write your answer in the table above.
Space for calculation
(b) Describe two additional variables that would have to be kept constant to ensure a valid comparison could be made between the three groups of children.
Variable 1
Variable 2
1
2
MARKS DO NOT WRITE IN
THIS MARGIN
*SQ25H0119*Page nineteen
10. (continued)
(c) State a conclusion that can be drawn from the results of this investigation.
(d) (i) Explain why the first attempt to complete the puzzle was always slower than the fifth attempt, no matter the age of the child.
(ii) Suggest why some children did not produce their fastest time on their fifth attempt.
(e) Suggest how the student could adapt the investigation to demonstrate social facilitation.
1
1
1
1
*SQ25H0120*
MARKS DO NOT WRITE IN
THIS MARGIN
Page twenty
11. The graph below shows the number of whooping cough cases over a 65 year period in a country.
180
160
140
120
100
80
60
40
20
01940 1950 1960 1970 1980 1990 2000 2010
Year
(a) (i) Using information from the graph, state the year in which a vaccine for whooping cough was introduced.
Year
(ii) Suggest a reason for the unexpected increase in the number of cases of whooping cough in 1977.
(b) The number of cases of whooping cough decreases to a very low level after 2000 because of herd immunity.
Explain what is meant by the term “herd immunity”.
1
1
2
Number of cases
(thousands)
MARKS DO NOT WRITE IN
THIS MARGIN
*SQ25H0121*Page twenty-one
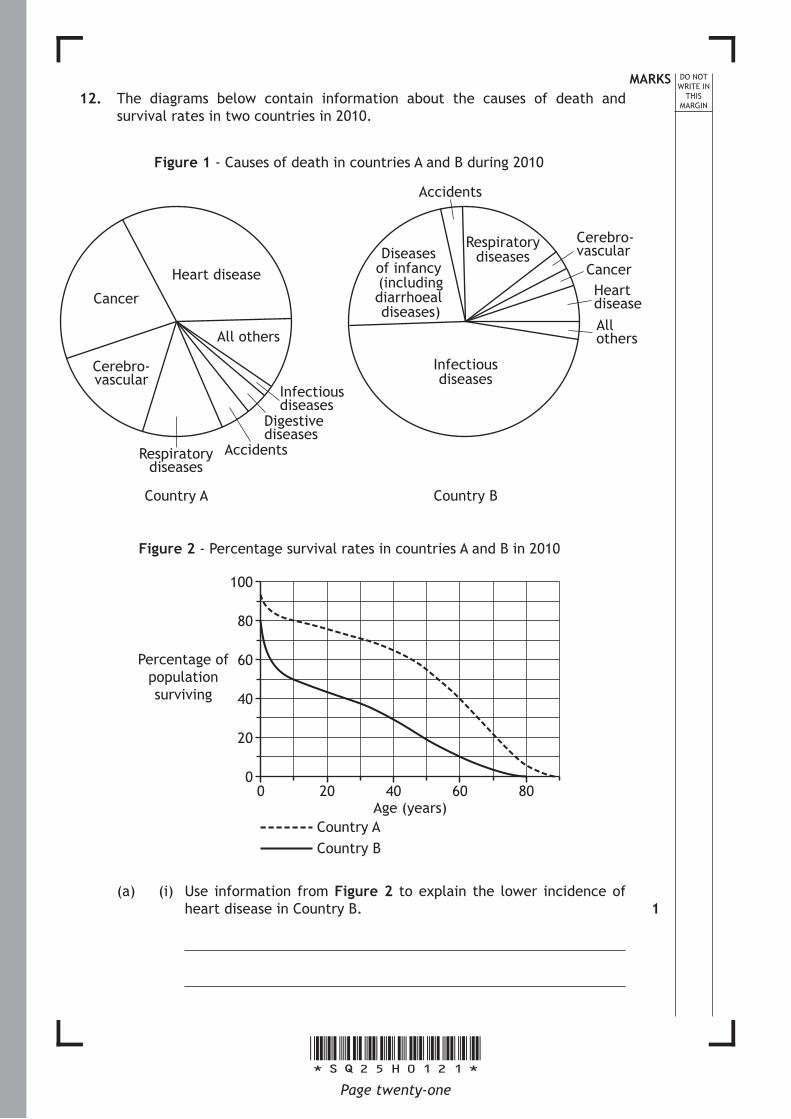
12. The diagrams below contain information about the causes of death and survival rates in two countries in 2010.
Heart diseaseDiseases
of infancy (includingdiarrhoeal diseases)
Infectiousdiseases
Respiratorydiseases
Cerebro-vascular
Cerebro-vascular
Accidents
Figure 1 - Causes of death in countries A and B during 2010
Country A Country B
CancerHeartdiseaseAll others
Cancer
Respiratorydiseases
All others
Digestivediseases
Accidents
Infectiousdiseases
Percentage ofpopulationsurviving
Country ACountry B
Age (years)0 20
100
80
60
40
20
040 60 80
Figure 2 - Percentage survival rates in countries A and B in 2010
(a) (i) Use information from Figure 2 to explain the lower incidence of heart disease in Country B.
1
*SQ25H0122*
MARKS DO NOT WRITE IN
THIS MARGIN
Page twenty-two
12. (a) (continued)
(ii) Give an example of how diseases of infancy can be reduced in Country B through community responsibility, other than by vaccination programmes.
(b) (i) Calculate the percentage of the population of Country A that die before the age of 10.
Space for calculation
%
(ii) In 1950 three million babies were born in Country B.
Calculate how many of these individuals were still alive in 2010, assuming no migration occurred.
Space for calculation
1
1
1
MARKS DO NOT WRITE IN
THIS MARGIN
*SQ25H0123*Page twenty-three
13. Pulmonary tuberculosis (TB) is an infectious disease of the lungs caused by a bacterium.
This bacterium can also damage other organs in the body. When this happens it is called non-pulmonary TB.
The table below shows the number of reported cases of pulmonary and non-pulmonary TB in Scotland between 1981 and 2006.
Year Number of cases of pulmonary TB
Number of cases of non-pulmonary TB
1981 659 140
1986 500 178
1991 452 97
1996 408 102
2001 275 125
2006 255 153
(a) Suggest how pulmonary TB is transmitted between individuals.
(b) (i) In which 5 year period was the greatest decrease in the total number of cases of TB?
Space for calculation
(ii) Suggest a reason for this decrease.
(iii) Compare the trend in the number of cases of pulmonary TB with that of non-pulmonary TB between 1991 and 2006.
1
1
1
1
*SQ25H0124*
MARKS DO NOT WRITE IN
THIS MARGIN
Page twenty-four
13. (b) (continued)
(iv) Calculate, as a simple whole number ratio, the number of cases of pulmonary TB compared to non-pulmonary TB in 2001.
Space for calculation
: pulmonary TB non-pulmonary TB
(c) Non-pulmonary TB is often associated with HIV infection.
Suggest a reason for this association.
1
1
MARKS DO NOT WRITE IN
THIS MARGIN
*SQ25H0125*Page twenty-five
14. Answer either A or B in the space below.
A Describe the structure and function of the autonomic nervous system.
OR
B Describe the function and mechanism of neurotransmitter action at the synapse.
The information in this publication may be reproduced to support SQA qualifications only on a non-commercial basis. If it is to be used for any other purpose, written permission must be obtained from SQA’s Marketing team on [email protected].
Where the publication includes materials from sources other than SQA (ie secondary copyright), this material should only be reproduced for the purposes of examination or assessment. If it needs to be reproduced for any other purpose it is the user’s responsibility to obtain the necessary copyright clearance.
These Marking Instructions have been provided to show how SQA would mark this Specimen Question Paper.
Page 2
General Marking Principles for Human Biology Higher
This information is provided to help you understand the general principles you must apply when marking candidate responses to questions in this Paper. These principles must be read in conjunction with the detailed marking instructions, which identify the key features required in candidate responses.
a) Marks for each candidate response must always be assigned in line with these General Marking Principles and the Detailed Marking Instructions for this assessment.
b) Marking should always be positive. This means that, for each candidate response, marks are accumulated for the demonstration of relevant skills, knowledge and understanding: they are not deducted from a maximum on the basis of errors or omissions.
c) Half marks may not be awarded.
d) Where a candidate makes an error at an early stage in a multi-stage calculation, credit should normally be given for correct follow-on working in subsequent stages, unless the error significantly reduces the complexity of the remaining stages. The same principle should be applied in questions which require several stages of non-mathematical reasoning.
e) Unless a numerical question specifically requires evidence of working to be shown, full marks should be awarded for a correct final answer (including units if required) on its own.
f) Larger mark allocations may be fully accessed whether responses are provided in continuous prose, linked statements or a series of discrete developed points.
g) In the detailed Marking Instructions, if a word is underlined then it is essential; if a word is (bracketed) then it is not essential.
h) In the detailed Marking Instructions, words separated by / are alternatives.
i) If two answers are given where one is correct and the other is incorrect, no marks are awarded.
j) Where the candidate is instructed to choose one question to answer but instead answers both questions, both responses should be marked and the better mark awarded.
k) The assessment is of skills, knowledge and understanding in Human Biology, so marks should be awarded for a valid response, even if the response is not presented in the format expected. For example, if the response is correct but is not presented in the table as requested, or if it is circled rather than underlined as requested, give the mark.
l) Unless otherwise required by the question, use of abbreviations (eg DNA, ATP) or chemical formulae (eg CO2, H20) are acceptable alternatives to naming.
m) Content that is outwith the course assessment specification should be given credit if used appropriately eg metaphase of meiosis.
Page 3
n) If a numerical answer is required and units are not given in the stem of the question or in the answer space, candidates must supply the units to gain the mark. If units are required on more than one occasion, candidates should not be penalised repeatedly.
o) If incorrect spelling is used: • and the term is recognisable then give the mark; • and the term can easily be confused with another biological term then do not give the
mark eg ureter and urethra; • and the term is a mixture of other biological terms then do not give the mark, eg
mellum, melebrum, amniosynthesis.
p) When presenting data:
• if a candidate provides two graphs or charts in response to one question (eg one in the question and another at the end of the booklet), mark both and give the higher mark
• for marking purposes no distinction is made between bar charts (used to show discontinuous features, have descriptions on the x-axis and have separate columns) and histograms (used to show continuous features, have ranges of numbers on the x-axis and have contiguous columns)
• other than in the case of bar charts/histograms, if the question asks for a particular type of graph or chart and the wrong type is given, then do not give the mark(s) for this. Where provided, marks may still be awarded for correctly labelling the axes, plotting the points, joining the points either with straight lines or curves (best fit rarely used), etc.
• the relevant mark should not be awarded if the graph uses less than 50% of the axes; if the x and y data are transposed; if 0 is plotted when no data for this is given (ie candidates should only plot the data given)
q) Marks are awarded only for a valid response to the question asked. For example, in response to questions that ask candidates to:
• identify, name, give, or state, they need only name or present in brief form; • calculate, they must determine a number from given facts, figures or information; • compare, they must demonstrate knowledge and understanding of the similarities and/or
differences between things; • describe, they must provide a statement or structure of characteristics and/or features; • evaluate, they must make a judgement based on criteria; • explain, they must relate cause and effect and/or make relationships between things clear; • predict, they must suggest what may happen based on available information; • suggest, they must apply their knowledge and understanding of Human Biology to a new
situation. A number of responses are acceptable: marks will be awarded for any suggestions that are supported by knowledge and understanding of Human Biology.
Page 4
Marking Instructions for each question
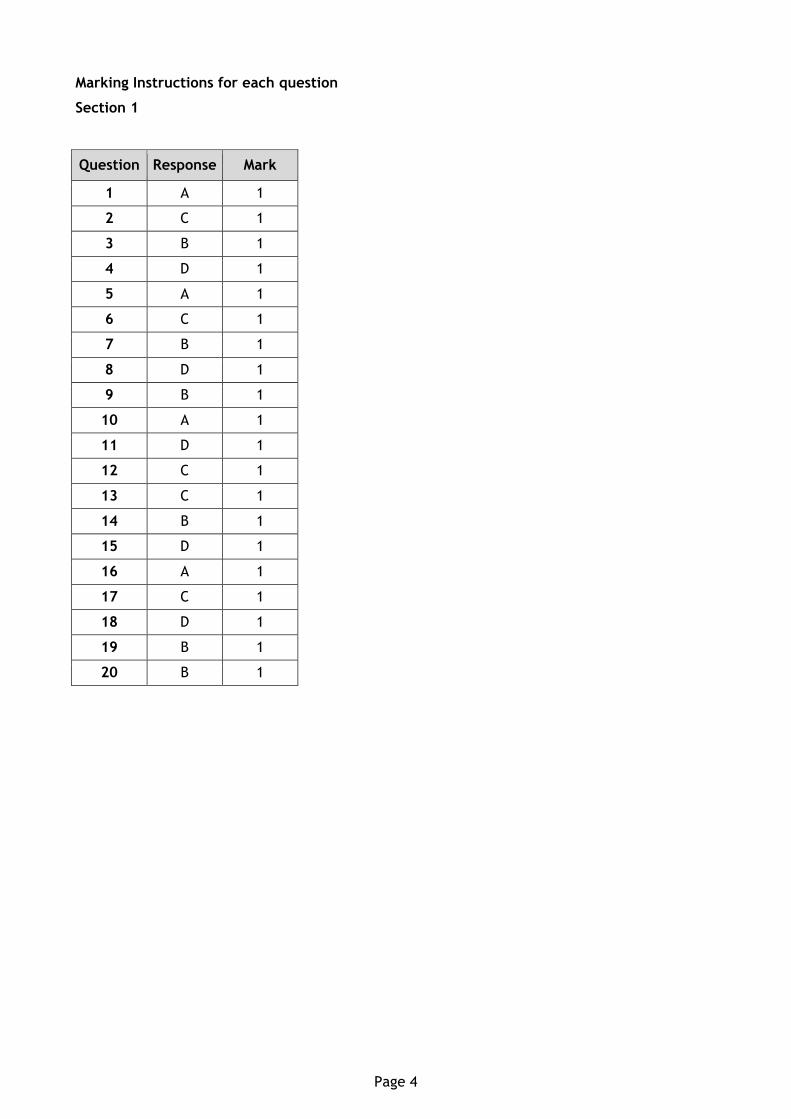
Section 1
Question Response Mark
1 A 1
2 C 1
3 B 1
4 D 1
5 A 1
6 C 1
7 B 1
8 D 1
9 B 1
10 A 1
11 D 1
12 C 1
13 C 1
14 B 1
15 D 1
16 A 1
17 C 1
18 D 1
19 B 1
20 B 1
Page 5
SECTION 2
Question Expected response Max mark Additional guidance
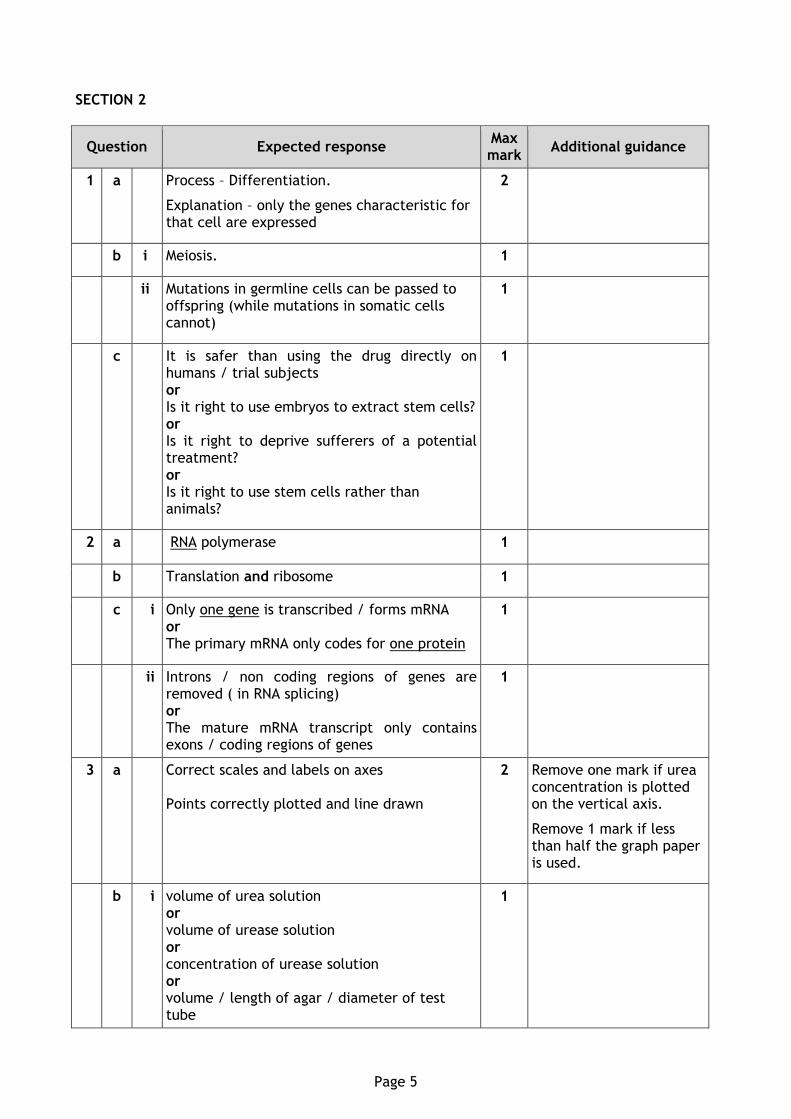
1 a Process – Differentiation.
Explanation – only the genes characteristic for that cell are expressed
2
b i Meiosis. 1
ii Mutations in germline cells can be passed to offspring (while mutations in somatic cells cannot)
1
c
It is safer than using the drug directly on humans / trial subjects or Is it right to use embryos to extract stem cells? or Is it right to deprive sufferers of a potential treatment? or Is it right to use stem cells rather than animals?
1
2 a RNA polymerase 1
b Translation and ribosome 1
c i Only one gene is transcribed / forms mRNA or The primary mRNA only codes for one protein
1
ii Introns / non coding regions of genes are removed ( in RNA splicing) or The mature mRNA transcript only contains exons / coding regions of genes
1
3 a Correct scales and labels on axes Points correctly plotted and line drawn
2 Remove one mark if urea concentration is plotted on the vertical axis.
Remove 1 mark if less than half the graph paper is used.
b i volume of urea solution or volume of urease solution or concentration of urease solution or volume / length of agar / diameter of test tube
1
Page 6
Question Expected response Max mark
Additional guidance
or volume / concentration of indicator in agar
ii Temperature of the tube contents / of the test tubes
1
c The experiment was repeated at each urea concentration (and an average calculated)
1
d To allow time for the ammonia to (fully) diffuse / spread through the agar / jelly
1
e As the urea concentration increased more ammonia was produced or As the urea concentration decreased less ammonia was produced
1 Answer must relate to ammonia and not restate results (length of blue agar produced)
f 48 1
g i Thiourea blocked the active site on the urease/enzyme
1
ii Not all active sites were blocked or some active sites were still available
1
4 a Energy investment - ATP molecules are broken down / used up (to provide energy) or Phosphorylation / addition of phosphate to glucose / intermediates occurs. Energy pay-off - ATP molecules are produced
2
b Acetyl (group) / acetyl coenzyme A / acetyl CoA produced when oxygen is present / in aerobic conditions
or
Lactic acid produced when oxygen is absent / insufficient / in anaerobic conditions
2
c Athlete – Sprinter
Reason – creatine (phosphate) releases energy at a fast rate / for a short period of time / runs out quickly.
1
5 a SS 1
b 50 1
c i It alters the (DNA) nucleotide sequenceor replaces one nucleotide with another
1
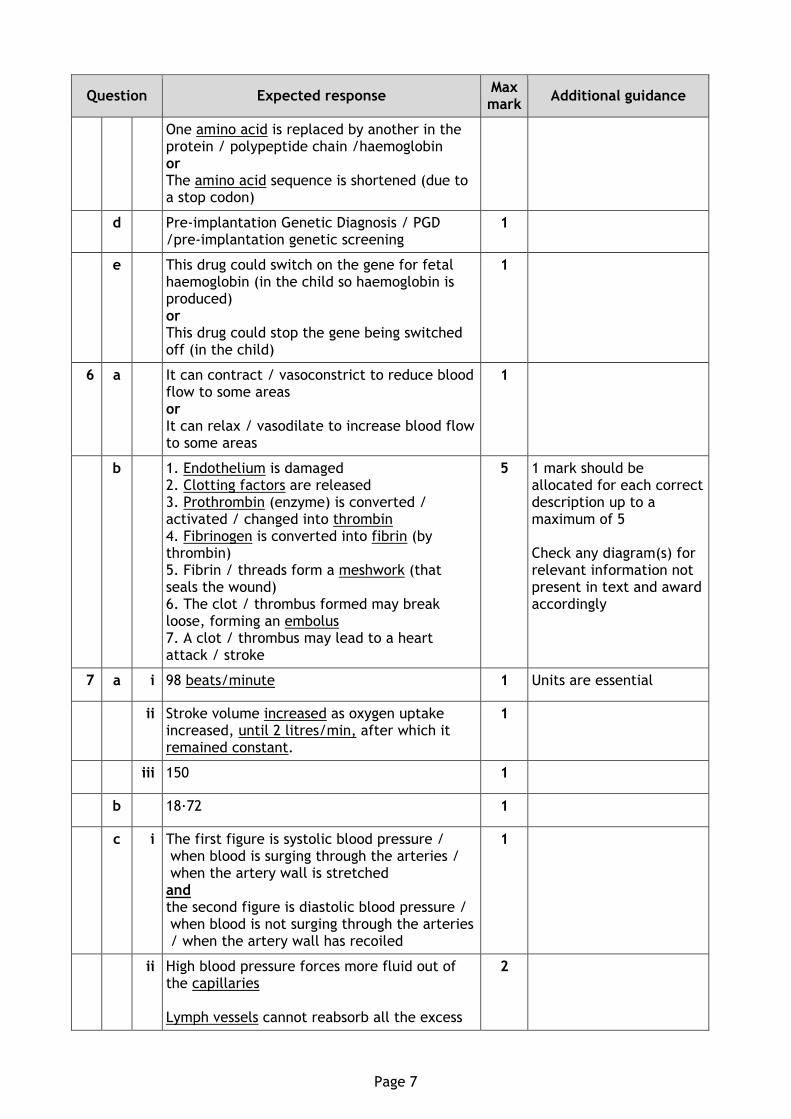
ii An incorrect amino acid is placed in the protein / polypeptide chain / haemoglobin or
1
Page 7
Question Expected response Max mark
Additional guidance
One amino acid is replaced by another in the protein / polypeptide chain /haemoglobin or The amino acid sequence is shortened (due to a stop codon)
d Pre-implantation Genetic Diagnosis / PGD /pre-implantation genetic screening
1
e This drug could switch on the gene for fetal haemoglobin (in the child so haemoglobin is produced) or This drug could stop the gene being switched off (in the child)
1
6 a It can contract / vasoconstrict to reduce blood flow to some areas or It can relax / vasodilate to increase blood flow to some areas
1
b 1. Endothelium is damaged2. Clotting factors are released 3. Prothrombin (enzyme) is converted / activated / changed into thrombin 4. Fibrinogen is converted into fibrin (by thrombin) 5. Fibrin / threads form a meshwork (that seals the wound) 6. The clot / thrombus formed may break loose, forming an embolus 7. A clot / thrombus may lead to a heart attack / stroke
5 1 mark should be allocated for each correct description up to a maximum of 5 Check any diagram(s) for relevant information not present in text and award accordingly
7 a i 98 beats/minute 1 Units are essential
ii Stroke volume increased as oxygen uptake increased, until 2 litres/min, after which it remained constant.
1
iii 150 1
b 18·72 1
c i The first figure is systolic blood pressure / when blood is surging through the arteries / when the artery wall is stretched and the second figure is diastolic blood pressure / when blood is not surging through the arteries / when the artery wall has recoiled
1
ii High blood pressure forces more fluid out of the capillaries Lymph vessels cannot reabsorb all the excess
2
Page 8
Question Expected response Max mark
Additional guidance
tissue fluid
8 a i A - Diabetic because blood glucose concentration increases faster / to a higher level / for a longer time or because blood glucose concentration does not return to normal (after 150 minutes) B - Non-diabetic because blood glucose increases slower / to a lower level / for a shorter time or because blood glucose concentration returns to normal (after 60 minutes)
1 Mark is awarded for the selection of the correct evidence to indicate a diabetic or non-diabetic individual
ii Blood glucose concentration increases for 60 minutes and then decreases
At least one blood glucose concentration given with units eg Start = 4.8 m mol/litre 60 minutes = 11.2 m mol/litre 150 minutes = 7.6 m mol/litre
2
b Type 1 – Insulin is not produced so blood glucose concentration cannot be controlled Type 2 - Insulin is produced but cells are less sensitive to insulin / have fewer insulin receptors / have developed insulin resistance
2
9 a i 1. As age increases, the frequency / number of cases of obesity increases 2. The frequency / number of cases is higher in 2012 (compared to 2003)
2
ii 1·536 million / 1 536 000 1
b Reduce their intake of fats / sugars /carbohydrates or exercise more/become more active
1
10 a 85·5 1
b 1. Each group has a similar gender balance2. Each group completed the same jigsaw puzzle 3. Each group contained children with similar (physical / mental) abilities 4. The investigation was carried out in the same environmental conditions / same room / same temperature / same time of day / no distractions were present
2 1 mark should be allocated for each correct description up to a maximum of 2
Page 9
Question Expected response Max mark
Additional guidance
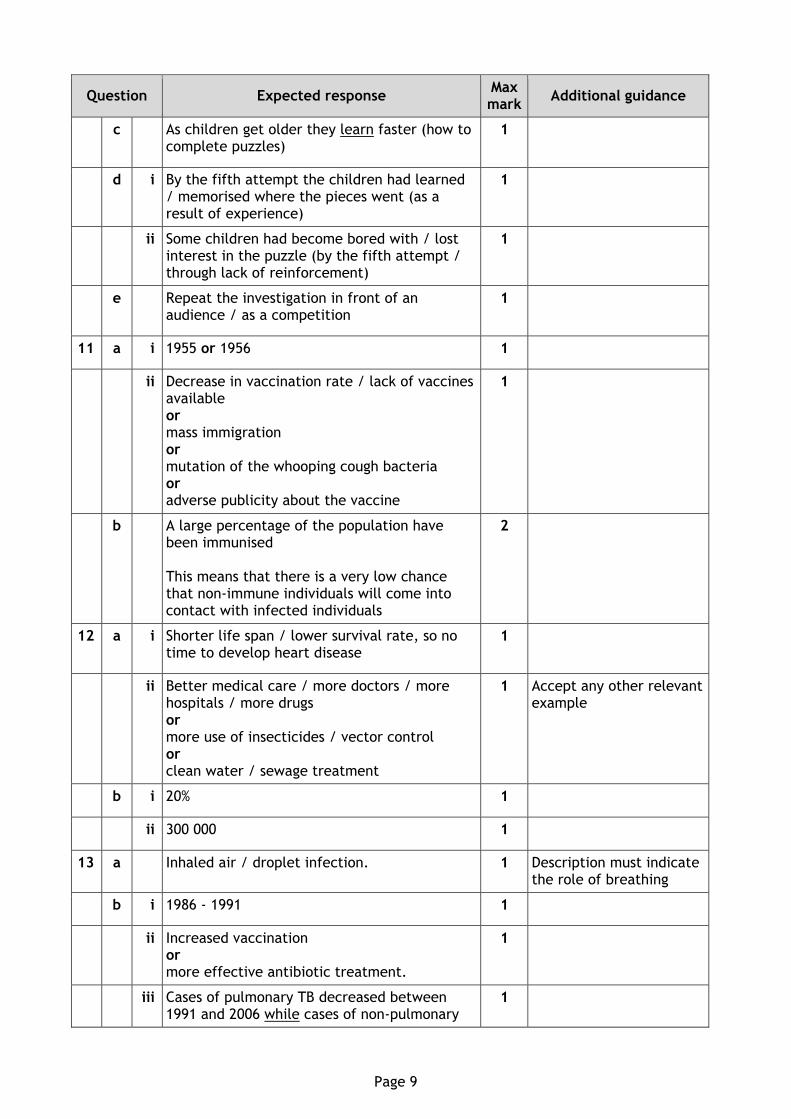
c As children get older they learn faster (how to complete puzzles)
1
d i By the fifth attempt the children had learned / memorised where the pieces went (as a result of experience)
1
ii Some children had become bored with / lost interest in the puzzle (by the fifth attempt / through lack of reinforcement)
1
e Repeat the investigation in front of an audience / as a competition
1
11 a i 1955 or 1956 1
ii Decrease in vaccination rate / lack of vaccines available or mass immigration or mutation of the whooping cough bacteria or adverse publicity about the vaccine
1
b A large percentage of the population have been immunised This means that there is a very low chance that non-immune individuals will come into contact with infected individuals
2
12 a i Shorter life span / lower survival rate, so no time to develop heart disease
1
ii Better medical care / more doctors / more hospitals / more drugs or more use of insecticides / vector control or clean water / sewage treatment
1 Accept any other relevant example
b i 20% 1
ii 300 000 1
13 a Inhaled air / droplet infection.
1 Description must indicate the role of breathing
b i 1986 - 1991 1
ii Increased vaccination or more effective antibiotic treatment.
1
iii Cases of pulmonary TB decreased between 1991 and 2006 while cases of non-pulmonary
1
Page 10
Question Expected response Max mark
Additional guidance
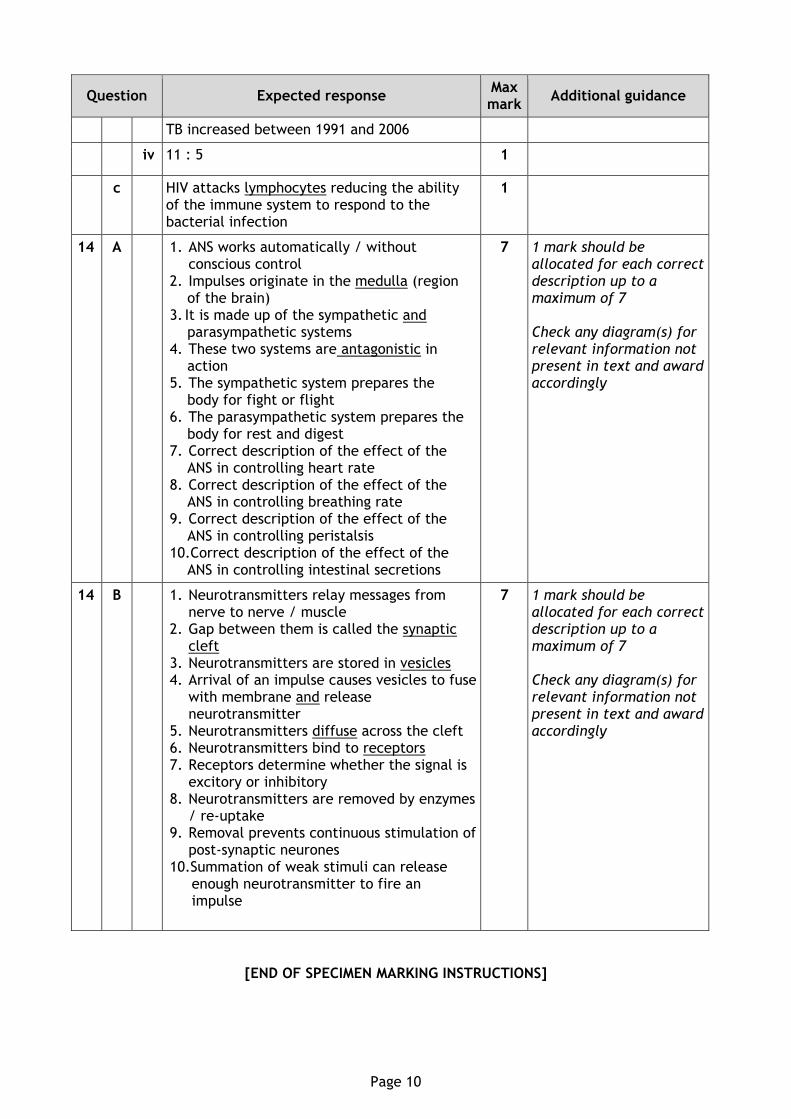
TB increased between 1991 and 2006
iv 11 : 5 1
c HIV attacks lymphocytes reducing the ability of the immune system to respond to the bacterial infection
1
14 A 1. ANS works automatically / without conscious control
2. Impulses originate in the medulla (region of the brain) 3. It is made up of the sympathetic and parasympathetic systems 4. These two systems are antagonistic in action 5. The sympathetic system prepares the body for fight or flight 6. The parasympathetic system prepares the body for rest and digest 7. Correct description of the effect of the ANS in controlling heart rate 8. Correct description of the effect of the ANS in controlling breathing rate 9. Correct description of the effect of the ANS in controlling peristalsis 10.Correct description of the effect of the ANS in controlling intestinal secretions
7 1 mark should be allocated for each correct description up to a maximum of 7 Check any diagram(s) for relevant information not present in text and award accordingly
14 B 1. Neurotransmitters relay messages from nerve to nerve / muscle
2. Gap between them is called the synaptic cleft
3. Neurotransmitters are stored in vesicles 4. Arrival of an impulse causes vesicles to fuse
with membrane and release neurotransmitter
5. Neurotransmitters diffuse across the cleft 6. Neurotransmitters bind to receptors 7. Receptors determine whether the signal is
excitory or inhibitory 8. Neurotransmitters are removed by enzymes
/ re-uptake 9. Removal prevents continuous stimulation of
post-synaptic neurones 10.Summation of weak stimuli can release enough neurotransmitter to fire an impulse
7 1 mark should be allocated for each correct description up to a maximum of 7 Check any diagram(s) for relevant information not present in text and award accordingly