Page 1
Higher Outcome 2
Higher Unit 1Higher Unit 1
What is a setRecognising a Function in various formatsComposite FunctionsExponential and Log Graphs
Connection between Radians and degrees & Exact valuesSolving Trig EquationsBasic Trig Identities
Exam Type Questions
Graph TransformationsTrig Graphs
Page 2
Higher Outcome 2
Sets & Functions
Notation & Terminology
SETS: A set is a collection of items which have some common property.
These items are called the members or elements of the set.
Sets can be described or listed using “curly bracket” notation.
Page 3
Higher Outcome 2
eg {colours in traffic lights}
eg {square nos. less than 30}
DESCRIPTION LIST
NB: Each of the above sets is finite because we can list every member
= {red, amber, green}
= { 0, 1, 4, 9, 16, 25}
Sets & FunctionsSets & Functions
Page 4
Higher Outcome 2
Sets & FunctionsSets & Functions
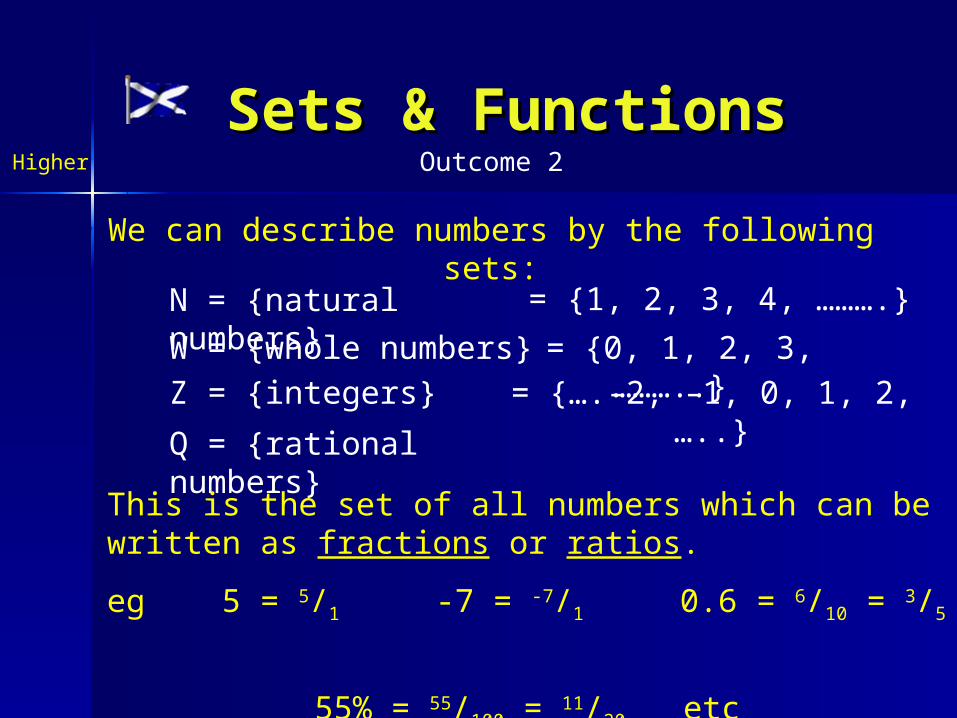
N = {natural numbers}
= {1, 2, 3, 4, ……….}
W = {whole numbers} = {0, 1, 2, 3, ………..}Z = {integers} = {….-2, -1, 0, 1, 2, …..}
Q = {rational numbers}
This is the set of all numbers which can be written as fractions or ratios.
eg 5 = 5/1 -7 = -7/1 0.6 = 6/10 = 3/5
55% = 55/100 = 11/20 etc
We can describe numbers by the following sets:
Page 5
Higher Outcome 2
R = {real numbers}This is all possible numbers. If we plotted values on a number line then each of the previous sets would leave gaps but the set of real numbers would give us a solid line.
We should also note that
N “fits inside” W
W “fits inside” Z
Z “fits inside” Q
Q “fits inside” R
Sets & FunctionsSets & Functions
Page 6
Higher Outcome 2
Sets & FunctionsSets & Functions
QZWN
When one set can fit inside another we say
that it is a subset of the other.
The members of R which are not inside Q are called irrational numbers. These cannot be expressed as
fractions and include , 2, 35 etc
R
Page 7
Higher Outcome 2
To show that a particular element/number belongs to a particular set we use the symbol
. eg 3 W but 0.9 Z
Examples
{ x W: x < 5 }= { 0, 1, 2, 3, 4 }
{ x Z: x -6 } = { -6, -5, -4, -3, -2, …….. }
{ x R: x2 = -4 } = { } or
This set has no elements and is called the empty set.
Sets & FunctionsSets & Functions
Page 8
Higher Outcome 2
If the first set is A and the second B then we often write
f: A B
Functions & Mappings
Defn: A function or mapping is a relationship between two sets in which each member of the first set is connected to exactly one member in the
second set.
The members of set A are usually referred to as the domain of the function (basically the starting values or even x-values) while the corresponding values or images come from set B and are called the range of the function (these are like y-values).
Page 9
Higher Outcome 2
Functions & MappingFunctions & Mapping
Functions can be illustrated in three ways:
1) by a formula.
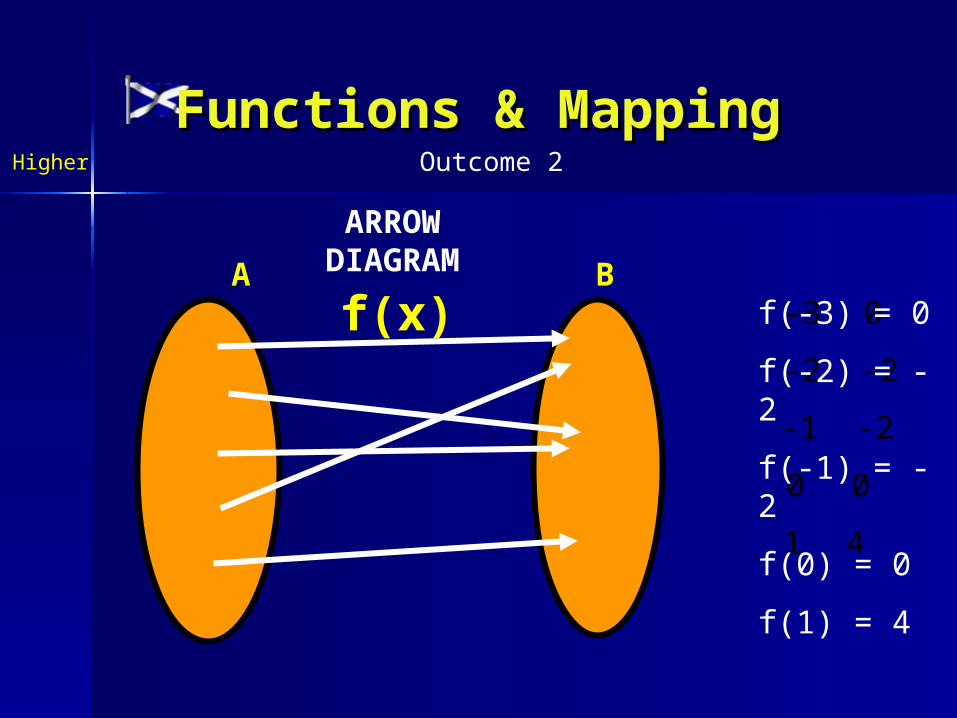
2) by arrow diagram.
3) by a graph (ie co-ordinate diagram).
ExampleSuppose that f: A B is defined by
f(x) = x2 + 3x where A = { -3, -2, -1, 0, 1}.FORMULA
then f(-3) = 0 , f(-2) = -2 , f(-1) = -2 , f(0) = 0 ,f(1) = 4
NB: B = {-2, 0, 4} = the range!
Page 10
Higher Outcome 2
0
-3
-2
-1
0
1
0
-2
-2
0
4
A B
ARROW DIAGRAM
Functions & MappingFunctions & Mapping
f(-3) = 0
f(-2) = -2
f(-1) = -2
f(0) = 0
f(1) = 4
f(x)
Page 11
Higher Outcome 2
Functions & GraphsFunctions & Graphs
In a GRAPH we get :
NB: This graph consists of 5 separate points. It is not a solid curve.
Page 12
Higher Outcome 2
Recognising FunctionsA B
a b c d
e
f
g
Not a function
two arrows leaving b!
A B
a bc d
e
f
g
YES
Functions & GraphsFunctions & Graphs
Page 13
Higher Outcome 2
Functions & GraphsFunctions & Graphs
A B
a b c d
e f g
Not a function - d unused!
A B
a bc d
e f g h
YES
Page 14
Higher Outcome 2
Functions & GraphsFunctions & Graphs
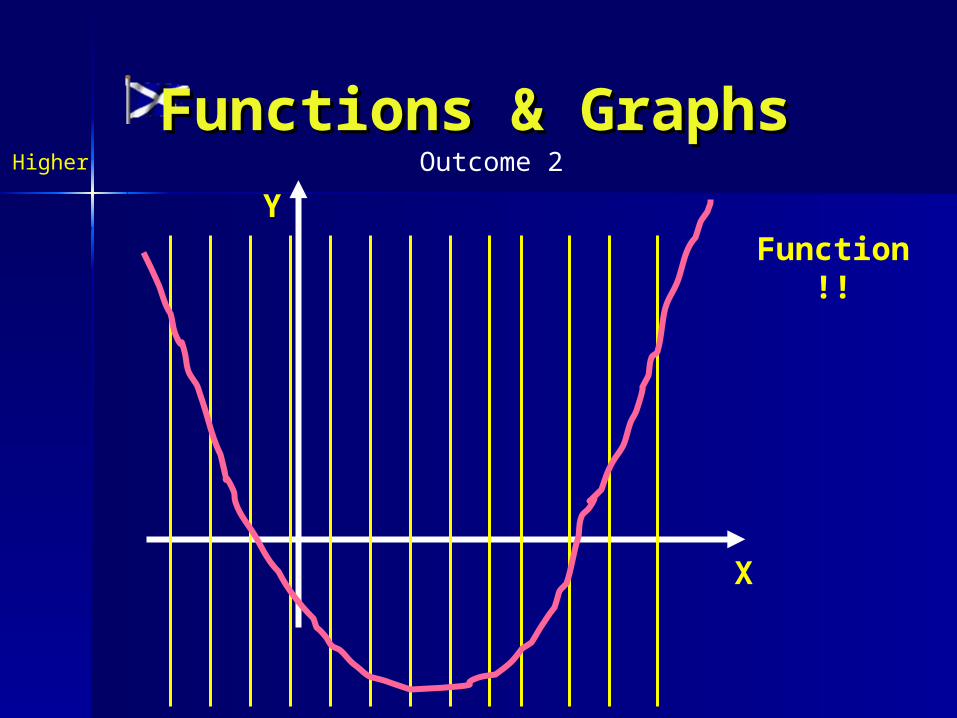
Recognising Functions from Graphs
If we have a function f: R R (R - real nos.) then every vertical line we could draw would cut
the graph exactly once!
This basically means that every x-value has one, and only one, corresponding y-value!
Page 15
Higher Outcome 2
Function & Graphs Function & Graphs
x
YFunction !
!
Page 16
Higher Outcome 2
x
YNot a
function !!
Cuts graph
more than once !
Function & GraphsFunction & Graphs
x must map to
one value of y
Page 17
Higher Outcome 2
Functions & GraphsFunctions & Graphs
X
Y Not a function !!
Cuts graph
more than once!
Page 18
Higher Outcome 2
X
YFunction !
!
Functions & GraphsFunctions & Graphs
Page 19
Higher Outcome 1
COMPOSITION OF FUNCTIONS
( or functions of functions )
Suppose that f and g are functions where
f:A B and g:B C
with f(x) = y and g(y) = z
where x A, y B and z C.
Suppose that h is a third function where
h:A C with h(x) = z .
Composite FunctionsComposite Functions
Page 20
Higher Outcome 1
Composite FunctionsComposite Functions
ieA B C
x y zf g
h
We can say that h(x) = g(f(x))
“function of a function”
Page 21
Higher Outcome 1
Composite FunctionsComposite Functionsf(2)=3x2 – 2 =4
g(4)=42 + 1 =17
f(5)=5x3-2 =13Example 1
Suppose that f(x) = 3x - 2 and g(x) = x2 +1
(a) g( f(2) ) = g(4) = 17
(b) f( g (2) ) = f(5) = 13
(c) f( f(1) ) = f(1) = 1
(d) g( g(5) ) = g(26)= 677
f(1)=3x1 - 2 =1
g(26)=262
+ 1 =677
g(2)=22 + 1 =5
f(1)=3x1 - 2 =1
g(5)=52 + 1 =26
Page 22
Higher Outcome 1
Suppose that f(x) = 3x - 2 and g(x) = x2 +1
Find formulae for (a) g(f(x)) (b) f(g(x)).
(a) g(f(x)) = g(3x-2)
= (3x-2)2 + 1
= 9x2 - 12x + 5
(b) f(g(x)) = f(x2 + 1) = 3(x2 + 1) - 2= 3x2 + 1
CHECK
g(f(2)) = 9 x 22 - 12 x 2 + 5
= 36 - 24 + 5 = 17
f(g(2)) = 3 x 22 + 1 = 13 As in Ex1
NB: g(f(x)) f(g(x)) in general.
Composite FunctionsComposite Functions
Page 23
Higher Outcome 1
Let h(x) = x - 3 , g(x) = x2 + 4 and k(x) = g(h(x)). If k(x) = 8 then find the value(s) of x.
k(x) = g(h(x))
= g(x - 3)
= (x - 3)2 + 4
= x2 - 6x + 13
Put x2 - 6x + 13 = 8
then x2 - 6x + 5 = 0
or (x - 5)(x - 1) = 0
So x = 1 or x = 5
CHECK g(h(5)) = g(2)= 22 + 4= 8
Composite FunctionsComposite Functions
Page 24
Higher Outcome 1
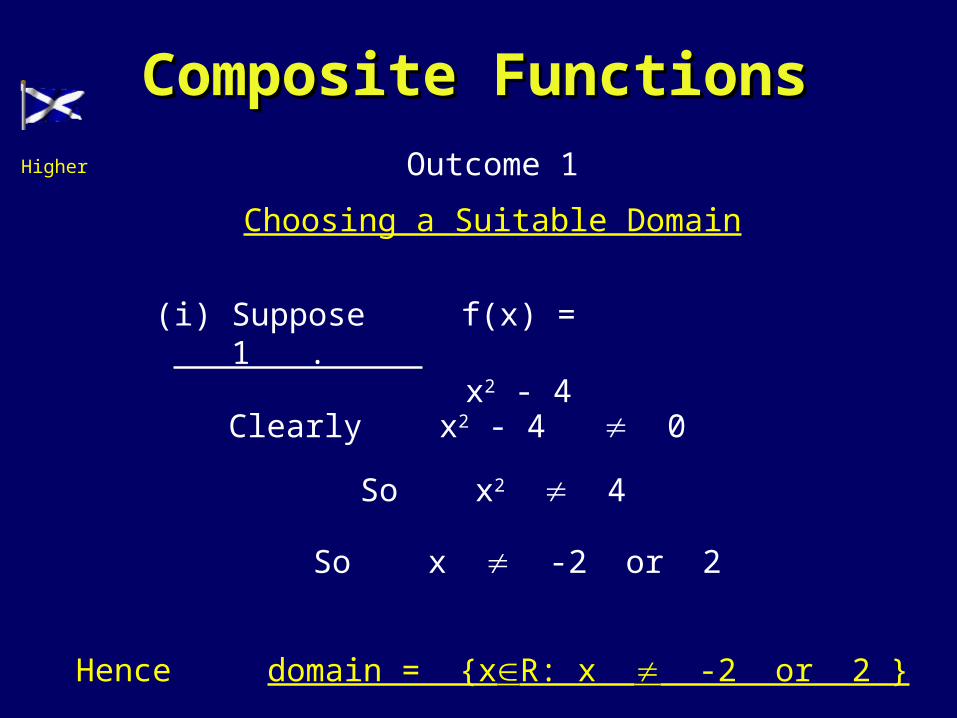
Choosing a Suitable Domain
(i) Suppose f(x) = 1 . x2 - 4
Clearly x2 - 4 0
So x2 4
So x -2 or 2
Hence domain = {xR: x -2 or 2 }
Composite FunctionsComposite Functions
Page 25
Higher Outcome 1
(ii) Suppose that g(x) = (x2 + 2x - 8)
We need (x2 + 2x - 8) 0
Suppose (x2 + 2x - 8) = 0
Then (x + 4)(x - 2) = 0
So x = -4 or x = 2
So domain = { xR: x -4 or x 2 }
Composite FunctionsComposite Functions
Check values below -4 , between -4 and 2, then above 2
x = -5
(-5 + 4)(-5 - 2) = positive
x = 0
(0 + 4)(0 - 2) =
negative
x = 3
(3 + 4)(3 - 2) =
positive
-4 2
Page 26
Higher Outcome 1
A function in the form f(x) = ax where a > 0, a ≠ 1
is called an exponential function to base a .
Exponential (to the power of) Graphs
Exponential Functions
Consider f(x) = 2x
x -3 -2 -1 0 1 2 3
f(x) 1 1/8 ¼ ½ 1 2 4 8
Page 27
Higher Outcome 1
The graph is like
y = 2x
(0,1) (1,2)
Major Points
(i) y = 2x passes through the points (0,1) & (1,2)
(ii) As x ∞ y ∞ however as x ∞ y 0 .
(iii) The graph shows a GROWTH function.
Graph
Page 28
Higher Outcome 1
ie
y -3 -2 -1 0 1 2 3
x 1/8 ¼ ½ 1 2 4 8
To obtain y from x we must ask the question
“What power of 2 gives us…?”
This is not practical to write in a formula so we say
y = log2x“the logarithm to base 2 of x”
or “log base 2 of x”
Log Graphs
Page 29
Higher Outcome 1
The graph is likey =
log2x
(1,0)
(2,1)
Major Points
(i) y = log2x passes through the points (1,0) & (2,1) .(ii) As x y but at a very slow rate and as x 0 y - .
NB: x > 0
Graph
Page 30
Higher Outcome 1
The graph of y = ax always passes through (0,1) & (1,a)
It looks like ..
x
Y
y = ax
(0,1)
(1,a)
Exponential (to the power of) Graphs
Page 31
Higher Outcome 1
The graph of y = logax always passes through (1,0) & (a,1)
It looks like ..
x
Y
y = logax
(1,0)
(a,1)
Log Graphs
Page 32
Higher Outcome 1
Graph Transformations
We will use the TI – 83 to investigate f(x) graphs of the form
1. f(x) ± k
2. f(x ± k)
3. -f(x)
4. f(-x)
5. kf(x)
6. f(kx)
Each moves the
Graph of f(x) in a certain
way !
Page 33
Higher Outcome 1
y = f(x) y = x2
y = x2-3
Mathematically
y = f(x) ± k
moves f(x) up or down
Depending on the value of k
+ k move up
- k move down
y = x2+ 1
y = f(x) ± k
Graph of f(x) ± k Transformations
Page 34
Higher Outcome 1
Graph of -f(x ± k) Transformations
y = f(x) y = x2 y = (x-1)2
y = (x+2)2
y = f(x ± k)
Mathematically
y = f(x ± k)
moves f(x) to the left or right
depending on the value of k
-k move right
+ k move left
Page 35
Higher Outcome 1
y = f(x) y = x2
y = -x2
Mathematically
y = –f(x)
reflected f(x) in the x - axis
y = -f(x)
Graph of -f(x) Transformations
Page 36
Higher Outcome 1
y = f(x) y = 2x + 3y = -(2x + 3)
Mathematically
y = –f(x)
reflected f(x) in the x - axis
y = -f(x)
Graph of -f(x) Transformations
Page 37
Higher Outcome 1
y = f(x) y = x3
y = -x3
Mathematically
y = –f(x)
reflected f(x) in the x - axis
y = -f(x)
Graph of -f(x) Transformations
Page 38
Higher Outcome 1
Graph of f(-x) Transformations
y = f(x) y = x + 2
y = -x + 2
Mathematically
y = f(-x)
reflected f(x) in the y - axis
y = f(-x)
Page 39
Higher Outcome 1
y = f(x) y = (x+2)2 y = (-x+2)2
Mathematically
y = f(-x)
reflected f(x) in the y - axis
y = f(-x)
Graph of f(-x) Transformations
Page 40
Higher Outcome 1
Graph of k f(x) Transformations
y = f(x) y = x2-1
y = 4(x2-1)
Mathematically
y = k f(x)
Multiply y coordinate by a factor of k
k > 1 (stretch in y-axis direction)
0 < k < 1 (squash in y-axis direction)
y = 0.25(x2-1)
y = k f(x)
Page 41
Higher Outcome 1
y = f(x) y = x2-1
y = -4(x2-1)
Mathematically
y = -k f(x)
k = -1 reflect graph in x-axis
k < -1 reflect f(x) in x-axis & multiply by a factor k (stretch in y-axis direction)
0 < k < -1 reflect f(x) in x-axis multiply by a factor k (squash in y-axis direction)
y = -0.25(x2-1)
y = k f(x)
Graph of -k f(x) Transformations
Page 42
Higher Outcome 1
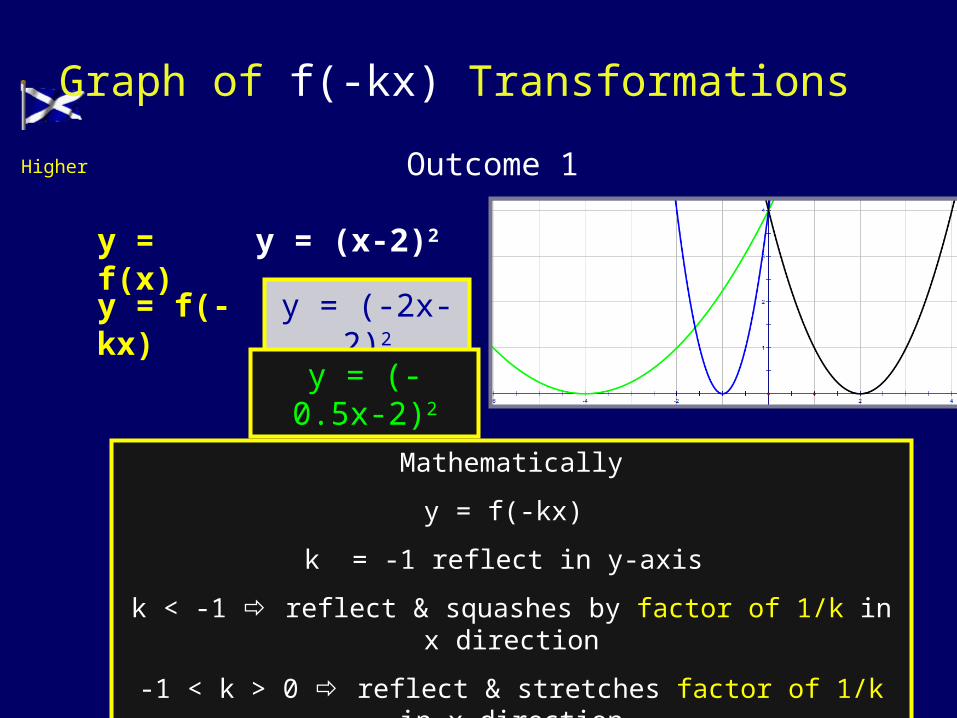
y = f(x) y = (x-2)2
y = (2x-2)2
Mathematically
y = f(kx)
Multiply x – coordinates by 1/k
k > 1 squashes by a factor of 1/k in the x-axis direction
k < 1 stretches by a factor of 1/k in the x-axis direction
y = (0.5x-2)2
y = f(kx)
Graph of f(kx) Transformations
Page 43
Higher Outcome 1
y = f(x) y = (x-2)2
y = (-2x-2)2
Mathematically
y = f(-kx)
k = -1 reflect in y-axis
k < -1 reflect & squashes by factor of 1/k in x direction
-1 < k > 0 reflect & stretches factor of 1/k in x direction
y = (-0.5x-2)2
y = f(-kx)
Graph of f(-kx) Transformations
Page 44
Higher Outcome 1
Trig Graphs
The same transformation rules
apply to the basic trig graphs.
NB: If f(x) =sinx then 3f(x) = 3sinx
and f(5x) = sin5x
Think about sin replacing f !
Also if g(x) = cosx then g(x) –4 = cosx –4
and g(x+90) = cos(x+90)
Think about cos replacing g !
Page 45
Higher Outcome 1
Sketch the graph of y = sinx - 2
If sinx = f(x) then sinx - 2 = f(x) - 2
So move the sinx graph 2 units down.
y = sinx - 2
Trig Graphs
Page 46
Higher Outcome 1
Sketch the graph of y = cos(x - 50)
If cosx = f(x) then cos(x - 50) = f(x- 50)So move the cosx graph 50 units right.
y = cos(x - 50)
Trig Graphs
Page 47
Higher Outcome 1
Trig Graphs
Sketch the graph of y = 3sinx
If sinx = f(x) then 3sinx = 3f(x)
So stretch the sinx graph 3 times vertically.
y = 3sinx
Page 48
Higher Outcome 1
Trig Graphs
Sketch the graph of y = cos4x
If cosx = f(x) then cos4x = f(4x)
So squash the cosx graph to 1/4 size horizontally
y = cos4x
Page 49
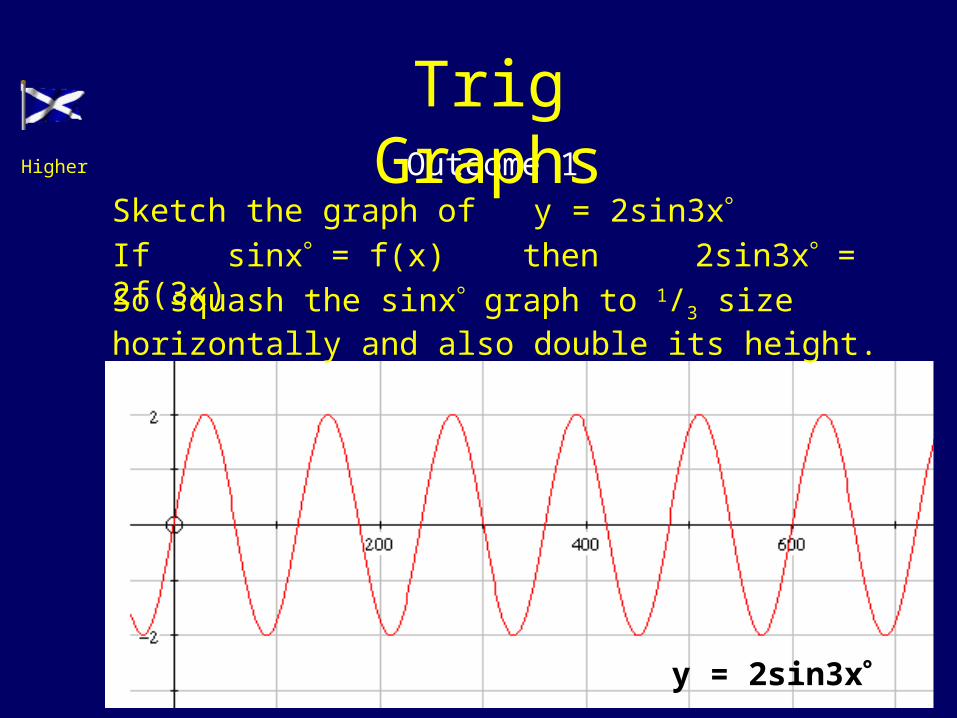
Higher Outcome 1
Trig Graphs
Sketch the graph of y = 2sin3xIf sinx = f(x) then 2sin3x = 2f(3x)So squash the sinx graph to 1/3 size horizontally and also double its height.
y = 2sin3x
Page 50
Higher Outcome 1
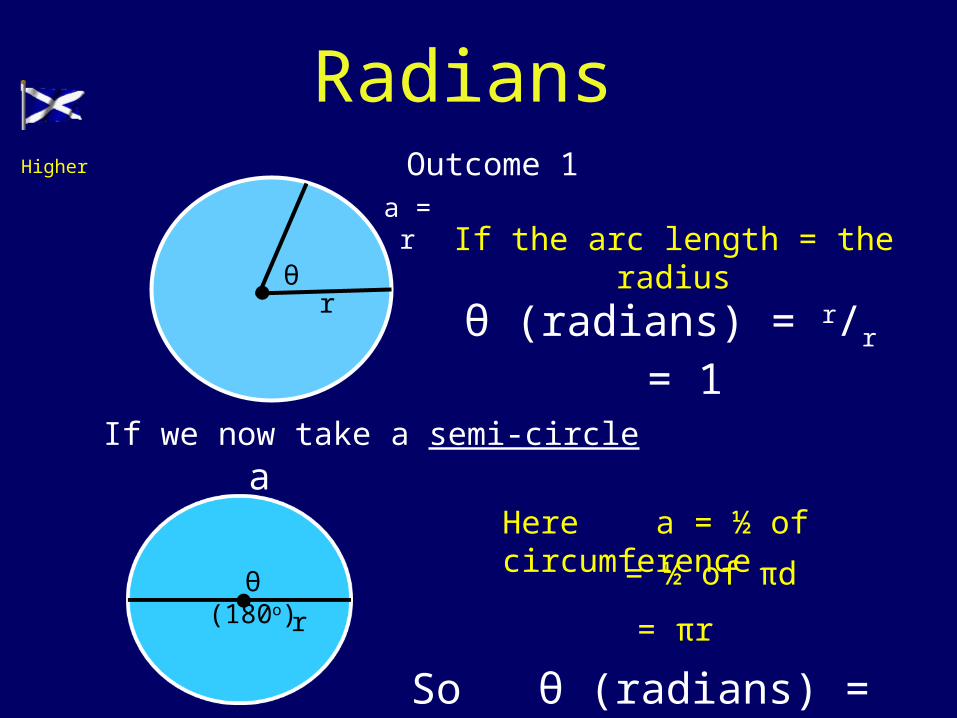
Radians
Radian measure is an alternative to degrees and is based upon the ratio of
arc length radius
rθ
a
θ- theta
θ(radians) = ar
Page 51
Higher Outcome 1
If the arc length = the radiusθ
r
a = r
θ (radians) = r/r = 1
If we now take a semi-circle
θ (180o)
r
aHere a = ½ of circumference= ½ of πd
= πr
So θ (radians) = πr /r = π
Radians
Page 52
Higher Outcome 1
Converting
degrees radians
÷180 then X π
÷ πthen x 180
Page 53
Higher Outcome 1
Since we have a semi-circle the angle must be 180o.
We now get a simple connection between degrees and radians. π (radians) =
180oThis now gives us 2π = 360o
π /2 = 90o
π /3 = 60o
3π /2 = 270o
2π /3 = 120o
π /4 = 45o 3π /4 = 135o
π /6 = 30o 5π /6 = 150o
NB: Radians are usually expressed as fractional multiples of π.
Radians
Page 54
Higher Outcome 1
Ex1 72o =72/180 X π = 2π /5
Ex2 330o =330/180 X π =11 π /6
Ex3 2π /9 =2π /9 ÷ π x 180o = 2/9 X 180o = 40o
Ex4 23π/18 = 23π /18 ÷ π x 180o
= 23/18 X 180o = 230o
Converting
Page 55
Higher Outcome 1
22
2
60º
60º60º160º
230º3
This triangle will provide exact values for
sin, cos and tan 30º and 60º
Exact Values
Some special values of Sin, Cos and Tan are useful left as fractions, We call these exact values
Page 56
Higher Outcome 1
x 0º 30º 45º 60º 90º
Sin xº
Cos xº
Tan xº
½
½
3
3
2
3
20
1
0
1
0
Exact Values
1
3
Page 57
Higher Outcome 1
Exact Values
1 1 45º
45º
2
Consider the square with sides 1 unit
11
We are now in a position to calculate exact values for sin, cos and tan of 45o
Page 58
Higher Outcome 1
x 0º 30º 45º 60º 90º
Sin xº
Cos xº
Tan xº
½
½
3
3
2
3
20
1
0
1
0
Exact Values
1
3
1 2
1 2
1
Page 59
Higher Outcome 1
Exact value table
and quadrant rules.
tan150o
(Q2 so neg)
= tan(180-30)
o
= -tan30o = -1/√3
cos300o
(Q4 so pos)
= cos(360-60)
o
= cos60o
= 1/2
sin120o
(Q2 so pos)
= sin(180-60) o = sin60o = √ 3/2
tan300o
(Q4 so neg)
= tan(360-60)o
= -tan60o = - √ 3
Page 60
Higher Outcome 1
Find the exact value of cos2(5π/6) – sin2(π/6)
cos(5π/6) =
cos150o
(Q2 so neg)
= cos(180-30)o
= -cos30o = - √3 /2
sin(π/6) = sin30o= 1/2
cos2(5π/6) – sin2(π/6) = (- √3 /2)2 – (1/2)2= ¾ - 1/4 = 1/2
Exact value table
and quadrant rules.
Page 61
Higher Outcome 1
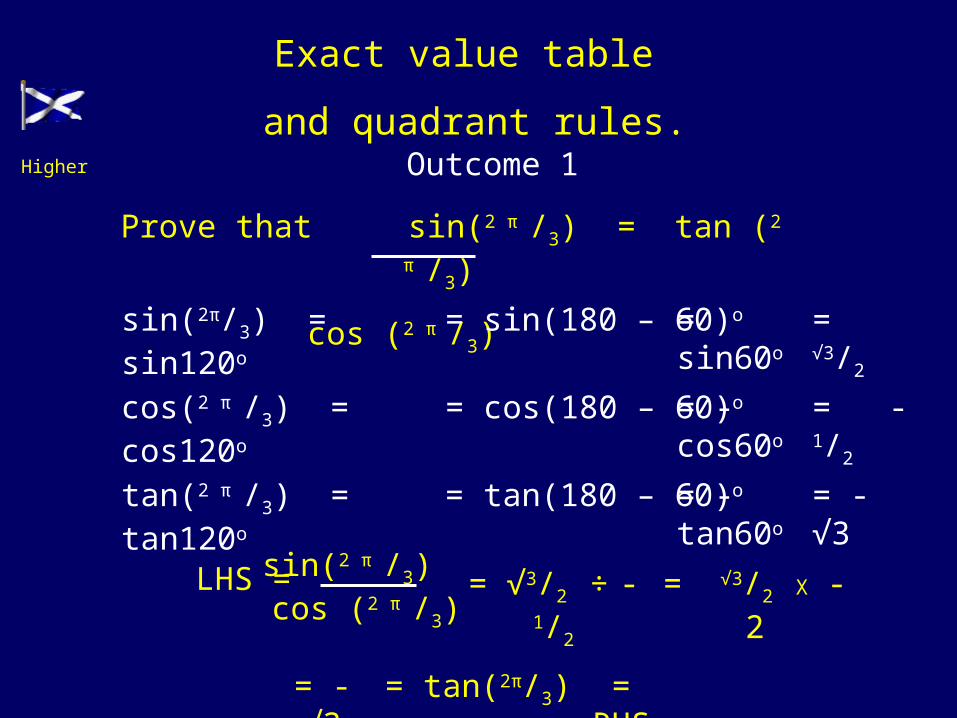
Exact value table
and quadrant rules.
Prove that sin(2 π /3) = tan (2 π /3)
cos (2 π /3) sin(2π/3) = sin120o = sin(180 – 60)o=
sin60o
= √3/2
cos(2 π /3) = cos120o
tan(2 π /3) = tan120o
= cos(180 – 60)o
= tan(180 – 60)o
= -cos60o
= -tan60o
= -1/2
= - √3
LHS =sin(2 π /3) cos (2 π /3)
= √3/2 ÷ -1/2 = √3/2 X -2
= - √3 = tan(2π/3) = RHS
Page 62
Higher Outcome 2
Solving Trig Equations Solving Trig Equations
All +veSin +ve
Tan +ve Cos +ve
180o - xo
180o + xo 360o - xo
1 2 3 4
Page 63
Higher Outcome 2
Solving Trig Equations
Example 1 Type 1:
Solving the equation sin xo = 0.5 in the range 0o to 360o
Graphically what are we
trying to solve
xo = sin-1(0.5)
xo = 30o
There is another solution
xo = 150o
(180o – 30o = 150o)
sin xo = (0.5)
1 2 3 4
C
AS
T0o180
o
270o
90o
3
2
2
Page 64
Higher Outcome 2
Solving Trig Equations
Example 2 :
Solving the equation cos xo - 0.625 = 0 in the range 0o to 360o
Graphically what are we
trying to solve
cos xo = 0.625
xo = 51.3o
(360o - 53.1o = 308.7o)
xo = cos -1 (0.625)
There is another solution
1 2 3 4xo = 308.7o
C
AS
T0o180
o
270o
90o
3
2
2
Page 65
Higher Outcome 2
Solving Trig Equations
Example 3 :
Solving the equation tan xo – 2 = 0 in the range 0o to 360o
Graphically what are we
trying to solve
tan xo = 2
xo = 63.4o
x = 180o + 63.4o = 243.4o
xo = tan -1(2)
There is another solution
1 2 3 4
C
AS
T0o180
o
270o
90o
3
2
2
Page 66
Higher Outcome 2
Solving Trig Equations
Example 4 Type 2 :
Solving the equation sin 2xo + 0.6 = 0 in the range 0o to 360o
Graphically what are we
trying to solve
2xo = sin-1(0.6)
2xo = 217o , 323o
577o , 683o ......
sin 2xo = (-0.6)
xo = 108.5o , 161.5o
288.5o , 341.5o
C
AS
T0o180
o
270o
90o
3
2
2
2xo = 37o ( always 1st Q First)
÷2
Page 67
Higher Outcome 2
created by Mr. Laffertycreated by Mr. Lafferty
Solving Trig EquationsGraphically what are we
trying to solve
sin (2x +30o) = √3 ÷ 2
2xo - 30o = 60o , 120o ,420o , 480o .........
2sin (2x + 30o) = √3
xo = 45o , 75o
225o , 265o
2x - 30o = sin-1(√3 ÷ 2)
Example 5 Type 3 :
Solving the equation 2sin (2xo - 30o) - √3 = 0 in the range 0o to 360o
C
AS
T0o180
o
270o
90o
3
2
2
2xo = 90o , 150o ,450o , 530o .........
÷2
Page 68
Higher Outcome 2
created by Mr. Laffertycreated by Mr. Lafferty
Solving Trig Equations
Example 5 Type 4 :
Solving the equation cos2x = 1 in the range 0o to 360o
Graphically what are we
trying to solve
cos xo = ± 1
cos xo = 1
cos2 xo = 1
xo = 0o and 360o
C
AS
T0o180
o
270o
90o
3
2
2
cos xo = -1xo = 180o
Page 69
Higher Outcome 2
Example 6 Type 5 : Solving the equation 3sin2x + 2sin x - 1 = 0 in the range 0o to 360o
Solving Trig Equations
3x – 1 = 0
xo = 19.5o and 160.5o
xo = 90o
Let x = sin x
We have 3x2 + 2x - 1 = 0
(3x – 1)(x + 1) = 0Factorise
x = 1/3
x – 1 = 0x = 1sin x =
1/3sin x = 1
C
AS
T0o180
o
270o
90o
3
2
2
C
AS
T0o180
o
270o
90o
3
2
2
Page 70
Higher Outcome 1
An identity is a statement which is true for all values.
eg 3x(x + 4) = 3x2 + 12x
eg (a + b)(a – b) = a2 – b2
Trig Identities
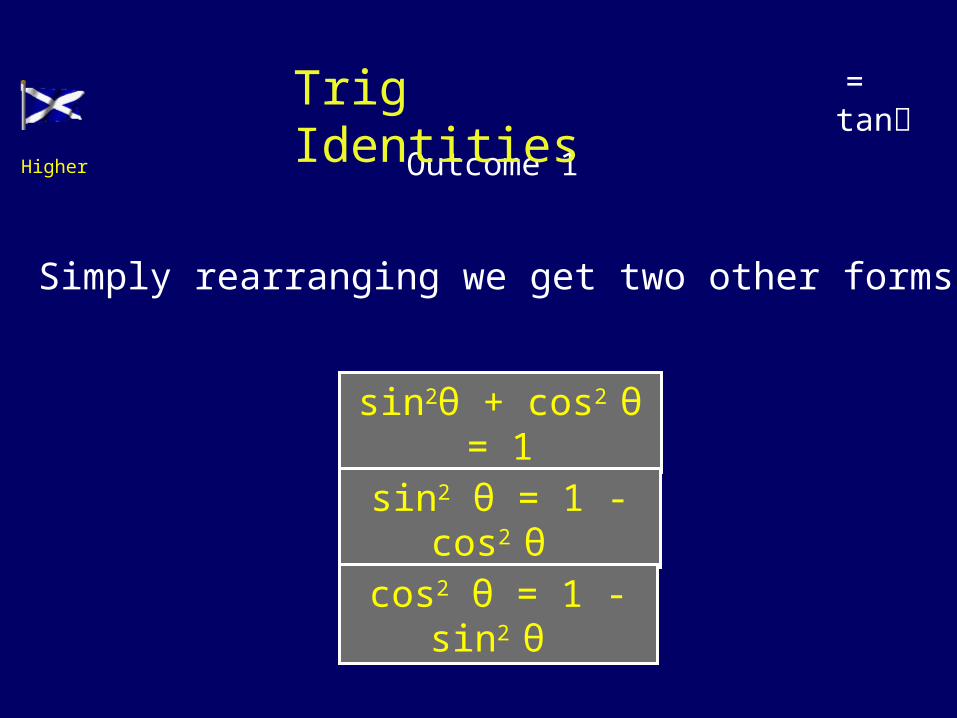
(1) sin2θ + cos2 θ = 1
(2) sin θ = tan θ cos θ θ ≠ an odd multiple of π/2 or 90°.
Trig Identities
Page 71
Higher Outcome 1
Reason
θo
c
b
a
a2 +b2 = c2
sinθo = a/c
cosθo = b/c
(1) sin2θo + cos2 θo =
Trig Identities
2 2
2 2
a bc c
2 2
2
a bc
2
2 1cc
Page 72
Higher Outcome 1
= tan
sin2θ + cos2 θ = 1
sin2 θ = 1 - cos2
θ cos2 θ = 1 - sin2
θ
Simply rearranging we get two other forms
Trig Identities
Page 73
Higher Outcome 1
Example1 sin θ = 5/13 where 0 < θ < π/2
Find the exact values of cos θ and tan θ .
cos2 θ = 1 - sin2 θ
= 1 – (5/13)2
= 1 – 25/169= 144/169
cos θ = √(144/169)
= 12/13 or -12/13
Since θ is between 0 < θ < π/2
then cos θ > 0
So cos θ = 12/13
tan θ = sinθ cos θ
= 5/13 ÷ 12/13
= 5/13 X 13/12
tan θ = 5/12
Trig Identities
Page 74
Higher Outcome 1
Given that cos θ = -2/ √ 5 where π< θ < 3 π /2Find sin θ and tan θ.
sin2 θ = 1 - cos2 θ
= 1 – (-2/ √
5 )2
= 1 – 4/5
= 1/5
sin θ = √(1/5)
= 1/ √ 5 or - 1/ √ 5
Since θ is between π< θ < 3 π /2
sinθ < 0
Hence sinθ = - 1/√5
tan θ = sinθ cos θ
= - 1/ √ 5 ÷ -2/ √
5 = - 1/ √ 5 X - √5 /2
Hence tan θ = 1/2
Trig Identities
Page 75
Graphs & Functions
Strategies
Higher Maths
Click to start
Page 76
Graphs & Functions Higher
Graphs & Functons
The following questions are on
Non-calculator questions will be indicated
Click to continue
You will need a pencil, paper, ruler and rubber.
Page 77
Hint
QuitQuitPrevious Next
The diagram shows the graph of a function f.
f has a minimum turning point at (0, -3) and a
point of inflexion at (-4, 2).
a) sketch the graph of y = f(-x).
b) On the same diagram, sketch the graph of y = 2f(-x)
Graphs & Functions Higher
a) Reflect across the y axis
b) Now scale by 2 in the y direction-1 3 4
2
y = f(-x)
-3
y
x
4
y = 2f(-x)
-6
Page 78
Hint
QuitQuitPrevious Next
Graphs & Functions Higher
The diagram shows a sketch of part of
the graph of a trigonometric function
whose equation is of the form
Determine the values of a, b and c
sin( )y a bx c
a is the amplitude: a = 4
b is the number of waves in 2 b = 2
c is where the wave is centred vertically c = 1
2a
1 in
2 in 2
1
Page 79
Hint
QuitQuitPrevious Next
Graphs & Functions Higher
Functions and are defined on suitable domains.
a) Find an expression for h(x) where h(x) = f(g(x)).
b) Write down any restrictions on the domain of h.
1( )
4f x
x
( ) 2 3g x x
( ( )) (2 3)f g x f x a)1
2 3 4x
1
( )2 1
h xx
b) 2 1 0x 1
2x
Page 80
(2, 1)
(2, -1)
(2, 1)
5
y=f(x)
y= -f(x)
y= 10 - f(x)
Hint
QuitQuitPrevious Next
Graphs & Functions Higher
a) Express in the form
b) On the same diagram sketch
i) the graph of
ii) the graph of
c) Find the range of values of x for
which is positive
2( ) 4 5f x x x 2( )x a b
( )y f x
10 ( )y f x
10 ( )f x
a) 2( 2) 4 5x 2( 2) 4 5x 2( 2) 1x
b)
c) Solve:210 ( 2) 1 0x
2( 2) 9x ( 2) 3x 1 or 5x
10 - f(x) is positive for -1 < x < 5
Page 81
Hint
QuitQuitPrevious Next
Graphs & Functions Higher
The graph of a function f intersects the x-axis at (–a, 0)
and (e, 0) as shown.
There is a point of inflexion at (0, b) and a maximum turning
point at (c, d).
Sketch the graph of the derived function f
m is + m is + m is -
f(x)
Page 82
Hint
QuitQuitPrevious Next
Graphs & Functions Higher
Functions f and g are defined on suitable domains by and
a) Find expressions for:
i)
ii)
b) Solve
( ) sin( )f x x ( ) 2g x x
( ( ))f g x
( ( ))g f x
2 ( ( )) ( ( )) 0 360f g x g f x for x
( ( )) (2 )f g x f xa) sin 2x ( ( )) (sin )g f x g x 2sin x
b) 2sin 2 2sinx x sin 2 sin 0x x
2sin cos sin 0x x x sin (2cos 1) 0x x 1
or2
sin 0 cosx x 0 , 180 , 360x 60 , 300x
Page 83
Hint
QuitQuitPrevious Next
Graphs & Functions Higher
The diagram shows the graphs of two quadratic
functions
Both graphs have a minimum turning point at (3, 2).
Sketch the graph of
and on the same diagram
sketch the graph of
and( ) ( )y f x y g x
( )y f x
( )y g x
y=g(x)
y=f(x)
Page 84
Hint
QuitQuitPrevious Next
Graphs & Functions Higher
Functions
are defined on a suitable set of real numbers.
a) Find expressions for
b) i) Show that
ii) Find a similar expression for
and hence solve the equation
4and( ) sin , ( ) cos ( )f x x g x x h x x
( ( ))f h x ( ( ))g h x
1 1
2 2( ( )) sin cos f h x x x
( ( ))g h x
for( ( )) ( ( )) 1 0 2f h x g h x x
4( ( )) ( )f h x f x a) 4
sin( )x 4
( ( )) cos( )g h x x
sin cos4 4 4
sin( ) sin cos xx x b) Now use exact values
Repeat for ii)
equation reduces to2
sin 12
x 2 1sin
2 2x
3,
4 4x
Page 85
Hint
QuitQuitPrevious Next
Graphs & Functions Higher
A sketch of the graph of y = f(x) where is shown.
The graph has a maximum at A and a minimum at B(3, 0)
a) Find the co-ordinates of the turning point at A.
b) Hence, sketch the graph of
Indicate the co-ordinates of the turning points. There is no need to
calculate the co-ordinates of the points of intersection with the axes.
c) Write down the range of values of k for which g(x) = k has 3 real roots.
3 2( ) 6 9f x x x x
( ) ( 2) 4g x f x
a) Differentiate 2( ) 3 12 9f x x x for SP, f(x) = 0 1 3x or x
when x = 1 4y t.p. at A is: (1, 4)
b) Graph is moved 2 units to the left, and 4 units up(3, 0) (1, 4)
(1, 4) ( 1, 8)
t.p.’s are:
c) For 3 real roots, line y = k has to cut graph at 3 points
from the graph, k 4
Page 86
Hint
QuitQuitPrevious Next
Graphs & Functions Higher
3( ) 3 ( ) , 0x
f x x and g x x
a) Find
b) If find in its simplest form.
( ) where ( ) ( ( ))p x p x f g x
3
3( ) , 3
xq x x
( ( ))p q x
3( ) ( ( ))x
p x f g x f
a) 33
x 3 3x
x
3( 1)x
x
b)
33 1
3333
3
( ( )) x
xx
p q x p
9 3
33 3x x
9 3(3 ) 3
3 3
x x
x
3 3
3 3
x x
x
x
Page 87
Hint
QuitQuitPrevious Next
Graphs & Functions Higher
Part of the graph of is shown in the diagram.
On separate diagrams sketch the graph of
a) b)
Indicate on each graph the images of O, A, B, C, and D.
( )y f x
( 1)y f x 2 ( )y f x
a)
b)
graph moves to the left 1 unit
graph is reflected in the x axis
graph is then scaled 2 units in the y direction
Page 88
Hint
QuitQuitPrevious Next
Graphs & Functions Higher
Functions f and g are defined on the set of real numbers by
a) Find formulae for
i) ii)
b) The function h is defined by
Show that and sketch the graph of h.
c) Find the area enclosed between this graph and the x-axis.
2( ) 1 and ( )f x x g x x
( ( ))f g x ( ( ))g f x
( ) ( ( )) ( ( ))h x f g x g f x
2( ) 2 2h x x x
a)
b)
2 2( ( )) ( ) 1f g x f x x 2( ( )) ( 1) 1g f x g x x
22( ) 1 1h x x x 2 2( ) 1 2 1h x x x x 22 2x x
c) Graph cuts x axis at 0 and 1 Now evaluate1 2
02 2x x dx
2unit
1
3Area
Page 89
Hint
QuitQuitPrevious Next
Graphs & Functions Higher
The functions f and g are defined on a suitable domain by
a) Find an expression for b) Factorise
2 2( ) 1 and ( ) 2f x x g x x
( ( ))f g x ( ( ))f g x
a) 22 2( ( )) ( 2) 2 1f g x f x x
2 22 1 2 1x x Difference of 2 squares
Simplify 2 23 1x x
b)
Page 90
You have completed all 13 questions in this section
Back to startQuitQuitPrevious
Graphs & Functions Higher
Page 91
30° 45° 60°
sin
cos
tan 1
6
4
3
1
2
1
23
2
3
2
1
21
21
3 3
Table of exact values
Previous
Graphs & Functions Higher