August 6, 1999 Highlights World Oil Markets/Prices Prices. World oil prices for the remainder of 1999 and all of 2000 are now forecasted to be $2-$3 per barrel higher than they were in last month's forecast (Figure 1). This reflects a change in our assumptions concerning OPEC crude oil production. Previously, we had expected compliance with OPEC agreed cuts to peak in May or June 1999, before falling as higher prices triggered more production. Although we still expect this to occur, we have delayed the timing and are now forecasting that OPEC compliance will be relatively strong throughout the summer, before declining much more gradually than we had earlier forecasted. Increased compliance with cuts in OPEC production will not only keep prices from falling in the near-term but they should also reduce inventories, thus putting pressure on prices to remain at current levels, or even increase, next year. Prices are expected to stay around $18.50 per barrel (the average price paid for imported crude oil by U.S. refiners) for the remainder of 1999 (which would translate into a WTI crude price of about $20.50-$21.00 per barrel). Then, throughout most of 2000, monthly world oil prices are expected to be between $18.50-$19.00 per barrel (which would translate into a WTI crude price of about $20.50-$21.50 per barrel. Our normal uncertainty range for crude oil prices suggest that expected end-2000 prices would be within about $3-$4 of the $19.00 per barrel level with a high degree of probability (Figure 2). Demand. EIA estimates that world oil demand will grow by about 1.1 million barrels per day in 1999, and by another 1.7 million barrels per day in 2000 (Figure 3 and Table 3), essentially unchanged from last month's forecast. This assumes that overall Asian oil demand begins recovering this year from the sharp slowdown seen in 1998 and the recovery continues through 2000. However, it is not expected that petroleum demand growth in Asia will return to rates seen prior to the recent regional economic crisis until at least sometime after 2000. Supply. By our calculations, OPEC compliance with the previous 3 agreements (the one on March 23, 1999 and the two in 1998) will peak at about 81-82 percent of the total 4.3 million barrels per day of agreed OPEC cuts in the 2nd and 3rd quarters of 1999, before gradually declining in the 4th quarter. As higher prices increase the incentive for countries to increase production, OPEC compliance is expected to decline throughout 2000. While EIA is not forecasting the outcome of either the September 1999 or March
Transcript
August 6, 1999
Highlights
World Oil Markets/Prices
Prices. World oil prices for the remainder of 1999 and all of 2000 are now forecasted tobe $2-$3 per barrel higher than they were in last month's forecast (Figure 1). This reflectsa change in our assumptions concerning OPEC crude oil production. Previously, wehad expected compliance with OPEC agreed cuts to peak in May or June 1999, beforefalling as higher prices triggered more production. Although we still expect this tooccur, we have delayed the timing and are now forecasting that OPEC compliance willbe relatively strong throughout the summer, before declining much more graduallythan we had earlier forecasted. Increased compliance with cuts in OPEC production willnot only keep prices from falling in the near-term but they should also reduceinventories, thus putting pressure on prices to remain at current levels, or even increase,next year. Prices are expected to stay around $18.50 per barrel (the average price paidfor imported crude oil by U.S. refiners) for the remainder of 1999 (which wouldtranslate into a WTI crude price of about $20.50-$21.00 per barrel). Then, throughoutmost of 2000, monthly world oil prices are expected to be between $18.50-$19.00 perbarrel (which would translate into a WTI crude price of about $20.50-$21.50 per barrel.Our normal uncertainty range for crude oil prices suggest that expected end-2000 priceswould be within about $3-$4 of the $19.00 per barrel level with a high degree ofprobability (Figure 2).
Demand. EIA estimates that world oil demand will grow by about 1.1 million barrelsper day in 1999, and by another 1.7 million barrels per day in 2000 (Figure 3 and Table3), essentially unchanged from last month's forecast. This assumes that overall Asian oildemand begins recovering this year from the sharp slowdown seen in 1998 and therecovery continues through 2000. However, it is not expected that petroleum demandgrowth in Asia will return to rates seen prior to the recent regional economic crisis untilat least sometime after 2000.
Supply. By our calculations, OPEC compliance with the previous 3 agreements (the oneon March 23, 1999 and the two in 1998) will peak at about 81-82 percent of the total 4.3million barrels per day of agreed OPEC cuts in the 2nd and 3rd quarters of 1999, beforegradually declining in the 4th quarter. As higher prices increase the incentive forcountries to increase production, OPEC compliance is expected to decline throughout2000. While EIA is not forecasting the outcome of either the September 1999 or March
0
5
10
15
20
25
(Current vs Previous Outlook)
1998 1999 20001997Jan Jan Jan JanJul Jul Jul Jul
Sources: History: EIA; Projections: Short-Term Energy Outlook, August 1999
Figure 3. World Oil DemandFigure 3. World Oil Demand(Change from Year Ago)
Sources: History: EIA; Projections: Short-Term Energy Outlook, August 1999
2000 OPEC ministerial meetings, our forecast does call for increasing OPEC productionbeginning in the fourth quarter of 1999. Iraqi oil production is expected to increase to 3million barrels per day by the second half of 2000.
Non-OPEC production is expected to remain relatively flat in 1999, mainly as a result ofreduced development expenditures engendered by very low oil prices in 1998 and early1999. However, EIA is projecting that non-OPEC oil production will increase in 2000 ashigher oil prices counteract some of the same forces that caused oil production to lag in1999 (Figure 4).
U.S. Petroleum Supply
Average domestic oil production is expected to decrease by 234,000 barrels per day, or3.74 percent, in 1999 to a level of 6.02 million barrels of oil per day. For 2000, a 1.11-percent decline is expected, which results in a production rate of 5.95 million barrels ofoil per day average for the year. The projected rate of decline for domestic production isnot as steep in this report as in the previous Outlook since our higher projections forcrude oil prices should lead to gains in exploration, drilling, and production (Figure 5).
Lower-48 States oil production is expected to decrease by 136,000 barrels per day to arate of 4.94 million barrels per day in 1999 followed by an increase of 48,000 barrels perday in 2000. Oil production from the Mars, Ram Powell, Auger, Troika, Ursa, Diana-Hoover and Baldpate Federal Offshore fields is expected to account for about 11.46percent of the lower-48 oil production by the 4th quarter of 2000.
Oil production from Alaska is expected to decrease by 8.03 percent in 1999 and again by10.70 percent in 2000. A substantial portion of the oil production from Alaska comesfrom the giant Prudhoe Bay Field. Other than routine maintenance, no majorinvestments are planned for this field during the forecast period. Therefore, the field isexpected to follow a steeper decline during this period. Oil production from recentdiscoveries, such as Sambuca and Midnight Sun, is expected to partially offset thedecline in oil production from the Prudhoe Bay and other fields in the North Slope in1999. A large-scale enhanced oil recovery (LSEOR) project was initiated in September1996 in the Kuparuk River field, the second largest producing field in the U.S. Thisfield’s production, plus like production from West Sak, Tabasco and Tarn, is expected tostay at an average of 287,500 barrels per day in the 1999-2000 forecast period. Alaska isexpected to account for 16.16 percent of total U.S. oil production in 2000.
U. S. Petroleum Demand
The assumption of continued, but slowing, growth in personal incomes and industrialoutput underpins the expectation of continued growth in petroleum demand. Despite
-1.50
-1.00
-0.50
0.00
0.50
1.00
1.50
1998 1999 2000
Mill
ion
Bar
rels
per
Day
1.0 Percent -1.1 Percent 2.9 Percent
History Projections
FSU Other
OPEC
FSUOther
OPEC
FSU
Other
OPEC
Figure 4. World Oil ProductionFigure 4. World Oil Production (Change from Year Ago)
Sources: History: EIA; Projections: Short-Term Energy Outlook, August 1999
0.0
5.5
6.0
6.5
7.0
Jan Jan Jan JanJul Jul Jul Jul
(Current vs Previous Outlook)
Current
July 1999 Base
Projections
Sources: History: EIA; Projections: Short-Term Energy Outlook, August 1999
recent increases in energy costs (and further smaller hikes projected during the forecastinterval), domestic petroleum demand is projected to climb 300,000 barrels per day, or1.5 percent, in 1999, and a further 280,000 barrels per day, or 1.4 percent, in 2000 (Figure6 and Table 5). Only heavy fuel oil is expected to experience a decline in demand asnatural gas continues to gain in the price-sensitive electric utility and industrial sectors.
Transportation demand is expected to continue to dominate domestic petroleummarkets. Having chalked up a 3-percent hike in 1998, motor gasoline demand growthfor the first half of 1999 slowed to 1.5 percent, partly as a result of the recent spate ofprice increases that constrained travel growth to 1.8 percent. In the second half, growthis expected to accelerate to 2.2 percent, brought about by a 2.5-percent increase in travel.In 2000, a 2.2-percent increase in gasoline demand, buoyed by a 2.7-percent growth intravel, is projected (Figure 7). Travel growth, however, is projected to continue to laggrowth of personal disposable income. Diesel demand is projected to register a 4-percent rate of growth between now and mid-2000 before slowing to a more moderate2.8 percent during the remainder of that year. Jet fuel growth is expected to average 4percent during the second half of 1999 before slowing to a more moderate 2.2 percent in2000. Economic growth is also expected to bring about increases in industrial demandfor distillate fuel oil.
Weather-related and electric utility demand for petroleum products, however, is notexpected to contribute to growth over the forecast period. Heating oil demand isexpected to decline slightly despite the assumption of normal weather compared to thelast winter’s mild temperatures. Residual fuel oil demand by electric utilities for the restof this year is expected to plunge an average of 170,000 barrels per day compared to thesame period last year as a result of the substantial shift in the price of fuel oil relative tonatural gas (Figure 8).
Prices
The surprisingly swift and sustained rise in world oil prices that began last month isexpected to hold throughout the forecast period. In the previous report we hadassumed that crude oil prices would not rise in July (Figure 1). In fact, crude oil pricesincreased by $2.65 per barrel, or more than 6 cents per gallon, from June to July.Moreover, we continue to believe that crude costs are likely to drift upward over thenext year and a half. Naturally, price increases will follow for virtually every petroleumproduct. Accordingly, we have substantially revised our price projections for all ofthese products since the previous outlook.
Motor Gasoline. In the previous outlook, unleaded regular motor gasoline prices wereprojected to peak for the year in August at $1.13 per gallon. In our current report, pumpprices are still expected to peak this August, but at $1.20 per gallon, with virtually all ofthe difference due to higher crude oil costs (Figure 9). During this rapid rise in crude oil
-100
0
100
200
300
400
1998 1999 2000
Sources: History: EIA; Projections: Short-Term Energy Outlook, August 1999
Th
ou
san
d b
arre
ls p
er d
ay
Total
Gasoline
Jet Fuel
Distillate
Residual
LPG’s
Other
Projections
Figure 6. Year-to-Year Changes in PetroleumFigure 6. Year-to-Year Changes in PetroleumDemandDemand
MPGVMTDemand
-0.5
-1.0
0.0
0.5
1.0
1.5
2.0
2.5
3.0
1998 1999 2000
Per
cen
t
Projections
Sources: History: EIA; Projections: Short-Term Energy Outlook, August 1999
Figure 7. Year-to-Year Changes in the GasolineFigure 7. Year-to-Year Changes in the GasolineMarketMarket
Sources: History: EIA; Projections: Short-Term Energy Outlook, August 1999
Do
llars
per
Mill
ion
Btu
Residual Fuel
Natural Gas
Coal
Projections
Figure 8. Fossil Fuel Prices to ElectricFigure 8. Fossil Fuel Prices to ElectricUtilitiesUtilities
0.00
0.80
0.90
1.00
1.10
1.20
1.30
1998 1999 20001997
Sources: History: EIA; Projections: Short-Term Energy Outlook, August 1999
*Regular Unleaded, Self-Service Cash
(Current vs Previous Outlook)
Do
llars
per
Gal
lon
Jan Jan Jan JanJul Jul Jul Jul
Current
July 1999 Base
Projections
Figure 9. Retail Motor Gasoline Prices*Figure 9. Retail Motor Gasoline Prices*
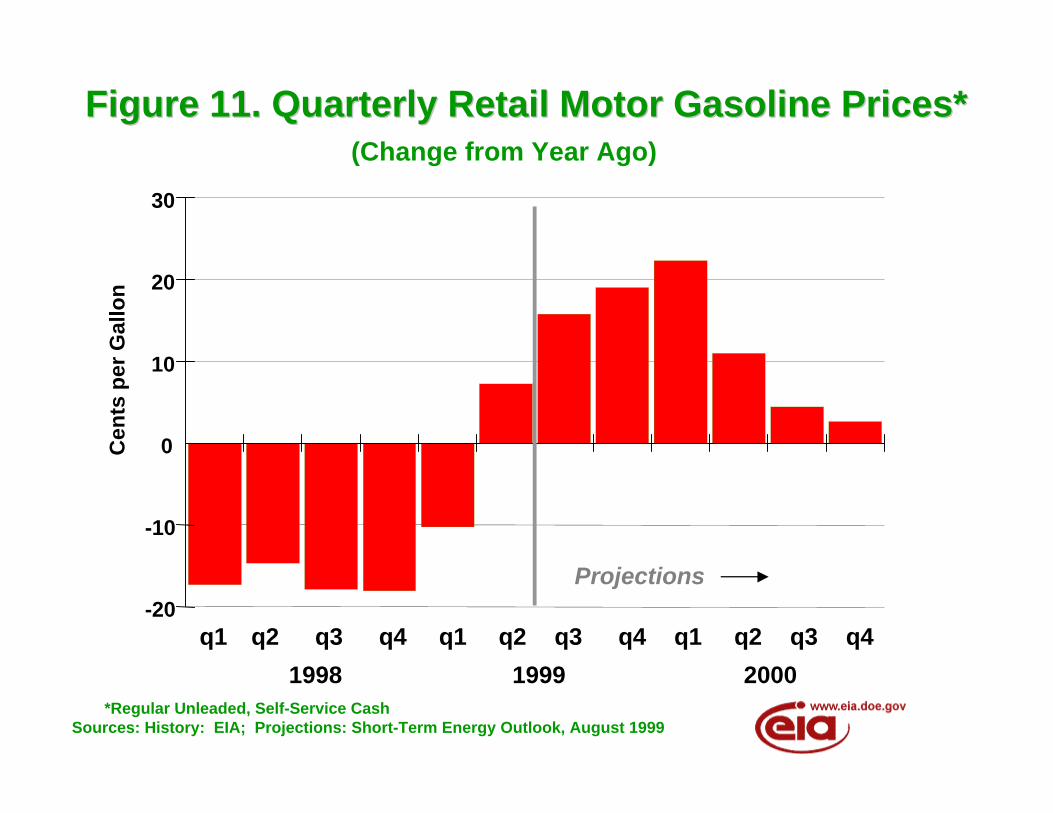
prices, refiner margins (the difference between the refiner price of gasoline and the priceof crude oil) did not appear to have gained. Retail margins (the pump price less therefiner price and taxes) actually shrank in July as the bulk of the higher crude costs, andthus the higher refiner prices for motor gasoline, weren't fully realized at the pump thismonth (Figure 10). Motorists may see these prices slip a little after the summer drivingseason ends next month. However next year, if crude costs rise as projected, summerretail prices could gain another an additional 8 cents per gallon (Figure 11 and Table 4).
Spot gasoline price increases have been noticeably sharp in California, which requires amore specialized and cleaner type of motor gasoline. The normally tight gasolinemarket in California became even tighter when a fire shut down a Mobil refinery atTorrance, California on July 28th. Los Angeles spot prices for reformulated gasolineshot up overnight by 16 cents per gallon. It is estimated that this refinery will be back inoperation within 1-3 weeks. As a result, California prices should cool down.
Heating Oil. Given our base case oil price projection, residential heating oil prices, likeall petroleum product prices, are expected to increase by a large amount this winter.Residential heating oil customers may be expected to pay an average of 17 cents pergallon more this upcoming winter than they did last winter (Figure 12).
Natural Gas. Our natural gas wellhead price forecast remains fundamentallyunchanged from our previous forecast. Currently there is much volatility in the spotand futures markets due to the extremely hot weather in much of the country. Veryhigh demand for air conditioning has in turn increased gas demand at electric utilitiescausing some concern about storage levels. Partly as a result of the heavy use of gas forelectricity generation so far this summer, gas injected into storage in recent weeks hasbeen less than normally expected. From the latest storage statistics (through the weekending 7/30/1999) net injections were evidently well below normal for July(approximately 230 billion cubic feet as opposed to an average of about 300 billion cubicfeet for the ten year period 1989 to 1998). On the other hand, working gas storage levelsat the end of July were about normal (approximately 2,400-2,420 billion cubic feetcompared to an average of 2,381 for the 1989 to 1998 period). Meanwhile, net imports ofCanadian gas, which account for 15 percent of total gas demand have grown by about10 percent this year. Partly as a result of the high volume of gas imports, undergroundstorage levels should be adequate during the upcoming winter. Nevertheless, winterwellhead prices are projected to be around 37 percent greater than prices from lastwinter since the weather then was considerably milder than normal (Figure 13).
Electric Utility Fuels. In the last Outlook, residual fuel oil prices to electric utilities wereprojected to maintain their price advantage over natural gas prices throughout theforecast period. However, given the revised crude oil price path, this difference narrowsconsiderably. Natural gas prices are expected to increase by about 9 percent per yearannually from 1998-2000, while heavy oil prices are projected to be more than doublethat over the same time period. By the year 2000, gas is expected to become the cheaper
0
5
10
15
20
25
30
35
Cen
ts p
er G
allo
n
Jan Jan Jan JanJul Jul Jul Jul
1998 1999 20001997
Sources: History: EIA; Projections: Short-Term Energy Outlook, August 1999
Refiner
Retail
Projections
Figure 10. Motor Gasoline MarginsFigure 10. Motor Gasoline Margins
-10
-20
0
10
20
30
(Change from Year Ago)
q2 q2 q2q4 q4 q4q1 q1 q1q3 q3q3
1999 20001998
Projections
Sources: History: EIA; Projections: Short-Term Energy Outlook, August 1999*Regular Unleaded, Self-Service Cash
Cen
ts p
er G
allo
nFigure 11. Quarterly Retail Motor Gasoline Prices*Figure 11. Quarterly Retail Motor Gasoline Prices*
-10
-20
0
10
20
(Change from Year Ago)C
ents
per
Gal
lon
q2 q2 q2q4 q4 q4q1 q1 q1q3 q3q31999 20001998
Projections
Sources: History: EIA; Projections: Short-Term Energy Outlook, August 1999
Sources: History: EIA; Projections: Short-Term Energy Outlook, August 1999
Figure 13. Quarterly Natural Gas Wellhead PricesFigure 13. Quarterly Natural Gas Wellhead Prices
of the two fuels, as it has been historically (Figure 8). Falling world oil prices in 1998gave the advantage to oil, but much of that advantage will vanish with the assumptionof rising world oil prices. Coal is by far the cheapest of the fossil fuels. The price of coalkeeps declining as mining productivity keeps increasing.
Natural Gas Demand and Supply
Demand. Third quarter 1999 demand for natural gas by electric utilities is projected tobe 3.0 percent above last month's projections due to the heat wave which has prevailedacross most of the nation since July 4 (Figure 14). Electricity sector demand for naturalgas has been revised upwards for the remainder of the forecast period (Figure 15). In2000, our new outlook shows electric utility demand at 3.2 percent above last month'sprojections (Table 8). This is almost entirely due to the increase in expected petroleumprices (relative to natural gas prices) for this forecast.
Supply. Dry gas production is expected to remain at our previously projected levelsthrough the forecast period. On the other hand, gas net imports have been rising basedon estimated second quarter data. Overall net imports are estimated at 84 billion cubicfeet, or 1.2 percent, above 1998 levels in the second quarter of this year. We haveincreased our expectations for net imports in 1999 to 3.35 trillion cubic feet, withexpected growth in 2000 resulting in a push to about 3.42 trillion cubic feet.
Gas storage levels, which have generally been above year-earlier levels for most of 1999,may fall below comparable 1998 levels some time in August, particularly if high coolingdemand continues. Storage is certainly expected to be lower than the abnormally highyear-ago levels by the fourth quarter of this year if normal heating demand develops.
Electricity Demand and Supply
Demand. Electricity demand is projected to be up by about 1.2 percent in the thirdquarter of 1999 from what it was in last month's outlook, due mainly to higher coolingdemand, although it will not reach the level of the third quarter of 1998's demand.Electricity growth for all of 1999 is now expected to be 1.1 percent, to be followed by anexpected 2.3 growth rate in 2000 (Figure 16 and Table 10).
Supply. Total electric utility generation for the third quarter is expected to be slightlyhigher than it was during last year's third quarter, but net electricity imports areexpected to be lower. On the other hand, the fuel mix at electric utilities has beennoticeably changed this month. In particular, expected oil-fired output has been reviseddownward in both 1999 and 2000 mainly due to the increases in world petroleumprices. Likewise, the coal and natural gas power forecasts have been raised from lastmonth's projections (Figure 17).
(Current vs Previous Outlook)
0
100
200
300
400
Co
olin
g D
egre
e-D
ays
July 1999
Projections
Current
Sources: History: EIA; Projections: Short-Term Energy Outlook, August 1999
Total Energy Demand per Dollar of GDP(thousand Btu per 1992 Dollar)...................... 12.97 12.54 12.28 12.35 -3.3 -2.1 0.6
Renewable Energy as Percent of Total f ....... 7.5 7.1 6.9 6.7
aRefers to the refiner acquisition cost (RAC) of imported crude oil.
bIncludes lease condensate. cTotal annual electric utility sales for historical periods are derived from the sum of monthly sales figures based on submissions by electric utilities of Form EIA-826, "MonthlyElectric Utility Sales and Revenue Report with State Distributions." These historical values differ from annual sales totals based on Form EIA-861, ":Annual Electric UtilityReport," reported in several EIA publications, but match alternate annual totals reported in EIA's Electric Power Monthly, DOE/EIA-0226. dDefined as the difference between total nonutility electricity generation and sales to electric utilities by nonutility generators, reported on Form EIA-867, "Annual NonutilityPower Producer Report." Data for 1998 are estimates. eThe conversion from physical units to Btu is calculated by using a subset of conversion factors used in the calculations performed for gross energy consumption in EnergyInformation Administration, Monthly Energy Review (MER). Consequently, the historical data may not precisely match those published in the MER or the Annual EnergyReview (AER).
fRenewable energy includes minor components of non-marketed renewable energy, which is renewable energy that is neither bought nor sold, either directly or indirectly as
inputs to marketed energy. The Energy Information Administration does not estimate or project total consumption of non-marketed renewable energy.SPR: Strategic Petroleum Reserve.Notes: Minor discrepancies with other published EIA historical data are due to independent rounding. Historical data are printed in bold; forecasts are in italics. The forecastswere generated by simulation of the Short-Term Integrated Forecasting System.Sources: Historical data: Latest data available from Bureau of Economic Analysis and Energy Information Administration; latest data available from EIA databases supportingthe following reports: Petroleum Supply Monthly, DOE/EIA-0109; Petroleum Supply Annual, DOE/EIA-0340/2; Natural Gas Monthly, DOE/EIA-0130; Electric Power Monthly,DOE/EIA-0226; and Quarterly Coal Report, DOE/EIA-0121; International Petroleum Statistics Report DOE/EIA-0520; Weekly Petroleum Status Report, DOE/EIA-0208.Macroeconomic projections are based on DRI/McGraw-Hill Forecast CONTROL0299.
Energy Information Administration/Short-Term Energy Outlook -- August 199976
Table 1. U.S. Macroeconomic and Weather Assumptions1998 1999 2000 Year
aMacroeconomic projections from DRI/McGraw-Hill model forecasts are seasonally adjusted at annual rates and modified as appropriate to the mid world oil price case.
bOECD: Organization for Economic Cooperation and Development: Australia, Austria, Belgium, Canada, Denmark, Finland, France, Germany, Greece, Iceland, Ireland,
Italy, Japan, Luxembourg, the Netherlands, New Zealand, Norway, Portugal, Spain, Sweden, Switzerland, Turkey, the United Kingdom, and the United States. The CzechRepublic, Hungary, Mexico, Poland, and South Korea are all members of OECD, but are not yet included in our OECD estimates.
cPopulation-weighted degree days. A degree day indicates the temperature variation from 65 degrees Fahrenheit (calculated as the simple average of the daily minimum
and maximum temperatures) weighted by 1990 population. Normal is used for the forecast period and is defined as the average number of degree days between 1961 and1990 for a given period. SAAR: Seasonally-adjusted annualized rate. Note: Historical data are printed in bold; forecasts are in italics. Sources: Historical data: latest data available from: U.S. Department of Commerce, Bureau of Economic Analysis; U.S. Department of Commerce, National Oceanic andAtmospheric Administration; Federal Reserve System, Statistical Release G.17(419). Projections of OECD growth are based on WEFA Group, "World Economic Outlook,"Volume 1. Macroeconomic projections are based on DRI/McGraw-Hill Forecast CONTROL0299.
Energy Information Administration/Short-Term Energy Outlook -- August 199977
Table 2. U.S. Energy Indicators: Mid World Oil Price Case1998 1999 2000 Year
aMacroeconomic projections from DRI/McGraw-Hill model forecasts are seasonally adjusted at annual rates and modified as appropriate to the mid world oil price case.
bIncludes all highway travel.
SAAR: Seasonally-adjusted annualized rate. Note: Historical data are printed in bold; forecasts are in italics. Sources: Historical data: latest data available from: U.S. Department of Commerce, Bureau of Economic Analysis; U.S. Department of Commerce, National Oceanic andAtmospheric Administration; Federal Reserve System, Statistical Release G.17(419); U.S. Department of Transportation; American Iron and Steel Institute. Macroeconomicprojections are based on DRI/McGraw-Hill Forecast CONTROL0299.
Energy Information Administration/Short-Term Energy Outlook -- August 199978
Table 3. International Petroleum Supply and Demand: Mid World Oil Price Case (Million Barrels per Day, Except OECD Commercial Stocks)
aDemand for petroleum by the OECD countries is synonymous with "petroleum product supplied," which is defined in the glossary of the EIA Petroleum Supply Monthly,
DOE/EIA-0109. Demand for petroleum by the non-OECD countries is "apparent consumption," which includes internal consumption, refinery fuel and loss, and bunkering.
bIncludes production of crude oil (including lease condensates), natural gas plant liquids, other hydrogen and hydrocarbons for refinery feedstocks, refinery gains, alcohol,
and liquids produced from coal and other sources.
cIncludes offshore supply from Denmark, Germany, the Netherlands, Norway, and the United Kingdom.
OECD: Organization for Economic Cooperation and Development: Australia, Austria, Belgium, Canada, Denmark, Finland, France, Germany, Greece, Iceland, Ireland,Italy, Japan, Luxembourg, the Netherlands, New Zealand, Norway, Portugal, Spain, Sweden, Switzerland, Turkey, the United Kingdom, and the United States. The CzechRepublic, Hungary, Mexico, Poland, and South Korea are all members of OECD, but are not yet included in our OECD estimates. OPEC: Organization of Petroleum Exporting Countries: Algeria, Indonesia, Iran, Iraq, Kuwait, Libya, Nigeria, Qatar, Saudi Arabia, the United Arab Emirates, and Venezuela. SPR: Strategic Petroleum Reserve Former Soviet Union: Armenia, Azerbaijan, Belarus, Estonia, Georgia, Kazakhstan, Kyrgyzstan, Latvia, Lithuania, Moldova, Russia, Tajikistan, Turkmenistan, Ukraine andUzbekistan. Notes: Minor discrepancies with other published EIA historical data are due to rounding. Historical data are printed in bold; forecasts are in italics. The forecasts weregenerated by simulation of the Short-Term Integrated Forecasting System. Sources: Energy Information Administration: latest data available from EIA databases supporting the following reports: International Petroleum Statistics Report, DOE/EIA-0520; Organization for Economic Cooperation and Development, Annual and Monthly Oil Statistics Database.
Energy Information Administration/Short-Term Energy Outlook -- August 199979
Electricity (cents per kilowatthour)............................. 7.96 8.43 8.55 8.09 7.79 8.27 8.51 8.08 7.53 8.15 8.40 7.94 8.28 8.18 8.01 a
Refiner acquisition cost (RAC) of imported crude oil.
bAverage self-service cash prices.
cAverage for all sulfur contents.
dIncludes fuel oils No. 4, No. 5, and No. 6 and topped crude fuel oil prices.
Notes: Data are estimated for the first quarter of 1999. Prices exclude taxes, except prices for gasoline, residential natural gas, and diesel. The forecasts were generatedby simulation of the Short-Term Integrated Forecasting System. Sources: Historical data: Energy Information Administration: latest data available from EIA databases supporting the following reports: Petroleum Marketing Monthly,DOE/EIA-0380; Natural Gas Monthly, DOE/EIA-0130; Monthly Energy Review, DOE/EIA-0035; Electric Power Monthly, DOE/EIA-0226.
Energy Information Administration/Short-Term Energy Outlook -- August 199980
Table 5. U.S. Petroleum Supply and Demand: Mid World Oil Price Case (Million Barrels per Day, Except Closing Stocks)
bNet imports equals gross imports plus SPR imports minus exports.
cIncludes finished petroleum products, unfinished oils, gasoline blending components, and natural gas plant liquids for processing.
dIncludes crude oil product supplied, natural gas liquids, liquefied refinery gas, other liquids, and all finished petroleum products except motor gasoline, jet fuel,distillate, and residual fuel oil.
eIncludes stocks of all other oils, such as aviation gasoline, kerosene, natural gas liquids (including ethane), aviation gasoline blending components, naphtha and other
oils for petrochemical feedstock use, special naphthas, lube oils, wax, coke, asphalt, road oil, and miscellaneous oils. SPR: Strategic Petroleum Reserve NGL: Natural Gas Liquids Notes: Minor discrepancies with other EIA published historical data are due to rounding. Historical data are printed in bold; forecasts are in italics. The forecastswere generated by simulation of the Short-Term Integrated Forecasting System. Sources: Historical data: Energy Information Administration: latest data available from EIA databases supporting the following reports: Petroleum Supply Monthly,DOE/EIA-0109, and Weekly Petroleum Status Report, DOE/EIA-0208.
Energy Information Administration/Short-Term Energy Outlook -- August 199981
Table 6. Approximate Energy Demand Sensitivitiesa for the STIFSb Model (Percent Deviation Base Case)
+ 10% Prices + 10% Weather e
Demand Sector +1% GDP Crude Oil c N.Gas Wellhead d Fall/Winter f Spring/Summer f
Industrial .................................... 0.8% 0.0% 0.0% 0.3% 0.2% a
Percent change in demand quantity resulting from specified percent changes in model inputs. bShort-Term Integrated Forecasting System. cRefiner acquisitions cost of imported crude oil. dAverage unit value of marketed natural gas production reported by States. eRefers to percent changes in degree-days. fResponse during fall/winter period(first and fourth calendar quarters) refers to change in heating degree-days. Response during the spring/summer period refers tochange in cooling degree-days.
Table 7. Forecast Components for U.S. Crude Oil Production (Million Barrels per Day)
DifferenceHigh
Price CaseLow
Price Case Total Uncertainty Price Impact
United States.................................................. 6.24 5.50 0.74 0.09 0.66
Lower 48 States ............................................. 5.29 4.57 0.72 0.07 0.64
Note: Components provided are for the fourth quarter 2000. Totals may not add to sum of components due to independent rounding. Source: Energy Information Administration, Office of Oil and Gas, Reserves and Natural Gas Division.
Energy Information Administration/Short-Term Energy Outlook -- August 199982
Table 8. U.S. Natural Gas Supply and Demand: Mid world Oil Price Case (Trillion cubic Feet)
aThe balancing item represents the difference between the sum of the components of natural gas supply and the sum of components of natural gas demand.
bQuarterly estimates and projections for gas consumption by nonutility generators are based on estimates for quarterly gas-fired generation at nonutilities, supplied by
the Office of Coal, Nuclear, Electric and Alternate Fuels (CNEAF), Energy Information Administration (EIA), based on annual data reported to EIA on Form EIA-867(Annual Nonutility Power Producer Report). Annual projections for nonutility gas consumption, as well as the detail on independent power producers' share of gasconsumption, are provided by CNEAF. Notes: Minor discrepancies with other EIA published historical data are due to rounding. Historical data are printed in bold; forecasts are in italics. The forecastswere generated by simulation of the Short-Term Integrated Forecasting System. Sources: Historical data: Energy Information Administration: latest data available from EIA databases supporting the following reports: Natural Gas Monthly, DOE/EIA-0130; Electric Power Monthly, DOE/EIA-0226; Projections: Energy Information Administration, Short-Term Integrated Forecasting System database, and Office of Oil andGas, Reserves and Natural Gas Division.
Energy Information Administration/Short-Term Energy Outlook -- August 199983
Table 9. U.S. Coal Supply and Demand: Mid World Oil Price Case (Million Short Tons)
aPrimary stocks are held at the mines, preparation plants, and distribution points.
bSecondary stocks are held by users.
cEstimated independent power producers (IPPs) consumption of waste coal for 1994 is 7.9 million tons, 8.5 million tons in 1995, and 8.8 million tons in 1996. This item
includes waste coal and coal slurry reprocessed into briquettes.
dEstimates of coal consumption by IPPs, supplied by the Office of Coal, Nuclear, Electric, and Alternate Fuels, Energy Information Administration (EIA). Quarterly coal
consumption estimates for 1998 and projections for 1999 and 2000 are based on (1) estimated consumption by utility power plants sold to nonutility generators during1998 and 1999, and (2) annual coal-fired generation at nonutilities from Form EIA-867 (Annual Nonutility Power Producer Report).
eSynfuels plant demand in 1993 was 1.7 million tons per quarter and is assumed to remain at that level in 1994, 1995, 1996, 1997 and 1998.
fThe discrepancy reflects an unaccounted-for shipper and receiver reporting difference, assumed to be zero in the forecast period.
(S) indicates amounts of less than 50,000 tons in absolute value. Notes: Rows and columns may not add due to independent rounding. Historical data are printed in bold; forecasts are in italics. The forecasts were generated bysimulation of the Short-Term Integrated Forecasting System. Sources: Historical data: Energy Information Administration: latest data available from EIA databases supporting the following reports: Quarterly Coal Report,DOE/EIA-0121, and Electric Power Monthly, DOE/EIA-0226. Projections: Energy Information Administration, Short-Term Integrated Forecasting System database, andOffice of Coal, Nuclear, Electric and Alternate Fuels.
Energy Information Administration/Short-Term Energy Outlook -- August 199984
Table 10. U.S. Electricity Supply and Demand: Mid World Oil Price Case (Billion Kilowatt-hours)
Memo: Nonutility Sales to Electric Utilities b ........................... 54.4 52.1 56.7 63.5 55.2 52.9 57.5 64.4 56.0 53.7 58.4 65.4 226.7 230.1 233.4
a"Other" includes generation from wind, wood, waste, and solar sources.
bElectricity from nonutility sources, including cogenerators and small power producers. Quarterly estimates and projections for nonutility net sales, own use, and
generation by fuel source supplied by the Office of Coal, Nuclear, Electric and Alternate Fuels, Energy Information Administration (EIA), based on annual data reported toEIA on Form EIA-867, "Annual Nonutility Power Producer Report."
cIncludes refinery still gas and other process or waste gases, and liquefied petroleum gases.
fBalancing item, mainly transmission and distribution losses.
Notes: Minor discrepancies with other EIA published historical data are due to rounding. Historical data are printed in bold; forecasts are in italics. The forecastswere generated by simulation of the Short-Term Integrated Forecasting System. Sources: Historical data: Energy Information Administration: latest data available from EIA databases supporting the following reports: Electric Power Monthly,DOE/EIA-0226. Projections: Energy Information Administration, Short-Term Integrated Forecasting System database, and Office of Coal, Nuclear, Electric and AlternateFuels.
Energy Information Administration/Short-Term Energy Outlook -- August 199985
Table 11. U.S. Renewable Energy Use by Sector : Mid World Oil Price Case (Quadrillion Btu)
Year Annual Percentage Change1997 1998 1999 2000 1997-1998 1998-1999 1999-2000
Electric Utilities Hydroelectric Power a .................................. 3.530 3.186 3.131 2.982 -9.7 -1.7 -4.8
Geothermal, Solar and Wind Energy b ........ 0.115 0.109 0.100 0.109 -5.2 -8.3 9.0
Biofuels c ..................................................... 0.021 0.021 0.021 0.021 0.0 0.0 0.0 Total ............................................................ 3.665 3.316 3.251 3.112 -9.5 -2.0 -4.3
Nonutility Power Generators Hydroelectric Power a .................................. 0.185 0.179 0.186 0.193 -3.2 3.9 3.8
Geothermal, Solar and Wind Energy b ........ 0.235 0.253 0.254 0.255 7.7 0.4 0.4
Biofuels c ..................................................... 0.578 0.585 0.582 0.579 1.2 -0.5 -0.5 Total ............................................................. 0.998 1.018 1.022 1.027 2.0 0.4 0.5
Total Power Generation.................................. 4.663 4.334 4.273 4.140 -7.1 -1.4 -3.1
Other Sectors d
Residential and Commercial e ..................... 0.553 0.568 0.574 0.583 2.7 1.1 1.6
Industrial f .................................................... 1.498 1.515 1.542 1.569 1.1 1.8 1.8
Transportation g .......................................... 0.087 0.095 0.094 0.095 9.2 -1.1 1.1 Total ............................................................. 2.138 2.178 2.211 2.247 1.9 1.5 1.6
Net Imported Electricity h .............................. 0.297 0.234 0.208 0.214 -21.2 -11.1 2.9
Total Renewable Energy Demand.................. 7.098 6.746 6.692 6.602 -5.0 -0.8 -1.3
aConventional hydroelectric power only. Hydroelectricity generated by pumped storage is not included in renewable energy.
bAlso includes photovoltaic and solar thermal energy.
cBiofuels are fuelwood, wood byproducts, waste wood, municipal solid waste, manufacturing process waste, and alcohol fuels.
dRenewable energy includes minor components of non-marketed renewable energy, which is renewable energy that is neither bought nor sold, either directly or
indirectly as inputs to marketed energy. The Energy Information Administration does not estimate or project total consumption of non-marketed renewable energy.SPR: Strategic Petroleum Reserve.
eIncludes biofuels and solar energy consumed in the residential and commercial sectors.
fonsists primarily of biofuels for use other than in electricity cogeneration.
gEthanol blended into gasoline.
hRepresents 78.6 percent of total electricity net imports, which is the proportion of total 1994 net imported electricity (0.459 quadrillion Btu) attributable to renewable
sources (0.361 quadrillion Btu).(S) Less than 500 billion Btu.NM indicates percent change calculations are not meaningful or undefined at the precision level of this table.Notes: Minor discrepancies with other published EIA historical data are due to independent rounding. Historical data are printed in bold, forecasts are in italics. The
forecasts were generated by simulation of the Short-Term Integrated Forecasting System.
Energy Information Administration/Short-Term Energy Outlook -- August 199986
Table A1. Annual U.S. Energy Supply and DemandYear
Nonutility Own Use d .................................... NA NA NA 97 113 122 137 138 150 158 158 161 164 166 168 Total .............................................................. 2369 2457 2578 2744 2826 2884 2901 2999 3085 3171 3256 3301 3384 3419 3497Total Energy Demand e
(quadrillion Btu) ............................................. NA NA NA NA 84.2 84.3 85.6 87.4 89.2 90.9 93.9 94.3 94.7 96.4 98.8Total Energy Demand per Dollar of GDP(thousand Btu per 1992 Dollar) ...................... NA NA NA NA 13.72 13.86 13.71 13.68 13.50 13.45 13.43 12.97 12.54 12.28 12.35 aRefers to the imported cost of crude oil to U.S. refiners.
bIncludes lease condensate.
cTotal annual electric utility sales for historical periods are derived from the sum of monthly sales figures based on submissions by electric utilities of Form EIA-826, "Monthly Electric Utility Sales and Revenue Report with State Distributions."
These historical values differ from annual sales totals based on Form EIA-861, reported in several EIA publications, but match alternate annual totals reported in EIA's Electric Power Monthly, DOE/EIA-0226.
dDefined as the difference between total nonutility electricity generation and sales to electric utilities by nonutility generators, reported on Form EIA-867, "Annual Nonutility Power Producer Report." Data for 1998 are estimates.
e "Total Energy Demand" refers to the aggregate energy concept presented in Energy Information Administration, Annual Energy Review, 1997, DOE/EIA-0384(97) (AER), Table 1.1. Prior to 1990, some components of renewable energy
consumption, particularly relating to consumption at nonutility electric generating facilities, were not available. For those years, a less compehensive measure of total energy demand can be found in EIA's AER. The conversion from physicalunits to Btu is calculated using a subset of conversion factors used in the calculations performed for gross energy consumption in Energy Information Administration, Monthly Energy Review (MER). Consequently, the historical data may notprecisely match those published in the MER or the AER.Notes: SPR: Strategic Petroleum Reserve. Minor discrepancies with other published EIA historical data are due to independent rounding. Historical data are printed in bold; forecasts are in italics. The forecasts were generated by simulation ofthe Short-Term Integrated Forecasting System.Sources: Historical data: Latest data available from Bureau of Economic Analysis; Energy Information Administration; latest data available from EIA databases supporting the following reports: Petroleum Supply Monthly, DOE/EIA-0109;Petroleum Supply Annual, DOE/EIA-0340/2; Natural Gas Monthly, DOE/EIA-0130; Electric Power Monthly, DOE/EIA-0226; and Quarterly Coal Report, DOE/EIA-0121; International Petroleum Statistics Report DOE/EIA-520; Weekly PetroleumStatus Report DOE/EIA-0208. Macroeconomic projections are based on DRI/McGraw-Hill Forecast CONTROL0299.
Energy Information Administration/Short-Term Energy Outlook -- August 199987
Table A2. Annual U.S. Macroeconomic and Weather IndicatorsYear
aPopulation-weighted degree days. A degree day indicates the temperature variation from 65 degrees Fahrenheit (calculated as the simple average of the daily minimum and maximum temperatures) weighted by 1990
population. Normal is used for the forecast period and is defined as the average number of degree days between 1961 and 1990 for a given period. Notes: Historical data are printed in bold; forecasts are in italics. Sources: Historical data: latest data available from: U.S. Department of Commerce, Bureau of Economic Analysis; U.S. Department of Commerce, National Oceanic and Atmospheric Administration; Federal Reserve System,Statistical Release G.17(419); U.S. Department of Transportation; American Iron and Steel Institute. Macroeconomic projections are based on DRI/McGraw-Hill Forecast CONTROL0299.
Energy Information Administration/Short-Term Energy Outlook -- August 199988
Table A3. Annual International Petroleum Supply and Demand Balance (Millions Barrels per Day, Except OECD Commercial Stocks)
Net Exports from Former Soviet Union .................. 3.4 3.5 3.6 3.4 3.0 2.1 2.1 2.3 2.4 2.5 3.0 2.9 3.0 3.1 3.0
aDemand for petroleum by the OECD countries is synonymous with "petroleum product supplied," which is defined in the glossary of the EIA Petroleum Supply Monthly, DOE/EIA-0109. Demand for petroleum by the non-OECD
countries is "apparent consumption," which includes internal consumption, refinery fuel and loss, and bunkering.
bOECD Europe includes the former East Germany.
C
Includes production of crude oil (including lease condensates), natural gas plant liquids, other hydrogen and hydrocarbons for refinery feedstocks, refinery gains, alcohol, and liquids produced from coal and other sources.
dIncludes offshore supply from Denmark, Germany, the Netherlands, Norway, and the United Kingdom.
OECD: Organization for Economic Cooperation and Development: Australia, Austria, Belgium, Canada, Denmark, Finland, France, Germany, Greece, Iceland, Ireland, Italy, Japan, Luxembourg, the Netherlands, New Zealand,Norway, Portugal, Spain, Sweden, Switzerland, Turkey, the United Kingdom, and the United States. The Czech Republic, Hungary, Mexico, Poland, and South Korea are all members of OECD, but are not yet included in ourOECD estimates.OPEC: Organization of Petroleum Exporting Countries: Algeria, Indonesia, Iran, Iraq, Kuwait, Libya, Nigeria, Qatar, Saudi Arabia, the United Arab Emirates, and Venezuela. SPR: Strategic Petroleum Reserve Former Soviet Union: Armenia, Azerbaijan, Belarus, Estonia, Georgia, Kazakhstan, Kyrgyzstan, Latvia, Lithuania, Moldova, Russia, Tajikistan, Turkmenistan, Ukraine and Uzbekistan. Notes: Minor discrepancies with other published EIA historical data are due to rounding. Historical data are printed in bold; forecasts are in italics. The forecasts were generated by simulation of the Short-Term IntegratedForecasting System. Sources: Energy Information Administration: latest data available from EIA databases supporting the following reports: International Petroleum Statistics Report, DOE/EIA-0520, and Organization for Economic Cooperation andDevelopment, Annual and Monthly Oil Statistics Database.
Energy Information Administration/Short-Term Energy Outlook -- August 199989
Table A4. Annual Average U. S. Energy Prices (Nominal Dollars)
aRefiner acquisition cost (RAC) of imported crude oil.
bAverage self-service cash prices.
cAverage for all sulfur contents.
dIncludes fuel oils No. 4, No. 5, and No. 6 and topped crude fuel oil prices.
Notes: Prices exclude taxes, except prices for gasoline, residential natural gas, and diesel. The forecasts were generated by simulation of the Short-Term Integrated Forecasting System. Sources: Historical data: Energy Information Administration: latest data available from EIA databases supporting the following reports: Petroleum Marketing Monthly, DOE/EIA-0380; Natural Gas Monthly, DOE/EIA-0130; Monthly Energy Review, DOE/EIA-0035; Electric Power Monthly, DOE/EIA-0226.
Energy Information Administration/Short-Term Energy Outlook -- August 199990
Table A5. Annual U.S. Petroleum Supply and Demand (Million Barrels per Day, Except Closing Stocks)
bNet imports equals gross imports plus SPR imports minus exports.
cIncludes finished petroleum products, unfinished oils, gasoline blending components, and natural gas plant liquids for processing.
dFor years prior to 1993, motor gasoline includes an estimate of fuel ethanol blended into gasoline and certain product reclassifications, not reported elsewhere in EIA. See Appendix B in Energy Information
Administration, Short-Term Energy Outlook, EIA/DOE-0202(93/3Q), for details on this adjustment.
eIncludes crude oil product supplied, natural gas liquids, liquefied refinery gas, other liquids, and all finished petroleum products except motor gasoline, jet fuel, distillate, and residual fuel oil.
fIncludes stocks of all other oils, such as aviation gasoline, kerosene, natural gas liquids (including ethane), aviation gasoline blending components, naphtha and other oils for petrochemical feedstock use, special
naphthas, lube oils, wax, coke, asphalt, road oil, and miscellaneous oils. SPR: Strategic Petroleum Reserve. NGL: Natural Gas Liquids Notes: Minor discrepancies with other EIA published historical data are due to rounding. Historical data are printed in bold; forecasts are in italics. The forecasts were generated by simulation of the Short-TermIntegrated Forecasting System. Sources: Historical data: Energy Information Administration: latest data available from EIA databases supporting the following reports: Petroleum Supply Monthly, DOE/EIA-0109, and Weekly Petroleum Status Report,DOE/EIA-0208.
Energy Information Administration/Short-Term Energy Outlook -- August 199991
Table A6. Annual U.S. Natural Gas Supply and Demand (Trillion Cubic Feet)
Other Nonutil. Gen. b ................................. NA NA NA NA 0.09 0.16 0.18 0.22 0.16 0.17 0.16 0.18 0.18 0.18 0.19 Electric Utilities ............................................. 2.60 2.84 2.64 2.79 2.79 2.79 2.77 2.68 2.99 3.20 2.73 2.97 3.26 3.38 3.59 Total Demand.............................................. 16.22 17.21 18.03 18.80 18.72 19.03 19.54 20.28 20.71 21.58 21.96 21.97 21.35 21.75 22.61
aThe balancing item represents the difference between the sum of the components of natural gas supply and the sum of components of natural gas demand.
bAnnual projections for nonutility gas consumption, as well as the detail on independent power producers' share of gas consumption, are provided by the office of Coal, Nuclear, Electric and Alternative Fuels, Energy
Information Administration. Notes: Minor discrepancies with other EIA published historical data are due to rounding. Historical data are printed in bold; forecasts are in italics. The forecasts were generated by simulation of the Short-Term IntegratedForecasting System. Sources: Historical data: Energy Information Administration: latest data available from EIA databases supporting the following reports: Natural Gas Monthly, DOE/EIA-0130; Electric Power Monthly, DOE/EIA-0226;Projections: Energy Information Administration, Short-Term Integrated Forecasting System database, and Office of Oil and Gas, Reserves and Natural Gas Division.
Energy Information Administration/Short-Term Energy Outlook -- August 199992
Table A7. Annual U.S. Coal Supply and Demand (Million Short Tons)
aPrimary stocks are held at the mines, preparation plants, and distribution points.
bSecondary stocks are held by users.
cEstimated independent power producers (IPPs) consumption of waste coal for 1994 is 7.9 million tons, 8.5 million tons in 1995, and 8.8 million tons in 1996. This item includes waste coal and coal slurry reprocessed into
briquettes.
dEstimates of coal consumption by IPPs, supplied by the Office of Coal, Nuclear, Electric, and Alternate Fuels, Energy Information Administration (EIA). Quarterly coal consumption estimates for 1998 and projections for 1999
and 2000 are based on (1) estimated consumption by utility power plants sold to nonutility generators during 1998 and 1999, and (2) annual coal-fired generation at nonutilities from Form EIA-867 (Annual Nonutility PowerProducer Report).
eSynfuels plant demand in 1993 was 1.7 million tons per quarter and is assumed to remain at that level in 1994, 1995, 1996, 1997 and 1998.
fThe discrepancy reflects an unaccounted-for shipper and receiver reporting difference, assumed to be zero in the forecast period. Prior to 1994, discrepancy may include some waste coal supplied to IPPs that has not been
specifically identified. (S) indicates amounts of less than 50,000 tons in absolute value. Notes: Rows and columns may not add due to independent rounding. Historical data are printed in bold; forecasts are in italics. The forecasts were generated by simulation of the Short-Term Integrated Forecasting System. Sources: Historical data: Energy Information Administration: latest data available from EIA databases supporting the following reports: Quarterly Coal Report, DOE/EIA-0121, and Electric Power Monthly, DOE/EIA-0226.Projections: Energy Information Administration, Short-Term Integrated Forecasting System database, and Office of Coal, Nuclear, Electric and Alternate Fuels.
Energy Information Administration/Short-Term Energy Outlook -- August 199993
Table A8. Annual U.S. Electricity Supply and Demand (Billion Kilowatt-hours)
Nonutility Generation b .................................. NA NA NA 187.0 221.5 253.3 301.8 325.2 354.9 375.9 382.4 384.7 390.3 396.0 401.9
Total Generation .......................................... NA NA NA 2971.3 3029.6 3078.3 3099.0 3207.8 3265.6 3370.4 3459.9 3507.2 3602.5 3644.8 3730.3
Total Supply ................................................... NA NA NA 2982.3 3031.6 3100.6 3127.3 3236.2 3310.3 3408.0 3497.9 3543.8 3631.3 3670.4 3756.7
Losses and Unaccounted for c ....................... NA NA NA 238.3 205.8 216.9 226.6 237.0 225.5 236.8 242.3 242.8 247.6 251.2 259.8
Nonutility Own Use b ................................... NA NA NA 97.2 113.2 121.7 137.3 137.8 150.2 158.0 157.8 161.2 163.6 166.0 168.5
Total Demand............................................. NA NA NA 2744.0 2825.8 2883.7 2900.7 2999.2 3084.8 3171.3 3255.6 3301.0 3383.7 3419.2 3496.8
Memo:
Nonutility Sales
to Electric Utilities d ....................................... 39.9 50.0 68.0 89.8 108.2 131.6 164.4 187.5 204.7 217.9 224.6 223.5 226.7 230.1 233.4
aOther includes generation from wind, wood, waste, and solar sources.
bFor 1989 to 1991, estimates for nonutility generation are estimates made by the Energy Markets and Contingency Information Division, based on Form EIA-867 (Annual Nonutility Power Producer Report ) data. Historical
data and Projections for the same items are from the Office of Coal, Nuclear, Electric and Alternate Fuels, Energy Information Administration, based on Form EIA-867.
cBalancing item, mainly transmission and distribution losses.
dHistorical data for nonutility sales to electric utilities are from the Energy Information Administration, Annual Energy Review, DOE/EIA-0389, Table 8.1, for 1982 to 1988; from Form EIA-867 (Annual Nonutility Power
Producer Report) for 1989 to 1996. Notes: Minor discrepancies with other EIA published historical data are due to rounding. Historical data are printed in bold; forecasts are in italics. The forecasts were generated by simulation of the Short-Term IntegratedForecasting System.Sources: Historical data: Energy Information Administration: latest data available from EIA databases supporting the following report: Electric Power Monthly, DOE/EIA-0226. Projections: Energy Information Administration,Short-Term Integrated Forecasting System database, and Office of Coal, Nuclear, Electric and Alternate Fuels.