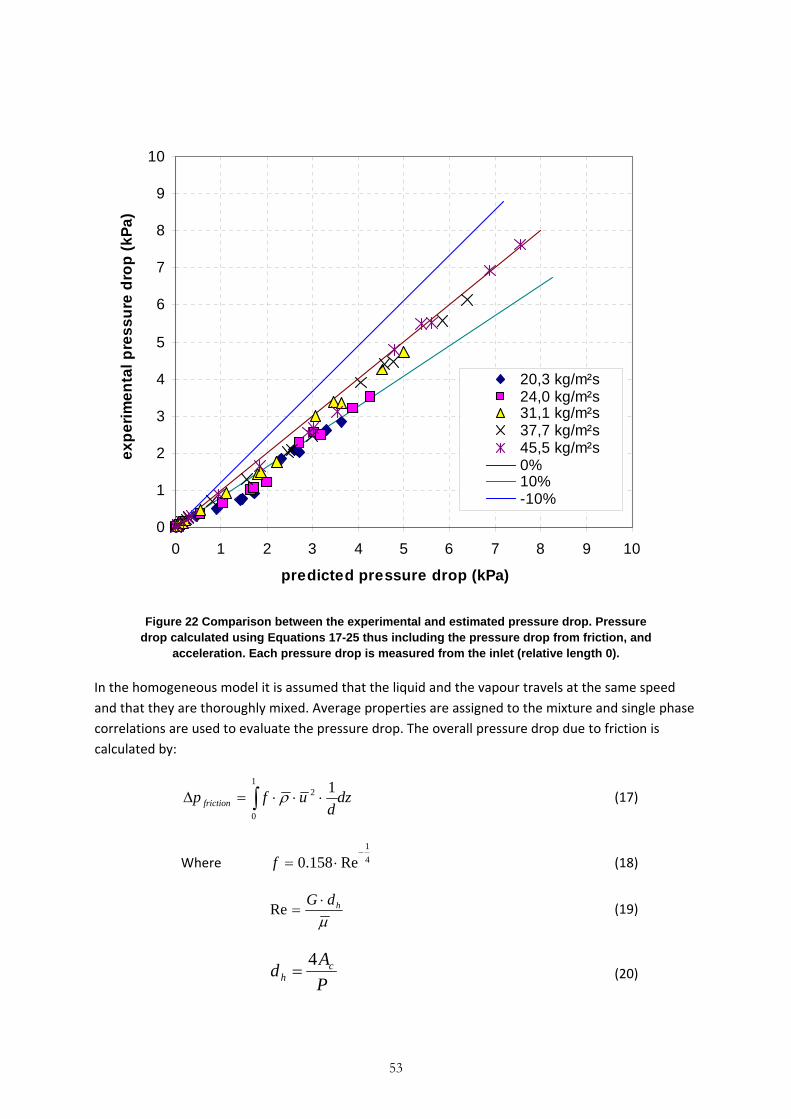
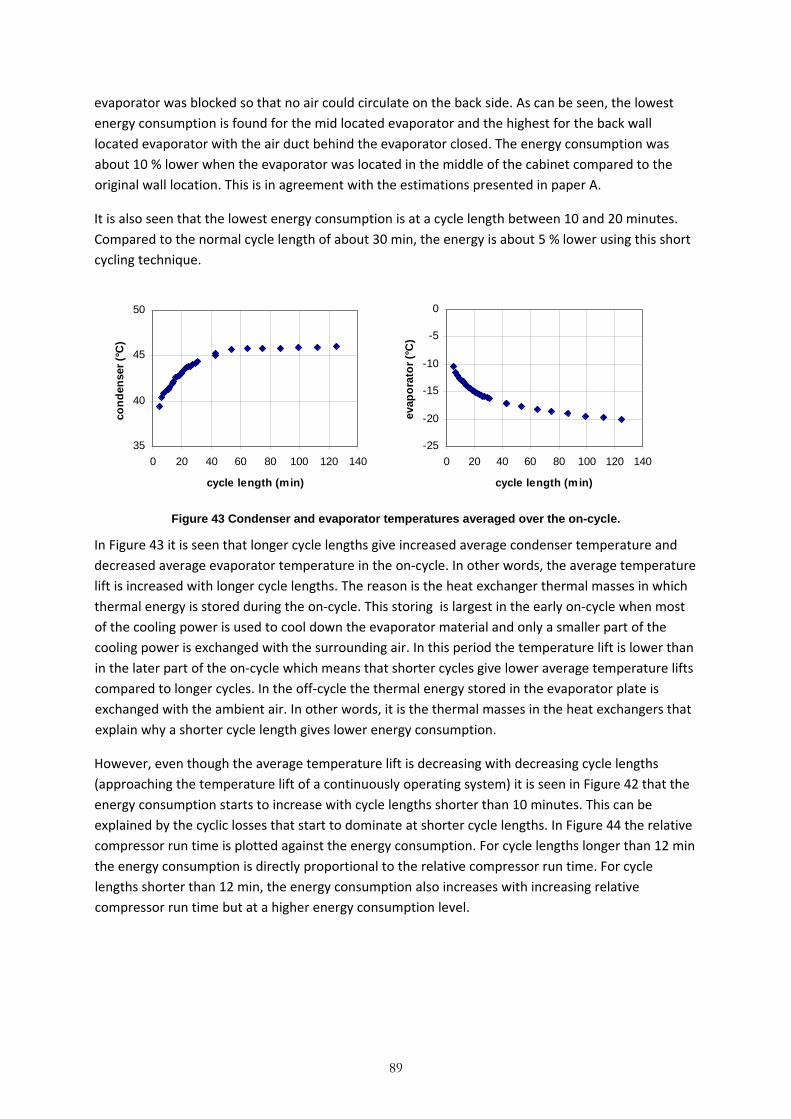
Abstract This thesis is based on eight articles all related to the characteristics of the cooling system and plate evaporator of a household refrigerator. Through these articles, knowledge is provided that can be used to increase the operational efficiency in household refrigeration. Papers A, B and C focus on heat transfer and pressure drop in a commonly used free convection evaporator – the plate evaporator. Applicable correlations are suggested on how to estimate the air side heat transfer, the refrigerant side pressure drop and the refrigerant side heat transfer. Papers D, E and F hold a unique experimental study of the refrigerant charge distribution in the cooling system at transient and steady state conditions. From this cyclic losses are identified and estimated and ways to overcome them are suggested. In paper G the topic “charging and throttling” is investigated in an unparalleled experimental study based on more than 600 data points at different quantities of charge and expansions device capacities. It results in recommendations on how to optimize the capillary tube length and the quantity of refrigerant charge. Finally, Paper H holds a thermographic study of the overall cooling system operating at transient conditions. Overall, a potential to lower the energy use by as much as 25 % was identified in the refrigerator studied. About 10 % was found on the evaporator’s air side. 1‐2 % was identified as losses related to the edge effect of the evaporator plate. About 8 % was estimated to be cyclic losses. About 5 % was found in cycle length optimization. It is believed that most of these findings are of general interest for the whole field of household refrigeration even though the results come from one type of refrigerator. Suggestions of simple means to reduce the losses without increasing the unit price are provided within the thesis.
Sammanfattning Avhandlingen innehåller åtta artiklar som behandlar karaktäristiken hos kylsystemet och förångaren i ett hushållskylskåp. I artiklarna finns kunskap som syftar till att minska elenergiförbrukningen i kyl och frysskåp. Artiklarna A, B och C fokuserar på värmeöverföring och tryckfall i en vanligt förekommande kylskåpsförångare. Användbara beräkningssamband föreslås vilket är viktiga redskap för den som vill utforma förångare med hög effektivitet. Artiklarna D, E och F fokuserar på kylsystemets köldmediefördelning från vilka de cykliska förlusterna identifieras och uppskattas. I artikel G undersöks hur systemets energiförbrukning beror av systemets fyllnadsmängd och strypning. Resultatet är rekommendationer om hur dessa parametrar ska optimeras. Artikel H innehåller en termografisk studie av kylsystemet under cyklisk drift. Totalt identifierades en potential att minska energiförbrukningen med motsvarande ca 25 % i det undersökta kylskåpet. Omkring 10 % återfanns på förångarens luftsida. 1‐2 % var kantförluster på kylskåpsförångaren. Omkring 8 % var cykliska förluster. Ca 5 % lägre energiförbrukning erhölls med kortare cykellängd. Resultaten har ett allmänt intresse för hela kyl‐ och frysskåpsbranschen även om resultaten kommer från studier av ett kylskåp. Avhandlingen innehåller förslag på enkla åtgärder som syftar till att minska de identifierade förlusterna utan att öka kylskåpets pris.
Acknowledgement This research project has been financed by the Swedish National Energy Agency (Energimyndigheten) and Electrolux AB through the research programs Klimat 21 (1998‐2001) and EffSys (2001‐2004), both focusing on energy systems based on heat pumping technologies.
Special thanks are directed to my supervisor at KTH, Professor Dr Björn Palm, who patiently have been awaiting this thesis to be finalized and to Professor emeritus Eric Granryd for thorough manuscript review and warm support.
Special thanks are also directed to Benny Andersson for experimental help and scientific discussions. Benny was employed for a long time at the Electrolux R&D household refrigeration department and had very valuable hands‐on experience within the field.
From Electrolux AB, Dr Per Wennerström appeared as supervisor. Klas Andersson and Leif Strindberg played important roles at the project start‐up.
Many persons have provided experimental help, interesting scientific discussions and other support during this project. Among them are Joachim Claesson, Peter Hill, Benny Sjöberg, Karl‐Åke Lundin, Per Lundqvist, Jan‐Erik Nowacki, Richard Furberg, Jaime Arias, Hans Havtun, Rahmatollah Khodabandeh, Åke Melinder, Inga Du Rietz, Nabil Kassem, Primal Fernando, Sanheeva Witharana, Wilmosiri Pridasawas, Yang Chen, Monika Ignatowicz, Raul Anton, Claudi Calizzo, Jörgen Wallin, Getachew Bekele, Ehsan Haghigi, Cecilia Fransson, Anders Johansson, Hatef Madani, Mumayun Maqbool, Gunne Eriksson, Fredrik Lagergren, Martin Forsén, Paul Westin, Samer Sawalha, Oxana Samoteeva, Wahib Owhaib, Rashid Ali, Aleh Kliatsko, Marino Grozdek, Arrie Setiawan, Arturo Carrera, Johan Nordenberg, Anders Herolf, Anders Nilsson, Alexandre Rücker, Aumnad Phdungsilp, Elin Isgren, Shota Nozadze, Dimitra Sakellari and perhaps someone else that I have forgotten.
Finally, to my wife Ewa and my children Klara and Åke; You are the best!
4
Table of Contents Abstract ............................................................................................................................................... 3
Paper A: Air side heat transfer of a domestic refrigerator plate‐type evaporator ....................... 33
Temperature probe measurements.................................................................................................. 34
Frost formation mass and heat transfer ....................................................................................... 39
Refrigerant side heat transfer ....................................................................................................... 41
Paper B: Flow boiling heat transfer at low flux conditions in a domestic refrigerator evaporator....................................................................................................................................................... 42
Refrigerant side pressure drop...................................................................................................... 46
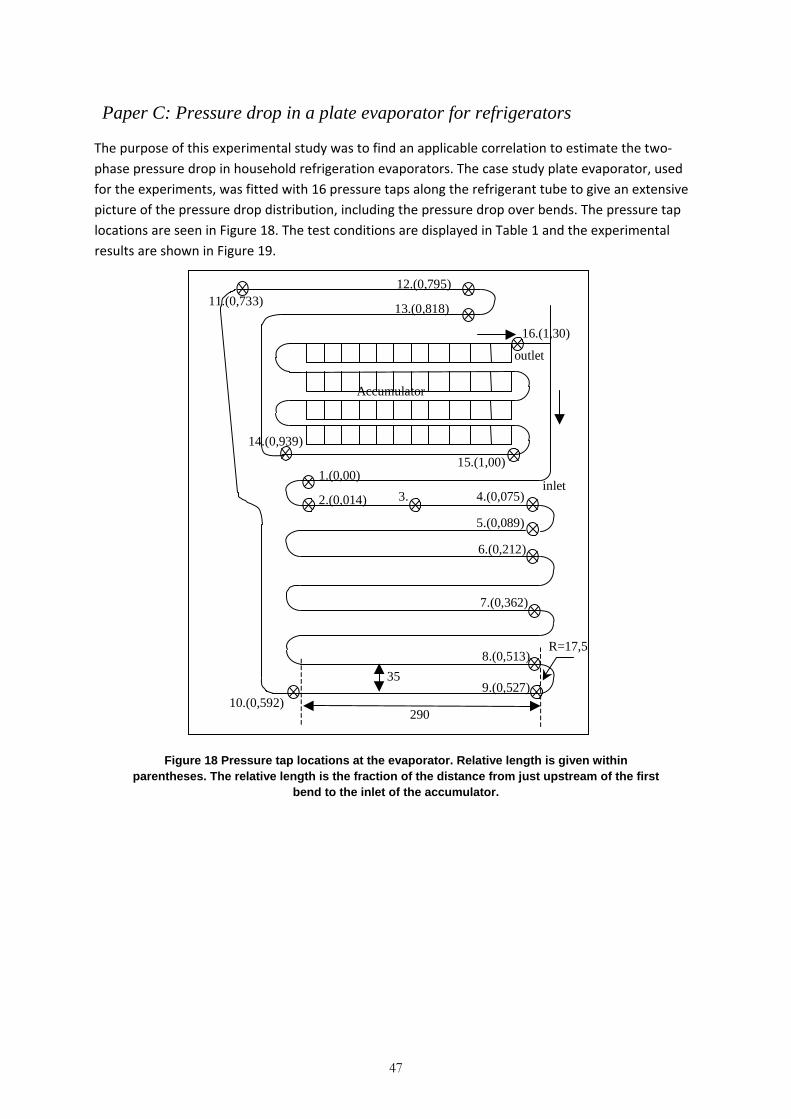
Paper C: Pressure drop in a plate evaporator for refrigerators .................................................... 47
PART II: Characteristics of the Cooling System.................................................................................. 55
The on‐off cycling .......................................................................................................................... 56
The cooling system at steady state ............................................................................................... 58
5
Paper D: A simple technique for refrigerant mass measurement ................................................ 60
Paper E: Refrigerant mass charge distribution in a domestic refrigerator. Part I. Transient conditions ...................................................................................................................................... 62
Paper F: Refrigerant mass charge distribution in a domestic refrigerator Part II: Steady state conditions ...................................................................................................................................... 68
The subject of charging and throttling .......................................................................................... 71
Paper G: Performance of a domestic refrigerator under influence of varied expansion device capacity, refrigerant charge and ambient temperature ............................................................... 72
Paper H: A thermographic study of the on‐off behaviour of an all‐refrigerator........................... 78
4. Other activities carried out within the research project................................................................... 84
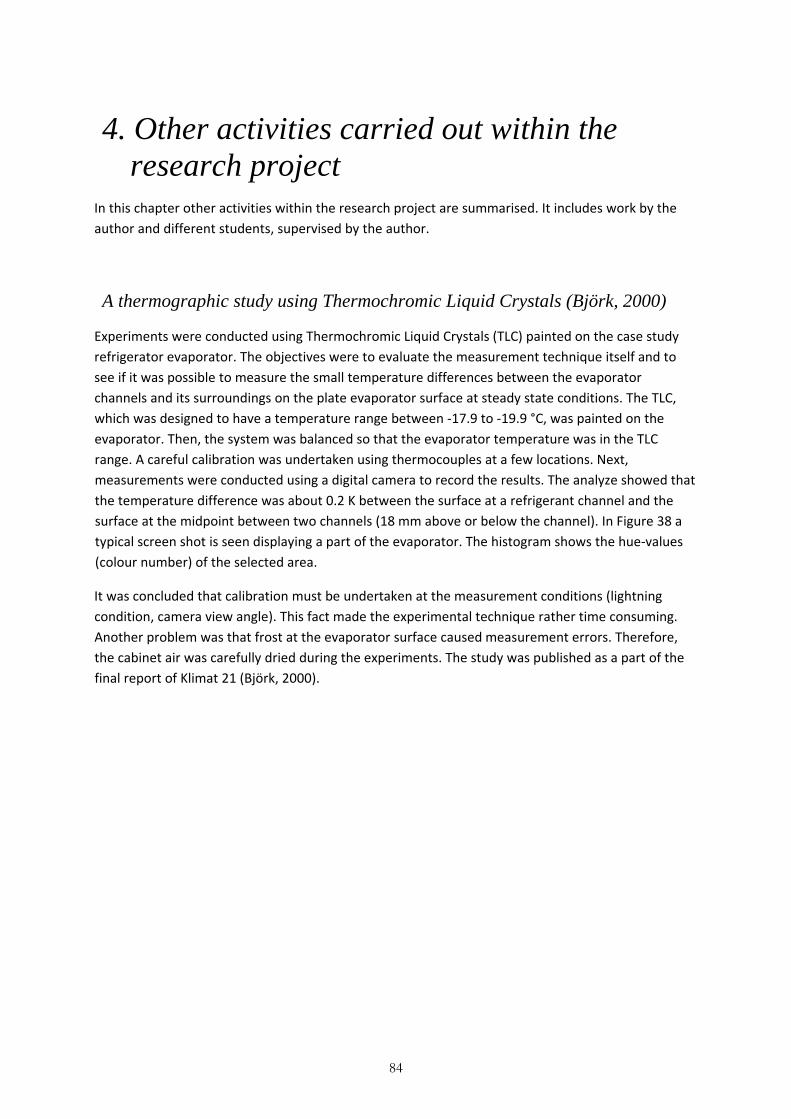
A thermographic study using Thermochromic Liquid Crystals (Björk, 2000).................................... 84
The observation glass evaporator (Björk, 2000) ............................................................................... 85
Thesis outline This doctoral thesis is outlined as a compilation thesis (in Swedish sammanläggningsavhandling) which means that a number of published scientific articles are attached to an introduction part (in Swedish kappa). The purpose of the introduction part is to present the research problems, goals, methods and results and to show the relevance of the attached articles to the completeness of the thesis.
The introduction part is subdivided into 5 chapters. The first chapter introduces the reader to the subject of household refrigeration and the race for energy efficiency. It also holds the aim and scope of the project. In chapter 2 the case study refrigerator, which is used for most of the experiments, is described. Chapter 3 is a summary of the thesis’s eight scientific articles. This chapter is further subdivided into part I, which deals with heat transfer and pressure drop of the evaporator studied, and part II, which deals with the overall cooling system behaviour. Chapter 4 summarizes other work carried out within the research project relevant to the thesis. In chapter 5, the overall thesis results are summarized together with some conclusions that can be used to make tomorrow’s refrigerators and freezers less energy consuming. Finally, in the appendix the articles on which this thesis is based are collected.
Thesis articles The eight articles listed on the next page can be found in full text in the thesis appendix.
Papers A to C are devoted to the characteristics of a household refrigerator evaporator. More specifically: Paper A concerns the air side heat transfer. Paper B concerns the refrigerant side heat transfer. Paper C concerns the refrigerant side pressure drop. The results are given in the form of recommended correlations to calculate heat transfer and pressure drop.
Papers D to H focus on the cooling system characteristics. Paper D describes an experimental method on how to measure the refrigerant charge in different parts of the cooling system. This method was developed to obtain the experimental results used in papers E and F. In paper E the refrigerant charge distribution was measured at transient conditions. In paper F it was measured at steady state conditions. Paper G is a parametric study of the cooling system at varied throttling and charging conditions. Finally, Paper H gives an overall view of the cooling system characteristics as seen through an infra‐red camera.
7
A. Björk E., Setiawan T., S., Palm B., 2003, Air side heat transfer of a domestic refrigerator plate‐type evaporator. Presented at The Eurotherm Seminar No 72, Valencia, Spain
B. Björk E., Palm B., 2008, Flow boiling heat transfer at low flux conditions in a domestic refrigerator evaporator. International Journal of Refrigeration 31, pp. 1021‐1032
C. Björk E., 2002, Pressure drop in a plate evaporator for refrigerators. Proc. 1st International conference on Heat Transfer, Fluid Mechanics and Thermodynamics (HEFAT), Kruger National Park, South Africa
D. Björk E., 2005, A simple technique for refrigerant mass measurement, Applied Thermal Engineering 25, pp. 1115–1125.
E. Björk E., Palm B., 2006a, Refrigerant mass charge distribution in a domestic refrigerator. Part I. Transient conditions, Applied Thermal Engineering 26, pp. 829‐837
F. Björk E., Palm B., 2006b, Refrigerant mass charge distribution in a domestic refrigerator. Part II. Steady state conditions, Applied Thermal Engineering 26, pp. 866‐871
G. Björk E., Palm B., 2006c, Performance of a domestic refrigerator under influence of varied expansion device capacity, refrigerant charge and ambient temperature. International Journal of Refrigeration 29, pp. 789‐798
H. Björk E., Palm B., 2010, A thermographic study of the on‐off behaviour of an all‐refrigerator, Applied Thermal Engineering 30, pp 1974‐1984.
The major work in all of these papers were made by the first author except in paper H which is based on a master thesis work by Mr Johan Nordenberg (Nordenberg, 2001). In paper A experimental help was provided by Mr Arrie Setiawan. In paper G experimental help was provided by Mr Gunne Eriksson. Dr Björn Palm appears as co‐author in papers A, B, E, F, G and H following the tradition of acknowledging the role of the supervisor. His contribution to the papers was mainly manuscript review.
8
1. Introduction
Background Household refrigerators and freezers are found in almost every home in the industrialized parts of the world and in increasingly larger number elsewhere. It is estimated that the global annual production is more than 90 million units (Harrington, 2009). In Asia the annual production is about 45 million units with China alone accounting for more than 30 million units. Production in Europe is around 25 million units and North and South America is about 20 million units a year. With an expected lifetime of 10 to 20 years the stock of household refrigerators and freezers operating in this moment is more than one billion units. Evidently this gives a significant impact on the global energy consumption. In Sweden household refrigeration is the second largest consumer of electricity in the average household (Energiläget, 2009). The department of energy in the U.S.A. estimated that household refrigeration is responsible for 7.2 % of the average household energy consumption (Bansal et al., 2011). Melo and Silva estimated that about 6 % of the produced electrical energy is used by household refrigerators and freezers worldwide (Negrao and Hermes, 2011). Thus, it is not surprising that household refrigeration is a target for energy consumption controls in the EU and in many countries around the world. Internationally, there are about 60 countries world wide that have some sort of program to regulate the energy efficiency of refrigerators and freezers, mostly in the form of mandatory comparative energy labelling and Minimum Energy Performance Standards (MEPS). These programs have proven to be an effective tool to reduce the energy consumption (Mahlia and Saidur, 2010). Within Europe, the European commission directive of 1994 (94/2/EC) made it compulsory to energy label household refrigerators and freezers. The objective with this was to encourage consumers to favour appliances and equipment with high electrical efficiency, thus encouraging the producers to improve the efficiency of their appliances. Furthermore, in the directive of 1996 (96/57/EC) on energy efficiency requirements, the most energy consuming units were banned. For the producers the message was clear: energy efficiency is important! Two technologies are often discussed as tools to significantly increase energy efficiency in the next generation household refrigeration units; vacuum insulation panel and variable speed compressors. However, among other technical barriers such as uncertainties about performance and reliability over a typical life expectancy of approximately 20 years (Bansal et. al., 2011), these techniques are expensive which have so far prevented a wide introduction on the market. Even though energy consumption is an important factor for the consumer, the first cost, as seen on the price tag is often the most important. Therefore it is interesting to explore other low cost solutions to lower the energy consumption. Of course, if such solutions can increase the operational efficiency without increasing the unit price it is even better. Moreover, such solutions can in most cases be combined with variable speed
9
compressor or vacuum insulation panels, which might be more common in the future, to achieve an even higher efficiency. From the second law of thermodynamics it is known that the efficiency of a heat pump system, which is the key technology used in household refrigeration, depends on the temperature levels at the cold side evaporator and the warm side condenser. A higher evaporation temperature or a lower condensation temperature gives higher system efficiency. In other words, a smaller temperature lift from the cold to the warm side increases the system efficiency. This also means that the efficiency of the heat exchangers, in terms of operating with small temperature differences, is important for the overall efficiency. The governing equation for the ideal Carnot cycle operating as a cooling machine is:
21
2
TTT
COPCarnot −= (1)
Where T is temperatures in Kelvin and 1 and 2 denotes the temperatures at the high and low temperature side.
COP stands for Coefficient of Performance which, for a cooling machine, is defined as the ratio between the useful cooling energy and the needed work:
workenergycooling
COP = (2)
Obviously a high COP is desirable. With a typical refrigerator storing temperature of 5°C and an ambient temperature of 25°C the COP ideally becomes 13.9 (Eq. 1). This would however require that the heat exchangers (evaporator and condenser) are at the same temperatures as their surroundings, which only could be achieved with heat exchangers having infinite surface areas. In practice, cost and size limitations give heat exchangers that must operate with a temperature difference to their surroundings, and thus the system must operate with a larger temperature lift compared to the ideal case.
10
Figure 1 The refrigeration cycle plotted in a h-log(p)-diagram. The heat exchanger pressure drops are illustrated through the inclined evaporator and condenser temperatures
(somewhat exaggerated in the figure). Temperatures are at typical levels for a household refrigerator.
With an evaporation temperature of ‐15°C (delta T 20 K to the surrounding air on the evaporator side!) and a condensation temperature of 40°C (delta T 15 K on the condenser side!), which can be taken as normal values, the COP ideally becomes 4.71 (Eq. 1). It is seen that the temperatures play a large role for the system efficiency and thus that the heat exchanger efficiency, in terms of having small temperature differences to their surroundings, is important. For instance, from equation 1 it can be calculated that for a household refrigerator the efficiency increases about 2.2 % for each degree higher evaporation temperature2 . Using typical freezer temperatures (40°C/‐25°C) the increase of the COP for an ideal refrigerant cycle is about 2.1 % per degree increased evaporation temperature. It is clear that any improvement to the evaporator that will decrease the temperature lift will give higher system efficiency.
It is also known that capacity control by intermittent run (on‐off cycling) lowers the overall efficiency. These so called cyclic losses can partly, but not fully, be explained with the temperature losses that was discussed in the previous paragraph. For example, at start‐up refrigerant is redistributed over the heat exchangers during which the capacity and efficiency is lowered. This effect, caused by
(‐15°C)
(5°C)
(25°C)
(40°C)
Surrounding temperature
Ideal temperature lift
Actual temperature lift made by compressor
Pressure (temperatures in two phase region)
Enthalpy
Cabinet air temperature Temp.diff. from heat resistance at air side
Temp.diff. from heat resistance at refrigerant side and pressure drop
1 It is interesting to note that one relation (Granryd et al., 1999) indicates that the real COP is about 40 % of the ideal “Carnot” COP for a small 1 kW cooling system. If this number is used in the example given the COP for the real refrigerator should be 40 % of 4.7, or about 1.9. This can be compared to normal values of the COP in household refrigerators of about 1-3.
2 In fact, inspection of compressor data indicates an even higher increase of 3 %/K in some cases. Therefore, in the following, 2-3 %/K will be used as the estimated variation in efficiency with varied evaporation temperature
11
improperly charged heat exchangers, operating with superheat and subcooling, means increased temperature lift and thus lower system efficiency. An example of another kind of loss, not related to temperature difference, is after the compressor shuts down, when the system pressure equalizes and refrigerant flows from the condenser to the evaporator. This adds latent heat to the refrigerated space.
12
Aim and scope The purpose of this work is to provide knowledge that can be used to increase the operational efficiency in household refrigerators and freezers.
The focus has been the characteristics of a free convection plate evaporator and of the cooling system of a household refrigerator. For the evaporator, the concern was to find applicable correlations to predict heat transfer and pressure drop; internally in the refrigerant tube and externally on the air side. For the cooling system a better understanding in general was sought with some key questions in mind.
Research questions The following research questions can be formulated:
What relationships should be used to predict
‐ The air side heat transfer of a typical free convection plate evaporator?
‐ The refrigerant side heat transfer?
‐ The refrigerant side pressure drop?
These relations are important when designing highly efficient cooling systems. As was already mentioned in the first chapter the thermodynamic laws state that the temperature lift from the cold side evaporator to the warm side condenser should be as small as possible. It has been found that the efficiency increases by 2‐3 % when the evaporation temperature increases 1°C. It follows that the temperature difference between the storage volume in the household refrigerator and the evaporation temperature should be as small as possible.
How is the refrigerant charge distributed in the cooling system at transient and steady state conditions?
The knowledge from these questions is essential to estimate and understand the cyclic losses and to find means to reduce them. It is also expected that the results would contribute to a deeper understanding of the cooling system behaviour.
How does the efficiency depend on the quantity of charge and the expansion device capacity?
This is a classical topic within household refrigeration. It is a common belief that an optimum exists, resulting in the lowest energy consumption for a certain combination of charge and capillary tube capacity. The result may tell if there exist a large potential for energy saving just by finding another combination between quantity of charge and capillary tube length.
13
Research methodology The results of this thesis are mainly based on experimental work. Pure simulations using state of the art tools (FEMLAB) were also used, but to a lesser extent. At an early point in the research project it was decided to use one type of household refrigerator as a case study. Most experiments were therefore conducted on this refrigerator, more or less modified for the experiments. The Electrolux refrigerator ER8893C can be described as a free convection, cycle defrost, on‐off controlled, single‐door, upright, all‐refrigerator. In short this means that no fans are used at the heat exchangers, that defrost occurs when the compressor is at rest without additional heating and that temperature is controlled by the compressor simply switching on and off. The reason for selecting this refrigerator as the case study test object was that it was a common product on the Swedish and European market. Obviously such decision is always open for criticism. One benefit of having the same type of test object for different experiments is that comparison between tests is possible. It should also be mentioned that the difference between the cooling systems in this refrigerator and the cooling system in other refrigerators or freezers (or combinations) in reality is small. Typically a freezer has lower evaporation temperature and higher capacity than a pure refrigerator. Different types of heat exchangers are also used (forced convection and free convection). Therefore, in many cases it is possible to draw general conclusions from the case study results that are applicable for the whole field of household refrigeration.
Different experimental studies were conducted; flow visualization of the refrigerant flow through an observation glass evaporator, thermo‐graphic study of the overall cooling system including the heat exchangers, heat transfer and pressure drop measurements in the evaporator, heat transfer measurements at the evaporator air side, charge inventory at different parts of the cooling system, parametric study of varied refrigerant charge and expansion device capacity. In one case a separate experimental setup with an isolated test section was used. This was to measure the refrigerant side heat transfer which called for a more controlled environment.
The most important results of the various experiments were published in reviewed journal articles and conferences relevant to the research field.
14
The need for refrigerated space It is estimated that one third of all perishable food is lost in one way or another (Lorentzen, 1978). Although other food preservation technologies exist, such as ionising radiation, modified atmosphere, chemical preservatives, freeze drying, high hydrostatic pressure etc. (Zhou et al., 2010) refrigeration and freezing is probably the technique causing the least change from the fresh state in terms of nutrition and taste.
Moreover, a fast growing population, urbanisation, a need to even out seasonal variations in production and sales, and a food industry that needs to produce in locations distant from the consumers are all factors that create a large demand for refrigerated storage space. Hence, refrigeration as a food preservation technology has become an important industry over the last century.
It is a well known fact that almost all processes in nature run more slowly at lower temperatures. This knowledge is widely used within food preservation.
Figure 2 shows the result of a test panel who has judged the acceptable storing time for different kinds of food at different temperatures. It is seen that lower temperatures give longer storing times.
Time (days)
Temperature (° C)
1: Chicken a) good packing b) bad packing c) cut and fried
2: Fat fish
3: Lean fish
4: Beef
5: Orange
6: Apple a) normal storage b) storage in CO2 atmosphere
7: Egg
8: Banana
9: Peas
10: Raspberry
11: Strawberry
Figure 2 The time of storage for different kind of food until the first sign of deterioration is detected in taste or quality. Adopted from Granryd et al. (1999).
As a rule of thumb, the time for a certain chemical process doubles if the temperature is decreased by 10 °C. Looking in the diagram, it is seen that this rule of thumb holds as a rough estimation of the acceptable storing time for all the listed foods except for Raspberry and Strawberry.
15
In a more detailed view the processes responsible for the gradual deterioration can be grouped in four different processes, which are all affected by the temperature (Lorentzen, 1978).
1. Metabolic processes that slow down with lower temperature and stop completely when the tissue is frozen.
2. Physical processes which follow precise laws. Surface drying is proportional to the vapour pressure difference between the surface, whose pressure follows the saturation pressure curve, and the vapour pressure in the atmosphere above the surface, whose pressure also depends on the relative humidity in the air. With lower temperatures, this difference is bound to be smaller and thus less surface drying occurs. Freezing of tissues can in some cases be detrimental since the cell walls in the frozen tissue can be damaged by the ice crystals that are formed in the freezing process. It has been found that the ice crystals are smaller in a more rapid freezing process compared to a slower one. Therefore one should strive for a rapid freezing process. Another effect upon freezing is that concentration of salts may appear in the remaining, unfrozen, liquid, which lowers the freezing point at these locations.
3. The chemical processes approximately follow exponential temperature dependence. However, factors such as availability of oxygen and enzymes intervene.
4. The microbiological processes are diverse and depend besides temperature of the sanitary conditions and the humidity. Each of the thousand strains of bacteria has its own growth curve, having its own activity maximum and a lower temperature threshold where activity is strongly reduced. The human pathogens have their activity maximum at about 310K (37 °C) and their lower threshold at 273K. At typical freezing temperature (255K) they are completely inactivated, but will activate as soon as the temperature rises above the lower threshold.
In living products such as fruit, vegetable, cheese and egg the biological process (1) dominates. For non‐living but unfrozen products (such as chilled beef, fish or chicken), the microbiological processes (4) dominate. In the case of frozen products (living or dead) at lower temperatures than about 263K the deterioration is purely caused by physical (2) and chemical (3) processes.
16
Historical remarks Prior to the invention of the household refrigerator snow and ice were used to refrigerate and preserve food. Historically, ancient cultures (Chinese, Hebrews, Greeks, Romans, and Persians) stored snow and ice throughout the year in different types of ice houses or covered wells. The ice was harvested from winter lakes or was brought down from the mountains. Later, ice boxes were used in homes in which the ice were stored to keep the internal box cold. This highly work intensive transport of thermal energy existed at least into the 1950s when it was outclassed by the household refrigerator. In 1958, 94 % of the U.S households owned refrigerators (Radermacher and Kim, 1996). Today almost all modern homes have household refrigerators, typically powered by electricity and operating by the vapour compression cycle.
Figure 3 Ice harvesting in Spy Pond in the 19th century (from Wikipedia public domain)
In 1834, Jacob Perkin developed the first vapour compression operated refrigeration machine, using ether as refrigerant. However, a number of developments were still needed to make the refrigerator a standard appliance in the normal household. The wiring of homes with electricity, the development of smaller electrical motors, the hermetically sealed unit that eliminated the belt, the halogenated hydrocarbon used as refrigerants that made it possible to use a simple capillary tube as expansion device and eliminated the risk of explosions, poisoning and unpleasant smells, are some of the important steps taken (Radermacher and Kim, 1996).
In 1974 it was found (Molina and Rowland, 1974) that the chlorinated refrigerant used up to then, R12 (also named Freon 12), accumulated in the stratosphere where it damaged the ozone layer that shields the earth from cancer causing ultra violet solar radiation. Another halogenated refrigerant HFC‐R134a was therefore introduced, having similar properties as R12. This refrigerant is the preferred choice today in the U.S, and some other countries of the world as it is a non‐flammable
17
refrigerant. However, it has also been found that this refrigerant contributes to the global warming and therefore another refrigerant is the preferred choice in Europe and in many other countries. This refrigerant, Isobutane (HC‐R600a), is a non‐halogenated hydrocarbon refrigerant. To handle the flammability of this refrigerant, safety regulations stipulate how the refrigerator should be designed to avoid fire, including leak protected cooling systems and spark free electronics (Gigiel, 2004).
Configurations in Household Refrigeration Household refrigerators & freezers are thermally insulated compartments in which food can be stored at reduced temperatures hereby extending the shelf life. The refrigerator (or fridge) has a storing temperature above 0 °C (typically 0 to 10 °C) making it suitable for fresh food and vegetables. The freezer has a temperature below 0 °C (typically ‐6 to ‐18 °C) making it suitable for frozen food and longer storing times. Normally, there also exist special‐purpose compartments within the refrigeration unit to provide a more suitable environment for storage of specific food. For example, a warmer compartment for maintaining butter is often found in the refrigerator door. A high‐humidity compartment for vegetables and fresh food are also common in a refrigerator.
Refrigerators and freezers are available in several styles. All‐freezers can be found as upright freezer or as chest freezer. Combinations of refrigerators and freezers can be found as top‐freezers, bottom‐freezers, side‐by‐side or as a separate freezer compartment located within the larger refrigerator compartment. All‐refrigerators, which the case study in this work is an example of, are typically upright3.
The configurations vary considerably by region, but at a global level, top freezers are the most common (nearly 40 %), bottom freezers are next at about 33 % and side‐by‐side combinations are about 13 %. The remaining types are mostly all‐refrigerators or other configurations including separate freezer compartments (Harrington, 2009). Qualities that are desirable in a good cabinet are, according to the ASHRAE handbook (2010):
1. Maximum food‐storage volume for the floor area occupied by the cabinet 2. The best in utility, performance, convenience, and reliability 3. Minimum heat gain 4. Minimum cost to the consumer
Other ways to classify the household refrigeration units is how heat is transferred at the heat exchangers. The difference between natural convection and forced convection is that no fan is used in the first case. Sometimes natural convection heat exchangers are referred to as “static” or “passive”. The opposite, forced convection heat exchangers, are sometimes referred to as “dynamic” or “active”. The way to defrost is either automatic or manual. In automatic defrosting one can separate cycle defrost (where defrosting occurs in the off‐cycle) from the heater defrost (where a heater is activated during defrost). The cycle defrost is only possible in an on‐off cycling refrigerator where the cabinet air temperature is higher than 0 °C. In manual defrosting the defrosting must actively be started, for instance by switching on an electrical heater or by turning off the cooling system. The latter is typically used for natural convection freezers.
3 Even though chest freezers converted into all-refrigerators exist having very low energy consumption.
19
One can also separate the way to control the capacity. In on‐off cycling the compressor is switched on and off with the relative on‐cycle being longer with increasing capacities. This is the dominating technique to control capacity in household refrigeration. In variable speed capacity control the compressor is varying its capacity through speed‐modulation. However, normally in combination with on‐off cycling since it is difficult to achieve a sufficient reduction of the compressor speed to perfectly match the heat load.
The basic refrigerator The cabinet and the cooling system are the main components of a household refrigerator/freezer. Today, almost universally, polyurethane foam is used as insulation material to minimize the thermal leakage. In Europe, cyclopentane is the favoured blowing agent4 which gives a typical thermal conductivity of about 0.02 W/m K. The foam is either expanded directly into the insulation space between the plastic inner liner and the steel outer shell, which gives a rigid sandwich construction, or is used to build slabs that are mounted together to form a cabinet. The cooling system typically operates by the vapour compression principle. In Figure 4 it is seen why. The Coefficient of Performance (COP) is higher than other available techniques. It should be noted, however, that the absorption technique can also be directly operated by heat instead of electricity which in certain applications is a benefit for this technique.
4 In the U.S. HFC-245fa is used as blowing agent for safety and energy reasons. It is a non-flammable agent. Johnsson (2004) estimated that the energy consumption is 15% lower, over the entire appliance lifetime, compared to Cyclopentane.
20
Vapour compression
COP ≈ 1‐3
Absorption
COP ≈ 0.2‐0.3
Thermoelectric
COP ≈ 0.1‐0.2
Figure 4 Different cooling principles and their typical efficiencies (ASHRAE handbook, 2010 and Granryd et al., 1999). COP (Coefficient of Performance) is a quality number defined as
the ratio between the useful cooling energy and the supplied work.
In vapour compression the fixed relation between saturated vapour pressure and temperature (the vapour pressure curve) is used to create two thermal conditions; one at a high temperature where heat is rejected and one at a low temperature where heat is absorbed. By combining a compressor with an expansion device to separate a high pressure side condenser (from which heat is rejected while refrigerant is condensing) and a low pressure side evaporator (into which heat is absorbed while refrigerant is evaporating) a heat pump is formed. At the price of mechanical work, thermal energy is transferred from a lower to a higher temperature. The cooling system, used in household refrigeration, is basically a heat pump that absorbs thermal energy from the cabinet’s inside and rejects it to the outside to maintain a climate at reduced temperature.
21
compressor
evaporator
cap. tube
condenser
filte
r drie
r
compressor
evaporator
cap. tube
condenser
filte
r drie
r
++
-
Figure 5 Main components (left) and a schematic view (right) of a typical household refrigerator cooling system. The arrows show the path of the working media (refrigerant)
between the different components.
Figure 5 shows the basic components used in a vapour compression refrigerator in a “component‐depicted” and schematic view.
• The hermetic compressor is normally reciprocating with an induction split‐phase motor. It is capsulated in a robust steel shell to stand high pressure and to minimize noise. It is mounted on the bottom of the cabinet on rubber feet to further lower the noise level. The typical capacity ranges between 50 and 250 W.
• The steel pipe condenser is designed to stand high pressures. Into this the compressed refrigerant gas is pumped and brought to condensation. While doing so heat is rejected. The condenser seen in Figure 5 is a wire on tube condenser. Other common condenser types are plate on tube and various forced convection fin packages.
• After the condenser the filter drier follows. This device prolongs the system’s lifetime by filtering out particles and by absorbing water that may remain in the cooling system after manufacturing. The drier is filled with small Zeolite pellets, each with a porous, molecular sieve surface.
• Next, the capillary tube follows. This is basically a narrow pipe section through which the throttling or expansion occurs. The thin copper tube (d = 0.33‐1.5 mm, L = 2‐5 m) restricts the refrigerant flow and maintains a pressure differential between the high and low pressure side of the system. Besides being a simple and reliable low cost component the capillary tube allows the system pressure to equalize in every off‐cycle, which reduces the starting torque requirement of the compressor. Typically a part of the capillary tube is heat exchanged with the suction line using a suction line heat exchanger (SLHX) in order to avoid external
Suction line heat exchanger
-Suction line heat exchanger
22
sweating (water condensation on the suction line surface close to the compressor) and to increase the overall efficiency.
• Finally, the evaporator follows. This is made of aluminium to prevent corrosion. In this, refrigerant is vaporized while heat is absorbed from the internal cabinet. An accumulator is located at the evaporator outlet, either as an integrated part of the evaporator or as an external device. To complete the cycle, the refrigerant vapour is being sucked back to the compressor where it is compressed. As was mentioned in the previous point, this suction line runs in parallel with the capillary tube to form a suction line heat exchanger. Other types of evaporators are wire on tube (freezers) and various fin packages (forced convection).
• Not shown in the Figures is the refrigerant. Today, following the phase out of Ozone depleting refrigerants, the refrigerants used are R134a and Isobutane (R600a). A typical quantity of charge is 20‐200 g.
Overall, one can summarise that the cooling systems in household refrigeration are characterized by low cooling capacities (50‐250 W), low quantities of refrigerant charge (20‐200 g), a refrigerant accumulator located at the evaporator outlet, a hermetically sealed cooling system, a capillary tube expansion device which is in heat exchange with the suction line, and a cooling capacity typically controlled by intermittent run (on‐off cycling).
23
Historical remarks about energy use reduction When refrigerators and freezers became common in the average household the need to lower their energy consumption was brought on the agenda. Different factors have contributed to the decreased energy consumption that is seen in household refrigeration since the 1970’s. The 1974 energy crisis highlighted the energy conservation topic in general. The following increase in energy prices motivated the consumer to buy low energy products. Moreover, legislation has obliged producers to declare the energy consumption of their products measured at standardized conditions. This made it much easier for the end user to compare energy consumption before buying a product. Additionally, different energy programs have pushed the most energy consuming units out of the market. Examples of energy declarations are seen in Figure 6.
Figure 6 Examples of energy declaration in Europe and USA
Rosenfeld (1999) showed that the average energy use in U.S. refrigerators increased from less than 400 to 1800 kWh/year from 1947 to 1974. In the same period the internal volume grew from 8 to 18 cubic feet (226 to 510 l). After 1974 the average volume has only slightly increased to 20 cubic feet (566 l) while the energy use has decreased sharply. In the year 2000 the average energy use was about 600 kWh/year, which is only a third of the energy consumption that was seen in the peak year of 1974. The explanations for the reduced energy use since 1974 are new energy policies and the introduction of the blown‐in foam insulation technology.
24
Figure 7 shows the energy consumption of household refrigerators, freezers and combinations (refrigerator‐freezer) in Sweden 1980‐2000. As can be seen, the energy reduction is significant over the period. For the refrigerators the reduction is more than 30 %. For the freezers and combinations the reduction is about 50 %. After the year 2000, the trend has continued. In 2012 the average energy consumption of a 250 l product was about 0.45 kWh/24h (refrigerators), 0.81 kWh/24h (combinations) and 0.80 kWh/24h (freezers).
Figure 7 Average energy consumption on the Swedish market for a 250 l product. Data from the Swedish Consumer Agency.
25
Figure 8 shows some of the most important modifications that have been used to lower energy consumption during the last decades. The modifications are primarily taken from Electrolux AB products and do not fully represent a worldwide view of the subject.
The most significant reduction was achieved by better and thicker insulation material. During the 1960´s, the insulation material was changed from mineral wool and cork to polyurethane foam. This change lowered the heat leakage by around 50 %. In addition, the general wall thickness has increased from around 25 mm to 40 mm thus lowering the heat leakage even more.
+
-
More material inwindings and stator,run capacitor
Larger heat-exchangers
Milk
Plasticmuffler
el.motor
Semi-direct intake
Thicker and moreeffective insulation
Figure 8 Some of the modifications that have increased the energy efficiency during the last decades.
The physical size of the heat‐exchangers has typically increased over the years. By doing this, the temperature lift is decreased thus increasing the system efficiency. However, many refrigerators sold today contain foamed‐in evaporators, which from an energy point of view is a poor solution.
The compressor efficiency has been increased by different means. The electrical efficiency (indicating how good the electrical energy is transformed into mechanical work) has been increased by more material in the windings (copper) and in the stator (steel). The cylinder inlet gas temperature has been reduced by semi‐direct intake and a plastic muffler. This increases the compressor isentropic efficiency (indicating how ideal the compression is). A run capacitor is often added to permit the compressor start winding to give a helping torque even at running conditions.
As was already mentioned in the first part of the introduction, techniques exist to further reduce the energy consumption, but the increased cost has so far prevented a wider break through. A shift from polyurethane foam into vacuum panels as wall insulation could reduce the heat leakage to half and so the energy consumption. Another advancement may be a shift into brushless, variable speed compressor motors. They have significantly higher electrical efficiency and also permit the compressor speed to be varied. This way the average heat leakage can be matched with a lower cooling capacity, thus lowering the temperature lift and increasing the system efficiency.
26
2. The refrigerator used in the case study
ER8893C is a single compartment upright household all‐refrigerator. The declared energy consumption is 0.68 kWh/24h (energy class B). It has the following typical data (Small variations occurred with different specimens used in the experiments. Consult the various papers for a more detailed description):
Cabinet: (External dimensions: 1.75× 0.6× 0.6 m and 0.04 m wall thickness), 350 l internal volume, UA value 2.3 W/K.
Evaporator: free convection, (0.66× 0.49× 0.0014 m), aluminium, plate type, back wall located (20‐25 mm distance to back wall), integrated downstream located accumulator. Refrigerant line length (including accumulator) 6.02 m. Internal hydraulic diameter 3.2 mm. Total internal volume 114 ml whereof accumulator volume 46 ml in which approximately half the volume can store liquid at steady state condition. UA value about 3.7 W/K.
Condenser: free convection, (1.33 × 0.51 × 0.008 m), steel, wire on tube (53 vertical wires on each side of the tubing, each of diameter 1.5 mm) positioned with 25 mm distance to the cabinet back wall. The refrigerant flow is horizontally downward (see Figure 9). Internal volume 135 ml. Internal/external tube diameter 3.5/5.0 mm. UA value about 7.7 W/K (condenser in original location and cabinet located against a wall)
Capillary tube expansion device (2.54 m length and 0.60 mm internal diameter) with coaxial type suction line heat exchanger of 2 m length. The capillary tube adiabatic inlet and outlet sections are 0.5 and 0.04 m.
Filter drier: molecular sieve with internal free volume 11.3 ml. Piston compressor (HL60AH, ZEM HQY70AA and HQY75AA) with low pressure oil sump and
ca 265 ml mineral oil charge. Cooling capacity (HQY70AA) 118 W and COP 1.49 at ASHRAE conditions (55/‐23.3 °C).
Refrigerant: nominal refrigerant charge 33 to 36 g of Isobutane (R600a) Capacity control by intermittent run (on‐off cycling) with self‐defrosting in every off‐cycle
27
Evaporator
Condenser
Suction line heat exchanger
Compressor
Figure 9 Household refrigerator ER8893C front and backside.
In Figure 9 (left picture) the plate type, free convection, semi hidden evaporator is located at the upper part of the back wall in the cabinet. The picture to the right shows the condenser and the compressor at the refrigerator back side. Both pictures include some experimental equipment (thermocouples and pressure transducers).
28
660,
00
30,0
0
25,00
30,00
evaporator
30,0
0
defrost waterchute
duct behindevaporator
600,00
600,
00
496,
0024
0,00
520,00
25,0
0
duct behindevaporator
evaporator (wall position)
condenser slot
handlehandle
Figure 10 Household refrigerator ER8893C in a top and side view
In Figure 10 the household refrigerator cabinet is depicted in a top and side view including the dimensions of the evaporator. Note that the evaporator is positioned with a small distance to the back wall (ca 25 mm) as to provide for air to circulate behind the evaporator.
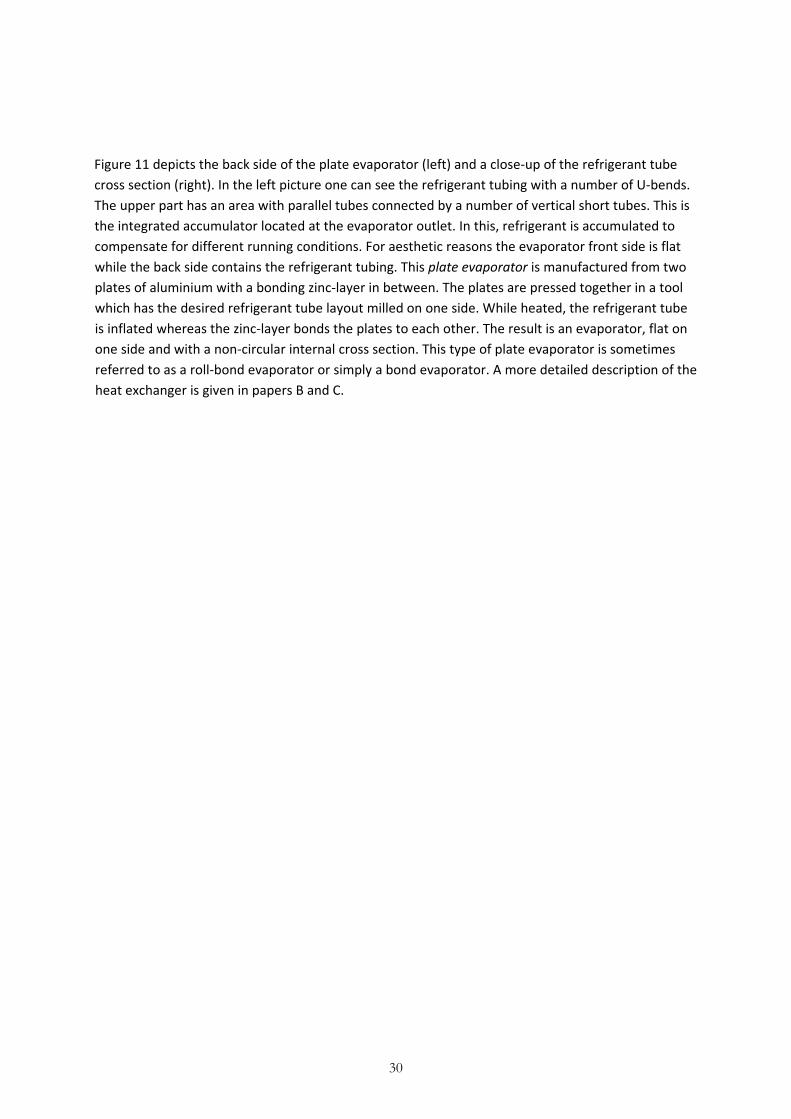
Figure 11 The left picture shows the plate evaporator back side with its integrated refrigerant channels. At the left side in this picture the capillary tube suction line heat exchanger (that connects the evaporator to the cooling system) is visible. The right picture depicts a close-
up of the refrigerant tube cross section.
29
Figure 11 depicts the back side of the plate evaporator (left) and a close‐up of the refrigerant tube cross section (right). In the left picture one can see the refrigerant tubing with a number of U‐bends. The upper part has an area with parallel tubes connected by a number of vertical short tubes. This is the integrated accumulator located at the evaporator outlet. In this, refrigerant is accumulated to compensate for different running conditions. For aesthetic reasons the evaporator front side is flat while the back side contains the refrigerant tubing. This plate evaporator is manufactured from two plates of aluminium with a bonding zinc‐layer in between. The plates are pressed together in a tool which has the desired refrigerant tube layout milled on one side. While heated, the refrigerant tube is inflated whereas the zinc‐layer bonds the plates to each other. The result is an evaporator, flat on one side and with a non‐circular internal cross section. This type of plate evaporator is sometimes referred to as a roll‐bond evaporator or simply a bond evaporator. A more detailed description of the heat exchanger is given in papers B and C.
30
3. Summary of appended papers
This chapter holds a summary of the appended papers. It is split into two parts to follow the thesis main topics; the evaporator and the cooling system. Therefore, part 1 concerns heat transfer and pressure drop of the case study refrigerator plate evaporator (Papers A, B and C). In part 2 the focus is shifted to the cooling system (Papers D, E, F, G and H). Paper D presents a new technique to accurately measure refrigerant quantities in different parts of the cooling system. Papers E and F holds results from experiments conducted with this technique. Paper G is devoted to the classical topic of optimal charging (quantity of refrigerant charge) and throttling (capillary tube diameter or length). Finally, in Paper H a thermo‐graphic study of the overall cooling system operating at on‐off cycling conditions is presented.
31
Part I: Characteristics of the plate evaporator
Evaporator free convection air-side heat transfer Heat transfer at the evaporator air side is the combined effect of free convection, thermal radiation and frost formation. In this study free convection and thermal radiation were experimentally investigated. However, a brief discussion about frost formation is provided. Free convection heat transfer involves transport of thermal energy by a fluid which is set to move by a buoyancy force. Free convection air velocities are generally low and the corresponding heat transfer coefficients are also typically low. Therefore, one can expect a large thermal resistance at the plate evaporator surface. Typical values for the heat transfer coefficient at free convection and air is 2‐10 W/m²K. The knowledge of free convection heat transfer at vertical plates surrounded by a quiescent fluid is well established in literature. However, free convection in a closed air filled cavity is more complex. In the case of a rectangular cavity with one vertical cold wall and the bottom and opposite wall at a higher temperature the fluid motion is characterized by a cellular flow in which the fluid descends along the cold wall, climbs along the warm walls, while the core region is nearly stagnant (Incropera and DeWitt, 1996). Thermal radiation is energy transfer by electromagnetic waves which are exchanged between two objects at different temperatures. This mode of heat transfer is also well understood (Incropera and DeWitt, 1996). Typical values for the heat transfer coefficient at thermal radiation between surfaces having emissivity 1 (black body radiation) at room temperature is about 4‐5 W/m²K. In experiments carried out by Laguerre et al. (2005) a refrigerator was investigated at empty and loaded cabinet conditions. They found vertical temperature stratification and proposed an air circulation flow pattern of air moving downward at the evaporator wall, upward at the other walls, horizontal channelling between the warm and cool walls at different heights, recirculation in the bottom corners and a stagnant zone near the top. The only experimental work found on air‐side heat transfer on a free convection, plate‐type evaporator was carried out by Da Silva et al. (1999). They found that 45 % of the heat transfer was at the evaporator back side (evaporator located with a small distance to the back wall), and that the average heat transfer coefficient, including free convection and thermal radiation, was about 7.7 W/m²K.
32
Paper A: Air side heat transfer of a domestic refrigerator plate-type evaporator
This paper concerns the air side heat transfer of the case study refrigerator plate evaporator. Experiments were conducted in the refrigerator at steady state dry air conditions by varying the evaporator location and by varying the surface emissivity. The purpose was to find applicable heat transfer correlations and to see the influence of different evaporator locations. Firstly, the evaporator was located in the centre of the refrigerator cabinet to give an unrestricted flow around the vertical evaporator. The results should indicate the highest possible heat transfer using the given evaporator at free convection conditions. Then, the evaporator was placed in its original position with a 25 mm distance to the back wall. Finally, the air duct behind the evaporator (formed by the evaporator, the back wall and a 25 mm part of the side walls) was blocked in order to see its influence of the heat transfer.
0
50
100
150
200
250
300
350
400
0 10 20 30 40 50 60
temperature difference t_air - t_evap (K)
heat
flux
(W/m
²)
centre locationwall locationwall location, blocked ductcentre location, theorywall location, theory
5
6 7 8 910
Figure 12 Heat transfer coefficients for different evaporator locations (dotted lines marked 5, 6, 7, 8, 9 and 10 W/m² K)
As was expected Figure 12 shows that the highest heat transfer coefficient (about 8.8 W/m² K) was observed when the evaporator was located in the cabinet’s centre. When the evaporator was in its original location (wall location), the heat transfer coefficient decreased to about 7.6 W/m² K. When
33
the air duct behind the evaporator was blocked the heat transfer coefficient decreased to about 5.1 W/m² K (both sides of evaporator used as calculated area in all cases).
The figure also shows the estimated heat transfer coefficients (marked “theory” in the plot) which are the sum of the estimated free convection heat transfer and the estimated thermal radiation heat transfer. In all cases conventional black body radiation equations were used. For the centre located evaporator the Churchill and Chu correlation (Incropera and DeWitt, 1996) was used to estimate the free convection heat transfer. As can be seen, the estimated results are in good agreement with the experimental results. For the wall located evaporator, the free convection heat transfer of the evaporator front and back side was estimated in different ways to reflect the different flow conditions at each side. On the front side the Churchill and Chu correlation was used. On the back side the vertical channel correlation proposed by Bar‐Cohen and Rohsenow (Incropera and DeWitt, 1996) was used5. As can be seen in the figure, in this case the estimated results were somewhat over predicted. The explanation to this deviation and the lower heat transfer for the wall located evaporator compared to the centre located is discussed in the following section.
Temperature probe measurements
Figure 13 shows the air and surface temperatures close to the evaporator in a vertical evaporator‐perpendicular plane. Here, the evaporator is located in its original position with a 25 mm distance to the back wall. The x‐axis is the horizontal distance from the wall, so that 0 mm is at the wall surface behind the evaporator and 25 mm is at evaporator position. The different curves represent different vertical elevations, so that 0 mm is just below the evaporator and 670 mm is just above.
5 This is an update to the original paper (Paper A), in which the Churchill and Chu correlation was used at both sides of the evaporator in the wall located evaporator.
Figure 13 Air and surface temperatures vs. distance from wall for different elevations.
The evaporation temperature was in this measurement ‐15 °C, but due to thermal contact resistance the probe measured a few degrees higher temperatures at the evaporator surface. Above the evaporator (670 mm) the temperatures are almost constant at about 12 °C and thus “undisturbed” by the evaporator. On the evaporator outside, (i.e. distance from wall >25 mm) the other temperatures asymptotically approach 10 °C, which was the approximate temperature in the cabinet air. Thermal boundary layers may be interpreted in the diagram at both sides of the evaporator, with increasing thickness at lower elevations. This is in agreement with classical boundary layer theory. In the duct behind the evaporator (i.e. distance from wall <25 mm) one can see that the wall, behind the evaporator (distance from wall 0 mm), is slightly colder than the air, which shows that this wall is cooled by radiation exchange with the evaporator. This means that the air in the duct behind the evaporator is cooled by convection from both the evaporator and the wall.
It is also seen that the peak air temperature, between the evaporator and the wall (distance from wall 0‐25 mm), decreases with lower elevation. This indicates that the two boundary layers formed at the evaporator back side and at the back wall overlap inside this air duct. This means that the lower part of the duct becomes a cooled chimney, which acts to increase the volume flow through the duct, but also that the temperature difference between the evaporator and the air decreases at lower locations. Hence, there are competing effects between the increased volume flow, caused by the chimney effect, which will result in a thinning of the boundary layer and thus an increased heat
35
transfer, and on the other hand the overlap of the boundary layers that will reduce the driving force temperature difference, and so the heat transfer at the downstream (lower) section of the duct.
However, in order to maximize heat transfer from vertical parallel isothermal plates it is known that the distance between the plates should be large enough to preclude overlap of adjoining boundary layers (Incropera and DeWitt, 1996). Hence, the overlap of the boundary layers experimentally observed lowers the heat transfer at the evaporator back side. Using the Bar‐Cohen and Rohsenow correlation (Incropera and DeWitt, 1996), and assuming the evaporator and back wall to be isothermal plates both at the evaporator temperature (which can be considered as the worst case), it was calculated that the optimum distance between the plates, which precludes boundary layer overlap, is 17 mm. Hence, the experimental results indicating a boundary layer overlap are surprising. The explanation is most likely found in the outlet of this air duct. Here, the vertically falling cold air is deflected by the defrost water chute, which is located just below the evaporator (see Figure 10). This deflection is a restriction to the air flow that will cause a more rapid boundary layer growth (in the more upstream locations). In other words, the free plate assumption, upon which the Bar‐Cohen and Rohsenow correlation is based, is not valid when the evaporator is located close to the wall. This is probably the explanation why the estimated heat transfer is over predicted for the wall located evaporator.
Another question is why the wall located evaporator has lower heat transfer compared to the centre located evaporator. One reason is the fact that lower heat transfer is expected in a vertical channel compared to a free plate (probably due to a horizontal mass transfer of air from the undisturbed air outside the boundary layer into the boundary layer). For instance, the estimated convective heat transfer coefficient for the wall located evaporator was 4.18‐4.35 W/m²K at the back side, using the Bar‐Cohen and Rohsenow parallel plate correlation, compared to 4.4‐5.19 W/m²K at the front side, using the Churchill and Chu single plate correlation. The other reason is a loss of thermal radiation at the evaporator back side. Since the radiation heat flux at the back wall behind the evaporator is higher than the heat flux at the walls facing the evaporator on the front side (larger area) the temperature on the back wall behind the evaporator becomes lower than the other walls. The result is decreased thermal radiation heat transfer on the evaporator back side. This effect, which is counted for in the estimations of the wall located evaporator (since measured wall surface temperatures are used in the calculations), is together with the parallel plate heat transfer reduction, (as described above) the explanation to the heat transfer degradation for the wall located evaporator compared to the centre located evaporator.
It was also experimentally tested to vary the surface emissivity of the evaporator. The evaporator was first covered with a highly reflective silver tape to eliminate the thermal radiation. Then this tape was spray‐painted in a black highly emissive colour to achieve black body radiation conditions. From this experiment it was concluded that the emissivity of the original paint was close to unity, which was also used for the calculations.
Overall, it was estimated that a potential exists to decrease the energy consumption of the household refrigerator by more than 10 %6 with the given heat exchanger positioned in a different
6 Estimated in paper A to be 11.5 % by inspection of Fig 12 which reveals about 5 °C higher temperature difference at the same heat flux for the wall located evaporator compared to the centre located. This temperature difference was multiplied to an estimated 2.3 %/K COP increase.
36
way (i.e. evaporator in centre location). However, it was concluded that the original configuration with a small distance to the back wall was superior to an evaporator attached directly to the wall surface (or integrated into the wall).
It was found that thermal radiation is an important heat transfer mode within the refrigerator cabinet. This is in agreement with earlier findings by Des Champs et al. (1999). The heat transfer coefficient was calculated to be 3‐5 W/m²K for pure convection and 4‐5 W/m²K for pure (black body) radiation. Experimental results showed that the air was cooled, not only directly by convection at the evaporator surface, but also indirectly by parts of the inner walls cooled by radiation. In other research (Laguerre, 2007) it was found that this effect reduced temperature stratification within the cabinet, as the warmer upper part was more effectively cooled by radiation than the lower part.
Temperature measurements revealed that the air stream in the vertical air duct behind the evaporator was cooled from two sides, from the evaporator itself and from the wall behind the evaporator. This effect, in combination with the somewhat restricted air flow at the air‐ducts outlet, created two boundary layers that overlapped at the lower part of the air duct, which lowered the convective heat transfer at this part of the evaporator.
The average heat transfer coefficient of the plate evaporator located with a 25 mm distance to the wall was found to be 7.6 W/m² K. This is in close agreement with Da Silva et al. (1999) who reported a value of 7.7 W/m² K for a similar type of evaporator.
For free convection heat transfer the following correlation proposed by Churchill and Chu (Incropera and DeWitt, 1996) is recommended:
2
278
169
61
)Pr)/492.0(1(
387.0825.0⎟⎟⎟
⎠
⎞
⎜⎜⎜
⎝
⎛
++= L
LRaNu (3)
This correlation should be used to estimate the convective heat transfer coefficient at the evaporator front side of a wall located evaporator, or at both sides for a centre located evaporator. Properties are evaluated at a film temperature calculated as the average of the evaporator surface temperature and the cabinet air temperature. Subscript L denotes that it is the plate height that is used as characteristic length (in the present case 0.66 m).
To estimate the free convection heat transfer in the vertical channel formed at the evaporator back side the following correlation proposed by Bar‐Cohen and Rohsenow (Incropera and DeWitt, 1996) is recommended:
21
212
)/(
87.2)/(
144−
⎟⎟
⎠
⎞
⎜⎜
⎝
⎛+=
LSRaLSRaNu
SS
S
(4)
This correlation should be used to estimate the convective heat transfer coefficient at the evaporator back side for a wall located evaporator. Properties are evaluated at a film temperature calculated as the average of the surface temperature and the cabinet air temperature, thus for simplicity using the front side film temperature which is more easy to access (if the back side film temperature was used instead the estimated heat transfer coefficient was about 1‐2 % higher). Subscript S denotes that it is
37
the distance between plates that is used as characteristic length (in the present case 0.025 m). The constants 144 and 2.87 are table values representing the condition of isothermal/adiabatic plates. The difference in result is however small if constants instead are taken from the condition of two isothermal plates.
For thermal radiation the following black body radiation exchange correlation is recommended (Incropera and DeWitt, 1996):
)( 44
1jiij
N
jii TTFAq −=∑
=
σ
(5)
where is the net radiation transfer from surface i to surfaces maintained at different
temperatures. is the emitting surface. is the view factor defined as the fraction of radiation
leaving surface i that is intercepted by surface
iq N
iA ijF
j . σ is the Stefan‐Boltzmann constant
( W/m²K). and are the temperatures of the emitting and receiving surfaces. The
reason for recommending a conventional black body radiation correlation is that experimental evidence (comparing the original surface to the same surface painted with a non reflective black colour) showed that the surface emissivity of the internal walls and the evaporator was close to unity. Another reason is the fact that the estimated heat transfer of the centre located evaporator, using the suggested correlations, was close to the experimentally obtained heat transfer. If it is believed that the emissivity is not close to unity (for instance if an unpainted metallic surface is present) calculation methods including radiation exchange between gray surfaces must be used as for instance described by Incropera and DeWitt (1996).
81067.5 −×=σ iT jT
Note that for thermal radiation estimation individual view factors should be used for each wall together with that walls surface temperature. In the estimated results presented above the surface temperatures were measured at the different walls facing the evaporator. It is important to remember that the temperature of the emitting wall behind the evaporator can be rather low due to its limited surface area and large view factor towards the evaporator.
38
Frost formation mass and heat transfer
Mass transfer was not studied experimentally within this work. However, to complete the picture of air‐side heat transfer a short discussion follows. Frost formation occurs when humid air passes over a surface whose temperature is below the water freezing temperature. Typically, the thickness of the deposited frost layer will increase with time while the heat transfer decreases as the thermal resistance of the frost layer increases. For a household refrigerator, this would, with time, reduce the cooling capacity and lower the efficiency and it is therefore important to defrost the evaporator regularly. It is not a simple task to estimate the heat and mass transfer at frosting conditions. The porous frost will act as a surface extension which tends to increase heat and mass transfer. On the other hand, the frost surface temperature will increase due to the thermal resistance of the frost layer. This will reduce heat and mass transfer. Moreover, the thermal conductivity and density of the frost increases with time as frost also builds within the porous frost layer. While many studies have addressed the case of frost formation at forced convection (Schneider, 1978; Varma et al., 1978; Abdel‐Wahed et al., 1984; Mälhammar, 1986; Aihara et al., 1989; Tassou and Marquand, 1987) only a few studies have addressed the case of free convection at a vertical plate. Fossa and Tanda (2002) used heat flux sensors at a vertical cooled plate and found that the heat transfer decreased over time but that this decrease was relatively smaller with smaller temperature differences. At a temperature difference of about 30 K between the vertical plate and the ambient temperature and at an absolute humidity in the air of about 0.007 [kg H2O/kg Air], only a thin frost layer could be observed. The heat flux decrease was less than 20 % after six hours (cold wall temperature ‐13°C). In a typical household refrigerator the temperature difference and the absolute humidity is lower than in these experiments and therefore one can expect that the heat transfer degradation from frost growth is low. Another conclusion is that less frost will appear on a larger evaporator that will have a smaller temperature difference. However, even if the heat transfer degradation over time is expected to be low, the heat transfer enhancement from the latent heat of water depositing as frost can be significant. One simple way to estimate the heat transfer coefficient from frost formation is (Granryd, 2005):
convectiondiffusion htph ⋅ΔΔ⋅≈ 1740 [W/m²K] (6)
In which is the partial pressure difference (bar) between the air and the surface, is the
temperature difference (K), and (W/m²K) is the free convection heat transfer coefficient at
the dry surface. Assuming that the relative humidity in the refrigerator is 60 %, that the air temperature is 5 °C, that the evaporator temperature is ‐10 °C and that the “dry” free convection heat transfer coefficient is 4 W/m²K the calculated heat transfer coefficient due to frost formation is 1.2 W/m²K.
pΔ tΔ
convectionh
The frost growth rate can be estimated by (Granryd, 2005):
39
fgfrostconvectiondiffusion
convectiondiffusionfrost h
qhh
hhz
&⋅⋅
+≅′
ρ1
)1( (7)
In which: is the frost growth rate (m/s) frostz ′
is the frost density (kg/mfrostρ 3)
is the heat flux (W/m²) q& is the latent heat of sublimation (J/kg) fgh
Assuming the frost density to be 150 kg/m3, the surface heat flux to be ≈ 185 W/m² (using typical values of the case study refrigerator with 120 W cooling power and an evaporator surface area of 0.65 m²), the latent heat to be 2835 kJ/kg and the heat transfer coefficient ratio between diffusion and convection to be 1.2/4 the frost growth becomes about 0.36 mm/h. With a normal compressor on‐cycle of 5 to 15 minutes the frost thickness is estimated to be about 0.03‐0.09 mm. This thin layer is not expected to significantly degrade the heat transfer (degradation calculated to be less than 0.5 % assuming a frost thermal conductivity of 0.15 W/m K, and a frost thickness of 0.1 mm). On the contrary, as was previously mentioned a surface extension from the porous frost may enhance heat transfer somewhat during this initial period of frost formation.
40
Refrigerant side heat transfer Flow boiling heat transfer involves vapour generation which either can be formed at the surface of the heated tube (higher heat fluxes and nucleate boiling) or at the liquid surface (lower heat flux and convective boiling). For in‐tube flow boiling, typically the heat transfer coefficients are higher than 1000 W/m²K making flow boiling an excellent heat transfer mode.
Household refrigerators and freezers are perhaps the most widespread application involving two‐phase flow boiling. Here, the boiling heat and mass fluxes are low, typically <2.5 kW/m² and <60 kg/m²s (Smith et al., 1993) and therefore is the heat transfer mechanism pure convective boiling. This means that the heat flux ‐ and thus the wall superheat ‐ is too low to support nucleate boiling and that vapour instead is generated at the liquid surface. The low mass flux gives a low, favourable pressure drop but also a risk of incomplete tube wetting since the gravitational force is strong compared to the forces of inertia (low Froude number). The evaporators used are direct expansion with horizontal tubes connected by U‐bends. In some cases (like in the case study refrigerator) the internal cross section is non‐circular.
Wattelet et al. (1994) investigated heat transfer and flow patterns at mass and heat flux conditions typical for household refrigerators and freezers. They found that the flow pattern was wavy‐stratified and that the heat transfer coefficient was independent of the vapour quality. In their experiment, however, they used a long straight tube without bends (length 2.44 m, internal diameter 7.04 mm). In a paper by Björk (2001), (further described in chapter 4) the refrigerant flow in the case study household refrigerator evaporator (including bends) was visualized through an observation glass. A wavy‐stratified flow pattern was observed with superimposed liquid slugs. The liquid slugs appeared to keep the entire perimeter wetted and they were found to be formed downstream bends with increasing frequency at increasing mass flow and/or decreasing quality. These observations are particularly interesting to the present study since the same type of evaporator was used (horizontal flow with non‐circular cross section).
41
Paper B: Flow boiling heat transfer at low flux conditions in a domestic refrigerator evaporator
This paper investigates the flow boiling heat transfer in a household refrigerator evaporator with horizontal flow, frequent bends and a non‐circular cross section. Figure 14 and 15 shows the test section. Experiments were conducted on a “cut out” of the case study refrigerator plate type evaporator. The test section, that was electrically heated, was connected in series with a pre‐heater so that the inlet vapour quality could be varied. The mass flux was varied between 21 and 43 kg/m²s, the average heat flux between 1 and 5 kW/m² and the vapour quality between 0.2 and 0.8 (flooded outlet conditions).
R 17,5
35connector
pipe
connectorpipe
290
25 120
t1
end point ofheated section
50
5025
start point ofheated section t2
10t3
t5
inlet
outlet
t4
Figure 14 Test section which is a cut out from the case study refrigerator evaporator.
2,5
1,4
7,0
R 4,0
heater wire (d = 0.4 mm)
heater wire
thermocouple(d = 0.2 mm)
0,7
Figure 15 Refrigerant tube cross section
42
The flow pattern was predicted using the flow maps suggested by Kattan et al. (1998).
Flow map (33 kg/m²s)
0
20
40
60
80
100
120
0.2 0.3 0.4 0.5 0.6 0.7 0.8
quality (-)
mas
s flu
x (k
g/m
²s)
G=33stratified
wavy-stratified
annular5000 W/m²
0 W/m²
Figure 16 Example of flow map calculated at 33 kg/m²s Note that this flow map is not general for all mass fluxes.
In Figure 16 an example of a flow map is shown. It is seen that the flow is predicted to be wavy‐stratified (solid line with small circles) for the mass flux 33 kg/m2s. For the lowest mass flux tested (21 kg/m2s) the flow was predicted to be stratified, and for the highest mass flux (43 kg/m2s) the flow was predicted to be wavy‐stratified. This means incomplete tube wetting in all cases. The liquid flows at the bottom of the refrigerant tube and the vapour at the top. However, these maps were developed for long, straight and circular tubes.
The experiments indicated a more extensive tube wetting than was indicated in the flow maps. With the exception of the lowest mass flux tested and for positions upstream and close to the first bend (t1 and t2 see Figure 14) a total perimeter wetting was believed to occur.
At the lowest mass flux the heat transfer coefficient decreased with increasing heat flux and quality. This indicates incomplete tube wetting. At increasing heat flux or quality, any liquid film at the top perimeter (where it is thinnest) tends to dry out. And, since the vapour to wall heat transfer is much lower than the liquid to wall heat transfer, the result is a lowered total heat transfer coefficient.
At higher mass fluxes the heat transfer coefficient typically increased with increasing quality but was unaffected by increased heat flux. This behaviour is typically explained by annular flow with decreasing liquid film thickness at increased quality.
However, an alternative explanation is offered in the paper since experimental data indicates incomplete tube wetting upstream the first bend, even at the highest mass flux and at higher vapour qualities. This indicates a stratified flow upstream the first bend and an intermittent flow after this
43
bend. After the first bend the wetting appears to be complete and heat transfer is independent of heat flux. These observations could be explained by perimeter wetting by liquid slugs created after the first bend as was earlier observed by Björk (2001). In this study it was found that the bends helped wetting the upper tube perimeter through generation of liquid slugs. But how can an intermittent flow give similar behaviour (i.e. increased heat transfer coefficient with higher qualities) as annular flow? The answer may also be explained by these earlier observations (Björk, 2001). Here it was found that the frequency of the liquid slugs decreased at higher qualities. This makes the time until the next passing liquid slug longer which gives thinner average film thickness with higher qualities. In other words, the explanation for increased heat transfer at higher qualities would be the same as for annular flow, namely a decreasing liquid film thickness, but the mechanism, however, would be different.
The experimental data also revealed heat transfer coefficients significantly higher than what was predicted with other correlations (Shah, 1976; Wattelet, 1994 and Kattan et al. 1998). This could be explained by thin film evaporation at a perimeter repeatedly wetted by liquid slugs as was suggested in the previous section.
An easy to use correlation based on the pure convective part of the Shah correlation (Shah, 1976) was derived from the experimental data (see paper B for definition of included quantities):
ltp hh /=Ψ (8)
9.0/0.3 Co=Ψ (9)
5.08.0 )/()1)/1(( lgxCo ρρ−= (10)
DkxDGh lll
l /Pr)1(023.0 4.08.0
⎥⎦
⎤⎢⎣
⎡ −⋅⋅=
μ (11)
Equation 8 is the two‐phase multiplier. This is used to relate the two‐phase heat transfer coefficient to the single phase heat transfer coefficient. Equation 9 relates the two phase multiplier to the convection number defined in Equation 10. Equation 11 is recognized as the Dittus‐Boelter in tube, turbulent flow heat transfer correlation. In this the single phase heat transfer is calculated. It should be noted that the proposed correlation calculates the local heat transfer coefficient. Thus, integration (for instance by dividing the evaporator into smaller parts in which the vapour quality is considered constant in each part) is needed to get the average heat transfer coefficient for the entire evaporator.
The main difference to the original Shah correlation (Shah, 1976) is that the constant in Equation 9 was raised from 1.8 to 3. This reflects the fact that the heat transfer recorded was higher than what is predicted with the original Shah correlation. Another difference is that the original Shah correlation included the degree of perimeter wetting through the Froude number. This relation was not found to improve the accuracy of the proposed correlation and was therefore deleted.
44
The mean deviation of the newly proposed correlation is 16.9 % compared to Shah’s 54.7 %. A comparison of the proposed correlation and the recorded data can be seen in Figure 17.
0
2
4
6
8
10
0 2 4 6 8htc experimental (kW/m²K)
htc
pred
icte
d (k
W/m
²K)
10
21 kg/m²s33 kg/m²s43 kg/m²s43 kg/m²s, horizontal, flat side down43 kg/m²s, horizontal, flat side up
Figure 17 Comparison of proposed correlation and recorded data. Dotted lines represent +/- 30 %
Finally, if one excludes the recorded data at the lowest mass flux (21 kg/m²s) with the justification that a partial perimeter dry out occurred at this condition and that therefore this small mass flow should be avoided, an even simpler correlation was derived:
(12) 5.05400 xhtp =
The mean deviation of this is 9.9 %. From Equation 12 it is clear that the most important parameter calculating the boiling heat transfer coefficient is the quality. Note that Eq. 11 and 12 give local heat transfer coefficients. To integrate over the entire evaporator it is recommended to divide the evaporator into a number of sections where each section is assumed to have a constant vapour quality.
45
Refrigerant side pressure drop Flow boiling pressure drop can in general be subdivided into three components for a straight, constant cross section refrigerant tube: the frictional, the change of momentum (or acceleration) and the gravitational component. Since household refrigeration evaporators also include a number of bends, a separate deflection component should be added for the bends. Hence, a total of four components exist:
frictionpΔ is due to the shear force between the flowing refrigerant and the tube walls
onacceleratipΔ is due to the change of momentum, which occurs as the two phase
mixture accelerates along the refrigerant tube when its density gradually decreases.
ngravitatiopΔ is due to the gravitational force acting on the vapour/liquid column in the
tube.
bendspΔ is due to the turbulence created in the bends
Normally, most attention is given to calculate the frictional pressure drop as this often is the dominating part of the pressure drop. In the thesis paper it was estimated that almost 90 % of the pressure drop was frictional.
46
Paper C: Pressure drop in a plate evaporator for refrigerators
The purpose of this experimental study was to find an applicable correlation to estimate the two‐phase pressure drop in household refrigeration evaporators. The case study plate evaporator, used for the experiments, was fitted with 16 pressure taps along the refrigerant tube to give an extensive picture of the pressure drop distribution, including the pressure drop over bends. The pressure tap locations are seen in Figure 18. The test conditions are displayed in Table 1 and the experimental results are shown in Figure 19.
inlet
outlet
Accumulator
35
290
R=17,5
2.(0,014) 3. 4.(0,075)
5.(0,089)
6.(0,212)
7.(0,362)
8.(0,513)
9.(0,527)10.(0,592)
11.(0,733)12.(0,795)
13.(0,818)
14.(0,939)
1.(0,00)
16.(1,30)
15.(1,00)
Figure 18 Pressure tap locations at the evaporator. Relative length is given within parentheses. The relative length is the fraction of the distance from just upstream of the first
1) Saturation temperature from averaged pressure, position 1 to 15. 2) Saturation temperature from condenser pressure. 3) Mass flow divided by cross section area 13,774mm². 4) Calculated from enthalpy at condenser outlet minus enthalpy change over capillary‐suction line heat exchanger. 5) Calculated as the product of the refrigerant mass flow and the enthalpy change from evaporator inlet to outlet.
Figure 19 Pressure drop along the refrigerant tube at different mass fluxes
As would be expected, the pressure drop increases with increasing mass flux. The largest pressure drop is generated downstream in the evaporator. The reason for this is the higher vapour qualities and thus higher vapour speeds at these locations. It is interesting to note that the pressure drop between the relative length 0.6 and 0.8 (see Figure 18 for pressure tap locations) is relatively larger (steeper curve) compared to other upstream locations. At this location the riser tube at the left side
48
of the evaporator is located. In another study by the author, using an observation glass evaporator, it was found that the flow at this location was unsteady with liquid repeatedly falling back against the up‐flowing vapour, so called churn flow (see chapter 4 for more information about this work).
For the whole evaporator, it was estimated that the frictional pressure drop dominated over pressure drop from bends, acceleration and gravitation. In fact, over the bends no additional pressure drop was possible to measure. At a mass flux of 45.5 kg/m²s, the frictional pressure drop was estimated to be about 85 % of the total pressure drop.
49
Hydraulic diameter
One research question related to this study was how to treat the refrigerant tube cross section when finding applicable pressure drop correlations. As a consequence of the manufacturing process and the aesthetic demand of a flat surface on the front side of the evaporator, the refrigerant cross‐section in the case study refrigerator is not circular. It can best be described as a circular segment with a radius of 4 mm and a channel width of 2.5 mm. (See Figure 15).
One approximate way of treating a non‐circular cross section is to use the concept of a hydraulic diameter defined as:
PA
d ch
4= (14)
Ac is here the cross sectional area and P the wetted perimeter. The hydraulic diameter, calculated with this equation, is 3.21 mm. The condition that has to be met when using this for a non‐circular channel is that the mean shear stress at the boundary is the same as for a circular cross section. In a circular tube contours of equal velocity are parallel to the perimeter giving a uniform shear stress. For a rectangular channel, however, the contours of equal velocity are not parallel to the surface, especially near the corners. In general, the less the cross section deviates from the circular the more reliable the concept with hydraulic diameter will be. It is also known that for turbulent flow the shearing force is much more evenly distributed compared to laminar flow. It is known that for a rectangular channel with an aspect ratio of less than 8 the concept with hydraulic diameter is reasonably justified for turbulent flow (Massey, 1994).
A separate experiment (using the same experimental setup) was conducted on the cross section studied with single‐phase gas. Using the definition of the friction factor and experimental results of pressure drop, the friction factor was possible to measure.
)()21(
221 u
pLdf
ρΔ
×= (15)
This was compared to a theoretical friction factor calculated with the well known, smooth pipe, Blasius equation (Eq 16) also using the hydraulic diameter. The result is displayed in figure 20.
50
0,006
0,008
0,01
0,012
0,014
0,016
0,018
0,02
0 5000 10000 15000 20000Reynolds number
frict
ion
fact
or, f
experimental Blasius
Figure 20 Single phase comparison of friction factor calculated by the well known Blasius’s smooth pipe formula and by the friction factor definition using experimental pressure drop
data.
It can be seen that the experimental friction factor is well fitted with the theoretical Blasius’s formula, both using the calculated 3.21 mm hydraulic diameter.
25.0)(158.0 −=μ
hGdf (16)
This match was only found when the hydraulic diameter (3.21mm) was used, which is a good indication that the hydraulic diameter concept is applicable for the cross section studied.
51
Four well known methods to estimate the frictional pressure drop were tested against the experimental data: Homogeneous (Granryd et al., 1999), Lockhart‐Martinelli (Carey, 1992), Friedel (Whalley, 1987) and Pierre (1964). It was found that the homogeneous method was the most accurate.
Figure 21 Comparison between experimental data and four different estimation methods at 31.1 kg/m²s
Figure 21 shows the results from the comparison at one mass flow. It is seen that all the methods over‐predicts the pressure drop but that the homogeneous method was far better than the other to predict the pressure drop. The Pierre correlation (Pierre, 1964) gives the total pressure drop and is therefore given as a single point at the relative length 1.0.
In Figure 22 the experimental data is plotted against the calculated results using the homogeneous method. The data is fitted within 10 % for most of the data points. Interestingly with a higher accuracy at higher mass fluxes. This is probably explained by the better mixing of the two phases that occurs at higher mass fluxes thus making the mixture more homogeneous.
Figure 22 Comparison between the experimental and estimated pressure drop. Pressure drop calculated using Equations 17-25 thus including the pressure drop from friction, and
acceleration. Each pressure drop is measured from the inlet (relative length 0).
In the homogeneous model it is assumed that the liquid and the vapour travels at the same speed and that they are thoroughly mixed. Average properties are assigned to the mixture and single phase correlations are used to evaluate the pressure drop. The overall pressure drop due to friction is calculated by:
dzd
ufp friction ∫ ⋅⋅⋅=Δ1
0
2 1ρ (17)
Where 41
Re158.0−
⋅=f
(18)
μhdG ⋅
=Re
(19)
PAd c
h4
= (20)
53
ll
vv
xxρ
ρμρρμμ )1( −+⋅=
(21)
))1/((1 vl vxvx ⋅+⋅⋅−=ρ (22)
ρ/Gu =
(23)
(24) cAmG /&=
In which AC denotes the cross section area and and are the specific volumes of the liquid and
vapour respectively. To evaluate the integral in Eq. 17 it is recommended to divide the evaporator into a number of sections where each section is assumed to have a constant vapour quality. Note that the mean viscosity
lv vv
μ can be calculated in different ways. Eq. 21 which is the recommended
correlation to use here was suggested by Dukler (Whalley, 1987). This was found to give the best fit to data. It should be noted that this method of calculating the mean viscosity is an update to the correlation used in the thesis paper since it was found to increase the overall accuracy.
The pressure drop due to acceleration is calculated by:
)(2
inletoutletonaccelerati vvGp −⋅=Δ
(25)
In which G is calculated by Equation 24. The specific volume of the two phase mixture v is evaluated at the evaporator inlet and outlet by:
vl vxvxv ⋅+⋅−= )1( (26)
Where the vapour quality x is taken at the inlet and outlet respectively. In this case it is not necessary to evaluate the pressure drop stepwise.
The pressure drop from gravitation and bends, which are not included in the recommended equations above, were found to be small. The estimated gravitational pressure drop was typically about ‐50 Pa (‐0.05 kPa) from relative length 0.0 to 1.0. The pressure drops over the bends were estimated to be between 250 to 650 Pa. (0.25 to 0.65 kPa) from relative length 0.0 to 1.0. However, even at the highest mass flux tested, where the pressure drop across bends were estimated to be the largest, it was not possible to observe any additional pressure drop across the bends using the experimental setup. For a 180 degree return bend at the relative length 0.8 (see Figures 18 and 19) the estimated additional pressure drop was more than 60 Pa, which was within the resolution of the measurement system. It is therefore likely that the calculated pressure drops across bends were over‐estimated. This might be explained by the fact that the correlations used were intended for much larger pipes. It is therefore recommended to omit the effects of gravitation and bends when estimating the pressure drop in this type of channel.
It is probably the intermittent flow (Björk, 2001) that explains why the homogenous method is performing so well in the evaporator studied. With frequent liquid slugs, the vapour and liquid will approximately travel at the same speed. With a stratified flow the method is not expected to be accurate since in this case the homogeneous model breaks down.
54
PART II:
Characteristics of the Cooling System
The first part of this thesis was devoted to the characteristics of a common type of household refrigerator evaporator. Correlations were identified on how to estimate its heat transfer and pressure drop. In this second part the concern is the entire cooling system characteristics.
Partly, at least, this second part can be described as an explorative study in the sense that new experimental techniques were used to conduct experiments never made before. Because of this it was not clear what would be the results. Moreover, few (or no) previous studies were available to compare to. However, the key questions in mind were to find how the refrigerant charge was distributed in the system at transient and at steady state conditions and how the system performed at varied expansion device capacity and quantity of charge. From this it was expected that losses could be identified, understood and estimated. It was also expected that a clearer picture of the system operation would arise.
Paper D describes an experimental technique that was developed within the research project to be able to make charge distribution experiments (experimental results presented in papers E and F). It builds on the conventional quick closing valves technique which, at a given moment, divides the system in sections into which the refrigerant is trapped. It differs from the conventional technique in the way the trapped refrigerant is quantified. In the traditional technique the trapped charge from the system is removed and weighed. This “remove and weigh” technique would be difficult to use in the refrigerator since the quantity of charge is very small. Instead, in the new technique, the trapped refrigerant is allowed to expand into a tank of known volume, reaching a superheated state, so it can be quantified by its pressure and temperature. This way the technique was also possible to make fully automatic, a fact that was used to save experimental time (running continuous tests over night).
Papers E and F hold the results from these experiments conducted at transient and steady state conditions. Here, unique experimental data are presented on how the refrigerant is distributed in the cooling system. Moreover, the cyclic losses related to the charge distribution were estimated.
Paper G is a study of the influence of varied expansion device capacity, quantity of charge and varied ambient temperature. Among other things, this paper gives recommendations on how to size the optimum capillary tube length and quantity of charge.
In paper H, finally, a thermographic study of the cooling system operating at on‐off cycling conditions is presented. Besides giving a clear and unique overview of the thermal landscape of the cooling system, which is a great help to understand the system’s characteristics, sources to energy losses were identified and discussed.
Firstly, and preceding the presentations of the thesis papers a short introduction follows describing the system operating at transient and at steady state condition.
55
The on-off cycling
The most common method to control the cooling capacity, and hereby the temperature, in household refrigerators and freezers is by on‐off cycling (intermittent run or cycling control). The compressor starts as a preset temperature in the refrigerated space is exceeded (cut‐in temperature) and shuts down as a low temperature (cut‐out temperature) is reached7.
Evaporator temperature
Time
0°C
cut-out level
cut-in level
1 cycle
compressor oncompressor off
Cold
5
6
4
2
1
3
Warm
5
6
4
2
1
3
Thermostat setting
Evaporator temperature
Time
0°C
cut-out level
cut-in level
1 cycle
compressor oncompressor off
Cold
5
6
4
2
1
3
Warm
5
6
4
2
1
3
Thermostat setting
Figure 23 Principle of cycling (on-off) control for a refrigerator having its bulb (temperature sensor) clamped to the evaporator. For this the cut-in temperature is always above 0° C to
ensure complete defrost in every off-cycle. With colder temperature settings the compressor is forced to run longer, as the cut-out temperature is lowered, thus increasing the relative
compressor on time and so the cooling capacity.
A typical course of events at compressor start and stop is as follows: At the moment before the compressor starts, the evaporator is at its highest temperature. Most refrigerant, by mass, is accumulated in the evaporator and compressor (following the off‐cycle pressure equalization) whereas the condenser and the capillary tube contain only superheated gas. As the compressor starts, the initial compressor mass flow is high (high evaporation pressure) whereas the capillary tube mass flow is low (superheated gas). The result is that refrigerant is displaced towards the condenser. The evaporator becomes more or less starved with any remaining refrigerant liquid held up in the accumulator. After a short while a liquid layer is formed at the condenser outlet and the evaporator starts to refill with refrigerant liquid. That is, the dryout point (location in evaporator where superheat starts) moves downstream thus gradually “activating” the heat exchanger. During this refilling‐period, when the evaporator is improperly charged and superheat occur; heat transfer is reduced compared to a fully activated evaporator which leads to lowered evaporation temperature and thus increased temperature lift and lowered efficiency. It is important that this refilling or activation process is short in comparison to the entire compressor on‐cycle. The process is somewhat accelerated as liquid, backed up in the condenser following the start‐up, subcools and increases the capillary tube mass flow.
7 In many cases it is not the actual air temperature that is used to control the compressor but the evaporator temperature, which for instance is true for this thesis case study refrigerator. This “indirect” control of the air temperature is one of the reasons why the manufactures are unwilling to indicate temperatures on the thermostat knob.
56
As the compressor stops, the pressure equalizes within the system. The condenser pressure decreases and slowly approaches the saturation pressure in the evaporator while refrigerant is pushed into the evaporator. Figure 24 depicts a typical charge displacement within the cooling system during one on‐off cycle.
+
-Shut-down
+
-
+
Steady stateON -
Start-up
+
-Steady state
OFF
Figure 24 Charge displacements during one on-off cycle.
Cyclic losses
The on‐off cycling which is typically used to control the capacity in household refrigeration is a simple, inexpensive and robust technique that unfortunately also leads to energy losses. These so called cyclic losses can be split into two parts. Firstly, during the on‐cycle (time period in the on‐off cycle when the compressor is on) the thermal load of the heat exchangers is higher than it would be for a continuously controlled system (i.e. variable speed compressor operating at a cooling capacity that equals the heat leakage). This requires larger temperature differences that increases the temperature lift and lowers the thermodynamic efficiency. Secondly, there are losses due to refrigerant displacements following a compressor start and stop – the start/stop losses.
Moreover, the losses may be quantified in terms of capacity or efficiency. In total, efficiency losses of 5–37 % (meaning that the energy use would be 5‐37 % lower without these losses) are reported for the overall on‐off cycling losses (Janssen et al., 1992; Coulter and Bullard, 1997; Jakobsen, 1995).
57
In earlier work treating only the start/stop losses (Mulroy and Didion, 1995; Wang and Wu, 1990; Janssen, 1989; Rubas and Bullard, 1995; Krause and Bullard, 1996; Coulter and Bullard, 1997; Jakobsen, 1995; Nordenberg, 2001), losses were identified in the off‐cycle as high enthalpy vapour enters the evaporator during pressure equalization thus increasing the cabinet heat load (4–7 %), (Rubas and Bullard, 1995). This ‘‘migration’’ loss was found to be particularly severe if pockets of liquid remained in the condenser when the liquid seal at the capillary tube inlet was broken. Therefore, the design should be so that liquid refrigerant freely drains towards the condenser outlet/capillary tube inlet. In the on‐cycle, losses were identified during start‐up as liquid refrigerant exits the evaporator without boiling, (24 kJ/cycle for a household refrigerator), (Rubas and Bullard, 1995). Secondly, vapour is pumped through the capillary tube before a liquid seal is formed at the capillary tube inlet. Thirdly, the refrigerant redistribution process following a start‐up gives a temporary condenser fill up and evaporator superheat that causes a capacity loss of 4–30 %, (Coulter and Bullard, 1997; Nordenberg, 2001) and an efficiency loss of 1–9 %, (Coulter and Bullard, 1997).
The cooling system at steady state
Although transient conditions always occur in household refrigeration (due to cycling control and varied thermal load) the major part of the on‐cycle is approximately at steady state condition. In this condition the system should operate with properly charged heat exchangers to obtain maximum efficiency and capacity. In other words the system should operate with the evaporator superheat and the condenser subcooling as small as possible8. This way, the heat exchangers are as much as possible used for boiling and condensation, which gives the highest possible heat transfer and thus the lowest temperature lift. In larger systems this condition is achieved by using a thermostatic expansion valve in combination with a high side accumulator. In household refrigeration it is instead achieved by using a low side accumulator, a careful sizing of the heat exchangers, the capillary tube and the quantity of charge.
Several system parameters influence the mass flow through the fixed diameter capillary tube, which to some degree make the system self‐regulating. For example, a higher thermal load increases the evaporation temperature and so the evaporator gas density and so the compressor mass flow (fixed volumetric compressor capacity). This, in turn, increases the condensing pressure and so the capillary tube mass flow. If the increased condenser pressure is insufficient to give a capillary tube mass flow that matches the compressor mass flow, refrigerant accumulates in the condenser and becomes subcooled, thus increasing the capillary tube mass flow even more. Moreover, this accumulated liquid will, as it builds up, reduce the internal area for condensation, thus further increasing the condenser pressure and the capillary tube mass flow (this is true as long as not the evaporator at the same time becomes starved). On the other hand, if the mass flow through the capillary tube is higher than the compressor mass flow, the condenser outlet condition will become two‐phase which sharply reduces the capillary tube mass flow (Wolf and Pate, 2002). It follows, therefore, that a proper combination of condenser (UA‐value and internal volume) and capillary tube (diameter and
8 However, theoretically it can be shown that a certain degree of subcooling is beneficial for the overall efficiency. The COP is expected to increase by approximately 1 %/K subcooling using R600a or R134a as refrigerants. This effect is, however, counterbalanced by less condenser area left for condensation, which increases the condensation temperature and thus lowers the efficiency. The authors experience is that subcooling typically is kept as small ass possible within household refrigeration. The reason for this is probably that a charge balance is more easily accomplished at smaller subcooling. This view will be further explored in this thesis.
58
length) prevents a too large subcooling or a too high vapour quality at the condenser outlet at reasonable load variations.
In the evaporator, the dryout point location (which is the location along the refrigerant channel where the superheat starts) depends, among other parameters, on the system charge level and the capillary tube capacity. An undercharged system (or a too low capillary tube capacity) gives a superheated evaporator (dry evaporator outlet). An overcharged system gives a cold suction line (wet evaporator outlet). Both of these conditions give a lower efficiency. However, the low side accumulator, which is located at the evaporator outlet, makes the cooling system less charge sensitive as it keeps the dryout point close to the outlet for a range of charge levels.
Most often a part of the capillary tube is heat exchanged with the suction line in order to avoid external sweating (water condensation on the suction line surface close to the compressor) and to increase the overall efficiency (which is true for the refrigerants used in household refrigeration R134a and R600a). This suction line heat exchanger (SLHX) increases the capillary tube mass flow compared to an adiabatic capillary tube, as refrigerant flashing along the capillary tube is suppressed, thus increasing the refrigerant two‐phase density. This means that an overcharged evaporator (wet outlet) increases the capillary tube capacity, thus causing further overcharging of the evaporator. In this extreme case, however, the system finds equilibrium with less condenser subcooling (or a vapour quality at the condenser outlet).
59
Paper D: A simple technique for refrigerant mass measurement
In this paper an experimental technique is described that can accurately measure the refrigerant charge in different parts of a small cooling system. Such charge inventories have historically been made for large heat pump systems. The typical way to do this is to remove and weigh the refrigerant from the system components. However, this is a very time consuming technique that requires a lot of manual work. Moreover, it would be difficult to use in a low charge system – such as a household refrigerator.
For this reason a technique was developed that could handle low refrigerant charges. It was made autonomous which not only saved a lot of man power but also enabled the experiments to be carried out in a precise and repetitive manner.
The working principle is as follows. Quick closing valves are inserted between the components of which the fluid inventory is to be measured. At a given moment the valves close around the control volumes so that the charge is trapped. Then the refrigerant is expanded into a large vessel to achieve a superheated state. Finally the quantity of charge, m, is calculated according to basic principles and the equations of state.
vVm =
(27)
In this relation V is the control volume and ν is the specific volume which is obtained from property tables using the measured temperature and pressure.
The experimental setup, including the control volumes and the expansion vessel, is seen in Figure 25.
60
tank
capillary tube
condenser
evaporator Ptank
Pcond
Pcomp
cabinet
filter drier
suction valve
discharge valve
condenser valve
capillary valve
tank valve
12
3
4
5
electrical heater
evap in evap mid acc in
accu
mul
ator
evap out
discharge
cond highcond midcond out
filter-drier
compressor low
compressor high
suction
Con
trol
Vol
ume
1C
ontr
ol V
olum
e 2
Con
trol
Vol
ume
3
+
+
Com
pres
sor
Con
trol
Vol
ume
Figure 25 Experimental setup for charge inventory.
The proposed technique was compared to the conventional remove and weigh technique at one measurement condition. It should be noted that this comparison was time consuming (more than 24 h) due the slow remove and weigh technique in which refrigerant is drained out of the system into a bottle by keeping the bottle at a low temperature (submerged in liquid air). The results of the comparison are seen in Table 2. Overall, the differences between the two techniques are small. It is difficult to say which technique is the most accurate. But one thing is certain; the experimental series that will be presented in the next papers would have taken a long time to record using the conventional remove and weigh technique.
Table 2 Comparison between new and old technique for charge measurement Volume Remove-and-weigh
1) Of which 2.9 g as vapour 2) By definition equal to the experimental 35.0 g that was taken as the true mass
61
Paper E: Refrigerant mass charge distribution in a domestic refrigerator. Part I. Transient conditions
In this paper experimental results are presented of the refrigerant mass charge distribution in the steadily cycling case study refrigerator. The experimental results are obtained using the technique described in paper D. In detail it is shown how the charge is displaced at compressor start‐up and shutdown. At start‐up it was found that the charge is temporarily displaced towards the condenser before returning to a steady state distribution in the latter part of the on‐cycle. As a result, the evaporator is initially starved with a lowered evaporation temperature and a peak 10 °C superheat. This superheat disappeared within three minutes as the evaporator was gradually refilled with refrigerant. At shutdown the pressure equalized within three minutes as refrigerant was pushed into the evaporator from the condenser. The results were used to estimate the cyclic losses which were found to be 8 % in efficiency and 11 % in capacity.
In Figure 26 and 27 the experimental charge inventory and temperature results are shown for one on‐off cycle. For the charge inventory results, each data point comes from an interruption of the steadily operating system. Prior to each measurement, four on‐off cycles were completed in order to reach steady cycling conditions. Then, as the fifth cycle started a timer determined the moment for the valves to close around the control volumes, thus trapping the refrigerant. This process was repeated with different timer settings. Overall, the experimental run consisted of 91 measurements, each recorded after re‐established steady cycling condition. Through this, ‘‘snap‐shots’’ of the charge distribution were collected at unique times throughout the on‐off cycle, together displaying the charge variation with time. As can be seen in Figure 26, the data is very consistent.
The pressures from which the condenser and evaporation saturation temperatures are derived from (figure 27) were measured close to the compressor which explains the difference to the surface temperatures measured on the heat exchangers (pressure drops in suction and discharge lines). Therefore, in the on‐cycle, it is more correct to use the measured surface temperatures on the heat‐exchangers (evaporator mid and condenser mid) as being the true phase shifting temperatures.
In the following sections the experimental data is discussed in closer detail following a chronological order of the on‐off cycle, starting at the moment when the compressor starts and ending about 1600 s later when the compressor stops.
62
0
5
10
15
20
25
0 200 400 600 800 1000 1200 1400 1600
time (s)
char
ge (g
)
evaporatorcondenser
compressor oil
compressor vapour
filter drier
ON OFF
Figure 26 Refrigerant mass charges in the cooling system during one on-off cycle
-20
-10
0
10
20
30
40
500 200 400 600 800 1000 1200 1400 1600
time (s)
tem
pera
ture
(°C
)
compressor
condenser mid
condenser saturation temperature (1)
cabinet air
evaporator saturation temperature
evaporator out (3)
evaporator mid
suction line
ambient air
filter drier (2)
(1)
(2)
(3)evaporator in
ON OFF
Figure 27 cooling system temperatures during one on-off cycle
63
On-cycle (0-120 s)
In Figure27, it is seen that the suction line temperature dips to a minimum of 0 °C during the first half minute after the compressor start. This indicates that refrigerant is pulled out as liquid from the evaporator into the suction line. Similar observations were reported by Rubas and Bullard, 1995 and Krause and Bullard, 1996.
Accordingly, Figure 26 shows that the evaporator charge decreases sharply immediately after a compressor start, passes through a minimum after half a minute before quickly increasing to about eight grams after two minutes where it levels off. The filter drier, positioned between the condenser outlet and the capillary tube inlet, shows a similar but “mirrored” behaviour to the evaporator: After reaching a peak of more than five grams, the charge decreases and levels off at a quantity of two grams. A similar charge‐peak can also be seen in the condenser. Apparently, the charge is displaced towards the condenser during the first half‐minute and then back towards the evaporator. A combination of a relatively warm and overcharged evaporator, after the off‐cycle pressure equalization, that gives an initial high compressor mass flow and a fixed capillary tube expansion device explain this charge displacement.
Figure 27 also shows that the filter drier state shifts two times during the two first minutes. First, after half a minute, it shifts from being at a saturated state to become subcooled (filter drier temperature lower than condenser temperature) and then, after two minutes, it shifts back to a saturated state. The first half‐minute is probably the time required to build up a liquid layer at the capillary tube inlet. After this, a one and a half minute period follows in which refrigerant is backed up as subcooled refrigerant at the condenser outlet. As a result, the mass flow through the capillary tube increases. This explains the rapid evaporator refilling seen after half a minute. The “elbows” or sudden level off in the charges for the filter drier and evaporator after two minutes most likely indicate that uncondensed vapour comes into contact with the capillary tube inlet as the backed up refrigerant in the condenser disappears.
Overall, the results show a system that is strongly unbalanced during the first half minute, with a high initial compressor mass flow and a low capillary tube mass flow. However, this over‐shooting, that temporarily displaces the charge towards the condenser, accelerates the following evaporator refilling by creating a subcooled state at the capillary tube inlet. During this redistribution process; the evaporation temperature is lower than the actual surface averaged evaporator temperature (due to a large superheat area). As a result the system efficiency is reduced.
On-cycle (120-600 s)
For the remaining on‐cycle, the charge distribution tends to stabilize. The cabinet air and the evaporator temperatures fall at a similar rate (as they are coupled to each other). The evaporator charge increases linearly and the evaporator superheat disappears after three minutes compressor on time. At the same time the condenser charge and the refrigerant dissolved into the compressor oil decrease. During this period refrigerant accumulates in the evaporator accumulator. The filter drier is at a saturated state and is less than half filled with liquid. This indicates that the mass flow, through the capillary tube, is controlled by uncondensed vapour at the capillary tube inlet rather than by the degree of subcooling at the capillary tube inlet. In other words, the capillary tube inlet condition is two‐phase.
64
Off-cycle (600-1600 s)
As the compressor switches off, the pressure equalizes within the system due to the open capillary tube expansion device. Figure 26 shows that the main charge movement is from the condenser to the evaporator (9.5 g exits the condenser within three minutes). It is also seen that the charge increases in the compressor during the off‐cycle. The full pressure equalization is achieved after three minutes.
In Figure 27, it is seen that the pressure is fully equalized after three minutes as the condenser saturation temperature and evaporator saturation temperature coincide. It is also seen that the filter drier temperature follows the condenser saturation temperature as the compressor switches off but that it deviates from this after about 80 seconds (680 s in Figure 27). Since this component is connected to the capillary tube inlet, at the lowest point of the condenser, this is evidently the moment in which the liquid seal at the capillary tube inlet is broken and vapour starts entering the evaporator. However, looking at the temperature graph of the filter drier, the temperature continues to fall sharply even after this point to flatten out about three minutes after the compressor stop. This indicates a reversed phase‐shift in this component even after the liquid seal at the capillary tube inlet is broken. It is most likely the internal porous filling in the filter drier that contains some liquid refrigerant still evaporating even after the capillary tube liquid seal is broken. Inan et al. (2003) made similar observations.
It is interesting to note that in the later off‐cycle, the evaporator charge decreases from a peak of 22 g to a low 19 g (Figure 26), while the mass in the compressor oil and the compressor vapour increases. Apparently, the evaporator charge evaporates during this period and is transferred to the compressor where it increases the vapour density and dissolves into the compressor oil. The cooling effect of this off‐cycle boiling is approximately 1.0 kJ.
Analysis of cyclic losses based on experimental charge inventory results
It is well known that the charge displacement occurring in the on‐off cycling system is responsible for energy losses. For the first time it is now possible to estimate those using experimental charge inventory results. In order to make the summary compact, the details of the calculations are neglected but can be found in Paper E.
During the on‐off cycle the following refrigerant displacement losses were identified:
1. Refrigerant pulled out from evaporator as liquid during start‐up. 2. Refrigerant vapour pumped through the capillary tube before a liquid seal is formed at start‐
up. 3. Improperly charged heat exchangers during the on‐cycle. 4. Vapour entering the evaporator through the capillary tube during the off‐cycle.
1) The first loss, created during the first 20‐30 seconds after a compressor start‐up, is calculated as the difference between the potential cooling capacity of the exiting refrigerant and the cooling energy accumulated in the evaporator and the suction line heat exchanger by the sudden
65
temperature drop. This loss, which stems from cooling that occurs outside the refrigerated space, was estimated to be 1.7 kJ/cycle, which translates into a capacity loss of 2.3 %. Since the compressor run‐time will increase at approximately the same degree, the efficiency loss is also approximately 2.3 %.
2) The second loss is caused by refrigerant vapour pumped through the capillary tube before a liquid seal is formed at start‐up. It was estimated to be about 0.3 kJ/cycle by multiplying the refrigerant latent heat of vaporization and the entering vapour mass. This translates in to a capacity and efficiency loss of approximately 0.4 %.
3) The third loss is caused by improperly charged heat exchangers at compressor start‐up, (condenser subcooling and evaporator superheat) which leads to increased temperature lift, as seen from the compressor, compared to heat exchangers having no superheat or subcooling. In other words, an additional temperature lift caused by the charge displacements that follows upon a compressor start compared to a cooling system that operates with fully activated heat exchangers (no superheat in evaporator or subcooling in condenser) from the instant the compressor starts. One way to estimate this loss is to find the on‐cycle time‐averaged temperature difference between the measured heat exchanger surface‐averaged temperatures (which will correspond to an evaporator being fully activated) and the actual evaporation temperature. Here, this temperature difference was found to be about 1 °C at the evaporator side and 0.2 °C at the condenser side. However, as was noted in the introduction part, the effect of the condenser subcooling is not expected to decrease the efficiency. Therefore is the effect of the condenser disregarded in the following estimate. Thus, the redistribution process added a temperature lift of 1 °C over the on‐cycle. Finally, from inspection of compressor data the capacity loss was estimated to be about 6 % and the efficiency loss to be about 3 %.
4) The fourth loss is caused by vapour that enters the evaporator during the off‐cycle. This migration process can be subdivided in two parts; the first as long as a liquid seal is sustained at the capillary tube inlet (7.5 g, 600‐680 s, from Figure 26), the second as the liquid seal is broken (2 g, 680‐780 s). In this estimation it is assumed that all gas injected into the evaporator is condensing, thus releasing heat into the cabinet. The loss was estimated to be 1.8 kJ/cycle which translates into a capacity and efficiency loss of approximately 2.4 %.
In total, the capacity losses of type 1, 2 and 4 are 3.8 kJ/cycle, which corresponds to a capacity and efficiency loss of approximately 5.2 %. Also adding the loss from improperly charged heat exchangers (type 3), the total capacity loss becomes approximately 11 % and the efficiency loss approximately 8 %.
Overall, the results indicate that the studied system quickly finds a charge balance, following the start‐up charge displacement, thanks to the high expansion device capacity, which enables a fast evaporator refilling, in combination with a capillary tube mass flow “brake” which is activated when the capillary tube inlet condition shifts from single‐phase to two‐phase. It appears that this mass flow brake is an important mechanism that ensures quick charge redistribution at start‐up.
The drawback with a capillary tube two‐phase inlet condition is that vapour is passively transported through the system which lowers the system efficiency. From the charge inventory results displayed in Figure 26, it is possible to estimate the vapour quality in the filter drier, located just upstream of
66
the capillary tube inlet. The results indicate a void fraction in the filter drier in the later part of the on‐cycle of about 0.55‐0.60. The following correlation can be used to calculate the vapour fraction (Whalley, 1987).
)1
(1
1
l
g
xx
sρρ
α
⋅
⋅−⋅+
= (28)
In this s is the slip ratio defined as the ratio between the vapour and the liquid velocity. If a homogeneous flow (s = 1) is assumed, which appears reasonable due to the narrow pipe (3.5 mm) condenser connected to the drier inlet, the vapour fraction becomes 3‐3.5 %. The penalty loss associated with this vapour quality is approximately in the same order (1 % vapour quality equals 1 % lower efficiency). In other words, the use of this type of mass flow brake penalizes the efficiency somewhat but the benefit is a charge balance quickly restored after a start‐up and a more stable charge distribution at varied thermal conditions.
67
Paper F: Refrigerant mass charge distribution in a domestic refrigerator Part II: Steady state conditions
This paper provides experimental data of the charge distribution in the case study refrigerator cooling system under varied thermal load at steady state conditions. The heat load was varied in two ways: by a varied ambient temperature and by an electrical heater located in the cabinet. The experimental technique described in paper D was used for the experiments.
The experimental results are displayed in Figure 28 and 29. The separate curves on the left side in the Figures come from the experiment where the thermal load was varied solely by changing the ambient temperature (in the diagrams indicated by the arrow 16°C to 29°C).
As can be seen in Figure 28, the condenser charge and the compressor vapour charge increase whereas the evaporator charge decreases upon increased thermal load. The largest charge variation is found in the evaporator. From the lowest to the highest thermal load the charge in this component decreases more than 30 %.
Figure 28 Charge distribution at steady state conditions. Note that the charges in the condenser and compressor oil were unattainable for the lowest thermal loads due to
Overall these trends confirm the simulations from Kuijpers et al. (1988). The compressor charge increase is explained by increased evaporation pressure which increases the density and so the mass in the relatively large volume compressor shell. The condenser charge increase is explained by increased condenser pressure, which increases the gas density and decreases the void fraction as for instance calculated by the correlations from Zivi and Premoli, Rice (1987). However, the large evaporator charge decrease cannot solely be explained by an increased inlet quality and increased mass flow which were the explanations given by Kuijpers et al. (1988). In this case it must also be a charge decrease in the accumulator, located at the downstream part of the evaporator. In this, the refrigerant is accumulated as more or less stationary liquid, thus uncounted by the void fraction models used by Kuijpers et al. (1988). The results highlight one important feature of the accumulator: It acts as a charge buffer from which refrigerant is displaced to other parts of the system at increased thermal load without starving the evaporator. Without this device, and contrary to the constant charge effect predicted by Kuijpers et al. (1988), the evaporator would have been starved at higher thermal loads.
The difference in charge variation between the two different modes of varying the thermal load is most clearly seen in the condenser. For increased thermal load the charge‐increase in this component is steeper for ambient temperature controlled thermal load than for increased internal thermal load (Figure 28). The explanation for this is the condenser’s temperature coupling to the ambient temperature which means higher condenser temperature (pressure) at increased ambient temperature (Figure 29).
Neither subcooling nor superheat was observed at any of the tested conditions (Figure 29). A capillary tube capacity high enough to prevent subcooling and the evaporator accumulator, which keeps the dryout point close to the evaporator outlet explains this. Another reason for the lack of
69
evaporator superheat may be the suction line heat exchanger (two meter long, coaxial type) that allows the dryout point to be close or even downstream of the evaporator outlet.
Overall the results indicate a robust and “forgiving” cooling system at varied thermal load with no observed superheat or subcooling over the range of tested conditions. The combination of a low side accumulator and a capillary tube with high capacity most likely explains this.
70
The subject of charging and throttling
A crucial point when designing household refrigerators and freezers is to find the right capillary tube capacity (combination of capillary tube length and diameter) and quantity of charge. This should be done in such a way that the lowest possible energy consumption is obtained while other required performances are fulfilled. Whether this optimum is found is often questioned. Normally, these parameters are determined experimentally at a late stage in the development process after the cabinet, heat exchangers and compressor have been designed or selected.
For steady state conditions, the ASHRAE handbook (ASHRAE handbook, 2010) suggests an experimental method to help selecting the capillary tube length. A test setup is described to find the capacity balance (combination of condensation and evaporation pressures that ensures a saturated liquid condition at the capillary tube inlet for a given capillary tube length and compressor). However, even if this characteristic is known, and is used at an early stage of the development process to size the cooling system, it is doubtful whether this condition can be maintained for more than one steady state condition. The same source (ASHRAE handbook, 2010) also suggests an experimental method that can be used on an existing system to find the optimum charge: An external refrigerant bottle, which is valved off and sitting on a scale, is heated or cooled to vary the system charge.
It is well known from experiments and theoretical studies that a vapour compression cooling machine, at steady state conditions, has its highest efficiency for a certain expansion device capacity and quantity of charge. However, no experimental studies have been published for on‐off cycling systems, even though this method for capacity control is the most common in household refrigeration. It is the purpose of paper G to fill this gap. In particular, it is interesting to in detail explore the nature of the energy minimum, which many engineers intuitively believe exists, for certain combinations of the expansion device capacity and the quantity of charge.
71
Paper G: Performance of a domestic refrigerator under influence of varied expansion device capacity, refrigerant charge and ambient temperature
This paper reports experimental results of the on‐off cycling case study household refrigerator at varied Expansion Device Capacity (EDC), quantity of charge and ambient temperature.
Figure 30 shows the experimental setup. Part of the capillary tube (the adiabatic 0.5 m that is located between the filter drier and the suction line heat exchanger) was replaced with a needle valve, actuated by a remotely controlled step motor. Through this arrangement the EDC could be varied. The compressor service tube (where refrigerant is charged into the system) was connected via a remotely controlled valve to a refrigerant bottle (sitting on a scale connected to a logger). This way, the refrigerant charge could be changed in controlled steps. For each change in EDC and charge, the system was run until it was steadily cycling. Then the energy consumption was measured. The average cabinet air temperature was in all cases 5 °C.
need
le v
alve
step motor
compressor
energy
to logger
230V AC
solenoid valve
condenser
evaporator
34.5
to loggerscalecapi
llary
tube
from PC
from P
C
filter drier
Figure 30 Experimental setup
A total of almost 600 measurements were recorded at different combinations of charges, EDC and ambient temperatures. For each ambient temperature (16, 25, 31 °C), the results are displayed in a contour map (Figures 31 and 32) with the EDC on the longitudinal axis and the quantity of charge on the lateral axis. The EDC is displayed as the flow through the expansion device of Nitrogen expanded from 6 bars to atmospheric pressure (@ 20 °C), as measured in a separate test. It should be mentioned that the EDC of the original configuration, measured by the Nitrogen flow method, was 2.8 l/min which is close to the right end of the plot. The original charge was 33 g.
72
3.06 / [21.25]
2.812.63
2.41 / [12.25]
2.151.84
1.48 / [6.25]
1.080.64
0.15 / [0.25]
23
25
27
29
31
33
35
37
39
EDC (l N2/min) / [Valveopening (-)]ch
arge
(g)
0.60-0.65 kWh/24h
0.65-0.70
0.70-0.75
0.75-0.80
Figure 31 Plot of energy consumption for different settings of charge and Expansion Device Capacity (EDC) during on-off cycling conditions. For more information about the experiment
see paper G.
In Figure 31 the results at 25 °C ambient temperature are displayed. As can be seen, a minimum exists in the energy consumption for certain combinations of the EDC and charge (blue area in plot). This minimum is wide and stretches all the way to the highest attainable EDC (right side of plot). With lower EDC, the minimum tends to move towards higher charges. The explanations to these findings are discussed in the following paragraphs.
For a wide range of EDC settings (>1.08 l/min) the plot shows that the charge could be varied within a range (27‐33 g) without any loss in efficiency. This fact is explained by the refrigerant accumulator located at the downstream end of the evaporator. As was shown in Paper F, this device acts as a charge buffer that prevents evaporator superheat or a too cold suction line, both cases leading to efficiency losses.
The explanation to increased energy consumption with a too low EDC (< 1.08 l/min) is that the refrigerant tends to accumulate in the condenser, which starves the evaporator ‐ thus resulting in evaporator superheat. As a result, the evaporation temperature decreases and so the system efficiency.
73
The flat or unchanged energy consumption that is seen for higher EDC (> 1.08 l/min) is somewhat surprising. At the highest EDC one would have expected a throttling loss9 (vapour being passively transported around the system without contributing to the cooling capacity thus reducing the system efficiency). It would also have been expected to see an increased subcooling upon lowering the EDC from its highest attainable values. This subcooling should have increased the system efficiency (as long as the evaporator not is starved at the same time). However, with exception of the initial time‐period after the compressor start‐up and the lowest possible EDC settings (EDC< 1.08 l/min), the subcooling was small and only slightly increased with lower EDC.
It is possible that the mass flow through the expansion device is more or less unchanged over a range of EDC settings. Kang et al. (2008) found that the refrigerant flow rate in an electronic expansion device was very sensitive to the inlet condition as the subcooling disappeared to become two‐phase. Therefore, it is possible that a lower setting in the EDC results in more condensate and a slightly higher subcooling (or lower quality) that nearly restores the mass flow to its initial value. The same characteristics have been found for capillary tubes (Wolf and Pate, 2002). The flow capacity is very sensitive to the degree of subcooling or quality at nearly saturated inlet conditions.
Another possible explanation that may have contributed to the wide and flat energy minimum seen with varied EDC may be a faster evaporator activation time (faster evaporator refilling) that counterbalances a possible throttling loss from increased vapour quality at the condenser outlet with increased EDC.
The fact that the energy minimum tended to move towards higher charges at lower EDC (35 g @ 0.64 l/min in Fig. 31) is explained by the detrimental effect of an overcharged evaporator which gives an efficiency drop due to a cold suction line. At this high charge a cold suction line is avoided through a lower EDC.
9 It should be noted that the EDC in this experiment only could be increased by about 10% compared to the original configuration due to experimental setup limitations (the 2.04 m long capillary tube within the suction line heat exchanger was unchanged). With higher EDC, a lowered efficiency is expected. In fact, Lee et. al (2008) and Yoon et. al (2011) have shown this lowered efficiency at higher EDC in an experiment where the capillary tube diameter was varied.
74
3.06 / [21.25]
2.95 / [18.25]
2.73 / [15.25]
2.41 / [12.25]
2.00 / [9.25]
1.48 / [6.25]
0.87 / [3.25]
0.15 / [0.25]
22
24
26
28
30
32
34
36
38
40
42
44
46
48
50
EDC (l N2/min) / [Valveopening (-)]
char
ge (g
)0.25-0.30 kWh/24h
0.30-0.35
0.35-0.40
16 °C
3.06 / [21.25]
2.95 / [18.25]
2.73 / [15.25]
2.41 / [12.25]
2.00 / [9.25]
1.48 / [6.25]
0.87 / [3.25]
0.15 / [0.25]
22
24
26
28
30
32
34
36
38
40
42
EDC (l N2/min) / [Valveopening (-)]
char
ge (g
)
1.00-1.05 kWh/24h
31 °C
Figure 32 Plot of energy consumption for different settings of charge and Expansion Device Capacity (EDC) at 16 and 31 °C. For more information about the experiment see paper G.
Experiments were also conducted at higher and lower ambient temperatures (16 and 31 °C). The results, displayed in Figure 32, were similar to Figure 31, with flat energy minima open at the right side of the plots (no energy increase at the highest attainable EDC). The energy consumption was (as was expected) higher with higher ambient temperature and lower with lower temperature. The energy minimum moved towards higher charge values (38 g) when the ambient temperature was lowered. This result was explained by lower condenser pressure which prolonged the evaporator activation time (time for refrigerant to refill the evaporator following a start‐up) and thus promoted increased charge. Another factor that contributed is that more refrigerant is dissolved in the compressor oil at lower oil temperature.
Overall, the results indicate that the energy consumption is relatively independent of the EDC for a range of settings. The most likely explanation to this is that the expansion device mass flow is very sensitive to the inlet condition when the refrigerant is nearly saturated. As a result, the mass flow is nearly unchanged at different settings of the EDC. With lower setting in the EDC more condensate is created which increases the mass flow. The results from paper E also indicated a strong relation between the capillary tube inlet condition and the capillary tube mass flow at nearly saturated conditions.
75
The paper also describes a practical method on how to optimize the capillary tube length and the quantity of charge. This empirical method, which was formalized after interviews with a technician with long working experience from research and development at a large white goods manufacturer (Andersson, 2005), was found to be reliable as it resulted in settings (capillary tube length and quantity of charge) close to optimal. For more details see Paper G
(1) The capillary tube dimension is determined in pull down experiments (start‐up with cabinet initially at ambient temperature) at 25 °C during which the evaporator dryout point (location along the refrigerant channel where superheat starts) must reach the low side accumulator inlet position within 30 min. In this experiment the charge is guessed.
(2) The charge is determined during continuous running steady state conditions at 32 °C ambient temperature. In this condition the dryout point must just reach the accumulator inlet. Then, this charge is tested at continuous running steady state conditions at 25 °C ambient temperature. In this condition the suction line downstream the capillary tube heat exchanger must not be cold (i.e. part of suction line close to compressor). In case the latter condition is unattainable, the accumulator volume is too small for the given configuration.
(3) The capillary tube dimension and amount of charge are verified at on‐off cycling conditions at 25 °C ambient temperature and 5 °C average cabinet air temperature. In this test, the evaporator dryout point should reach the accumulator inlet within 1–2 min (depending on evaporator size) after a compressor start. If this condition is unattainable the capillary tube should be shortened.
To further refine this method, it is suggested that the correlation proposed by Dmitriyev and Pisarenko (1984), based only upon the evaporator and condenser volume, could be used to get a first guess of the optimal charge.
3862.041.0 −⋅+⋅= cer VVG (29)
In which Gr is the charge in grams, Ve the evaporator internal volume in ml and Vc the condenser internal volume in ml. The correlation was originally designed for refrigerant R12. However, using the input data from the current system and multiplying the result with the density ratio of Isobutane to R12 (0.41 liquid/liquid), the correlation suggests 38 g as optimum charge. This is an overcharge of only 15 % to the nominal 33 g charge.
It was not discussed within the paper how the initial guess of the capillary tube dimension should be made. This dimensioning is complicated by the suction line heat exchanger which increases the capillary tube mass flow compared to an adiabatic capillary tube. A comprehensive attempt to find a general estimation method was made by Wolf and Pate (2002). This report holds easy to use chart methods developed for the refrigerants R600a and R134a, which are the two refrigerants used in household refrigeration. As today, this is the recommended method in the ASHRAE handbook (2010).
76
The reason for recommending these methods over several other methods available in the literature is that the author found good agreement with his own experimental results10.
10 This comparison, which was made on rather limited data, is outside the scope of this thesis.
77
Paper H: A thermographic study of the on-off behaviour of an all-refrigerator
In this work a thermographic camera was used to observe the temperature distribution of the case study household refrigerator cooling system operating at on‐off cycling conditions. The technique offers an alternative method to analyze the cooling system compared to conventional thermocouples.
Figure 33 shows an example of the experimental results. On the left side the evaporator is seen, in the middle the condenser and compressor, and to the right a close‐up of the lower part of the condenser including the compressor. This way, pictures from the evaporator and condenser were synchronized to view moments throughout the complete on‐off cycle. See paper H for a time‐line collection of pictures covering the entire on‐off cycle.
cabinet internal wall
Evaporator edge (somewhat curved due to wide angle lens)
compressor
cabinet internal wall
Evaporator edge (somewhat curved due to wide angle lens)
compressor
cabinet internal wall
Evaporator edge (somewhat curved due to wide angle lens)
compressor
Figure 33 Thermographic stills of the heat exchangers captured 5 min after compressor start-up. At this point refrigerant is occupying the lower part of the evaporator while the
accumulator is still used for pure superheat.
Overall, the experimental results confirm the findings presented in papers E and G. It was for instance shown that refrigerant is displaced towards the compressor and condenser at start‐up which results in a starved, superheated evaporator and a drop in efficiency in the first part of the on‐cycle. The liquid suction at compressor start‐up, which is the unwanted effect of liquid refrigerant being sucked out of the evaporator to evaporate in the suction line immediately after the compressor starts, was clearly visualized. The study also reveals sources to energy losses that would have been difficult to find using conventional temperature measurement technique (i.e. thermocouples). It was shown that evaporator edges are poorly used for heat transfer and that evaporation occurs in the filter drier during the off‐cycle (estimated to be 0.3 kJ/cycle).
78
Figure 34 Thermographic pictures showing the refrigerant progression in the evaporator at three different times; 1, 3 and 5 minutes after start-up. The temperatures are represented by
colours in a spectrum from blue to red with increasing temperatures. A sketch of the evaporator refrigerant line piping is found in paper H.
In figure 34 it is seen how poorly the evaporator is used for evaporation in the early part of the on‐cycle. After an initial evacuation, where most of the refrigerant has left the evaporator through the suction line, the evaporator needs to be re‐activated by refrigerant entering through the capillary tube.
This charge redistribution at start‐up, which temporarily gives an evaporator superheat (and to some extent a condenser subcooling) gives higher (than needed) temperature lift, thus decreasing the system efficiency. In Paper E, this loss was estimated to be 3 % in efficiency.
To reduce this start‐up loss the refrigerant lines in the evaporator could be redesigned to have a downward slope. In one of the project’s master thesis work, Carrera (2002) showed that a small downward inclination resulted in a much faster dryout point progression. The results (shown in chapter 4, Figure 49) indicate more than 50 % faster progression with a 10° downward slope. The same study also found that a smaller diameter channel gave the same result – but in this case at the price of a higher pressure drop. In Paper C, however, it was shown that the largest pressure drop is generated downstream in the evaporator where the vapour velocity is the highest. Therefore it should be possible to make the first part of the evaporator channel with smaller diameter, hereby lowering the evaporator activation time (time for the dryout point to reach the accumulator inlet).
79
Figure 35 Evaporator at nearly steady sate in the later part of the on-cycle. Note lighter colour close to edges indicating higher temperatures. This is most significant at the lower
left end where space is reserved for the thermostat bulb.
Figure 35 shows the evaporator at a moment before the shutdown. Close to the plate edges the temperature was higher than in the central parts. This indicates that refrigerant lines could be moved closer to the edges to make better use of the plate evaporator air side.
By using numerical simulation tools it was estimated (see chapter 4) that the fin efficiency of the evaporator was 97 %. This can be recalculated to a temperature loss of about 0.6 °C which corresponds to an efficiency loss of approximately 1‐2 %.
80
Figure 36 Condenser four minutes into the off-cycle. The dark spot on the lower left corner is the filter drier, which is cooler than other parts of the condenser. The white area in the
lower mid is the compressor.
In Figure 36 it is seen that the filter drier acted as a liquid pocket during the off‐cycle. In this pocket evaporation occurs when the pressure between the condenser and the evaporator has equalized. This leads to a transport of thermal energy into the cooled space. This phenomenon was also reported in paper E. It may be difficult to overcome this problem since the highly porous particles inside the filter drier are needed to absorb any water in the system. Assuming that the only water that enters the hermetically sealed cooling system comes during the manufacturing process, a more controlled environment during production would make the drier (but not the filter) unnecessary. It was estimated that the loss from this filter drier was 0.3 kJ/cycle.
81
Figure 37 Condenser 20 s after a compressor start. The cold suction line is seen as a diagonal dark line on the lower left side in the picture.
In Figure 37 the liquid suction phenomenon is clearly seen. This is the unwanted effect of refrigerant liquid being sucked out of the evaporator at start‐up. This is a “boil over” effect which is caused by the sudden pressure drop in the evaporator that for a short period gives a refrigerant saturation temperature at a much lower temperature than the evaporator plate. A rapid boiling follows which leads to liquid being dragged along the narrow channels within the evaporator. This vigorous boiling is sustained by the thermal energy stored in the evaporator’s thermal mass. In Paper E the above mentioned loss was estimated to be 1.7 kJ/cycle or 2.3 % in efficiency.
The classical solution to the liquid suction problem at start‐up would be to design the evaporator accumulator as a liquid separator so that boiling would solely occur in the evaporator. However, a liquid separator may not be easily designed within the dimensions of the plate. Moreover, if such separator was possible to design, it would still be unfavourable to boil refrigerant locally in the evaporator accumulator compared to have it boiling in the entire evaporator. The experimental evidence is that the refrigerant accumulates in the accumulator at start‐up. One way to overcome this problem would be to distribute the accumulator over a larger part of the evaporator.
82
Another strategy would be to strive for a quick recharge of the evaporator by allowing the refrigerant to quickly exit after a start‐up. The results from Paper G indicate that there is a relation between the exiting refrigerant at start‐up and the evaporator activation time. With a large quantity of liquid exiting the evaporator at start‐up the liquid seal at the condenser outlet is quickly restored which permits faster evaporator activation. Moreover, a closer analysis suggests that the problem with liquid refrigerant exiting the evaporator at start‐up is not as large as it first appears. Part of this cooling is regenerated back to the cooled space via the suction line heat exchanger (SLHX) where most of this liquid evaporates. In Paper E it was estimated that the cooling energy accumulated in the SLHX material (as thermal energy) at start‐up when exiting refrigerant evaporates was about 2.0 kJ. This can be compared to 1.7 kJ of cooling energy accumulated in the evaporator material at start‐up, and the 1.7 kJ that was estimated to be the loss of cooling energy when liquid refrigerant exits the SLHX at start‐up (passing un‐evaporated through the SLHX). In other words, the cooling energy accumulated in the SLHX appears to be an important factor to decrease the cyclic losses. Perhaps a redesign of the SLHX, could make this loss even smaller. Such design change should also be beneficial for the compressor that would receive less refrigerant liquid at start‐up. It is important, however, that the suction line pressure drop is not increased with such a design change. A comment about this “liquid suction” loss is that it was much smaller in the present study than what was previously reported in the literature, 1.7 kJ/cycle compared to the previous 24 kJ/cycle (Rubas and Bullard, 1995). The reason for this is that the previous study was looking at a cooling system containing 326 g refrigerant compared to the case study refrigerator having only 35 g. In other words, a reduction of refrigerant charge reduces this type of cyclic loss. This conclusion should also be applicable for the loss that is caused by vapour entering the evaporator during the off‐cycle. This loss was estimated to be 1.8 kJ/cycle or 2.4 % in efficiency in the present study.
83
4. Other activities carried out within the research project
In this chapter other activities within the research project are summarised. It includes work by the author and different students, supervised by the author.
A thermographic study using Thermochromic Liquid Crystals (Björk, 2000)
Experiments were conducted using Thermochromic Liquid Crystals (TLC) painted on the case study refrigerator evaporator. The objectives were to evaluate the measurement technique itself and to see if it was possible to measure the small temperature differences between the evaporator channels and its surroundings on the plate evaporator surface at steady state conditions. The TLC, which was designed to have a temperature range between ‐17.9 to ‐19.9 °C, was painted on the evaporator. Then, the system was balanced so that the evaporator temperature was in the TLC range. A careful calibration was undertaken using thermocouples at a few locations. Next, measurements were conducted using a digital camera to record the results. The analyze showed that the temperature difference was about 0.2 K between the surface at a refrigerant channel and the surface at the midpoint between two channels (18 mm above or below the channel). In Figure 38 a typical screen shot is seen displaying a part of the evaporator. The histogram shows the hue‐values (colour number) of the selected area.
It was concluded that calibration must be undertaken at the measurement conditions (lightning condition, camera view angle). This fact made the experimental technique rather time consuming. Another problem was that frost at the evaporator surface caused measurement errors. Therefore, the cabinet air was carefully dried during the experiments. The study was published as a part of the final report of Klimat 21 (Björk, 2000).
84
Figure 38 Temperature measurements at case study plate evaporator using TLC (Thermocromic Liquid Crystals). The refrigerant line can be seen as a lighter colour.
The observation glass evaporator (Björk, 2000)
The case study refrigerator plate evaporator was modified with an observation glass at the front side to enable visual observations of the refrigerant flow. 7 hours of video was recorded at steady state and transient conditions. In Figure 39 the experimental setup is seen.
85
Figure 39 Observation glass plate evaporator. Camera on remotely controlled stand in front of evaporator and located inside the household refrigerator cabinet.
Figure 40 shows the flow regimes that were identified at steady state condition in different parts of the evaporator. It was found that convective boiling (no nucleation) was the boiling mechanism. Both of these results were used to understand the flow boiling results reported in paper B. At transient conditions (start‐up), it was possible to see that refrigerant was sucked out from the evaporator as liquid. Then a refilling phase followed in which the quantity of liquid increased (dryout point moving
86
downstream) thus gradually activating the evaporator. The study was published as a part of the final report of Klimat 21 (Björk, 2000).
outlet
inlet
AckumulatorStratified
Stratified/slug
Churn
Annular/slugoutlet
inlet
Ackumulator
outlet
inlet
AckumulatorStratified
Stratified/slug
Churn
Annular/slug
Figure 40 Flow regimes in evaporator
liquid
vapour
Figure 41 Close up of refrigerant line. Liquid is seen at bottom of channel. The light objects in the pipe are traces of glue which was used to attach the glass plate.
One article “Slug formation in a domestic refrigerator with plate evaporator” Björk (2001) was published based on the observations. In this it was reported that liquid slugs were formed just downstream the downward return bends in the plate evaporator. At this location, stationary liquid pools were observed from which the liquid slugs were formed. When tilting the evaporator a few degrees (2.5°) to any side, the pools were formed downstream the return bends at this side. The
87
liquid slugs appeared to play an important role of keeping the tube perimeter wetted (avoiding partial perimeter dry out). The result was used to understand the findings in Paper B (flow boiling study) and H (Thermographic study).
Cycle length experiments (unpublished work)
In this experiment the energy consumption was measured on the case study refrigerator at varied cycle lengths (time between two compressor starts). The ambient temperature was kept at 25° C and the average cabinet temperature at 5° C in order to follow ISO 7371 conditions. The cycle length was varied by changing the switching differential temperature (temperature difference between cut‐in and cut‐out temperatures). In Figure 42 the result is seen.
0,6
0,65
0,7
0,75
0,8
0,85
0 10 20 30 40 50 60Cycle length (min)
Ener
gy (k
Wh/
24h)
wall location,blocked duct
wall location
mid location
Figure 42 Energy consumption at different cycle lengths and evaporator conditions. For the shortest cycle the switching differential was 0.1 °C. For the longest 10 °C was used. The
cooling system was in this experiment directly controlled by the air temperature averaged over two locations within the cabinet air.
The three different curves represent three different evaporator locations. The bottom curve is recorded when the evaporator is located freely in the middle of the cabinet (compare Paper A). This way heat transfer by convection was unrestricted by nearby walls. The middle curve is recorded with the evaporator in its original location with a 20‐25 mm distance to the back wall (as to provide air circulation on the evaporator back side). The top curve is recorded when the air duct behind the
88
evaporator was blocked so that no air could circulate on the back side. As can be seen, the lowest energy consumption is found for the mid located evaporator and the highest for the back wall located evaporator with the air duct behind the evaporator closed. The energy consumption was about 10 % lower when the evaporator was located in the middle of the cabinet compared to the original wall location. This is in agreement with the estimations presented in paper A.
It is also seen that the lowest energy consumption is at a cycle length between 10 and 20 minutes. Compared to the normal cycle length of about 30 min, the energy is about 5 % lower using this short cycling technique.
35
40
45
50
0 20 40 60 80 100 120 140
cycle length (min)
cond
ense
r (°C
)
-25
-20
-15
-10
-5
0
0 20 40 60 80 100 120 140
cycle length (min)
evap
orat
or (°
C)
Figure 43 Condenser and evaporator temperatures averaged over the on-cycle.
In Figure 43 it is seen that longer cycle lengths give increased average condenser temperature and decreased average evaporator temperature in the on‐cycle. In other words, the average temperature lift is increased with longer cycle lengths. The reason is the heat exchanger thermal masses in which thermal energy is stored during the on‐cycle. This storing is largest in the early on‐cycle when most of the cooling power is used to cool down the evaporator material and only a smaller part of the cooling power is exchanged with the surrounding air. In this period the temperature lift is lower than in the later part of the on‐cycle which means that shorter cycles give lower average temperature lifts compared to longer cycles. In the off‐cycle the thermal energy stored in the evaporator plate is exchanged with the ambient air. In other words, it is the thermal masses in the heat exchangers that explain why a shorter cycle length gives lower energy consumption.
However, even though the average temperature lift is decreasing with decreasing cycle lengths (approaching the temperature lift of a continuously operating system) it is seen in Figure 42 that the energy consumption starts to increase with cycle lengths shorter than 10 minutes. This can be explained by the cyclic losses that start to dominate at shorter cycle lengths. In Figure 44 the relative compressor run time is plotted against the energy consumption. For cycle lengths longer than 12 min the energy consumption is directly proportional to the relative compressor run time. For cycle lengths shorter than 12 min, the energy consumption also increases with increasing relative compressor run time but at a higher energy consumption level.
89
0,6
0,65
0,7
0,75
0,8
0,85
0,3 0,35 0,4 0,45
Relative compressor on (-)
Ener
gy (k
Wh/
24h)
12 min
5 min 124 min
Figure 44 Energy consumption vs. relative compressor running time for the wall located evaporator. Three cycle lengths are indicated in the figure representing the data points
having the longest cycle length, the shortest cycle length and the cycle length having the lowest energy consumption.
FEMLAB simulations
Computer simulations were carried out using FEMLAB (today known as Comsol multiphysics), which is a numerical, multi‐physic simulation tool. The heat and mass transfer were calculated in the vertical mid plane of the case study refrigerator using a step wise “marching in time” solution.
90
Figure 45 FEMLAB 2D simulation of temperature field at a vertical mid plane of a refrigerator. 5, 10 and 15 seconds after the evaporator becomes cold (Björk, 2003).
One example of the calculated results is seen in Figure 45 showing three moments in time following a start‐up (Björk, 2003). At the left side in the figures the evaporator is seen, having a fixed temperature of ‐15 °C. The cabinet air temperature is initially 5 °C. It is seen that air next to the evaporator cools down, falls and ejects as a jet at the bottom part of the evaporator. The jet stream is deflected out from the vertical wall (into the cabinet) because of the defrost water chute, located below the evaporator. Hence, the simulation indicates that the flow at the evaporator does not have the characteristics of a free vertical plate. This appears to support the results of Paper A in which it was found that the thermal boundary layers at the lower part of the evaporator back side was thicker than expected, which could be explained by a restricted flow.
91
Figure 46 Simulated temperatures at plate evaporator. The evaporation temperature is -15 °C. The warmest temperature, at the lower left corner, is -9.7 °C (Björk, 2004).
In figure 46 the results from another simulation is shown: the temperature field of the case study plate evaporator (Björk, 2004). In comparison to the full cabinet simulations this was a simple, straight forward calculation. In this simulation a constant temperature along the refrigerant channel was assumed together with a constant air side heat transfer coefficient. It is seen that the central part of the evaporator is more or less isothermal but that the temperatures near the plate edges, especially at the bottom and left bottom part of the evaporator, is at higher temperatures. It was calculated that the evaporator had a fin‐efficiency (ratio between actual heat transfer and the heat transfer that would occur if the plate was isotherm at the evaporator channel surface temperature) of 97 %, mainly due to the non‐isothermal bottom and left bottom part of the evaporator. This efficiency corresponds to a temperature loss of 0.6 °C. In other words, the evaporation temperature could have been 0.6 °C higher if the fin efficiency was 100 %. This corresponds to an efficiency loss of at about 1‐2 %. It appears that a simple redesign of the evaporator channels, moving them closer to the plate edges, would make an efficiency gain.
92
Note that only the thermal resistance in the evaporator plane was considered in the estimation above. Obviously a thermal resistance also exist between the refrigerant and the channel wall and through the channel wall to the surface. These resistances should be added to the get the total thermal resistance. However, the example above indicates a potential energy saving that exist by simply changing the refrigerant channel configuration.
Student works supervised by the author
Nordenberg (2001)11 investigated migration related cycling losses. He used an infrared camera to visualise the system’s overall behaviour. The results were later used as a base for a journal article (Paper H). The study showed that the evaporator was poorly used in the early on‐cycle for a steadily cycling system. The plot below (Figure 47) shows how the evaporator activates during the on‐cycle for different temperature settings. It is seen that a relatively larger part of the on‐cycle is needed for a minimum temperature setting (warmest setting) to activate the evaporator. The reason for this is that the on‐cycle in this case is shorter than for a higher (colder) temperature setting.
0,0
0,2
0,4
0,6
0,8
1,0
0,0 0,2 0,4 0,6 0,8 1,0Normalised
compressor on-time
Refrigerant filling ratio
Minimum
Medium
75%
Thermostatsetting
Figure 47 Evaporator activation following a start-up for three different temperature settings. For more details see Nordenberg (2001).
The author also measured the temperatures and pressure drop over the heat exchanger and the suction line (Figure 48). It is seen that the evaporator pressure drop is higher at the eight first minutes in the on‐cycle. This is the time when the evaporator activates (time in on‐cycle for refrigerant to fill up the evaporator) and thus the time when superheat exists. Typically the pressure drop is less than 50 mbar (5 kPa) in the later on‐cycle. It is interesting to note that the pressure drop
11 References to student works supervised by the author and carried out within the framework of this project are written in bold text to distinguish them from other references in the thesis.
93
in the suction line is almost as large as in the evaporator. This is a loss corresponding to almost 1 K, which, calculated into an efficiency loss is about 2‐3 %.
Pressure drop
-50
0
50
100
150
200
250
300
350
400
0 2 4 6 8 10 12 14 16 18 20 22Time elapsed after
compressor start [minutes]
pressure drop[mbar]
SuctionlineEvaporator
Condenser
Figure 48 Pressure drop over the heat exchangers and the suction line during one on-cycle.
Carrera (2002) addressed the subject of evaporator activation in the early on‐cycle. For a straight circular tube evaporator experiments were conducted to find different parameters influence on the dryout point velocity (velocity of the location where superheat starts in the evaporator). It was fond that the inclination, the thermal mass, the initial temperature and the internal diameter of the straight tube evaporator had a strong influence of the dryout point velocity.
In Figure 49 the results from the inclination experiments are displayed. It is seen that the dryout point velocity is significantly increased when the evaporator pipe has a downward inclination. The results indicate a velocity increase of more than 40 % with a downward inclination of only 10°.
94
0
0,02
0,04
0,06
0,08
0,1
0,12
0,14
0,16
-20 0 20 40 60 80 100
Inclination angle (Degrees)
Velo
city
( m
/s)
1,02 g/s mass flow0,85 g/s mass flow0,47 g/s mass flow
Figure 49 Dryout point velocity for different circular tube evaporator inclinations. Positive inclination means upward flow.
In Figure 50 the results from different evaporator materials are displayed. It was found that the evaporator made of copper had the slowest dryout point velocity. This was explained by a much higher thermal conductivity for the copper (Copper 401.8 W/m K and Stainless steel 13.2 W/m K).
00,0050,01
0,0150,02
0,0250,03
0,0350,04
0,0450,05
0 0,1 0,2 0,3 0,4 0,5 0,6
Mass Flow (g/s)
Velo
city
(m/s
)
Stainless SteelCopperBrass
Figure 50 Dryout point velocity for different circular tube evaporator materials. For more information about this experiment see Carrera (2002).
The same study also found that the progression of the dryout point was faster when the internal diameter decreased. The velocity approximately doubled when the tube diameter was reduced by 50 %. However, at the price of increased pressure drop.
95
Overall it was concluded that the evaporator should have a low thermal mass and that the refrigerant pipes should have a small internal diameter and have a downward inclination in order to have a low activation time.
Setiawan (2002) addressed the problem of refrigerant liquid “slugging out” from the evaporator in the early on‐cycle. Experiments were undertaken on an evaporator having observation glass. A new design of the evaporator accumulator was proposed.
Björk et al (2002) made a pilot study of the charge inventory technique that later was used by the author for Papers D, E and F.
Herolf (2004) used an infrared camera to study the free convection heat and mass transfer in the vertical mid plane of a household refrigerator. A screen was located in the refrigerator vertical mid plane at which the air temperatures could be viewed through the IR‐camera. The results were compared to a numerical simulation carried out in FEMLAB.
-0,4 °C 11,6 °C-0,4 °C 11,6 °C
Figure 51 Temperatures in a vertical mid plane of a refrigerator, left: thermo graphic study, right: FEMLAB 2D simulation (figures adopted from Herolf, 2004).
In Figure 51 the experimental and simulated temperature fields in the vertical mid plane of a household refrigerator are shown. Temperature stratification is seen, with lower temperature at the bottom and higher at the top. Interestingly, the thermo graphic study (left plot) indicates diagonal isotherms with the highest temperature at the top right positions. In the simulations the isotherms were typically horizontal. It appears that the mixing effect was stronger than what was predicted in the numerical simulation. In the simulation one can see a thermal boundary layer with increasing thickness at the bottom part of the evaporator. This result is in agreement with analytical solutions for the laminar boundary layer in free convection.
96
5. Conclusions In the first part of this thesis the objective was to find applicable correlations on how to calculate heat transfer and pressure drop for a household refrigerator evaporator. The suggested correlations are presented in papers A, B and C.
The air side convective heat transfer can be estimated by the correlations suggested by Churchill and Chu (3) and Bar‐Cohen and Rhosenow (4), (see also chapter 3 and Paper A for details):
2
278
169
61
)Pr)/492.0(1(
387.0825.0⎟⎟⎟
⎠
⎞
⎜⎜⎜
⎝
⎛
++= L
LRaNu (3)
21
212
)/(
87.2)/(
144−
⎟⎟
⎠
⎞
⎜⎜
⎝
⎛+=
LSRaLSRaNu
SS
S
(4)
Equation 3 should be used to estimate the evaporator front side heat transfer coefficient. Equation 4 should be used to estimate the evaporator backside heat transfer coefficient.
To estimate the thermal radiation the following black body radiation exchange correlation can be used:
)( 44
1jiij
N
jii TTFAq −=∑
=
σ
(5)
The local flow boiling heat transfer can be calculated by a slightly modified version of the Shah correlations, (see also chapter 3 and paper B for details):
ltp hh /=Ψ (8)
9.0/0.3 Co=Ψ (9)
5.08.0 )/()1/1( lgxCo ρρ−= (10)
DkxDGh lll
l /Pr)1(023.0 4.08.0
⎥⎦
⎤⎢⎣
⎡ −⋅⋅=
μ (11)
97
The pressure drop, finally, can be calculated by the homogeneous model (see also chapter 3 and paper C for details):
dzd
ufp friction ∫ ⋅⋅⋅=Δ1
0
2 1ρ (17)
where 41
Re158.0−
⋅=f
(18)
μhdG ⋅
=Re
(19)
PA
d ch
4=
(20)
ll
vv
xxρ
ρμρρμμ )1( −+⋅=
(21)
))1/((1 vl vxvx ⋅+⋅⋅−=ρ (22)
ρ/Gu =
(23)
(24) cAmG /&=
The pressure drop due to acceleration is calculated by:
)(2
inletoutletonaccelerati vvGp −⋅=Δ
(25)
vl vxvxv ⋅+⋅−= )1( (26)
where the vapour quality x is taken at the inlet and outlet respectively.
Overall, it is clear that the largest thermal resistance is at the evaporator air side for a plate type evaporator. For instance, at the air side the overall heat transfer coefficient was approximately 8 W/m²K (Paper A). On the refrigerant side it was about 4 kW/m²K (Paper B) or about 500 times higher12. It follows that a larger potential for energy saving exist in the temperature difference at the air side than on the refrigerant side. It was for instance shown in paper A (and supported in chapter 4, Figure 42) that there is a potential to lower the energy consumption by about 10 % if the evaporator is oriented differently. Even if this potential was found when the evaporator was positioned freely in the middle of the refrigerator cabinet, which is a highly impractical solution, it clearly indicates that the evaporator backside is poorly used for heat transfer. The same paper (A) showed that the heat transfer degradation at the evaporator backside was a result of restricted air
12 The ratio between the air side area and refrigerant side area of the evaporator studied was approximately 4
98
flow and decreased thermal radiation. There are most likely possibilities here for design modifications that will give higher system efficiency.
The second part of the thesis focused on the overall cooling system.
In Paper D the development of a new and fully automatic method intended for charge inventory measurements was described. It was shown that this method is accurate and that it gives large time savings for repetitive measurements.
In Paper E the charge inventory results recorded at transient conditions were reported. The results were used to estimate the cyclic losses. Four losses were identified in total accounting for about 8 % in efficiency: 1. Refrigerant pulled out from evaporator as liquid during start‐up (2.3 %). 2. Refrigerant vapour pumped through the capillary tube before a liquid seal is formed at start‐up (0.4 %). 3. Improperly charged heat exchangers following the start‐up (3 %). 4. Vapour entering the evaporator through the capillary tube during the off‐cycle (2.4 %). It was also found that the capillary tube mass flow was very sensitive to the inlet condition at nearly saturated conditions. The results indicated a sharp mass flow decrease when vapour came into contact with the capillary tube inlet. In Paper F charge inventory results at steady state conditions were reported. Overall the results indicates a robust and “forgiving” cooling system at varied thermal load with no observed superheat or subcooling over the range of tested conditions. This shows that a simple cooling system having a capillary tube expansion device can operate in a similar way as a more sophisticated thermostatic expansion device system. The combination of a low side accumulator and a capillary tube with high capacity explains this. It was clearly seen that the evaporator accumulator operated as a charge bank from which refrigerant was borrowed to other parts of the system when the thermal load increased.
In Paper G the subject of throttling and charging was explored. It was found that the system efficiency was insensitive to either refrigerant charge or expansion device capacity within a range of settings. Again, the low side accumulator explained the charge insensitivity. For the expansion device there were strong indications that the inlet condition was fixed at a nearly saturated condition, even when the expansion device capacity was increased (as was also seen in paper E), giving as a result a good system self regulation and a quickly restored charge distribution in the on‐cycle.
In Paper H, the thermographic study clearly visualized some of the cyclic losses identified in paper E. It was suggested to redesign the evaporator channels in a downward slope in order to speed up the evaporator activation following a start‐up. It was also suggested to have a smaller internal diameter at the upstream part of the evaporator. The liquid suction phenomenon at start‐up was discussed and it was concluded that the suction line heat exchanger played an important role to reduce this loss. The results also showed that during the later part of the on‐cycle the evaporator’s edges were at higher temperatures than the central part of the evaporator (Figure 35). Thus, the edges were not effectively used for heat transfer. By using numerical simulation tools it was estimated that the efficiency loss was approximately 1‐2 %. To overcome this, the refrigerant channels could be moved closer towards the edges of the plate. Finally, in chapter 4 describing other work within the project it was experimentally found that short cycling (running the cooling system at shorter cycle lengths) was a simple way to improve the
99
efficiency. With a cycle length of 10‐20 min the energy consumption was about 5 % lower compared to the original 30 min cycle (Figure 42). For the pressure drop, which typically is in the order of 1‐2 °C across the evaporator studied, one should not forget the pressure drop across the suction line. In this, the vapour velocity is high and so is the pressure drop. In fact, the pressure drop across the suction line was found to be of the same magnitude as over the evaporator or about 1‐2 °C (Figure 48). The main contributions of this work are:
+ Correlations are suggested on how to calculate heat transfer and pressure drop in a household refrigerator evaporator.
+ A potential to increase the efficiency by about 10 % was revealed at the air side by changing the flow and radiation conditions around the evaporator.
+ Thin film evaporation at tube walls repeatedly wetted by liquid plugs was suggested to be the physical explanation to the unexpectedly high boiling heat transfer coefficients observed. This view challenges conventional in‐tube evaporation knowledge.
+ A new method was developed on how to measure refrigerant charge at different locations in the cooling system.
+ Charge distribution was measured at transient and steady state conditions from which a new understanding of the system operation was achieved. Cyclic losses were estimated based upon the experimental data.
+ The subject of “throttling and charging” was systematically investigated. Results indicate insensitivity for a wide range of settings.
+ Experimental evidence suggests that the capillary tube mass flow is very sensitive to the inlet condition when the refrigerant is nearly saturated. It is sharply reduced when the subcooling disappears and vapour enters its inlet. This effect appears to be a key mechanism for quick charge redistribution at start‐up and for a stable charge distribution at varied thermal conditions.
+ A practical method on how to optimize the capillary tube length and the quantity of charge is described.
+ The cyclic losses were estimated to be 8 % (efficiency) for the studied refrigerator. In order to reduce these losses it was suggested to modify the evaporator channels into a downward inclination and to use smaller diameter at the upstream part.
+ Suggestions are made on how to increase the efficiency (1‐2 %) at steady state conditions by moving the refrigerant channels closer to the evaporator edges.
+ Short cycling was found to increase the efficiency about 5 %.
The main limitation is that:
100
‐ Only one type of household refrigerator having one type of free convection plate type evaporator was studied. Therefore some of the conclusions are limited to similar types of refrigerators. The configuration of the evaporator; including its location in the cabinet and its internal refrigerant line outline are examples where the conclusions may be limited.
Björk E., 2005, A simple technique for refrigerant mass measurement, Applied Thermal Engineering 25, pp. 1115–1125
Björk E., Palm B., 2006a, Refrigerant mass charge distribution in a domestic refrigerator. Part I. Transient conditions, Applied Thermal Engineering 26, pp. 829‐837
Björk E., Palm B., 2006b, Refrigerant mass charge distribution in a domestic refrigerator. Part II. Steady state conditions, Applied Thermal Engineering 26, pp. 866‐871
Björk E., Palm B., 2006c, Performance of a domestic refrigerator under influence of varied expansion device capacity, refrigerant charge and ambient temperature. International Journal of Refrigeration 29, pp. 789‐798
Björk E, Palm B., 2008, Flow boiling heat transfer at low flux conditions in a domestic refrigerator evaporator. International Journal of Refrigeration 31, pp. 1021‐1032
Björk E., Palm B., 2010, A thermographic study of the on‐off behavior of an all‐refrigerator, Applied Thermal Engineering 30, pp 1974‐1984.
Conference papers
Björk E., 2001, Slug formation in a domestic refrigerator with plate evaporator, Proc. International Conference on Multiphase Flow, New Orleans, USA
Björk E., 2002, Pressure drop in a plate evaporator for refrigerators. Proc. 1st International conference on Heat Transfer, Fluid Mechanics and Thermodynamics (HEFAT), Kruger National Park, South Africa
Björk E., Rücker A., Phudungsilp A., Isgren E., Nozadze S., 2002, Charge distribution in a domestic refrigerator, Proc. Zero leakage – minimum charge, Efficient systems for refrigeration, Air conditioning and Heat pumps, Joint meeting of the IIR, Section B and E, Stockholm, Sweden, August 26‐28
Björk E., Setiawan T., S., Palm B., 2003, Air side heat transfer of a domestic refrigerator plate‐type evaporator. Presented at The Eurotherm Seminar No 72, Valencia, Spain
Other publications
Björk E., Palm B., 1998, Effektivare förångare till kyl‐ och frysskåp, Planerade aktiviteter och resultat av inledande studier, Proc. Klimat 21 day (in Swedish)
105
Björk E., 1999, Effektivare förångare till kyl‐ och frysskåp, Proc. Klimat 21 day, 1999 (in Swedish)
Björk E., 2000, Effektivare förångare till kyl‐ och frysskåp, Proc. Industrial Seminar at KTH (in Swedish)
Björk E., 2000, Effektivare förångare till kyl‐ och frysskåp, Poster at Nordbygg (in Swedish)
Björk E., 2000, Effektivare förångare till kyl‐ och frysskåp, Poster at Sollentuna kyl‐ och värmepumpdagar (in Swedish)
Björk E., 2000, Effektivare förångare till kyl‐ och frysskåp, Proc. Industrial Seminar at KTH (in Swedish)
Björk E., 2001, Effektivare förångare till kyl‐ och frysskåp, Final report Klimat 21 (in Swedish)
Björk E., 2002, Effektivare kylsystem till kyl‐ och frysskåp, Proc. EFFSYS day (in Swedish)
Björk E., 2002, Historien om hur kyl och frysskåp blev energisnåla, KYLA (in Swedish)
Björk E., 2003, Effektivare kylsystem till kyl‐ och frysskåp, Proc. EFFSYS day (in Swedish)
Björk E., 2003, Simulering av temperatur‐ och hastighetsfält i ett kylskåp med hjälp av datorprogrammet FEMLAB, Proc. for the Industrial Seminar at KTH (in Swedish)
Björk E., 2004, Effektivare kylsystem till kyl‐ och frysskåp, final report EFFSYS (in Swedish)
Björk E., 2005, A simple technique for refrigerant mass measurement, Proc. for the industrial seminar at KTH (in Swedish)
106
References
Abdel‐Wahed R. M., Hifni M. A., Sherif S. A., 1984, Heat and mass transfer from a laminar humid air stream to a plate at subfreezing temperature, International Journal of Refrigeration, Volume 7, Issue 1, Pages 49‐55 Aihara T., Gakumasawa H., Maruyama S., Hongoh M., 1989, Frost formation and defrosting on tube‐array evaporators in a fluidized bed and an impinging jet, Experimental Thermal and Fluid Science, Volume 2, Issue 1, Pages 65‐71
ASHRAE handbook, equipment volume, 1988, ISBN: 0‐910110‐52‐2, pp. 19:21‐19:30
ASHRAE handbook, Refrigeration (SI)
Bansal P.K., Rupasinghe A.S., 1996, An empirical model for sizing capillary tubes, International Journal of Refrigeration 19, 497‐505
Bansal P.K., Wang G., 2004, Numerical analysis of choked refrigerant flow in adiabatic capillary tubes, Applied Thermal Engineering 24, 851‐863
Bansal P.K., Xu B., 2003, A parametric study of refrigerant flow in non‐adiabatic capillary tubes, Applied Thermal Engineering 23, 397‐408
Bansal P., Vineyard E., Abdelaziz O., 2011, Advances in household appliances‐ A review, Applied Thermal Engineering, Volume 31, Issues 17‐18, Pages 3748‐3760
Bergles A.E. and Rohsenow M., 1964, The determination of forced‐convection surface‐boiling heat transfer, Journal of Heat Transfer, vol. 86, pp. 365‐372
Bird R.B., Stewart W.E., Lightfoot E.N., 1960, Transport Phenomena (New York: John Wiley & Sons, Inc.)
Björk E., 2000, Effektivare förångare till kyl‐ och frysskåp, Final report Klimat 21 (in Swedish)
Björk E., 2001, Slug formation in a domestic refrigerator with plate evaporator, Proc. International Conference on Multiphase Flow, New Orleans, USA
Björk E., 2002, Pressure drop in a plate evaporator for refrigerators, Proc. 1st International conference on Heat Transfer, Fluid Mechanics and Thermodynamics (HEFAT), Kruger National Park, South Africa
Björk E., Rücker A., Phudungsilp A., Isgren E., Nozadze S., 2002, Charge distribution in a domestic refrigerator. Proc. Zero leakage – minimum charge, Efficient systems for refrigeration, Air conditioning and Heat pumps, Joint meeting of the IIR, Section B and E, Stockholm, Sweden, August 26‐28
Björk E., Setiawan T., S., Palm B., 2003, Air side heat transfer of a domestic refrigerator plate‐type evaporator. Presented at The Eurotherm Seminar No 72, Valencia, Spain
107
Björk E., 2003, Effektivare kylsystem till kyl‐ och frysskåp, proceeding EFFSYS day (in Swedish)
Björk E., 2004, High efficiency cooling systems for refrigerators and freezers, Final report EFFSYS (in Swedish)
Björk E., 2005, A simple technique for refrigerant mass measurement, Applied Thermal Engineering 25, pp. 1115–1125
Björk E., Palm B., 2006a, Refrigerant mass charge distribution in a domestic refrigerator. Part I. Transient conditions, Applied Thermal Engineering 26, pp. 829‐837
Björk E., Palm B., 2006b, Refrigerant mass charge distribution in a domestic refrigerator. Part II. Steady state conditions, Applied Thermal Engineering 26, pp. 866‐871
Björk E., Palm B., 2006c, Performance of a domestic refrigerator under influence of varied expansion device capacity, refrigerant charge and ambient temperature, International Journal of Refrigeration 29, pp. 789‐798
Björk E, Palm B., 2008, Flow boiling heat transfer at low flux conditions in a domestic refrigerator evaporator, International Journal of Refrigeration 31, pp. 1021‐1032
Carey Van P., 1992, Liquid‐Vapor Phase Change Phenomena, Hemisphere Publishing corporation, ISBN 1‐56032‐074‐5
Carrera A.M., 2002, Influencing parameters on the refilling time of evaporators, Master of science thesis, Department of energy technology, Royal institute of technology, Stockholm, Sweden
Chen J.C., 1966, Correlation for boiling heat transfer to saturated fluids in convective flow, I&EC Process Design and Development, vol. 5, pp. 322‐329
Chisholm D., 1967, A theoretical basis for the Lockhart Martinelli correlation for two‐phase flow, International Journal of Heat and Mass Transfer, Vol. 10, pp. 1767‐1768, 1967
Choi J. Kim Y, 2004, Influence of the expansion device on the performance of a heat pump using R407C under a range of charging conditions, International Journal of Refrigeration 27, 387‐384
Coulter W. H. and Bullard C. W., 1997, An experimental analysis of cycling losses in domestic refrigerator‐freezers, ASHRAE Transactions Vol. 103, No. 1 pp. 587‐596
Da Silva L. W., Melo C., Pereira R. H., 1999, Heat transfer characteristics of plate‐type evaporators, Proc. 20th International Congresss of Refrigeration, IIR/IIF, Sydney Des Champs C. J., Prata A.T., Lopes L.A.D. and Schmid A., 1999, Heat and Fluid flow inside a houshold refrigerator cabinet, 20th ICR, IIR/IIF, Sydney Ding G., Zhang C., Lu Z., 2004, Dynamic simulation of natural convection bypass two‐circuit cycle refrigerator‐freezer and its application, Part 1: Component models. Applied Thermal Engineering Vol. 24, pp. 1513‐1524
108
Dmitriyev V. I., Pisarenko V. E., 1984, Determination of optimum refrigerant charge for domestic refrigerator units, Int. J. Refrigeration, Vol.7, Issue 3, pp.178‐180
Energiläget 2009, Swedish National Energy Agency, www.energimyndigheten.se
Effektiv energianvändning, 2000, En analys av utvecklingen 1970‐1998, ER 22:2000, Swedish National Energy Agency
Fossa M., Tanda G., 2002, Study of free convection frost formation on a vertical plate, Experimental Thermal and Fluid Science, Volume 26, Issues 6‐7, Pages 661‐668
Garcia‐Valladares O., 2004, Review of numerical simulation of a capillary tube using refrigerant mixtures, Applied Thermal Engineering 24, 949‐966
Gigiel A., 2004, Safety testing of domestic refrigerators using flammable refrigerants, International Journal of Refrigeration, Volume 27, Pages 621‐628
Granryd et al., 1999, Refrigerating engineering, Royal Institute of Technology, KTH, Stockholm
Granryd E., 2005, Refrigerating engineering, Part 2, chapter 15, Royal Institute of Technology, KTH, Stockholm
Harrington L., 2009, A new global test procedure for household refrigerators, proceedings at the 5th International Conference on Energy Efficiency in Domestic Appliances and Lighting (EEDAL’09). Herolf A., 2004, Free convection heat and mass transfer in a domestic refrigerator, Master of science thesis, Department of energy technology, Royal institute of technology, Stockholm, Sweden Hewitt C. F., 1998, Heat exchanger design handbook, Begell house, inc., Part 2, Fluid mechanics and heat transfer, Section 2.3.2, Gas liquid flow Inan C., Gonul T., Tanes M., 2003, X‐ray investigation of a domestic refrigerator, Observations at 25°C ambient temperature, International Journal of Refrigeration 26, 205–213
Incropera F. P. and DeWitt D. P., 1996, Fundamentals of Heat and Mass Transfer, 4th ed. John Wiley & Sons, Inc., ISBN 0‐471‐30460‐3
International standard, ISO 7371, Reference number ISO7371:1995(E)
Jakobsen A., 1995, Energy Optimisation of Refrigeration Systems, The Domestic Refrigerator – a Case Study, Ph. D. Thesis, Refrigeration Laboratory, Technical University of Denmark
Janssen M.J.P., 1989, Cycling losses in cooling circuits MSc Thesis, WOP‐WET 89.002, Eindhoven University of Technology
Janssen M.J.P., Kuijpers L.J.M., de Wit J.A., 1988, Theoretical and Experimental Investigation of a Dynamic Model for small Refrigerating Systems, Proc. Purdue IIR Conference
Janssen M.J.P., de Witt J.A. and Kuijpers, L.J.M., 1992, Cycling losses in domestic appliances: an experimental and theoretical analysis, International Journal of Refrigeration Vol. 15, No. 3
Johnson Robert W., 2004, The effect of blowing agent choice on energy use and global warming impact of a refrigerator International Journal of Refrigeration, Volume 27, Issue 7, Pages 794‐799
Kang, H., Joo, Y., Kim, Y., 2008, Effects of flash gas generation at the expansion device inlet on the dynamic characteristics of a refrigeration system, International Journal of Refrigeration, Volume 31, Issue 3, Pages 396‐403
Kattan N., Thome J.R., Favrat D., 1998, Flow boiling in horizontal tubes: Part 1‐Development of a diabatic two‐phase flow pattern map, Journal of Heat Transfer, vol. 120, pp. 140‐148
Kattan N., Thome J.R., Favrat D., 1998, Flow boiling in horizontal tubes: Part 2‐New heat transfer data for five refrigerants, Journal of Heat Transfer, vol. 120, pp. 148‐156, 1998
Kattan N., Thome J.R., Favrat D., 1998, Flow boiling in horizontal tubes: Part 3‐Development of a new heat transfer model based on flow pattern, Journal of Heat Transfer, vol. 120, pp. 156‐165
Krause P. E. and Bullard C. W., 1996, Cycling and quasi‐steady behavior of a refrigerator, ASHRAE Transactions: Symposia, vol. 19, part 1, pp. 1061‐1069
Kline S. J., and McClintock F. A., 1953, Describing uncertainties in single sample experiments, Mech. Eng., 3‐8
Kuijpers L.J.M., Janssen M.J.P. and de Wit J.A., 1987, Experimental verification of liquid hold‐up predictions in small refrigeration heat exchangers. Proc. XVIIth Int. IIR‐Cong. Refrigeration, Vienna
Kuijpers L.J.M., Janssen M.J.P., Verboven P.J.M., 1988, The influence of the refrigerant charge on the functioning of small refrigerating appliances, ASHRAE transactions 94, 813‐828
Laguerre O., Ben Amara S., Flick D., 2005, Experimental study of heat transfer by natural convection in a closed cavity: application in a domestic refrigerator, Journal of Food Engineering 70, 523–537
Laguerre O., Ben Amara S., Moureh J., Flick D., 2007, Numerical simulation of air flow and heat transfer in domestic refrigerators Journal of Food Engineering, Volume 81, Issue 1, Pages 144‐156
Lee M. Y., Lee D..Y., Kim Y., 2008, Performance characteristics of a small‐capacity directly cooled refrigerator using R290/R600a (55/45), International Journal of Refrigeration, Volume 31, Issue 4, Pages 734‐741
Lockhart R. W., and Martinelli R. C., 1949, Proposed correlation of data for two‐phase two‐component flow in pipes, Chemical Engineering Progress, Vol. 45, No. 1, 39‐48
Lorentzen G., 1978, Food preservation by refrigeration, a general introduction, International Journal of Refrigeration, Volume 1, Issue 1, Pages 9‐12
Lu Z., Ding G., Zhang C., 2004, Dynamic simulation of natural convection bypass two‐circuit cycle refrigerator‐freezer and its application, Part 2: System simulation and application. Applied Thermal Engineering 24, 1525‐1533
Mahlia T.M.I, Saidur R., 2010, A review on test procedure, energy efficiency standards and energy labels for room air conditioners and refrigerator–freezers, Renewable and Sustainable Energy Reviews, Volume 14, Issue 7, Pages 1888‐1900
Massey B.S., 1994, Mechanics of Fluids, sixth edition, Chapman & Hall Melo C., Viera L. A. T., Pereira R. H., 2002, Non‐adiabatic capillary tube flow with isobutane, Applied Thermal Engineering 22, 1661‐1672
Mezavila K.C., Melo C., 1996, An homogeneous model to simulate refrigerant flow through non‐adiabatic capillary tubes, Proc. International Refrigeration Conference at Purdue University, USA
Molina, M.J., and Rowland, F.S., 1974, Stratospheric Sink for Chlorofluoromethanes: Chlorine Atom‐Catalysed Destruction of Ozone Nature 249 pp. 810‐812
Mulroy W.J., Didion D.A., 1985, Refrigerant migration in a split‐unit air conditioner ASHRAE Trans 91, Part 1A, pp. 193‐206
Mälhammar Å., Frostpåslag vid flänsade ytor, 1986, Doctoral thesis, Dept of Applied thermodynamics and refrigeration, Royal Institute of Technology, Stockholm. Sweden
Negrão C.O.R., Hermes C.J.L., 2011, Energy and cost savings in household refrigerating appliances: A simulation‐based design approach, Applied Energy, Volume 88, Issue 9, Pages 3051‐3060
Nordenberg J., 2001, Redistribution of migrated refrigerant, Master of Science thesis, Department of energy technology, Royal Institute of Technology, Stockholm, Sweden
Pate M.B., Tree D.R., 1984, A linear quality model for capillary tube‐suction line heat exchangers, ASHRAE Transactions 90, 3‐17
Pierre B., 1964, Flow resistance with boiling refrigerants, part 1 and 2, ASHRAE Journal
Radermacher R., Kim K., 1996, Domestic refrigerators: recent developments, International Journal of Refrigeration, Volume 19, Issue 1, Pages 61‐69
Rice C.K., 1987, The effect of void fraction correlation and heat flux assumption on refrigerant charge inventory predictions, ASHRAE Transactions 88
Rosenfeld A. 1999, The Art of Energy Efficiency: Protecting the Environment with Better Technology, Annual Review of Energy and Environment. 14:33‐82.
Rubas P. J. and Bullard C. W., 1995, Factors contributing to refrigerator cycling losses, International Journal of Refrigeration, vol. 18. No. 3, pp. 168‐176
Schneider H. W., 1978, Equation of the growth rate of frost forming on cooled surfaces International Journal of Heat and Mass Transfer, Volume 21, Issue 8, Pages 1019‐1024
Shah M.M., 1976, A new correlation for heat transfer during boiling through pipes, ASHRAE transactions, vol. 92, pp. 66‐86
Smith M.K., Wattelet J.P., Newell T.A., 1993, A study of evaporation heat transfer coefficient correlations at low heat and mass fluxes for pure refrigerants and refrigerant mixtures, ASME HTD, Heat transfer with alternate refrigerants, vol. 243, pp. 19‐26
Tassou S. A., Marquand C. J., 1987, Effects of evaporator frosting and defrosting on the performance of air‐to‐water heat pumps, Applied Energy, Volume 28, Issue 1, Pages 19‐33
Varma H. K., Charan V., Soogappa P., 1978, Simultaneous heat and mass transfer to flat plate in humid air stream under frosting conditions, Letters in Heat and Mass Transfer, Volume 5, Issue 5, Pages 297‐305
Vjacheslav N., Rozhentsev A., Wang C., 2001, Rationally based model for evaluating the optimal refrigerant mass charge in refrigerating machines, Energy Conversion and Management 42, 2083‐2095
Wang J., Wu Y., 1990, Start‐up and shut‐down operation in a reciprocating compressor refrigeration system with capillary tubes, International Journal of Refrigeration, Volume 13, Issue 3, Pages 187‐190
Wambsganss M. W., Jendrzejczyk J. A., France D. M., Obot N. T., 1992, Frictional pressure gradients in two‐phase flow in a small horizontal rectangular channel, Experimental Thermal and Fluid Science, Vol. 5, No. 1, pp. 40‐56
Wattelet J.P., Chato J.C., Souza A.L., Christoffersen B.R., 1984, Evaporative characteristics of R‐12, R‐134a, and a mixture at low mass fluxes, ASHRAE transactions, vol. 100, pp. 603‐615
Wolf D.A., Pate M.B., 2002, Capillary tube‐suction line heat exchanger performance with alternative refrigerants, 948‐RB, final report, Iowa state university of science and technology
Setiawan A., T., Understanding cyclic losses in a plate evaporator of domestic refrigerators, Master of science thesis, Department of energy technology, Royal institute of technology, Stockholm, Sweden 2002
Sinpiboon J., Wongwises S., 2002, Numerical investigation of refrigerant flow through non‐adiabatic capillary tubes, Applied Thermal Engineering 22, 2015‐2032
Yu W., France D. M., Wambsganss M. W., Hull J. R., 2002, Two‐phase pressure drop, boiling heat transfer, and critical heat flux to water in a small‐diameter horizontal tube, International Journal of Multiphase Flow, Vol. 28, pp. 927‐941
Yoon W. J., Jung H. W., Chung H. J., Kim Y., 2011, Performance optimization of a two‐circuit cycle with parallel evaporators for a domestic refrigerator–freezer, International Journal of Refrigeration, Volume 34, Issue 1,, Pages 216‐224
Xu B., Bansal P.K., 2002, Non‐adiabatic capillary tube flow: a homogeneous model and process description, Applied Thermal Engineering 22, 1801‐1819
Zhang C., Ding G., 2004, Approximate analytic solutions of adiabatic capillary tube, International Journal of Refrigeration
A. Björk E., Setiawan T., S., Palm B., 2003, Air side heat transfer of a domestic refrigerator
plate‐type evaporator. Presented at The Eurotherm Seminar No 72, Valencia, Spain
B. Björk E., Palm B., 2008, Flow boiling heat transfer at low flux conditions in a domestic refrigerator evaporator. International Journal of Refrigeration 31, pp. 1021‐1032
C. Björk E., 2002, Pressure drop in a plate evaporator for refrigerators. Proc. 1st International conference on Heat Transfer, Fluid Mechanics and Thermodynamics (HEFAT), Kruger National Park, South Africa
D. Björk E., 2005, A simple technique for refrigerant mass measurement, Applied Thermal Engineering 25, pp. 1115–1125.
E. Björk E., Palm B., 2006a, Refrigerant mass charge distribution in a domestic refrigerator. Part I. Transient conditions, Applied Thermal Engineering 26, pp. 829‐837
F. Björk E., Palm B., 2006b, Refrigerant mass charge distribution in a domestic refrigerator. Part II. Steady state conditions, Applied Thermal Engineering 26, pp. 866‐871
G. Björk E., Palm B., 2006c, Performance of a domestic refrigerator under influence of varied expansion device capacity, refrigerant charge and ambient temperature. International Journal of Refrigeration 29, pp. 789‐798
H. Björk E., Palm B., 2010, A thermographic study of the on‐off behaviour of an all‐refrigerator, Applied Thermal Engineering 30, pp 1974‐1984.