High-resolution dynamically downscaled rainfall andtemperature projections for ecological life zones withinPuerto Rico and for the U.S. Virgin Islands
Jared H. Bowden1 | Adam J. Terando1,2 | Vasu Misra3,4,5 |
Adrienne Wootten6 | Amit Bhardwaj4,5 | Ryan Boyles1,2 | William Gould7 |
Jaime A. Collazo1,8 | Tanya L. Spero9
1Department of Applied Ecology, NorthCarolina State University, Raleigh, NorthCarolina2Southeast Climate Adaptation ScienceCenter, Raleigh, US Geological Survey,North Carolina3Department of Earth, Ocean, andAtmospheric Science, Florida StateUniversity, Tallahassee, Florida4Center for Ocean-Atmospheric PredictionStudies, Florida State University,Tallahassee, Florida5Florida Climate Institute, Florida StateUniversity, Tallahassee, Florida6South Central Climate AdaptationScience Center, Norman, Oklahoma7International Institute of TropicalForestry, San Juan, Puerto Rico8US Geological Survey, North CarolinaCooperative Fish and Wildlife ResearchUnit, Raleigh, North Carolina9Office of Research and Development, U.S. Environmental Protection Agency,Research Triangle Park, Triangle Park,NorthCarolina
CorrespondenceJared H. Bowden, North Carolina StateUniversity, 100 Eugene Brooks Avenue,Campus Box 7617, Raleigh, NC27695-7617.Email: [email protected]
The weather research and forecasting (WRF) model and a combination of the
regional spectral model (RSM) and the Japanese Meteorological Agency Non-
Hydrostatic Model (NHM) were used to dynamically downscale selected
CMIP5 global climate models to provide 2-km projections with hourly model
output for Puerto Rico and the U.S. Virgin Islands. Two 20-year time slices
were downscaled for historical (1986–2005) and future (2041–2060) periods fol-lowing RCP8.5. Projected changes to mean and extreme temperature and pre-
cipitation were quantified for Holdridge life zones within Puerto Rico and for
the U.S. Virgin Islands. The evaluation reveals a persistent cold bias for all
islands in the U.S. Caribbean, a dry bias across Puerto Rico, and a wet bias on
the windward side of mountains within the U.S. Virgin Islands. Despite these
biases, model simulations show a robust drying pattern for all islands that is
generally larger for Puerto Rico (25% annual rainfall reduction for some life
zones) than the U.S. Virgin Islands (12% island average). The largest precipita-
tion reductions are found during the more convectively active afternoon and
evening hours. Within Puerto Rico, the model uncertainty increases for the
wetter life zones, especially for precipitation. Across the life zones, both
models project unprecedented maximum and minimum temperatures that
may exceed 200 days annually above the historical baseline with only small
changes to the frequency of extreme rainfall. By contrast, in the U.S. Virgin
Islands, there is no consensus on the location of the largest drying relative to
the windward and leeward side of the islands. However, the models project the
largest increases in maximum temperature on the southern side of St. Croix
and in higher elevations of St. Thomas and St. John.
KEYWORD S
climate change, Puerto Rico, regional climate modelling, USVI
Received: 25 November 2019 Revised: 18 August 2020 Accepted: 19 August 2020
Islands in the northern Caribbean are vulnerable toextreme weather-related disasters. The projectedincrease in global greenhouse gases (GHGs) depicts aworld with an increasing threat of widespread drought(Dai, 2013) and stronger tropical cyclones with higherrainfall rates (Knutson et al., 2019a; 2019b). Recently, in2015, Puerto Rico, located in the northern Caribbean,experienced one of the most severe droughts within theisland's observational record in 2015 (�Alvarez-Berríoset al., 2018) and just 2 years later took a direct hit fromHurricane Maria in which rainfall totals exceeded 30 in.within some parts of the island (Pasch et al., 2019). Hur-ricane Maria is one of the deadliest and costliest stormsin U.S. history with an estimated 3,000 deaths (Santos-Burgoa et al., 2018) and costs exceeding 90 billion USD(NOAA NCEI, 2019).
These recent disasters are concerning, especiallywhen they are put into the context of observed and simu-lated changes within the climate system. Puerto Rico andneighbouring islands lie at the edge of the convectivezone of the tropics but are projected to experience signifi-cant reductions in total precipitation (i.e., “drying”) thiscentury as GHGs and temperatures increase (Neelinet al., 2006). Lau and Kim (2015) discuss projectedchanges in precipitation at the subtropical margins froman ensemble of global climate models. The study illus-trates a future climate with more intense tropical convec-tion organized over a narrower region which in returnfavours a drier subtropical atmosphere, especially on theequatorward side of the subtropical margins as a result ofenhanced subsidence. This large-scale “subtropical” pre-cipitation decline is considered part of the “dry get drier”and “upped-ante” phenomenon first proposed by Heldand Soden (2006). He and Soden (2017) caveated thefinding of declining subtropical precipitation by notingthat the drying pattern is primarily limited to over theocean. He and Soden (2017) illustrate that this precipita-tion decline is a response to the continental land-seawarming contrast, the direct radiative forcing of CO2,and sea surface temperature pattern changes within thenorthwest Atlantic and southeast Pacific. Dai et al. (2018)further show the reduction in subtropical precipitation islikely to be a persistent feature in a warmer climate andnot just a transient response to an increase in GHGs.However, studying future drought events associated withlarge-scale changes in the atmosphere becomes compli-cated for many subtropical islands when also consideringextreme rainfall from tropical cyclones. Warming sea sur-face temperatures have been correlated with weakerwind shear within the Caribbean (Kossin andVimont, 2007; Vimont and Kossin, 2007; Kossin, 2017),
so the atmosphere is more conducive to producing stron-ger storms. Additionally, tropical cyclones may intensifymore quickly as the oceans continue to warm(Emanuel, 2017) and move more slowly (Kossin, 2018),as observed with Hurricanes Harvey (2017), Florence(2018), and Dorian (2019). Despite the possibility ofstronger and slower-moving tropical cyclones withintense rainfall, the Caribbean warrants more attentionas the exposure to long-term drying becomes more likelyas a result of large-scale changes in the atmospheric cir-culation. These changes within the atmosphere will likelycreate additional stresses to vulnerable ecosystems, waterresources, and human well-being.
Numerous studies have attempted to quantify theprojected changes to rainfall and temperature withinthe Caribbean as GHGs increase, including analysingoutput from coupled global climate models (Karmalkaret al., 2013; Taylor and Clarke, 2018), high resolutiontime-slice global atmospheric models (Hall et al., 2013),dynamical downscaling (Campbell et al., 2011;Bhardwaj et al., 2018), and statistical downscaling(Hayhoe, 2013; Henareh et al., 2016). Generally, thesestudies focused on quantifying rainfall and temperaturechanges for large regions that grouped multiple smallisland states that exhibit similar annual cycles and inter-annual variability (e.g., Campbell et al., 2011; Hallet al., 2013; Karmalkar et al., 2013; Taylor andClarke, 2018). These studies add value by highlightingthe projected regional and seasonal changes for areaswithin the Caribbean. Karmalkar et al. (2013) reviewedthe projected changes from phase 3 of the ClimateModel Intercomparison Project (CMIP3) and regionalclimate modelling from UK Hadley Centre modellingsystem in PRECIS (Providing Regional Climates forImpact Studies). Karmalkar et al. (2013) found moredrying for the latter half of the 21st century with thestrongest drying occurring during the early part of thewet season and within the western half of Caribbean.However, the magnitude of the drying was less certain,especially when including output from higher resolutionregional climate models that better resolve the smallisland states. Using the more recent global climatemodel output from phase 5 of the Climate ModelIntercomparison Project (CMIP5), Taylor andClarke (2018) analysed the Caribbean's future climatewhen mean global surface air temperatures are 1.5�C,2.0�C, and 2.5�C above pre-industrial values(1861–1899). They showed that there is a shift to pre-dominately drier conditions throughout Caribbean andan extension of warm spells of up to 70 days that occursbetween 1.5�C and 2.0�C mean global warming.
One shortcoming of many prior modelling studies isthe inability to resolve the terrain that interacts with the
2 BOWDEN ET AL.
prevailing trade winds. This interaction is extremelyimportant because it helps create the large precipitationand temperature gradients within the islands over shortdistances (<10 km). The sharp precipitation gradientspromote a rich mosaic of habitats. Puerto Rico and theU.S. Virgin Islands are ideal locations to perform high-resolution dynamical downscaling because these islandshave large precipitation gradients that primarily resultfrom moist easterly trade winds impinging upon theisland mountains. Puerto Rico's climate includes starkcontrasts—such as the El Yunque rainforest located onthe northeast side within the Sierra de Luquillo moun-tain range and the Guanica dry forest south of the Cordil-lera Central mountain range—less than 100 km from
each other and requires finer-resolution modelling tocapture, Figure 1. These sharp contrasts are important tothe distribution of Holdridge ecological life zones definedusing the mean annual biotemperature, mean annualprecipitation, and annual potential evapotranspirationratio (Ewel and Whitmore, 1973). Additionally, high-resolution modelling is needed to simulate the interac-tion between the easterly trade winds with the CordilleraCentral mountain range which supports organized after-noon convection on the western side of the island (Juryand Chiao, 2013). The need for higher-resolution climatechange projections is further supported by recent precipi-tation trends across Puerto Rico that vary with elevation(Van Beusekom et al., 2016).
FIGURE 1 Observed ecological
life zones within Puerto Rico (top)
and model representation for the
10-km (left) and 2-km (right) WRF
domains with model terrain height
(contoured in meters)
BOWDEN ET AL. 3
Simulating an elevation-dependent climate responsewithin complex topography requires horizontal grid spac-ing of 5-km or less (Rasmussen et al., 2011). Recently,Bhardwaj et al. (2018) used a non-hydrostatic regional cli-mate model at 2-km horizontal grid spacing to investigateclimate change within Puerto Rico at mid-twenty-firstcentury following Representative Concentration Pathway8.5 (RCP8.5). Their study found a diminished mid-summer drought, which is a temporary dry period duringthe rainy season, in the northwestern portion of theisland and less frequent extreme rainfall at sub-daily anddaily time scales. The frequency of occurrence of themost extreme rainfall in this dynamically downscaledrealization contradicts statistically downscaled projec-tions within Puerto Rico which show an increase in num-ber of days for most extreme precipitation(Hayhoe, 2013). Furthermore, Henareh et al. (2016) usethe statistical downscaling of Hayhoe (2013) to map thepossible ecological effects of climate change for the Hol-dridge life zones and finds a shift to drier life zones withthe possibility of losing the subtropical rain forests withinPuerto Rico by the end of the century. The statisticaldownscaling consensus was drawn from a large ensembleof GCMs and scenarios, suggesting that the dynamicaldownscaled realization from Bhardwaj et al. (2018) couldbe sensitive to the GCM, the scenario, and regional cli-mate model and its configuration. Another possibility isthe statistically downscaled projections may not accu-rately represent the complex climate, especially withregards to changing precipitation extremes as both thestationarity assumption and station density are knownissues with statistical downscaling.
This study is an extension of the Bhardwaj et al. (2018)study and includes additional dynamically downscaledhigh-resolution (2-km) climate change realizations forRCP8.5, with an overall climate forcing of 8.5 W m−2 bythe end of the 21st century (Riahi et al., 2011). Thesesimulations downscale multiple GCMs centered on themid-21st century using two different regional climatemodelling systems to explore whether additional dynami-cally downscaled models would corroborate Bhardwajet al. This manuscript also complements Henarehet al. (2016), as we also investigate climate change withinthe Holdridge ecological life zones. In this study, high-resolution dynamically downscaled simulations are eval-uated against observations to quantify the model errorsand projected temperature and precipitation changes forthe three largest Holdridge life zones within Puerto Rico,resolved by the RCMs as shown in Figure 1, and for theU.S. Virgin Islands. This analysis includes quantifyingchanges to the mean and extremes within these life zonesin Puerto Rico, including the diurnal cycle and tails ofthe distributions where large uncertainties and little
information exist regarding climate change. To ourknowledge this is the first study that provides regionalclimate change information for the U.S. Virgin Islands.In the conclusions, we highlight key points important forstakeholders considering regional climate change projec-tions for the U.S. Caribbean islands including uncer-tainties, modelling challenges, and suggestions toimprove regional climate change projections for theislands.
2 | MODEL EXPERIMENTS ANDEVALUATION
This study uses two regional climate modelling systemsto downscale select global climate models that partici-pated in CMIP5. Each regional climate model applied aunique model configuration to generate projections forPuerto Rico and the U.S. Virgin Islands at 2-km horizon-tal grid spacing. Each regional climate model downscaledtwo 20-year time slices from two CMIP5 global climatemodels (Taylor et al., 2012): a historical time slice(1986–2005) and a future time slice (2041–2060) forRCP8.5. Each regional climate model downscaled thesame CMIP5 model for comparison. The future timeperiod, GHG emission scenario, and model outputparameters archived were selected based on workshoprecommendations from stakeholders within Puerto Ricoand the U.S. Virgin Islands, including ecologists, biolo-gists, and hydrologists. Included in Table 1 is a
TABLE 1 Mean annual 2-m temperature and precipitation
change from CMIP5 GCMs for mid-century (2041-2060 minus
1986-2005) for RCP8.5 averaged over the U.S. Caribbean
GCM T2 Mean (�C) Precipitation (% change)
CCSM4 +1.3 −23
CNRM-CM5 +1.0 −2
GFDL-ESM2G +1.1 −5
ACCESS1-3 +1.9 −19
CSIRO-Mk-3-6-0 +1.5 −10
FGOALS-G2 +1.3 −2
GISS-E2-R +1.2 −3
HadGEM2-CC +1.6 −31
IPSL-CM5A-LR +1.8 −1
MPI-ESM-MR +1.6 −22
NorESM-M +1.1 −18
Note: Only the first realization from each GCM is shown. The U.S.Caribbean defined by the high-resolution nest in the top panel ofFigure 2. CMIP5 GCMs in bold are dynamically downscaled overthe U.S. Caribbean.
4 BOWDEN ET AL.
comparison of the projected temperature and precipita-tion changes averaged over the U.S. Caribbean for thethree CMIP5 GCMs downscaled, discussed more below,as well as eight additional CMIP5 GCMs for the same20-year time slices. Table 1 is included to provide addi-tional context given known problems when identifyingregional climate change signals, such as the benefit ofsampling internal “unforced” climate variability withlarge ensembles, as in Deser et al. (2012), as well aspotential problems when downscaling a subset of GCMs,as in Mezghani et al. (2019).
2.1 | Weather research and forecastingmodel
One regional climate model used in this study is theweather research and forecasting (WRF) model version3.6.1 (Skamarock and Klemp, 2008). The WRF modelwas used to dynamically downscale two CMIP5models: the Community Climate System Model(CCSM4; Gent et al., 2011) and the Centre National deRecherches Meteorologiques-CERFACS (CNRM; Vol-doire et al., 2013). WRF was configured to use a30–10-2-km simultaneous one-way nest (Figure 2). It is
important to note that CMIP5 models have lowererrors than the prior generation of global climatemodels, including the annual temperature cycle of theCaribbean (Ryu and Hayhoe, 2014). In particular, theCNRM 20th-century simulations improve the fidelityof the annual temperature cycle compared to otherCMIP5 models (see figure 5 of Ryu and Hayhoe, 2014)and simulate the seasonal precipitation cycle that real-istically reflects both a mid-summer drought and twoprecipitation peaks within the Caribbean (see table 3 ofHayhoe, 2013). Table 1 includes temperature and pre-cipitation changes for 11 CMIP5 GCMs. For CNRM,the mean warming for the U.S. Caribbean is 1�C withsmall to insignificant drying of −2%. In comparison,CCSM4 improves the simulation of oceanic featuresthat affect the natural variability in the Caribbean,such as El Niño Southern Oscillation (ENSO; Bellengeret al., 2014) with significant rainfall reduction, −23%,for RCP8.5 by mid-century with a mean warming of1.3�C. Finally, the best performing WRF configurationidentified in Wootten et al. (2016) was used in thisstudy. Some important WRF model options includeapplying analysis nudging within the outer twodomains and using a convective parameterizationscheme for the innermost domain to reduce rainfallbias, as discussed in detail within Wootten et al. (2016).The following physics options were selected for theWRF simulations:
• Radiation—RRTMG (Iacono et al., 2008)• Microphysics—WSM6 (Hong and Lim, 2006)• Planetary Boundary Layer—YSU (Hong et al., 2006)• Land Surface—Noah (Chen and Dudhia, 2001)• Convection—Modified Kain Fritsch (Herwehe
et al., 2014)
2.2 | Regional spectral model andJapanese meteorological agency non-hydrostatic model
The second configuration used two different regional cli-mate models, the hydrostatic regional spectral model(RSM; Kanamitsu et al., 2010) and the non-hydrostaticmodel (NHM; Saito et al., 2006). The RSM downscaledthe global climate models to a 10-km horizontal gridspacing (Figure 1). RSM uses a scale-selective bias correc-tion (Misra, 2007), which serves to maintain large-scaleconsistency within the regional climate model with scalesresolved within the driving global climate model in amanner similar to analysis nudging in WRF (Bowdenet al., 2012; Otte et al., 2012; Bowden et al., 2013).
FIGURE 2 WRF (top) and RSM-NHM (bottom) domains.
WRF applies a one-way nest with a 30km-10km-2-km domain.
RSM simulations (10-km) are used as lateral boundary conditions
to the NHM (2-km)
BOWDEN ET AL. 5
The RSM was also used to downscale CCSM4 (for com-parison with WRF), as well as the Geophysical FluidDynamics Laboratory Coupled Physical Model (GFDL-ESM2G; Dunne et al., 2012). Hayhoe (2013) noted thatGFDL-ESM2G erroneously simulated just one precipita-tion peak for the U.S. Caribbean—a feature more com-monly observed in the eastern Caribbean—and thisdeficiency adversely affects the downscaled simulations.Projected changes for the GFDL-ESM2G is closer to thatof CNRM with 1.1�C warming and small rainfall reduc-tion of −5%. The output from hydrostatic RSM was usedas lateral boundary conditions to the NHM to furtherdownscale CCSM4 and GFDL-ESM2Gto 2-km. UnlikeWRF, the NHM does not offer a convective parameteriza-tion scheme, so the comparisons of precipitation areanother a unique aspect of this study. Below is a list ofthe RSM and NHM physics.
RSM Physics:
• Radiation—shortwave (Chou and Lee, 1996); longwave(Chou and Suarez, 1994)
• Microphysics—based on Slingo (1987)• Planetary Boundary Layer—following Hong and
Pan (1996)• Land Surface—following Ek et al. (2003)• Convection—shallow (Tiedtke et al., 1988); deep (Pan
and Wu, 1995)
NHM Physics:
• Radiation—based on Sugi et al. (1990)• Microphysics—explicit three ice bulk scheme (Ikawa
and Saito, 1991)• Planetary Boundary Layer—Mellor-Yamada level
3 (Nakanishi and Niino, 2006)• Land Surface—parameterization following Beljaars
and Holtslag (1991)
2.3 | Model evaluation
For both Puerto Rico and the U.S. Virgin Islands, we onlyfocus on the model output from the 2-km simulations.Specifically, each simulation is evaluated within PuertoRico for three of the six Holdridge life zones: subtropicaldry forest, subtropical moist forest, and subtropical wetforest. We do not perform an analysis for the other lifezones within Puerto Rico because the 2-km resolutiondoes not sufficiently resolve these life zones, includinglower montane wet forest, lower montane rainforest, andsubtropical rain forest. Figure 1 illustrates how the lifezones and the ground elevation are represented in WRFat 10-km and at 2-km within Puerto Rico. The 10-km
domain cannot resolve important terrain features withinthe Sierra de Luquillo and Cordillera Central mountainranges, so the model does not sufficiently resolve theobserved ecologically relevant life zones, especially thesubtropical dry and wet forests that provide unique habi-tats. For example, the subtropical dry forest along thesouthern coast is underrepresented at 10-km comparedwith 2-km.
The historical monthly maximum and minimumtemperature and monthly accumulated precipitation forthe subtropical dry/moist/wet forests within Puerto Ricoare evaluated against the monthly climatology from theParameter-Elevation Regressions on Independent SlopesModel (�4-km PRISM; Daly et al., 2003) to quantify theaverage model bias for each life zone within PuertoRico. The PRISM data for Puerto Rico is available onlyas a climatological normal calculated for the period1963–1995. One significant advantage of PRISM for thisstudy is the ability to evaluate elevation relationshipsthat are critical to the microclimates within the island,especially the different life zones. We then quantify anddiscuss uncertainty in the downscaled projections forboth temperature and precipitation, including changesto the diurnal cycle and extremes, for each of the lifezones, which is particularly important for natural, cul-tural, and water resource managers (e.g., species conser-vation). The significance of the projected changes iscalculated using a two-sided non-parametric Mann–Whitney U-test (Wilks, 2006) at the 95% confidencelevel. This test does not assume the distribution is nor-mal, and uses ranks to assess if the data, simulated tem-perature or precipitation, is significantly shifted higheror lower in the future period.
Unlike Puerto Rico, gridded rainfall and temperatureproducts like PRISM are unavailable for evaluation withinthe U.S. Virgin Islands: St. John, St. Thomas, andSt. Croix. Here we use station climatological normals (U.S.Climate Normals Data from 1981–2010; Arguezet al., 2012) to evaluate the 2-km downscaled mean tem-perature and accumulated precipitation. We then quantifythe island average projected changes to annual averagemaximum and minimum temperature and accumulatedrainfall. In addition, projected temperature and precipita-tion changes for each island are shown to highlight areaswith large differences as well as areas with similarities.
3 | RESULTS
3.1 | Puerto Rico—subtropical dry forest
The subtropical dry forest region is located on the south-southwestern side of Puerto Rico in the shadow of the
6 BOWDEN ET AL.
central mountains with annual rainfall totals less than1,000 mm. The dry forests in Puerto Rico are small instature, and they have low diversity, productivity, andabove ground biomass (Murphy et al., 1995). Dry forestswill likely be sensitive to future changes in rainfall,
which will also likely alter species distribution and eco-system processes within this forest system (Allenet al., 2017).
Figure 3 shows distributions of monthly average dailyminimum and maximum temperature from the historical
FIGURE 3 Distributions of monthly averaged daily maximum (red) and minimum (blue) 2-m temperature for the subtropical dry
forest. The historical and future are shown as solid and dashed lines respectively for (a) CCSM-WRF, (b) CNRM-WRF, (c) CCSM-RSM-
NHM, d) GFDL-RSM-NHM. Included in each panel are the annual averaged bias and the mean change. The projected changes are all
significant at the 95% confidence level using the Mann–Whitney U-test (p-values < .001)
BOWDEN ET AL. 7
and RCP8.5 regional climate model realizations averagedover the subtropical dry forest. Figure 3 includes themodel biases relative to PRISM and the mean projectedchanges for both maximum and minimum temperature.Both WRF simulations have the smallest bias (less than<0.3�C) for minimum temperature. In comparison theRSM-NHM minimum temperature bias is approximately+2.0�C for the downscaled CCSM simulationand − 2.0�C for the GFDL simulation. The GFDL simu-lation downscaled using RSM-NHM depicts a very dif-ferent shape in the distribution of both minimum andmaximum temperatures with a maximum temperaturebias of −7.6�C. In particular, the temperature distribu-tion for the GFDL-RSM-NHM simulation does not dis-play the characteristic bimodality as found in the otherrealizations, which is found within the observations(not shown). The large cold bias in the maximum tem-peratures for the GFDL-RSM-NHM simulation is con-cerning and will be discussed in more detail whenlooking at precipitation errors. There is also a cold biasfor maximum temperature for the other three down-scaled realizations, but those biases are smaller, rangingfrom −2.2�C to −3.3�C. In general, the downscaled sim-ulations have a warm bias at night and a cold bias dur-ing the day, and this persists between regions as seen inTable 2. The cold bias during the day may be a directresult of the SSTs. The downscaled realizations use SSTsfrom the driving global model, and SST in each of thesemodels has a cool bias compared to observations withinthis region (see figure 4 of Ryu and Hayhoe, 2014).Additionally, there is also a larger diurnal temperaturerange for the WRF simulations compared to the RSM-NHM simulations. As for the projected changes, thechange for WRF exceeds the model bias with meanincreases in minimum temperature of 1.4�C and 1.2�Cfor the CCSM and CNRM realizations, respectively. TheCCSM downscaled with RSM-NHM projects comparablechanges to minimum temperatures of 1.4�C, despite thelarger bias. The mean increase for maximum tempera-ture for CCSM-WRF, CCSM-RSM-NHM, and CNRM-WRF is between 1.2 and 1.4�C, comparable to that for
minimum temperature. Accordingly, the diurnal cyclewithin the subtropical dry forest is projected to belargely unchanged (Figure S1).
Alarmingly, unprecedented heat may prevailthroughout the subtropical dry forest by 2050. Figure 4shows the number of days per year that are projected toexceed the warmest day in the historical simulation formaximum and minimum temperature. This analysisexamines each calendar day in the 20-year historicalperiod and determines the maximum temperature forthat day from the hourly model output. Then, the tem-peratures for each calendar day in the future period iscompared against the maximum for the same calendarday from the 20-year historical period to determine thenumber of exceedances of the historical maximum ateach grid point within the subtropical dry forest. Anaverage is calculated for all grid points within the sub-tropical dry forest. Figure 4 shows the number ofexceedances for each of the future years, which illus-trates the interannual variability in the number of daysthat exceed the historical baseline for minimum andmaximum temperatures. The median from all the reali-zations generally exceeds 100 days per year with forboth maximum and minimum temperature. All realiza-tions indicate exceptional years with more than150 days for both maximum and minimum tempera-tures. We also note larger consistency between thedownscaled realizations for minimum temperaturescompared to maximum temperatures. Considering thatthe mean change for both mean maximum and mini-mum temperature is <1.5�C within the island, which isthe goal of the Caribbean Community (Taylor andClarke, 2018), these results highlight unprecedentedtemperature extremes throughout the year. Havingdaily future maximum and minimum temperatures inthe future exceed the historical baseline more than100 times per year will create significant stress on boththe subtropical dry forest ecosystem and people in thisregion.
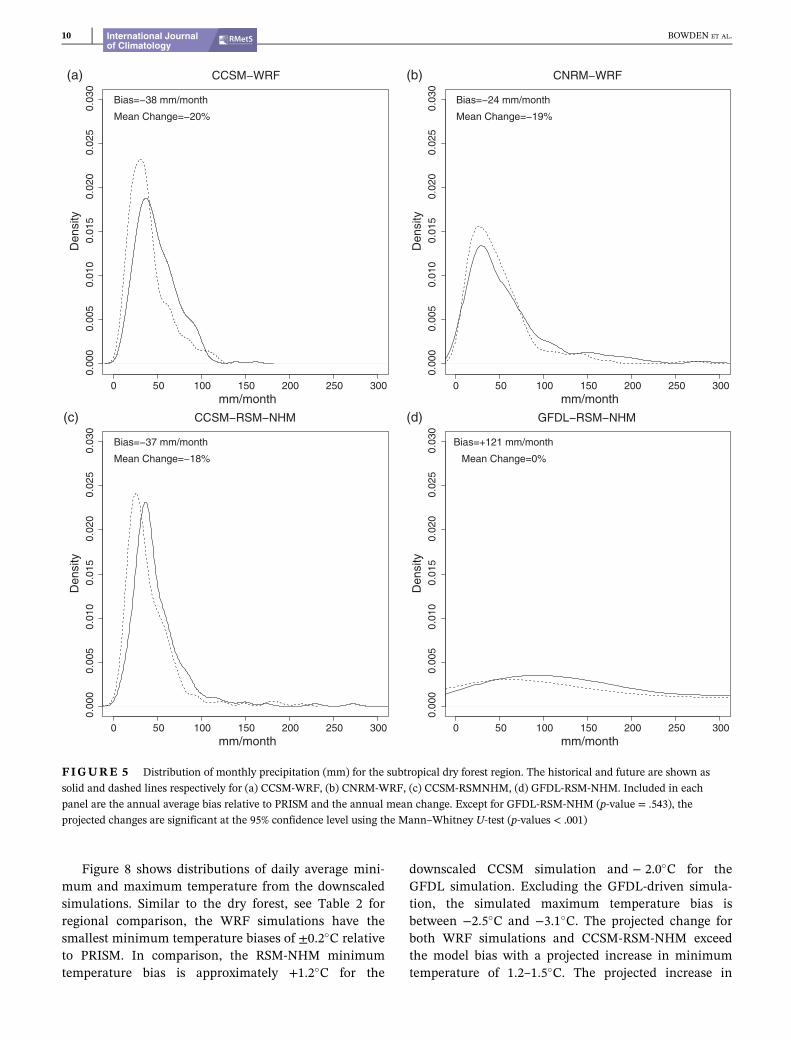
There is some consensus on how mean precipita-tion will evolve within the subtropical dry forest as
TABLE 2 Maximum and minimum 2-m temperature bias and change for each high-resolution RCM simulation averaged over the
dry Forest (DF), moist Forest (MF) and wet Forest (WF)
GHGs increase. Figure 5 shows the distribution ofmonthly precipitation for both the historical period andRCP8.5. There is a dry bias in both WRF simulationsand in the CCSM-RSM-NHM simulation. The bias islarger for the CCSM simulations from both regional cli-mate models and smallest for CNRM-WRF simulation.Notably, CCSM-WRF is the only simulation that doesnot simulate rainfall exceeding 200 mm month−1. Theseresults illustrate that using different global and regionalmodels increases uncertainty for precipitation extremesin this region. Despite differences in the distributions,CCSM-WRF, CNRM-WRF, and CCSM-RSM-NHMreflect a reduction in mean rainfall between 18–20%.The mean changes in CNRM-WRF and CCSM-RSM-NHM are more sensitive to changes in extreme rainfallcompared to CCSM-WRF. GFDL-RSM-NHM was omit-ted from this analysis because this simulation includes avery large wet bias, exceeding 100 mm month−1, as wellas the strong cold bias previously discussed.
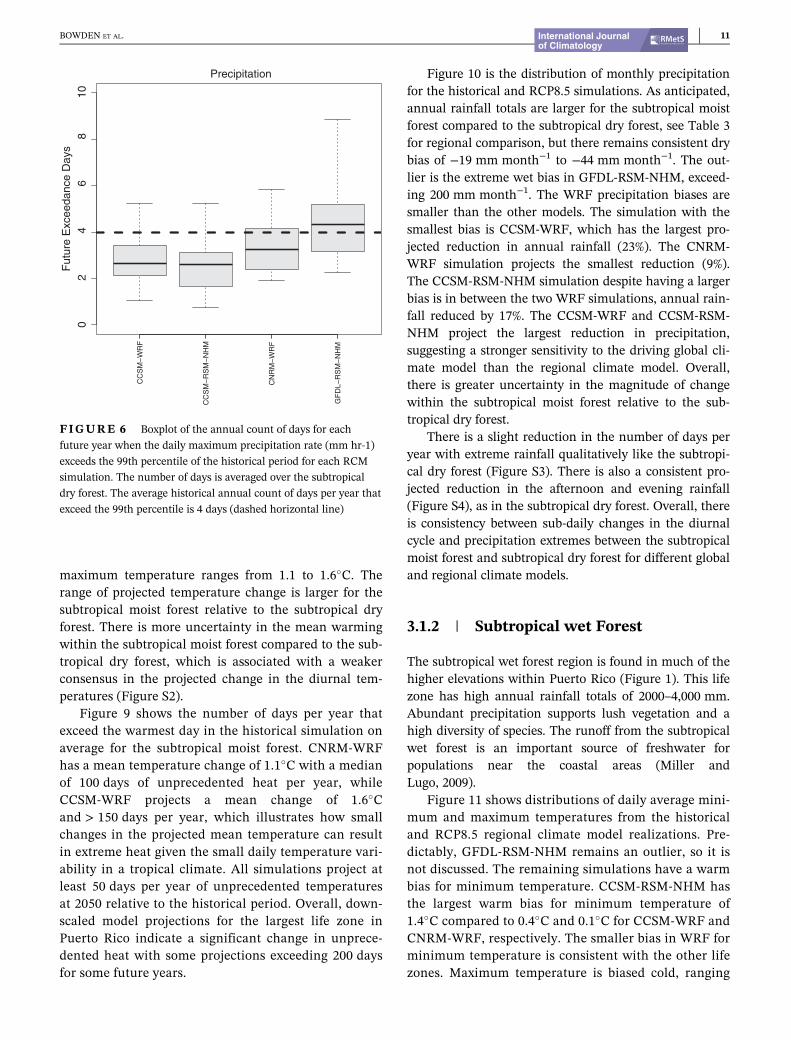
The hourly model output enables quantifying changesto sub-daily precipitation, including the diurnal cycle andshort-duration precipitation extremes. Precipitationextremes, here defined as events when the daily maxi-mum precipitation rate (mm hr−1) exceeds the 99th per-centile of the historical period, are shown in Figure 6.These results indicate that the projected change in thefrequency of extreme rainfall events is insignificant whenaveraged over the life zone. Figure 6 further suggests thatthe frequency of flash flooding (resulting directly fromextreme precipitation) may not change in the absence oftropical storms and hurricanes, which are poorly simu-lated in our limited domain. However, flash floodingevents could increase if there are larger gaps between
precipitation events because of a drier land surface whichwould favour quicker run-off.
There are also notable projected changes in the diur-nal cycle (Figure 7). Except for GFDL-RSM-NHM, themodels show a consistent rainfall peak during the after-noon/evening hours in both the historical period andRCP8.5. One characteristic of the projected drying withinthe subtropical dry forest is a reduction in afternoon/eve-ning rainfall, likely from convection. The major differ-ence between RSM-NHM and the WRF simulations isthe timing of the peak rainfall, occurring later in the eve-ning for RSM-NHM.
3.1.1 | Puerto Rico—subtropical moistforest
The subtropical moist forest region is primarily locatedin transition zone between the coast and higher eleva-tions with a more concentrated moist forest area on thenorth and east side of the island (Figure 1). Annualrainfall totals are typically 1,000–2000 mm. This is thelargest life zone, covering around 59% of Puerto Rico,and it is a prime region for deforestation because cli-matic conditions are ideal for growing a variety ofcrops (Miller and Lugo, 2009). The subtropical moistforest includes many microhabitats with very diversespecies. For instance, the karst region on the northernedge of Puerto Rico harbours more than 1,300 speciesof plants and animals (Lugo et al., 2001). Climatechange poses a risk to the ecosystems and ecosystemservices, such as shade-grown coffee, in these subtropi-cal moist forests.
Futu
re E
xceedance D
ays
(a) Max. Temperature
CC
SM
−W
RF
CC
SM
−R
SM
−N
HM
CN
RM
−W
RF
GF
DL
−R
SM
−N
HM
05
01
00
15
02
00
25
0
05
01
00
15
02
00
25
0
Futu
re E
xceedance D
ays
(b) Min. Temperature
CC
SM
−W
RF
CC
SM
−R
SM
−N
HM
CN
RM
−W
RF
GF
DL
−R
SM
−N
HM
FIGURE 4 Boxplot of the
annual count of days within the
subtropical dry forest of Puerto Rico
for each future year when the daily
(a) maximum 2-m temperature and
(b) minimum 2-m temperature
exceeds the same calendar day
maximum temperature from the
historical period for each RCM
simulation. The number of days is
averaged over the subtropical dry
forest. The projected changes are
significant at the 95% confidence
level using the Mann–Whitney U-test
(p-values < .001)
BOWDEN ET AL. 9
Figure 8 shows distributions of daily average mini-mum and maximum temperature from the downscaledsimulations. Similar to the dry forest, see Table 2 forregional comparison, the WRF simulations have thesmallest minimum temperature biases of ±0.2�C relativeto PRISM. In comparison, the RSM-NHM minimumtemperature bias is approximately +1.2�C for the
downscaled CCSM simulation and − 2.0�C for theGFDL simulation. Excluding the GFDL-driven simula-tion, the simulated maximum temperature bias isbetween −2.5�C and −3.1�C. The projected change forboth WRF simulations and CCSM-RSM-NHM exceedthe model bias with a projected increase in minimumtemperature of 1.2–1.5�C. The projected increase in
0 50 100 150 200 250 300
0.0
00
0.0
05
0.0
10
0.0
15
0.0
20
0.0
25
0.0
30
Density
CCSM−WRF
mm/month
(a)
Bias=−38 mm/month
Mean Change=−20%
0 50 100 150 200 250 300
0.0
00
0.0
05
0.0
10
0.0
15
0.0
20
0.0
25
0.0
30
Density
CNRM−WRF
mm/month
(b)
Bias=−24 mm/month
Mean Change=−19%
0 50 100 150 200 250 300
0.0
00
0.0
05
0.0
10
0.0
15
0.0
20
0.0
25
0.0
30
Density
CCSM−RSM−NHM
mm/month
(c)
Bias=−37 mm/month
Mean Change=−18%
0 50 100 150 200 250 300
0.0
00
0.0
05
0.0
10
0.0
15
0.0
20
0.0
25
0.0
30
Density
GFDL−RSM−NHM
mm/month
(d)
Bias=+121 mm/month
Mean Change=0%
FIGURE 5 Distribution of monthly precipitation (mm) for the subtropical dry forest region. The historical and future are shown as
solid and dashed lines respectively for (a) CCSM-WRF, (b) CNRM-WRF, (c) CCSM-RSMNHM, (d) GFDL-RSM-NHM. Included in each
panel are the annual average bias relative to PRISM and the annual mean change. Except for GFDL-RSM-NHM (p-value = .543), the
projected changes are significant at the 95% confidence level using the Mann–Whitney U-test (p-values < .001)
10 BOWDEN ET AL.
maximum temperature ranges from 1.1 to 1.6�C. Therange of projected temperature change is larger for thesubtropical moist forest relative to the subtropical dryforest. There is more uncertainty in the mean warmingwithin the subtropical moist forest compared to the sub-tropical dry forest, which is associated with a weakerconsensus in the projected change in the diurnal tem-peratures (Figure S2).
Figure 9 shows the number of days per year thatexceed the warmest day in the historical simulation onaverage for the subtropical moist forest. CNRM-WRFhas a mean temperature change of 1.1�C with a medianof 100 days of unprecedented heat per year, whileCCSM-WRF projects a mean change of 1.6�Cand > 150 days per year, which illustrates how smallchanges in the projected mean temperature can resultin extreme heat given the small daily temperature vari-ability in a tropical climate. All simulations project atleast 50 days per year of unprecedented temperaturesat 2050 relative to the historical period. Overall, down-scaled model projections for the largest life zone inPuerto Rico indicate a significant change in unprece-dented heat with some projections exceeding 200 daysfor some future years.
Figure 10 is the distribution of monthly precipitationfor the historical and RCP8.5 simulations. As anticipated,annual rainfall totals are larger for the subtropical moistforest compared to the subtropical dry forest, see Table 3for regional comparison, but there remains consistent drybias of −19 mm month−1 to −44 mm month−1. The out-lier is the extreme wet bias in GFDL-RSM-NHM, exceed-ing 200 mm month−1. The WRF precipitation biases aresmaller than the other models. The simulation with thesmallest bias is CCSM-WRF, which has the largest pro-jected reduction in annual rainfall (23%). The CNRM-WRF simulation projects the smallest reduction (9%).The CCSM-RSM-NHM simulation despite having a largerbias is in between the two WRF simulations, annual rain-fall reduced by 17%. The CCSM-WRF and CCSM-RSM-NHM project the largest reduction in precipitation,suggesting a stronger sensitivity to the driving global cli-mate model than the regional climate model. Overall,there is greater uncertainty in the magnitude of changewithin the subtropical moist forest relative to the sub-tropical dry forest.
There is a slight reduction in the number of days peryear with extreme rainfall qualitatively like the subtropi-cal dry forest (Figure S3). There is also a consistent pro-jected reduction in the afternoon and evening rainfall(Figure S4), as in the subtropical dry forest. Overall, thereis consistency between sub-daily changes in the diurnalcycle and precipitation extremes between the subtropicalmoist forest and subtropical dry forest for different globaland regional climate models.
3.1.2 | Subtropical wet Forest
The subtropical wet forest region is found in much of thehigher elevations within Puerto Rico (Figure 1). This lifezone has high annual rainfall totals of 2000–4,000 mm.Abundant precipitation supports lush vegetation and ahigh diversity of species. The runoff from the subtropicalwet forest is an important source of freshwater forpopulations near the coastal areas (Miller andLugo, 2009).
Figure 11 shows distributions of daily average mini-mum and maximum temperatures from the historicaland RCP8.5 regional climate model realizations. Pre-dictably, GFDL-RSM-NHM remains an outlier, so it isnot discussed. The remaining simulations have a warmbias for minimum temperature. CCSM-RSM-NHM hasthe largest warm bias for minimum temperature of1.4�C compared to 0.4�C and 0.1�C for CCSM-WRF andCNRM-WRF, respectively. The smaller bias in WRF forminimum temperature is consistent with the other lifezones. Maximum temperature is biased cold, ranging
02
46
810
Futu
re E
xceedance D
ays
Precipitation
CC
SM
−W
RF
CC
SM
−R
SM
−N
HM
CN
RM
−W
RF
GF
DL
−R
SM
−N
HM
FIGURE 6 Boxplot of the annual count of days for each
future year when the daily maximum precipitation rate (mm hr-1)
exceeds the 99th percentile of the historical period for each RCM
simulation. The number of days is averaged over the subtropical
dry forest. The average historical annual count of days per year that
exceed the 99th percentile is 4 days (dashed horizontal line)
BOWDEN ET AL. 11
from −2.8�C for CCSM-WRF to −3.4�C for bothCNRM-WRF and CCSM-RSM-NHM. The cooler day-time temperatures and warmer night-time tempera-tures indicate the regional climate models areconsistently underestimating the diurnal temperaturerange across different life zones. The projected changefrom the three realizations depict an increase in mini-mum temperature of 1.1–1.4�C and 1.2–1.7�C for maxi-mum temperature. The projected maximumtemperature changes are slightly larger than the mini-mum temperature change, especially for CCSM-WRF.The projected change in the diurnal cycle confirms thatmaximum temperature increases more during theafternoon and evening hours for CCSM-WRF com-pared to CNRM-WRF and CCSM-RSM-NHM(Figure 12), and hence escalating uncertainty inchanges to the diurnal temperature range. Similar tothe other life zones, there is a substantial projectedincrease in unprecedented daytime and night-timetemperatures exceeding 200 days for some future years(Figure S4).
Figure 13 shows the distribution of monthly precipi-tation from the historical and RCP8.5 simulations aver-aged over the subtropical wet forest. The simulations all
show a dry bias, except for GFDL-RSM-NHM. CNRM-WRF has the smallest bias (−21 mm month−1), as wellas the smallest mean future rainfall decrease (10%). TheCCSM-WRF and CCSM-RSM-NHM have dry biases of26 mm month−1 and 56 mm month−1 and meandecreases of 25% and 16%, respectively. Notably, thesimulation with the smallest bias differs for each lifezone. Consistent with temperature, the uncertainty inthe magnitude of the drying becomes larger for the wet-ter life zones, see Table 3 for regional comparisons. Thisis likely because there is more uncertainty as the repre-sentation of clouds and precipitation become increas-ingly important for wetter regions. The increaseduncertainty is likely associated with local feedbacks inthe model such as evapotranspiration and recycling ofwater. For instance, comparing projected changes in thediurnal temperature and precipitation (Figures 12 and14) provides some insight. CCSM-WRF has the largestamount of drying and associated with larger decrease inafternoon precipitation. The reduced afternoon precipi-tation favours a relative increase in temperature. On theother hand, CNRM-WRF has a smaller amount of dry-ing and associated with a smaller reduction in afternoonprecipitation. The smaller projected change to afternoon
5 1 5 20
0.0
00.1
00.2
0
Pre
cip
ita
tio
n (
mm
/hr)
Time of Day (UTC)
(a) CCSM−WRF
−0.0
5−
0.0
3−
0.0
1
Diffe
ren
ce
(m
m/h
r)5 10 1 0 15 20
0.0
00.1
00.2
0
Pre
cip
ita
tio
n (
mm
/hr)
Time of Day (UTC)
(b) CNRM−WRF
−0.0
5−
0.0
3−
0.0
15 10 15 20
0.0
00.1
00.2
0
Pre
cip
ita
tio
n (
mm
/hr)
(c) CCSM−RSM−NHM
−0.0
5−
0.0
3−
0.0
1
Diffe
ren
ce
(m
m/h
r)
Diffe
ren
ce
(m
m/h
r)D
iffe
ren
ce
(m
m/h
r)5 10 15 20
0.0
0.1
0.2
0.3
0.4
0.5
Pre
cip
ita
tio
n (
mm
/hr)
(d) GFDL−RSM−NHM
0.0
00.0
20.0
4
FIGURE 7 Diurnal cycle of
precipitation (mm hr-1) for the
subtropical dry forest. The historical
and future are shown as black solid
and dashed lines with precipitation
difference in red respectively for
(a) CCSM-WRF (p-value = .004), (b)
CNRM-WRF (p-value < .001), (c)
CCSM-RSM-NHM (p-value < .001),
(d) GFDL-RSM-NHM (p-value =.363). Note the plotted range for
precipitation for GFDL-RSM-NHM is
substantially larger than the other
simulations
12 BOWDEN ET AL.
precipitation is associated with less warming during theafternoon. The larger projected reduction in precipita-tion in CCSM-WRF reflects a more pronounceddecrease in the frequency of extreme rainfall events(Figure S5) compared to CNRM-WRF. Such details inthe local physical processes are important to understandand are currently being explored for a futuremanuscript.
3.2 | U.S. Virgin Islands
The U.S. Virgin Islands (St. Thomas, St. John, andSt. Croix) generally have subtropical dry forests at lowerelevations and subtropical moist forests at higher eleva-tions (Brandeis et al., 2009). The within-island climategradient is largest for St. Croix, the largest of theU.S. Virgin Islands, with a notable transition in forest
FIGURE 8 Same as Figure 3, except for the subtropical moist forest. The projected changes are significant at the 95% confidence level
using the Mann–Whitney U-test (p-values < .001)
BOWDEN ET AL. 13
type from subtropical dry forests on the eastern/southernside of the island to subtropical moist forests on thenorthwest side of the island. Below we focus only on theWRF simulations because these simulations themselvesprovide insight into some consistencies but more impor-tantly uncertainties in the model projections.
Figure 15 shows the simulated annual average maxi-mum temperature from the WRF simulations comparedto the station climate normals. Both WRF simulationsillustrate larger maximum temperatures over land at thelowest elevations, but the magnitude is cooler than thestation observations by 1 to 3�C. As for minimum tem-peratures, the largest cooling is found at the higher eleva-tions but there is also a notable cold bias (Figure S6).Figure 16 shows the simulated historical annual rainfalltotals from the WRF simulations compared to the stationclimate normals. The models simulate a distinguishablewindward-leeward effect. The annual rainfall climatologyin CNRM-WRF is closer to observations compared toCCSM-WRF, which has a notable wet bias on the wind-ward side of the islands. Despite the wet bias in CCSM-WRF, the within island rainfall spatial characteristics aresimilar to that of CNRM-WRF. The station observationsshow similar windward-leeward rainfall characteristics.The exception is the drier climate for the far eastern edgeof St. Croix, which is unresolved at 2-km horizontal gridspacing.
The island average projected change in the maxi-mum temperatures is 1.1–1.3�C for CNRM-WRF andCCSM-WRF, respectively (Figure 17). The within-island temperatures are projected to increase fasterthan the surrounding water. There are some intriguingsimilarities between the simulations in the placement
of the largest projected warming for maximum temper-atures. There is larger warming on the southern side atlower elevations within St. Croix and for some of thehighest elevations within St. Thomas and St. John.Similar spatial changes are seen for minimum tempera-ture (Figure S7).
The projected decrease in the annual precipitation forthe U.S. Virgin Islands is 6–12% (Figure 18), which is lessthan in life zones of Puerto Rico. Unlike the temperatureprojections which indicate similar locations for the maxi-mum increase in temperatures, the rainfall projectionsare not in agreement for the location of the largest projec-ted reductions in precipitation. CNRM-WRF projectsmore drying on the southern (leeward side) of theislands, while CCSM-WRF shows the largest drying onthe northern (windward side). These results suggest thatthe model biases translate into differential climate sensi-tivity. For instance, the largest precipitation reductionson the windward side of the islands for CCSM-WRF areco-located with a larger wet bias. Overall, these resultsemphasize the uncertainty in projected changes acrossthe U.S. Virgin Islands and demonstrate that projectedprecipitation changes are unlikely to be uniform.
4 | CONCLUSIONS ANDDISCUSSION
The dynamically downscaled simulations in this studyprovide additional information by resolving precipita-tion gradients between life zones and of significantvalue to those interested in climate change for theislands. All simulations project substantial increases in
050
10
01
50
20
02
50
Futu
re E
xceedance D
ays
(a) Max. Temperature
CC
SM
−W
RF
CC
SM
−R
SM
−N
HM
CN
RM
−W
RF
GF
DL
−R
SM
−N
HM
050
10
01
50
20
02
50
Futu
re E
xceedance D
ays
(b) Min. Temperature
CC
SM
−W
RF
CC
SM
−R
SM
−N
HM
CN
RM
−W
RF
GF
DL
−R
SM
−N
HM
FIGURE 9 Same as Figure 4,
except for the subtropical moist
forest. The projected changes are
significant at the 95% confidence
level using the Mann–Whitney U-test
(p-values < .001)
14 BOWDEN ET AL.
0 100 200 300 400
0.0
00
0.0
05
0.0
10
0.0
15
0.0
20
0.0
25
0.0
30
De
nsity
CCSM−WRF
mm/month
Bias=−19 mm/month
Mean Change=−23%
0 100 200 300 400
0.0
00
0.0
05
0.0
10
0.0
15
0.0
20
0.0
25
0.0
30
De
nsity
CNRM−WRF
mm/month
Bias=−27 mm/month
Mean Change=−9%
0 100 200 300 400
0.0
00
0.0
05
0.0
10
0.0
15
0.0
20
0.0
25
0.0
30
Density
CCSM−RSM−NHM
mm/month
Bias=−44 mm/month
Mean Change=−17%
0 100 200 300 400
0.0
00
0.0
05
0.0
10
0.0
15
0.0
20
0.0
25
0.0
30
Density
GFDL−RSM−NHM
mm/month
Bias=+216 mm/month
Mean Change=−8%
(a) (b)
(c) (d)
FIGURE 10 Same as Figure 5, except for the subtropical moist forest. Except for GFDL-RSM-NHM (p-value = 0.05), the projected
changes are significant at the 95% confidence level using the Mann–Whitney U-test (p-values. < .001)
TABLE 3 Precipitation bias and
change for each high-resolution RCM
simulation averaged over the dry Forest
(DF), moist Forest (MF), and wet
Forest (WF)
GCM
Precip. bias (mm/month) Precip. change (%)
DF MF WF DF MF WF
CCSM-WRF −38 −19 −26 −20 −23 −25
CCSM-RSM-NHM −37 −44 −56 −18 −17 −16
CNRM-WRF −24 −27 −21 −19 −9 −10
GFDL-RSM-NHM +121 +216 +232 0 −8 −6
BOWDEN ET AL. 15
temperature and decreases in precipitation for all lifezones within Puerto Rico by 2050. In the subtropicaldry forest, more persistent mean annual warming(1.2–1.4�C) and persistent drying (reduction in meanannual rainfall 18% to–20%) is projected. However, thedynamically downscaled simulations suggest increaseduncertainty in the mean warming and drying for thewetter life zones. For the moist forest, the mean
projected warming is 1.1–1.6�C, while the wet forest is1.1–1.7�C. The mean precipitation is projected toreduce by 9–23% in the subtropical moist forest and10–25% in the subtropical wet forest. Current researchis underway to better understand the physical driverswith unknown effects on the mean change, especiallyprecipitation, for the wetter life zones within PuertoRico. Notably, the wetter life zones are found at higher
FIGURE 11 Same as Figure 3, except for the subtropical wet forest. The projected changes are significant at the 95% confidence level
using the Mann–Whitney U-test (p-values < .001)
16 BOWDEN ET AL.
elevations, which suggests a possible “elevation buffer”to the subtropical precipitation decline. The existenceof this feature would alter local climate change adapta-tion efforts within the island.
For all life zones within Puerto Rico, a mean warmingwell below 2�C—a global warming target—results inmarked increases in minimum and maximum tempera-tures at 2050 relative to the historical period. As such,all simulations project more than 50 days of unprece-dented maximum and minimum temperatures in eachfuture year with some exceptional years exceeding200 days. The simulations also agree that there are smallchanges in the frequency of extreme rainfall withinPuerto Rico for all life zones at 2050. This study corrobo-rates Bhardwaj et al. (2018) in that changes to extremerainfall frequency are robust and not sensitive to drivingmodel, the regional climate model, or the regional cli-mate model configuration. However, the dynamicallydownscaled extreme rainfall frequency projections differfrom the statistically downscaled projections for PuertoRico (Hayhoe, 2013). We hypothesize that the differencebetween the two downscaling methods results from sim-ulating the complex feedbacks associated with compet-ing drivers of change, the dynamic contribution that
supports more drying and the thermodynamic contribu-tion that supports an increase in the atmosphere mois-ture capacity and extreme rainfall (Pfahl et al., 2017).Hence, more work is needed to understand differencesbetween high-resolution dynamical downscaled simula-tions that are at similar spatial scales as that of statisti-cal downscaling, especially for places with fewerobservations.
The projected warming for the U.S. Virgin Islands(1.1–1.4�C) is comparable to Puerto Rico. The down-scaled simulations depict the largest maximum tempera-ture change for the southern side of St. Croix and forsome of the higher elevations within St. Thomas andSt. John. The simulations also project a reduction inmean annual rainfall of 6–12% for the islands, which issmaller than for Puerto Rico. However, unlike for tem-perature, there is considerable uncertainty in the locationof the maximum drying (e.g., more drying for the wind-ward or leeward side of the islands).
Finally, this study highlights modelling challenges fortraditional dynamical downscaling of global climatemodels for the U.S. Caribbean. One consistent issue is acold bias for all life zones within Puerto Rico and for theU.S. Virgin Islands. The cold bias is persistently larger for
5 10 15 20
18
20
22
24
26
Time of Day (UTC)
(a) CCSM−WRF
Diffe
ren
ce
(° C
)
5 10 15 20
18
20
22
24
26
Time of Day (UTC)
(b) CNRM−WRF
5 10 15 20
18
20
22
24
26
Te
mp
era
ture
(° C
) T
em
pe
ratu
re (°
C)
Te
mp
era
ture
(° C
) T
em
pe
ratu
re (°
C)
(c) CCSM−RSM−NHM
5 10 15 20
14
16
18
20
22
(d) GFDL−RSM−NHM
1.0
1.2
1.4
1.6
1.8
2.0
Diffe
ren
ce
(° C
)1
.01
.21
.41
.61
.82
.0
Diffe
ren
ce
(° C
)1
.01
.21
.41
.61
.82
.0
Diffe
ren
ce
(° C
)1
.01
.21
.41
.61
.82
.0
FIGURE 12 Average diurnal
cycle of temperature (�C) for thesubtropical wet forest. The historical
and future are shown as black solid
and dashed lines with temperature
difference in red respectively for
(a) CCSM-WRF, (b) CNRM-WRF,
(c) CCSM-RSM-NHM, (d) GFDL-
RSM-NHM. The plotted range for
temperature is colder for GFDL-RSM-
NHM-GFDL than for the other
simulations. The projected changes
are significant at the 95% confidence
level using the Mann–Whitney U-test
(p-values < .001)
BOWDEN ET AL. 17
maximum temperatures compared to minimum tempera-tures. There is also a persistent dry bias for all simula-tions within Puerto Rico except GFDL-RSM-NHM. Withtraditional dynamical downscaling, the global modelbiases remain, such as a cold SST bias that was acquiredfrom the global climate model SSTs. The cold bias in SSThelps to explain the cold bias in near surface temperaturewithin the islands, which may also be contributed to a
persistent dry bias within Puerto Rico. For instance, awarmer Atlantic is associated with increased convection,especially during the rainy season (Wang et al., 2008).The regional climate model's performance does not dis-credit the future runs and projected changes (Santeret al., 2009; Knutti et al., 2010), but it limits some inter-pretations and raises some important questions that canmay help improve model performance. For instance, the
0 100 200 300 400
0.0
00
0.0
05
0.0
10
0.0
15
0.0
20
0.0
25
0.0
30
Density
CCSM−WRF
mm/month
(a)
Bias=−26 mm/month
Mean Change=−25%
0 100 200 300 400
0.0
00
0.0
05
0.0
10
0.0
15
0.0
20
0.0
25
0.0
30
Density
CNRM−WRF
mm/month
(b)
Bias=−21 mm/month
Mean Change=−10%
0 100 200 300 400
0.0
00
0.0
05
0.0
10
0.0
15
0.0
20
0.0
25
0.0
30
Density
CCSM−RSM−NHM
mm/month
(c)
Bias=−56 mm/month
Mean Change=−16%
0 100 200 300 400
0.0
00
0.0
05
0.0
10
0.0
15
0.0
20
0.0
25
0.0
30
Density
GFDL−RSM−NHM
mm/month
(d)
Bias=+232 mm/month
Mean Change=−6%
FIGURE 13 Same as Figure 5, except for the subtropical wet forest. With the exception of RSM-NHM-GFDL (p-value = 0.05), the
projected changes are significant at the 95% confidence level using the Mann–Whitney U-test (p-values < .001)
18 BOWDEN ET AL.
presence of a cold and dry bias can adversely affectthreshold statistics of ecological relevance, such as thenumber of days above 32�C or daily precipitation exceed-ing 25 mm. While the cold bias in SST raises questions
on its influence on the dynamically downscaled projec-tions. Follow-on research will explore the cold bias inSST to better understand the impact on the projectedchanges.
5 10 15 20
0.0
0.2
0.4
0.6
0.8
Pre
cip
ita
tio
n (
mm
/hr)
Time of Day (UTC)
(a) CCSM−WRF
−0
.20
−0
.15
−0
.10
−0
.05
0.0
0
Diffe
ren
ce
(m
m/h
r)
5 10 15 20
0.0
0.2
0.4
0.6
0.8
Pre
cip
ita
tio
n (
mm
/hr)
Time of Day (UTC)
(b) CNRM−WRF
−0
.20
−0
.15
−0
.10
−0
.05
0.0
0
5 10 15 20
0.0
0.2
0.4
0.6
0.8
Pre
cip
ita
tio
n (
mm
/hr)
(c) CCSM−RSM−NHM
−0
.20
−0
.15
−0
.10
−0
.05
0.0
0
Diffe
ren
ce
(m
m/h
r)
Diffe
ren
ce
(m
m/h
r)D
iffe
ren
ce
(m
m/h
r)
5 10 15 20
0.0
0.2
0.4
0.6
0.8
Pre
cip
ita
tio
n (
mm
/hr)
(d) GFDL−RSM−NHM
−0
.20
−0
.10
0.0
0
FIGURE 14 Same as Figure 7,
except for the subtropical wet forest;
(a) CCSM-WRF (p-value < .001),
(b) CNRM-WRF (p-value = .484), (c)
CCSM-RSM-NHM (p-value < .001),
(d) GFDL-RSM-NHM (p-value
= .036)
FIGURE 15 Annual average
maximum temperature (�C) forSt. Thomas and St. John (top) and
St. Croix (bottom) from the WRF
historical climatology (1986-2005)
with weather station climate normals
(1981-2010) overlaid in text.
Contours represent the model
elevation starting with the first
contour at 50 m (not labelled)
BOWDEN ET AL. 19
FIGURE 16 Annual
precipitation (mm) for St. Thomas
and St John (top) and St. Croix
(bottom) from the WRF historical
climatology (1986-2005) with
weather station climate normals
(1981-2010) overlaid in text.
Contours represent the model
elevation starting with the first
contour at 50 m (not labelled)
FIGURE 17 Projected change
in annual average maximum
temperature for St. Croix (top) and
St. Thomas and St John (top) and
St. Croix (bottom) from the WRF
realizations for RCP8.5 at mid-
century (2041-2060) for CCSM-WRF
(left) and CNRM-WRF (right).
Contours represent the model
elevation starting with the first
contour at 50 m (not labelled)
FIGURE 18 Percent change in
the annual average precipitation for
St. Croix (top) and St. Thomas and St
John (bottom) from the WRF
realizations for RCP8.5 at mid-
century (2041-2060) for CCSM-WRF
(left) and CNRM-WRF (right).
Contours represent the model
elevation starting with the first
contour at 50 m (not labelled)
20 BOWDEN ET AL.
ACKNOWLEDGEMENTSThe authors thank the technical reviewers at theU.S. EPA and U.S. Geological Survey. The SoutheastClimate Adaptation Science Center, the U.S. EPAOffice of Research and Development, and aU.S. Geological Survey-NCSU Cooperative agreementfunded the research described here. Thanks to theRenaissance Computing Institute for supporting thecomputational demands of the project. The CMIP5model outputs were obtained from the Climate ModelDiagnosis and Intercomparison (PCMDI) archive athttps://esgf-node.llnl.gov/projects/cmip5/. The viewsand conclusions contained in this document are thoseof the authors, supported by the U.S. Geological Sur-vey, and should not be interpreted as representing theopinions or policies of the U.S. EPA. The authors cer-tify that they have no affiliations or involvement in anyorganization or entity with any financial interest ornon-financial interest in the materials discussed in thismanuscript. This work was supported by USGSG13AC00408 and Cooperative Agreement G17AC00099between USGS and NCSU.
ORCIDJared H. Bowden https://orcid.org/0000-0002-1677-4292Vasu Misra https://orcid.org/0000-0002-1345-6280Adrienne Wootten https://orcid.org/0000-0001-6004-5823
REFERENCES�Alvarez-Berríos, N.L., Soto-Bayó, S., Holupchinski, E., Fain, S.J.
and Gould, W.A. (2018) Correlating drought conservation prac-tices and drought vulnerability in a tropical agricultural system.Renewable Agriculture and Food Systems, 33, 279–291. https://doi.org/10.1017/S174217051800011X.
Arguez, A., Durre, I., Applequist, S., Vose, R.S., Squires, M.F.,Yin, X., Heim, R.R., Jr. and Owen, T.W. (2012) NOAA's1981-2010 U.S. climate normals: an overview. Bulletin of theAmerican Meteorological Society, 93, 1687–1697. https://doi.org/10.1175/BAMS-D-11-00197.1.
Allen, K., Dupuy, J.M., Gei, M.G., Hulshof, C., Medvigy, D.,Pizano, C., Salgado-Negret, B., Smith, C.M., Trierweiler, A., vanBloem, S.J., Waring, B.G., Xu, X. and Powers, J.S. (2017) Willseasonally dry tropical forests be sensitive or resistant to futurechanges in rainfall regimes? Environmental Research Letters, 12,023001. https://doi.org/10.1088/1748-9326/aa5968.
Beljaars, A.C.M. and Holtslag, A.A.M. (1991) Flux parameterizationover land surfaces for atmospheric models. Journal of AppliedMeteorology, 30, 327–341. http://doi.org/10.1175/1520-0450(1991)030%253C0327:FPOLSF%253E2.0.CO;2.
Bellenger, H., Guilyardi, E., Lelooup, J., Lengaigne, M. andVialard, J. (2014) ENSO representation in climate models: fromCMIP3 to CMIP5. Climate Dynamics, 42, 1999–2018. https://doi.org/10.1007/s00382-013-1783-z.
Bhardwaj, A., Misra, V., Mishra, A., Wootten, A., Boyles, R.,Bowden, J.H. and Terando, A.J. (2018) Downscaling future cli-mate projections over Puerto Rico using a non-hydrostaticatmospheric model. Climatic Change, 147, 133–147. https://doi.org/10.1007/s10584-017-2130-x.
Bowden, J.H., Otte, T.L., Nolte, C.G. and Otte, M.J. (2012) Examin-ing interior grid nudging techniques using two-way nesting inthe WRF model for regional climate modeling. Journal ofClimate, 25, 2805–2823. https://doi.org/10.1175/JCLI-D-11-00167.1.
Bowden, J.H., Nolte, C.G. and Otte, T.L. (2013) Simulating theimpact of the large-scale circulation on the 2-m temperatureand precipitation climatology. Climate Dynamics, 40,1903–1920. https://doi.org/10.1007/s00382-012-1440-y.
Brandeis, T., Helmer, E.H., Marcano-Vega, H. and Lugo, A.E.(2009) Climate shapes the novel plant communities that formafter deforestation in Puerto Rico and the U.S. Virgin Islands.Forest Ecology and Management, 258, 1704–1718.
Campbell, J.D., Taylor, M.A., Stephenson, T.S., Watson, R.A. andWhyte, F.S. (2011) Future climate of the Caribbean from aregional climate model. International Journal of Climatology,31, 1866–1878. https://doi.org/10.1002/joc.2200.
Chen, F. and Dudhia, J. (2001) Coupling an advanced land surface-hydrology model with the Penn State-NCAR MM5 modelingsystem. Part I: model implementation and sensitivity. MonthlyWeather Review, 129, 569–585. https://doi.org/10.1175/1520-0493(2001)129%3C0569:CAALSH%3E2.0.CO;2.
Chou, M.D. and Lee, K.-T. (1996) Parameterizations for the absorp-tion of solar radiation by water vapor and ozone. Journal of theAtmospheric Sciences, 53, 1203–1208. https://doi.org/10.1175/1520-0469(1996)053%3C1203:PFTAOS%3E2.0.CO;2.
Chou, M.D. and Suarez, M.J. (1994) An efficient thermal infraredradiation parameterization for use in general circulationmodels. NASA Technical Memorandum, 104606(3), 1–85.
Dai, A. (2013) Increasing drought under global warming in observa-tions and models. Nature Climate Change, 3, 52–58.
Dai, A., Zhoa, T. and Chen, J. (2018) Climate change and drought:a precipitation and evaporation perspective. Curr Clim ChangeRep 4, 301–312. https://doi.org/10.1007/s40641-018-0101-6.
Daly, C., Helmer, E.H. and Quinones, M. (2003) Mapping the cli-mate of Puerto Rico, Vieques, and Culebra. International Jour-nal of Climatology, 23, 1359–1381.
Deser, C., Knutti, R., Solomon, S. and Phillips, A.S. (2012) Commu-nication of the role of natural variability in future North Ameri-can climate. Nature Climate Change, 2, 775–779.
Dunne, J.P., John, J.G., Adcroaft, A.J., Griffies, S.M., Hallberg, R.and Shevliakova, E. (2012) GFDL's ESM2 global coupledclimate-carbon earth system models. Part I: physical formula-tion and baseline simulation characteristics. Journal of Climate,25, 6646–6665. https://doi.org/10.1175/JCLI-D-11-00560.1.
Ek, M.B., Mitchell, K.E., Lin, Y., Rogers, E., Grunmann, P.,Koren, V., Gayno, G. and Tarpley, J.D. (2003) Implementationof the Noah land surface model advances in the National Cen-ters for environmental prediction operational mesoscale Etamodel. Journal of Geophysical Research-Atmospheres, 108(D22),8851. https://doi.org/10.1029/2002JD003296.
Emanuel, K. (2017) Will global warming make hurricane forecast-ing more difficult? Bulletin of the American Meteorological Soci-ety, 98, 495–501. https://doi.org/10.1175/BAMS-D-16-0134.1.
Ewel, J.J. and Whitmore, J.L. (1973) The Ecological Life Zones ofPuerto Rico and the US Virgin Islands, Research Paper ITF-18.Rio Piedras: USDA Forest Service, Institute of Tropical For-estry. https://www.fs.usda.gov/treesearch/pubs/5551
Gent, P.R., Danabasoglu, G., Donner, L.J., Holland, M.M.,Hunke, E.C., Jayne, S.R., Lawrence, D.M., Neale, R.B.,Rasch, P.J., Vertenstein, M., Worley, P.H., Yang, Z.L. andZhang, M. (2011) The community climate system model ver-sion 4. Journal of Climate, 24, 4973–4991. https://doi.org/10.1175/2011JCLI4083.1.
Hall, T.C., Sealy, A.M., Stephenson, T., Kusunoki, S., Taylor, M.A.,Chen, A. and Kitoh, A. (2013) Future climate of the Caribbeanfrom a super-high-resolution atmospheric general circulationmodel. Theoretical and Applied Climatology, 113, 271–287.https://doi.org/10.1007/s00704-012-0779-7.
Hayhoe, K. (2013) Quantifying key drivers of climate variability andchange for Puerto Rico and the Caribbean. Final report. Agree-ment number G10AC00582, 1-241. http://www.pr-ccc.org/wp-content/uploads/2014/08/PP_1-52_Hayhoe_Caribbean_Final_Report.pdf
He, J. and Soden, B. (2017) A re-examination of the projected sub-tropical precipitation decline. Nature Climate Change, 7, 53–57.https://doi.org/10.1038/nclimate3157.
Held, I.M. and Soden, B.J. (2006) Robust responses of the hydro-logic cycle to global warming. Journal of Climate, 19,5686–5699. https://doi.org/10.1175/JCLI3990.1.
Henareh, A.K., Gould, W.A., Harmsen, E., Terando, A.,Quinones, M. and Collazo, J.A. (2016) Climate change implica-tions for tropical islands: interpolating and interpreting statisti-cally downscaled GCM projections for management andplanning. Journal of Applied Meteorology and Climatology, 55,265–282. https://doi.org/10.1175/JAMC-D-15-0182.1.
Herwehe, J.A., Alapaty, K., Spero, T.L. and Nolte, C.G. (2014)Increasing the creditability of regional climate simulations byintroducing subgrid-scale cloud radiation interactions. Journalof Geophysical Research-Atmospheres, 119, 5317–5330. https://doi.org/10.1002/2014JD021504.
Hong, S.-Y. and Pan, H.L. (1996) Nonlocal boundary layer verticaldiffusion in a medium-range forecast model. Monthly WeatherReview, 124, 2322–2339. https://doi.org/10.1175/1520-0493(1996)124%3C2322:NBLVDI%3E2.0.CO;2.
Hong, S.-Y. and Lim, J.-O.J. (2006) The WRF single moment 6-classmicrophysics scheme (WSM6). Journal of the Korean Meteoro-logical Society, 42, 129–151.
Hong, S-Y, Noh, Y., and Dudhia, J. (2016) A New Vertical DiffusionPackage with an Explicit Treatment of Entrainment Processes.Mon. Wea. Rev. 134(9), 2318-2341. https://doi.org/10.1175/MWR3199.1.
Iacono, M.J., Delamere, J.S., Mlawer, E.J., Shephard, M.W.,Clough, S.A. and Collins, W.D. (2008) Radiative forcing bylong-lived greenhouse gases: calculations with the AER radia-tive transfer models. Journal of Geophysical Research, 113,D13103. https://doi.org/10.1029/2008JD009944.
Ikawa, M. and Saito, K. (1991) Description of a non-hydrostaticmodel developed at the forecast research department of theMRI. MRI Tech Report, 28, 1–238. https://doi.org/10.11483/mritechrepo.28.
Jury, M.R. and Chiao, S. (2013) Leeside boundary layer confluenceand afternoon thunderstorms over Mayaguez, Puerto Rico.Monthly Weather Review, 52, 439–454. https://doi.org/10.1175/JAMC-D-11-087.1.
Lau, K.M. and Kim, K.-M. (2015) Robust Hadley circulationchanges and increasing global dryness due to CO2 warmingfrom CMIP5 model projections. Proceedings of the NationalAcademy of Sciences, 112, 3630–3635. https://doi.org/10.1073/pnas.1418682112.
Lugo, A.E., Castro, L.M., Vale, A., López, T.M., Prieto, E.H., Martinó,A.G., Puente Rolón, A.R., Tossas, A.G., McFarlane, D.A., Miller,T., Rodríguez, A., Lundberg, J., Thomlinson, J., Colón, J.,Schellekens, J.H., Ramos, O., and Helmer, E. (2001) Puerto RicanKarst-A Vital Resource. United States Department of AgricultureForest Service Gen. Tech. Report WO-65. https://www.fs.usda.gov/treesearch/pubs/2864
Karmalkar, A.V., Taylor, M.A., Campbell, J., Stephenson, T.,New, M., Centella, A., Benzanilla, A. and Charlery, J. (2013) Areview of observed and projected changes in climate for islandsin the Caribbean. Atmosfera, 26, 283–309. https://doi.org/10.1016/S0187-6236(13)71076-2.
Kanamitsu, M., Yoshimura, K., Yhang, Y.-B. and Hong, S.-Y. (2010)Errors of interannual variability and trend in dynamical down-scaling of reanalysis. Journal of Geophysical Research-Atmo-spheres, 115, D17115. https://doi.org/10.1029/2009JD013511.
Knutson, T., Camargo, S.J., Chan, J.C.L., Emanuel, K., Ho, C.-H.,Kossin, J., et al. (2019a) Tropical cyclones and climate changeassessment: part I. Detection and Attribution. Bulletin of theAmerican Meteorological Society, 100, 1987–2007. https://doi.org/10.1175/BAMS-D-18-0189.1.
Knutson, T., Camargo, S.J., Chan, J.C.L., Emanuel, K., Ho, C.-H.,Kossin, J., Mohapatra, M., Satoh, M., Sugi, M., Walsh, K. andWu, L. (2019b) Tropical cyclones and climate change assess-ment: part II. Projected response to anthropogenic warming.Bulletin of the American Meteorological Society, 101 E303–E322.https://doi.org/10.1175/BAMS-D-18-0194.1.
Knutti, R., Furrer, R., Tebaldi, C., Cermak, J. and Meehl, G.A.(2010) Challenges in combining projections from multiple cli-mate models. Journal of Climate, 23, 2739–2758.
Kossin, J.P. and Vimont, D.J. (2007) A more general framework forunderstanding Atlantic hurricane variability and trends. Bulle-tin of the American Meteorological Society, 88, 1767–1781.https://doi.org/10.1175/BAMS-88-11-1767.
Kossin, J.P. (2017) Hurricane intensification along United Statescoast suppressed during active hurricane periods. Nature, 541,390–393. https://doi.org/10.1038/nature20783.
Kossin, J.P. (2018) A global slowdown of tropical-cyclone transla-tion speed. Nature, 558, 104–107. https://doi.org/10.1038/s41586-018-0158-3.
Mezghani, A., Dobler, A., Benestad, R., Haugen, J.E. andPardking, K.M. (2019) Subsampling impact on the climatechange signal over Poland based on simulations from statisticaland dynamical downscaling. Journal of Applied Meteorologyand Climatology, 58, 1061–1078.
Miller, G., and Lugo, A.E. (2009) Guide to the ecological systems ofPuerto Rico. General Technical Report, IITF-GTR-35, 1-437https://www.fs.usda.gov/treesearch/pubs/35382.
Misra, V. (2007) Addressing the issue of systematic errors in aregional climate model. Journal of Climate, 20, 801–818.https://doi.org/10.1175/JCLI4037.1.
Murphy, P.G., Lugo, A.E., Murphy, A.J. and Nepstad, D.C. (1995)The dry forests of Puerto Rico's south coast. In: Lugo, A.E. andLowe, C. (Eds.) Tropical Forests: Management and Ecology. Eco-logical Studies (Analysis and Synthesis), Vol. 112. New York,NY: Springer.
Nakanishi, M. and Niino, H. (2006) An improved Mellor-Yamadalevel-3 model: its numerical stability and application to aregional prediction of advection fog. Boundary-Layer Meteorol-ogy, 119, 397–407. https://doi.org/10.1007/s10546-005-9030-8.
Neelin, J.D., Münnich, M., Su, H., Meyerson, J.E. and Holloway, C.E. (2006) Tropical drying trends in global warming models andobservations. Proceedings of the National Academy of Sciences,103, 6110–6115. https://doi.org/10.1073/pnas.0601798103.
National Centers for Environmental Information (NOAA NCEI)(2019) U.S. billion-dollar weather and climate disasters. Avail-able at: https://www.ncdc.noaa.gov/billions
Otte, T.L., Nolte, C.G., Otte, M.J. and Bowden, J.H. (2012) Doesnudging squelch the extremes in regional climate modeling?Journal of Climate, 25, 7046–7066. https://doi.org/10.1175/JCLI-D-12-00048.1.
Pan, H. and Wu, W. (1995) Implementing a mass-flux convectiveparameterization package for the NHM medium range forecastmodel. NHM Office Note 409 https://repository.library.noaa.gov/view/noaa/11429.
Pasch, R., Penny, A.B. and Berg, R. (2019) National hurricane cen-ter tropical cyclone report. Hurricane Maria (AL 152017).
Pfahl, S., O'Gorman, P.A. and Fischer, E.M. (2017) Understandingthe regional pattern of projected future changes in extreme pre-cipitation. Nature Climate Change, 7, 423–427. https://doi.org/10.1038/nclimate3287.
Rasmussen, R., Liu, C., Ikeda, K., Gochis, D., Yates, D., Chen, F.,Tewari, M., Barlage, M., Dudhia, J., Yu, W. and Miller, K.(2011) High-resolution coupled climate runoff simulations ofseasonal snowfall over Colorado: a process study of current andwarmer climate. Journal of Climate, 24, 3015–3048. https://doi.org/10.1175/2010JCLI3985.1.
Riahi, K., Rao, S., Volker, K., Cho, C., Chirkov, V., Fischer, G.,et al. (2011) RCP8.5 – a scenario of comparatively high green-house gas emissions. Climatic Change, 109, 33–57. https://doi.org/10.1007/s10584-011-0149-y.
Ryu, J.-H. and Hayhoe, K. (2014) Understanding the sources ofCaribbean precipitation biases in CMIP3 and CMIP5 simula-tions. Climate Dynamics, 42, 3233–3252. https://doi.org/10.1007/s00382-013-1801-1.
Saito, K., Fujita, T., Yamada, Y., Ishida, J., Kumagai, Y.,Aranami, K., et al. (2006) The operational JMA nonhydrostaticmesoscale model. Monthly Weather Review, 134, 1266–1298.https://doi.org/10.1175/MWR3120.1.
Santer, B.D., Taylor, K.E., Gleckler, P.J., Bonfils, C., Barnett, T.P.,Pierce, D.W., Wigley, T.M.L., Mears, C., Wentz, F.J., Brü-ggemann, W., Gillett, N.P., Klein, S.A., Solomon, S., Stott, P.A.,and Whener, M.F. (2009) Incorporating model quality informa-tion in climate change detection and attribution studies, PNAS,106, 14778–14783. https://doi.org/10.1073/pnas.0901736106.
Santos-Burgoa, C., Goldman, A., Andrade, E., Barrett, N., Colon-Ramos, U., Edberg, M., Garcia-Meza, A., Goldman, L., Roess,A., Sandberg, J., and Zeger, S. (2018) Ascertainment of the esti-mated excess mortality from Hurricane Maria in Puerto. Avail-able at: https://hsrc.himmelfarb.gwu.edu/sphhs_global_facpubs/288
Slingo, J.M. (1987) The development and verification of a cloud pre-diction scheme for the ECMWF model. Quarterly Journal of theRoyal Meteorological Society, 113, 899–927. https://doi.org/10.1002/qj.49711347710.
Skamarock, W.C. and Klemp, J.B. (2008) A time-split non-hydrostatic atmospheric model for weather research and fore-casting applications. Journal of Computational Physics, 227,3465–3485. https://doi.org/10.1016/j.jcp.2007.01.037.
Sugi, M., Kuma, K., Tada, K., Tamiya, K. and Hasegawa, N. (1990)Description and performance of the JMA operational global spec-tral model (JMA-GSM88).GeophysicalMagazine, 43, 105–130.
Taylor, K.E., Stouffer, R.J. and Meehl, G.A. (2012) An overview ofCMIP5 and the experiment design. Bulletin of the AmericanMeteorological Society, 93, 485–498. https://doi.org/10.1175/BAMS-D-11-00094.1.
Taylor, M.A. and Clarke, L.A. (2018) Future Caribbean climate in aworld of rising temperatures. The 1.5 vs. 2.0 dilemma. Journal ofClimate, 31, 2907–2926. https://doi.org/10.1175/JCLI-D-17-0074.1.
Tiedtke, M., Heckley, W.A. and Slingo, J. (1988) Tropical forecast-ing at ECMWF: the influence of physical parameterization onthe mean structure of forecasts and analyses. Quarterly Journalof the Royal Meteorological Society, 114, 639–664. https://doi.org/10.1002/qj.49711448106.
Van Beusekom, A.E., González, G. and Rivera, M.M. (2016) Short-term precipitation and temperature trends along an elevationgradient in northeastern Puerto Rico. Earth Interactions, 19,1–33. https://doi.org/10.1175/EI-D-14-0023.1.
Vimont, D.J. and Kossin, J.P. (2007) The Atlantic meridional modeand hurricane activity. Geophysical Research Letters, 34,L07709. https://doi.org/10.1029/2007GL029683.
Voldoire, A., Sanchez-Gomez, E., Salas y Mélia, D., Decharme, B.,Cassou, C., Sénési, S., et al. (2013) The CNRM-CM5.1 global cli-mate model: description and basic evaluation. Climate Dynam-ics, 40, 2091–2121. https://doi.org/10.1007/s00382-011-1259-y.
Wang, C., Lee, S.-K. and Enfield, D.B. (2008) Atlantic warm poolactiving as a link between Atlantic multidecadal oscillation andAtlantic tropical cyclone activity. Geochemistry, Geophysics,Geosystems, 9, 1–17. https://doi.org/10.1029/2007GC001809.
Wilks, D.S. (2006) Statistical Methods in the Atmospheric Sciences.London: Academic Press. https://www.elsevier.com/books/statistical-methods-in-the-atmospheric-sciences/wilks/978-0-12-751966-1
Wootten, A., Bowden, J.H., Boyles, R. and Terando, A. (2016) Thesensitivity of WRF downscaled precipitation in Puerto Rico tocumulus parameterization and interior grid nudging. Journal ofApplied Meteorology and Climatology, 55, 2263–2281. https://doi.org/10.1175/JAMC-D-16-0121.
SUPPORTING INFORMATIONAdditional supporting information may be found onlinein the Supporting Information section at the end of thisarticle.
How to cite this article: Bowden JH,Terando AJ, Misra V, et al. High-resolutiondynamically downscaled rainfall and temperatureprojections for ecological life zones within PuertoRico and for the U.S. Virgin Islands. Int J Climatol.2020;1–23. https://doi.org/10.1002/joc.6810