88
Highway Design Training Course Part I By Xudong Jia, Ph.D., PE Timothy Romine Department of Civil Engineering California State Polytechnic University, Pomona March 2002
| Date post: | 22-Dec-2015 |
| Category: |
Documents |
| View: | 215 times |
| Download: | 1 times |

Highway Design Training CoursePart I
By
Xudong Jia, Ph.D., PETimothy Romine
Department of Civil EngineeringCalifornia State Polytechnic University, Pomona
March 2002

Purpose
• The three-day training course will provide you with a basic understanding of concepts and principals of highway geometric design.
• The course will review CalTrans design procedures and standards, AASHTO green book, and design process as performed in the CADD environment of CAiCE.
• The course will teach you the steps required to complete a typical roadway interchange project.
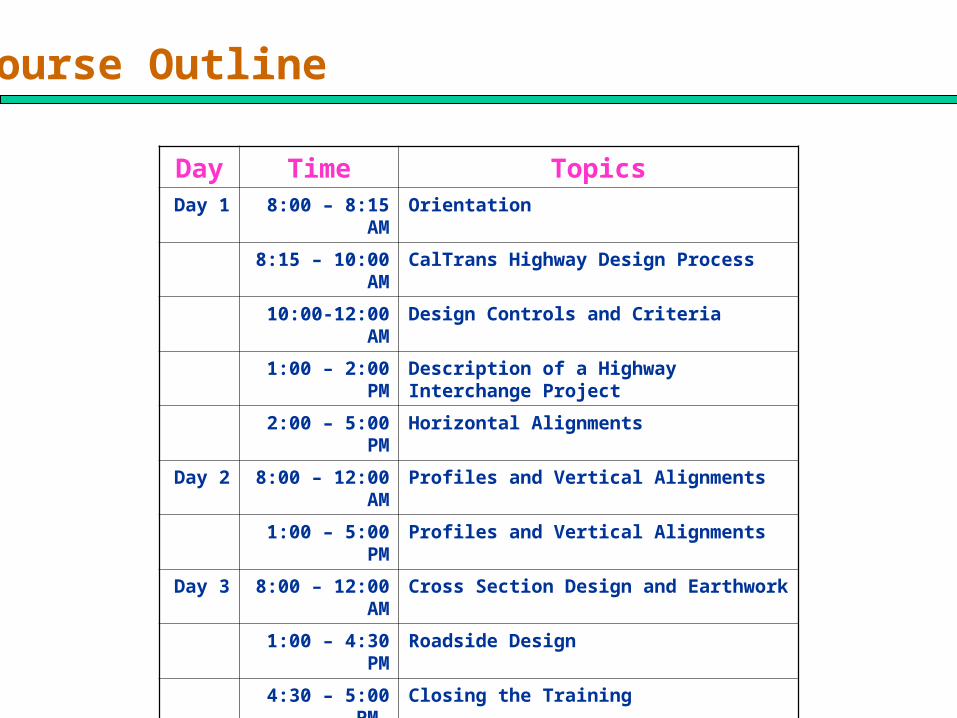
Course Outline
Day Time TopicsDay 1 8:00 – 8:15 AM Orientation
8:15 – 10:00 AM CalTrans Highway Design Process
10:00-12:00 AM Design Controls and Criteria
1:00 – 2:00 PM Description of a Highway Interchange Project
2:00 – 5:00 PM Horizontal Alignments
Day 2 8:00 – 12:00 AM Profiles and Vertical Alignments
1:00 – 5:00 PM Profiles and Vertical Alignments
Day 3 8:00 – 12:00 AM Cross Section Design and Earthwork
1:00 – 4:30 PM Roadside Design
4:30 – 5:00 PM Closing the Training

Training Project

Structure of Training Workshop
Fundamentals of Highway Design
Chapter 1 IntroductionChapter 2 CalTrans Highway Design ProcessChapter 3 Design Controls and CriteriaChapter 4 Project DescriptionChapter 5 Horizontal AlignmentsChapter 6 Profiles and Vertical AlignmentsChapter 7 Cross Section design and EarthworkChapter 8 Roadside DesignChapter 9 Conclusions

CalTrans Project Development Process
• CalTrans project development process is described in the CalTrans Project Development Procedures Manual.
• It is tied to the legal requirements of environmental laws and regulations, engineering requirements, and CalTrans’ management approval steps.
• The process is depicted by a milestone chart.
• This chart is very important for any civil engineers who are involved in a CalTrans project from its feasibility study to the completion of construction.

CalTrans Project Development Process
0. Identify Project Need System and Regional System PlanningTIP Program
Project Initiation
Prepare a 2- or 3-page Project Proposal ReportAssign a Project Manager (PM)Form a Project Development Team (PDT)PM prepares a Project Work Plan
A

CalTrans Project Development Process
10. Approve PSRDetermine Project Alternatives including no-built; Document the alternatives in Project Study Report; Approve PSR
20-140.
Initiate Environmental Studies
Initiate DPR & DED
Circulate DPR&DED in dist.
Circulate DED/Approve DPR
Feasibility study of all the alternativesListed in the PSR.
Two major studies: Environmental Studies (Draft Env. Document) Engineering Studies (Draft Project Report)
The Least environmentally damaging, practicable alternative (LEDPA) must be identified.
A
B

CalTrans Project Development Process
140.Public Hearing160.Approve FED
Conduct a public hearing;
Collect comments and insert them in the analysis of the preferred alternative; Approve final environmental document; Approve the preferred project alternative
Initiate PS & E (200); Geo Base Map (220); Skeleton Layout (260)
Initiate project design to prepare Plans, Specifications and Estimate (PS&E) An environmental reevaluation is undertakenStructure PS &E and R/W mapping start concurrently with the project PS &E.
B
C

CalTrans Project Development Process
260-300:Detailed Project Design
Conduct a detailed project design on plans, quantity calculations and contract specifications; Circulate project plans
300 – 380:
Complete Project Design
Insert the comments in the PS&E design Conduct a Safety Review Finalize PS &E Submit Project PS7E with Structure PS&E to the Office of Office Engineer of the Engineering Service Center
C
D

CalTrans Project Development Process
380-500:Prepare and Advertise Project Contract
The design work now is complete; Right of Way Certification; Funds Request Approval; Assemble the final Project documents and bidding package; Open bids and Award a contract
500-700:
Conduct and Complete Construction Project
D
Start and finish construction according PS&EPrepare final project file

Key Terms and Concepts
Before we start, the following key terms should be clarified:
1. ADT2. Overcross and Undercross3. Bridges and Culverts4. 2-lane, 4-lane, 6-lane, 8-lane highways5. Elements of a typical road cross section 6. Highway stationing7. Mandatory, Advisory, and Permissive Standards

ADT
Number of vehicles that pass a particular point on a roadway during a period of 24 consecutive hours averaged over a design year.

ADT
What is the Unit of ADT?
Measured on One Direction or Two Directions of the road ?
Present ADT is used for Resurfacing, Restoration, and Rehabilitation (RRR) projects. Future ADT is used for new construction projects.
How to estimate present ADT?
How to Define Future? How to estimate future ADT?

Overcross or Undercross
Adopted from http://www.aaroads.com/san-diego

Bridges and Culverts
Structures whose span > 6.1 m are bridges. Structure Engineers are responsible for their design.
Structure whose span <= 6.1 m are culverts. Highway Designers are responsible for their design

2-Lane, 4-lane, 6-lane and 8-Lane Highways
2-LaneHighway
4-LaneHighway
6-LaneHighway
8-LaneHighway

Divided and Undivided Highways
Divided Highways:
Separated roadbeds for traffic in opposite directionsOne Centerline and two station linesSuperelevation are designed independently for curvesin opposite directions
Undivided Highways
One roadbed for traffic in opposite directionsOne Centerline and One Station LineSuperelevation is designed jointly for curvesin opposite directions

Elements of a Typical Road Cross Section

Highway Stationing
Stationing goes from West to East for even-number highways
Stationing goes from North to South for odd-number highways
Ramps associated with even-number highways are stationed from West to East.
Ramps associated with odd-number highways are stationed from North to South.

Mandatory, Advisory, and Permissive
Mandatory standards are most essential to achievement of overall design objectives. Mandatory standards use the word "shall" and are printed in Boldface type.
Advisory standards are important also, but allow greater flexibility in application to accommodate design constraints. Advisory standards use the word "should" and are indicated by Underlining.
Permissive Standards are all standards other than mandatory or advisory, whether indicated by the use of "should" or "may“. They are permissive with no requirement for application intended.

Design Manuals
Design Manuals often used in a highway project:
CalTrans Project Development Procedures Manual CalTrans HDMAASHTO Green BookRamp Meter Design ManualAASHTO Roadside Design GuideCalTrans Flexible Pavement Rehabilitation ManualTraffic ManualCAD User Manual Highway Capacity Manual

Design Controls and Criteria
Design Controls and Criteria consist of general controls and detailed controls that are related to elements of a highway designproject
General Controls are Represented by the Design Designation listed in PSR and PS documents. They are ADT, DHV, D,T, and V.
Detailed Controls vary from a project to another. An example control is Vertical Clearance that should be considered when undercrossing or overcrossing structures are involved.

General Design Controls and Criteria
Present ADTCurrent ADTDHVTVDesign LOS

DHV

DHV
What is the Unit of DHV?
Measured on One Direction or Two Directions of the road ?
Present DHV is used for Resurfacing, Restoration, and Rehabilitation (RRR) projects.
Future DHV is used for new construction projects.

How to Measure Current DHV
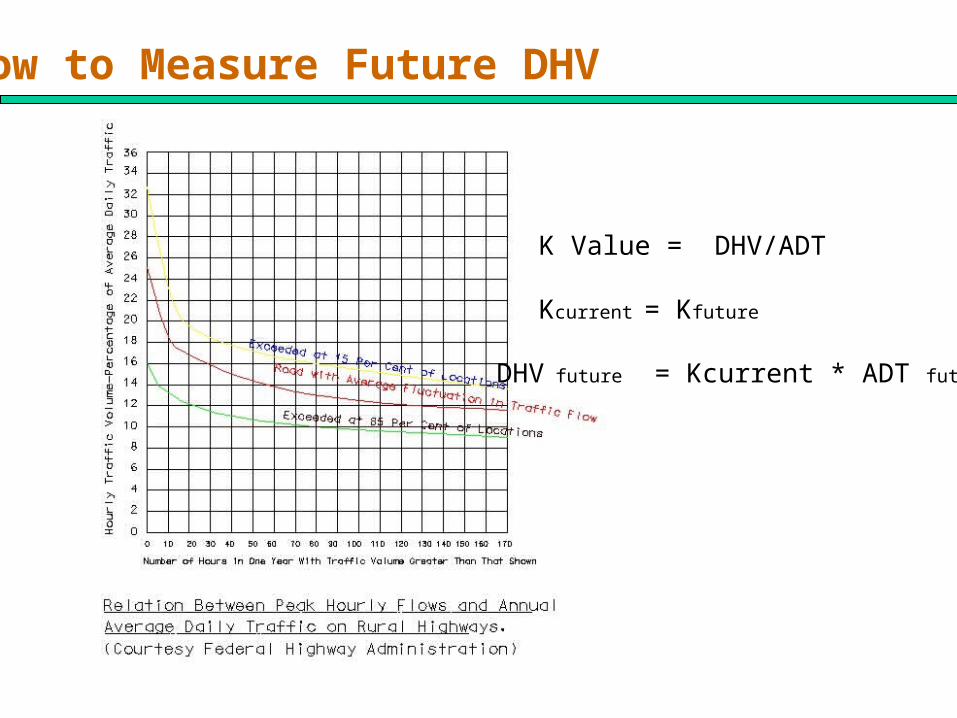
How to Measure Future DHV
K Value = DHV/ADT
Kcurrent = Kfuture
DHV future = Kcurrent * ADT future
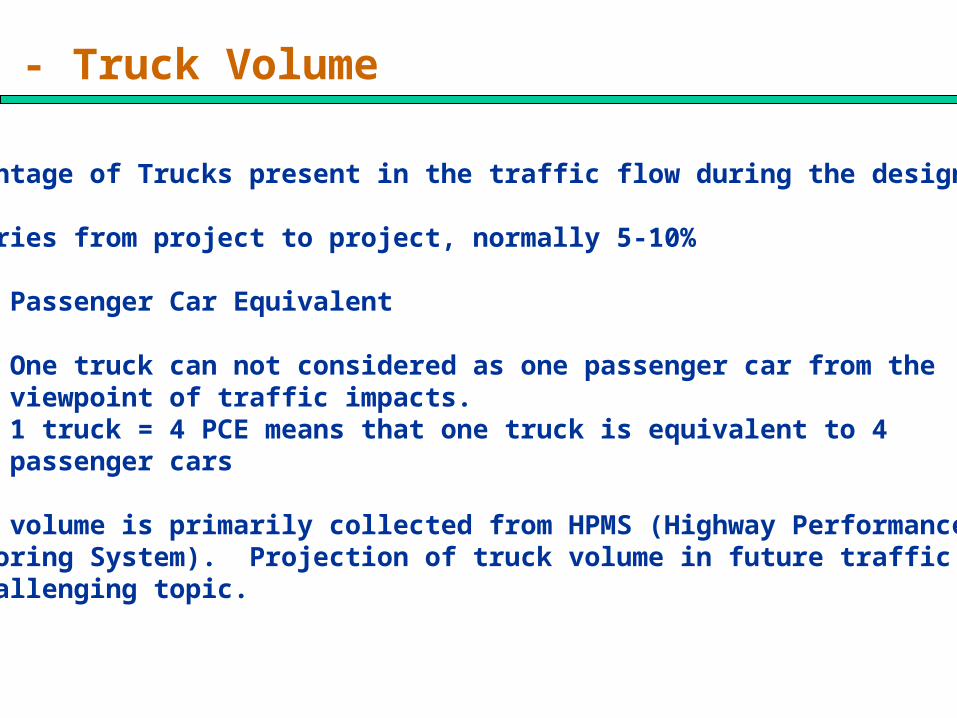
T - Truck Volume
Percentage of Trucks present in the traffic flow during the design hour
It varies from project to project, normally 5-10%
PCE - Passenger Car Equivalent
One truck can not considered as one passenger car from theviewpoint of traffic impacts. 1 truck = 4 PCE means that one truck is equivalent to 4 passenger cars
Truck volume is primarily collected from HPMS (Highway Performance Monitoring System). Projection of truck volume in future traffic flowIs challenging topic.

V – Design Speed
Design speed is selected to establish specific minimum geometric design elements for a particular section of highway
It is influenced principally by the character of terrain, economic considerations, environmental factors, type and anticipated volume of traffic, functional classification of the highway, and whether the area is rural or urban.
Selection of the design speed for a highway project should follow Table 101.2 (HDM Page 100-2) that determines design speed based primarily on the functional class of the highway. This is a mandatory requirement.

V – Design Speed
A freeway design speed is 75 km/h Is it OK?
A conventional highway in rural area is 55km/h Is it OK?
Design speed controls every elements of geometric design including widths of pavement and shoulders, horizontal clearances, etc.
True or False
A best practice in selecting design speed is to choose as high speed as feasible when a minimum design speed is met. The design speed should be same on various segments of a highway.
True or False

Design Speed, Post Speed, 85th Percentile Speed
Design speed is "the maximum safe speed that can be maintained over a specified section of highway.
Posted speed refers to the maximum speed limit posted on a section of highway using a regulatory sign. It is based primarily upon the 85th percentile speed when adequate speed samples can be secured.
The 85th percentile speed is the speed at or below which 85% of drivers are operating their vehicles.
Design Speed Post Speed = 85th Percentile Speed
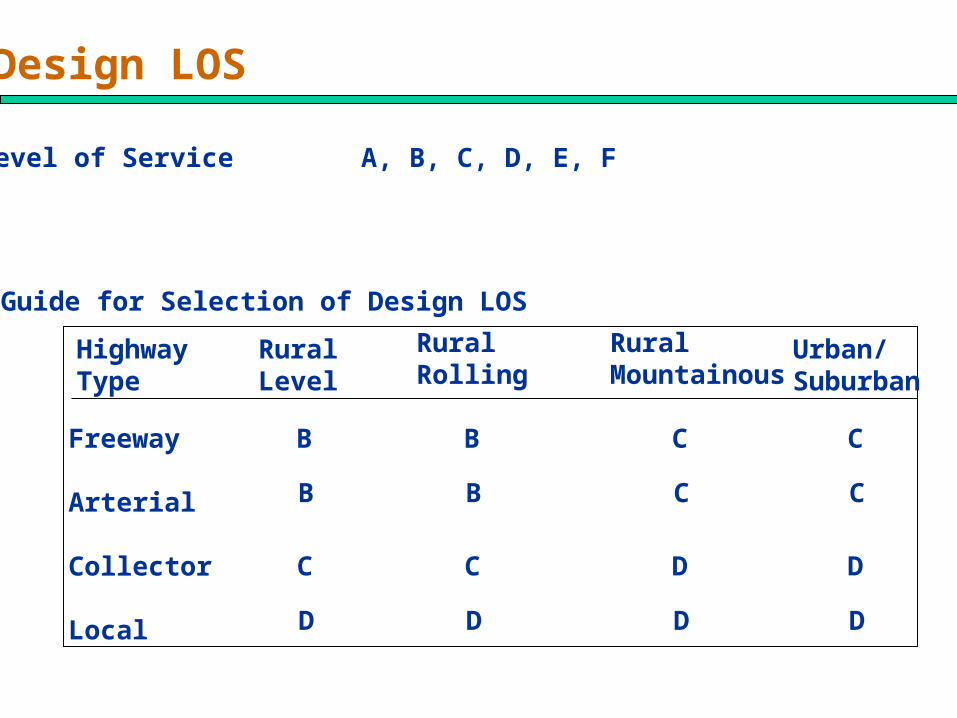
Design LOS
Level of Service A, B, C, D, E, F
HighwayType
Guide for Selection of Design LOS
Freeway
Arterial
Collector
Local
RuralLevel
RuralRolling
Rural Mountainous
Urban/Suburban
B B C C
B B C C
C C D D
D D D D

Determination of Number of Lanes
Two Methods are available for the determination of number of lanes
HDM Method: Design LOS
Urban
Rural
C-E
C-D
Peak Hour Traffic Volume(Design Year/Average pvplph)
1400-2000
1000-1200
HCM Methodpwhvipwhvi
i
fffMSF
DDHV
fffMSF
SFN
******
)1()1(1
1
rrtthv EPEPf
Why Do We Care about of Number of Lanes?
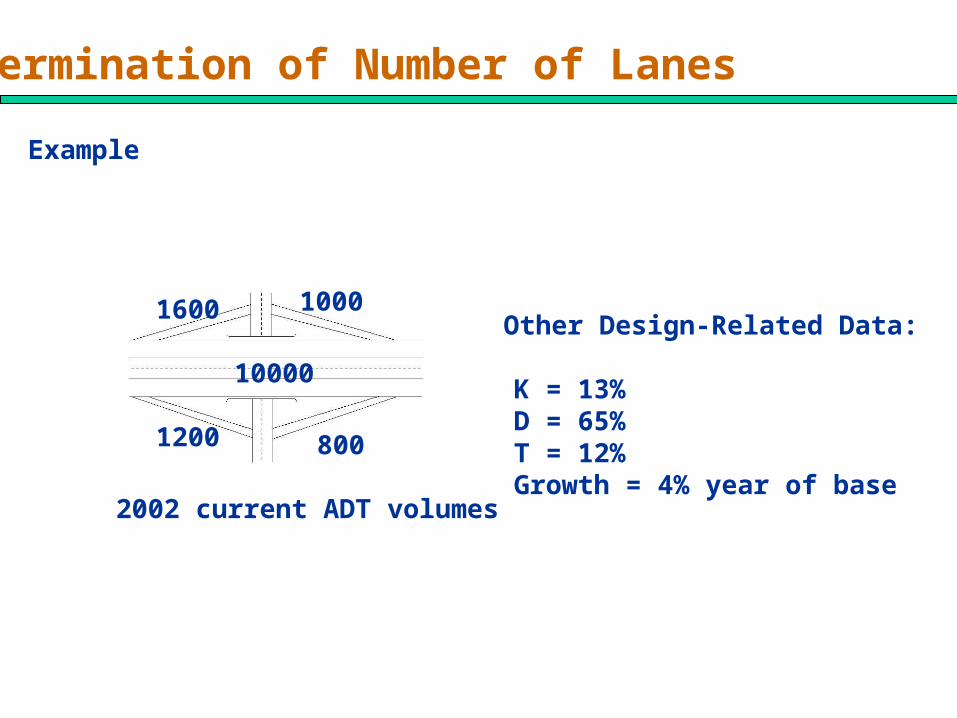
Determination of Number of Lanes
Example
10000
1600 1000
1200 800
K = 13%D = 65%T = 12%Growth = 4% year of base
2002 current ADT volumes
Other Design-Related Data:

Critical Segment:
10000 1600+ 120012800 10000
10000 1000+ 800
11800
Critical Segment

HDM Method
Assume Peak Hourly Volume in HDM means DHV in the design year
Design LOS = C
Design Year for a new project is 20 years after the completion of the project:
Project Finish Year Design Year2004 2024
Future DHV = 12800 (1+ 4%) * 13% = 3944 Veh/Hour
Future DDHV = 3944 * 0.65 = 2564 Veh/Hour
Number of Lanes = 2564 /1400 = 2 Lanes
22

HCM Method
Design LOS = C, Local Commuters, Standard Lane Width, Design Speed 110 km/h, PCE = 6
Design Year for a new project is 20 years after the completion of the project:
Project Finish Year Design Year2004 2024
Future DHV = (12800*0.88+12800 * 0.12*6) (1+ 4%) * 13% = 6309 Veh/H
Future DDHV = 6309 * 0.65 = 4104 Veh/H
Fhv = 1/(1+0.12(6-1)) = 0.625
Number of Lanes = 4104 /(1740* 1*0.625*1) = 4 lanes
22

Which One is Good?
CalTrans Method : 4-Lane Highway
HCM Method: 8-Lane Highway
8-Lane Highway is the choice
The impact of tracks and buses in the traffic stream is Significant in the determination of number of lanes.

Training Project
AB
C
Project Area

Training Project
Number of Lanes Route 8: 6-Lane FreewayRamps: Single-Lane RampsLaguna Canyon Road 4-Lane Highway
Geometric Control Points Pt A. S 70 E, Elev: 943.91 ft, Grade –1.5% (English)
N2389.10 ft, E 1855.20 ft (English)S 70 E, Elev: 287.70 m, Grade –1.5% (Metric)N728.20 m, E 565.46 m (Metric)
Pt B S 80 E, Elev: 9030.00 ft, Grade –2.0%(English)N 2400.00 ft, E 5300.00 ft (English)S 80 E, Elev: 283.46 m, Grade –2.0% (Metric)N731.52 m, E 1615.44 m (Metric)
Pt C N 10 W, Elev: 905.00 ft, Grade 4% (English)N2000.00 ft, E 3800.00 ft (English)N 10 W, Elev: 275.85 m, Grade 4% (Metric)N 609.6 m, E 1158.24 m (Metric)

Training Project
Design Speed: Route 8 110 km/hRamps 40-80 km/hLaguna Canyon Road 55 km/h
Others: Cut Slope 1.5:1Fill Slope 2:1ROW 3 m away from catch points
Design Standards CalTrans HDM
AASHTO Green Book Acceptable Highway Design Practice

Horizontal Alignment
Elements of Horizontal Alignment
CalTrans Standards on Horizontal Alignment
CalTrans Standards Used in the Training Project
Conformance Check of CalTrans Standards

Horizontal Alignment
TangentSegment
SpiralCircularCurve
A horizontal alignment consists of a series of tangent line segments, spirals and circular curves
CalTrans does not use spirals at all
Tangent line segments are easy to handle. However the circular curves areNot. They affect significantly the safety considerations of a highway project and require a smooth transition from tangent segments.

Circular Curve in Horizontal Alignment
)(
0079.0
)(127
22
ss fe
V
fe
VR
PI
BCEC
R

Superelevation emax and e
Superelevation e is a cross slope to balance the centrifugal force
emax is the maximum superelevation rate given a certain highway type.It varies from one highway type to another. For Example,
emax = 0.10 for freeways (Page 200-9)
e is the superelevation rate used in the design
e is determined based on emax and R(Page 200-9)
What is a standard superelevation rate of freeways and expressways with a curve radius of 400 m?

Superelevation emax and e
What is a standard superelevation rate of freeways and expressways with a curve radius of 400 m?
emax = 0.10 from Table 202.2 Page 200-9
e = 0.09 from Table 202.2 Page 200-9 with R = 400 m
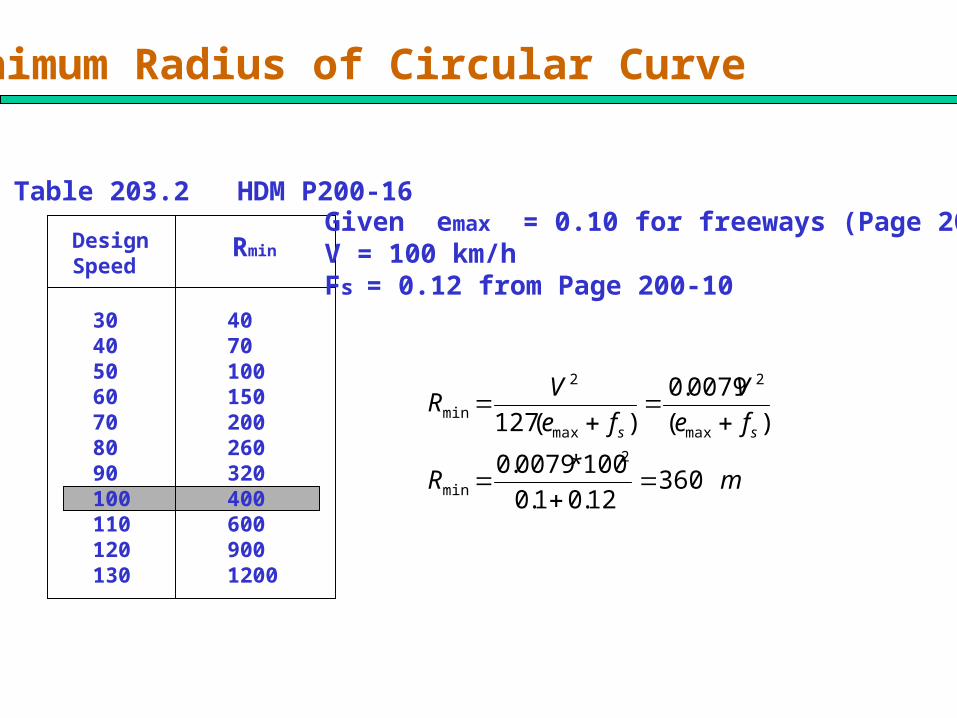
Minimum Radius of Circular Curve
mR
fe
V
fe
VR
ss
36012.01.0
100*0079.0
)(
0079.0
)(1272
min
max
2
max
2
min
Table 203.2 HDM P200-16
DesignSpeed
Rmin
30405060708090100110120130
40701001502002603204006009001200
Given emax = 0.10 for freeways (Page 200-9)V = 100 km/hFs = 0.12 from Page 200-10

Superelevation Transition
Superelevation Transition should be at the two ends of a curveIt consists of crown runoff and superelevation runoff (See Page 200-12)
The superelevation runoff has its two third on the tangent and one third on the curve.
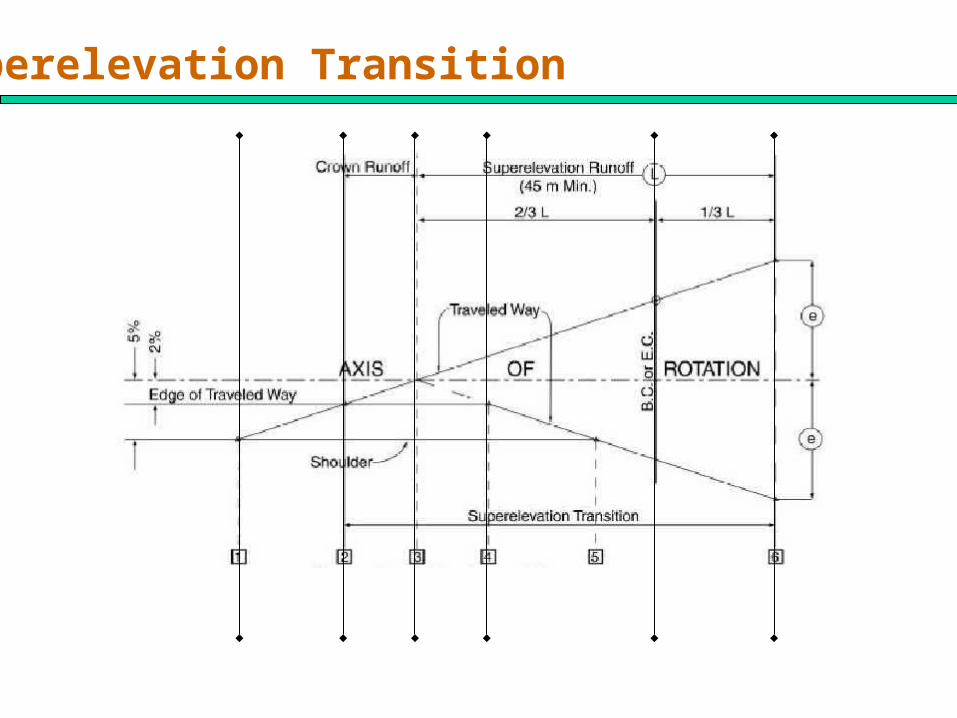
Superelevation Transition
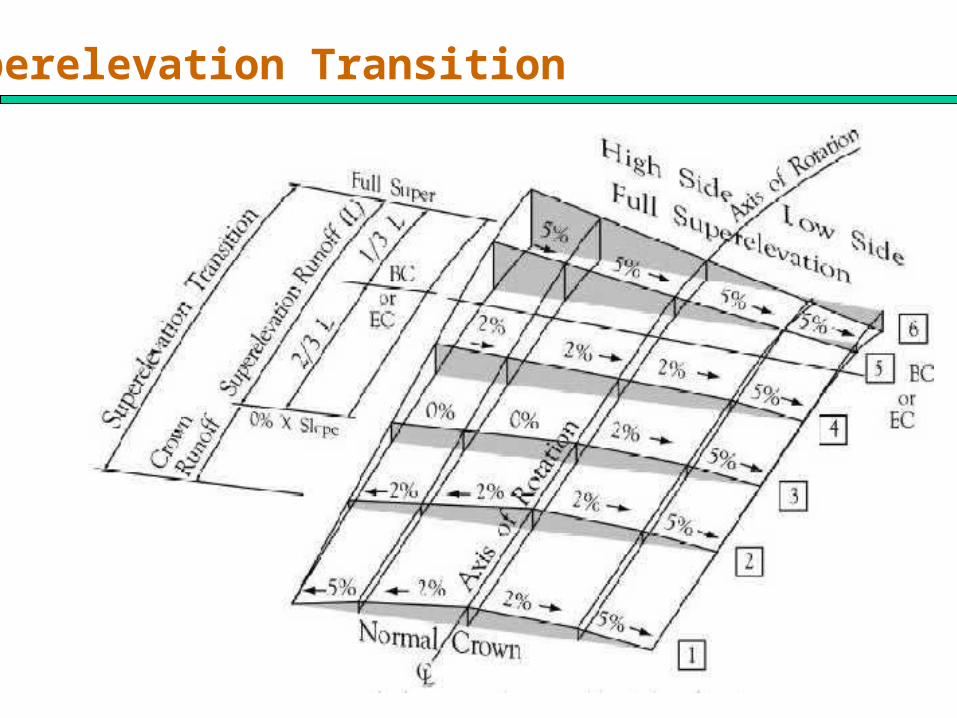
Superelevation Transition
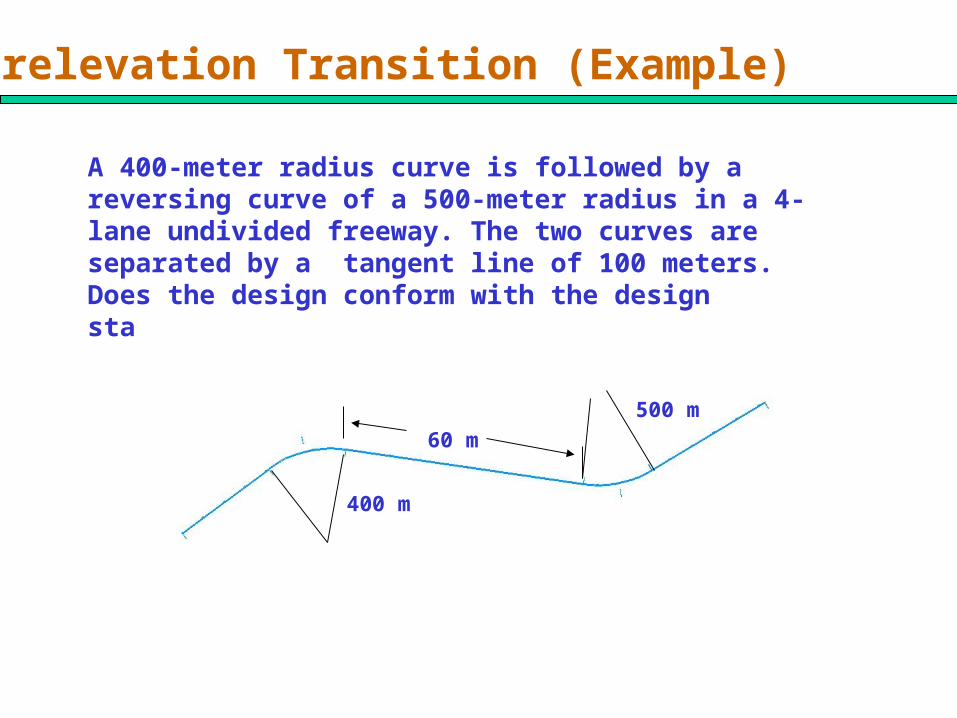
Superelevation Transition (Example)
A 400-meter radius curve is followed by a reversing curve of a 500-meter radius in a 4-lane undivided freeway. The two curves are separated by a tangent line of 100 meters. Does the design conform with the design standards?
400 m
500 m
60 m
400 m
500 m
60 mA
B
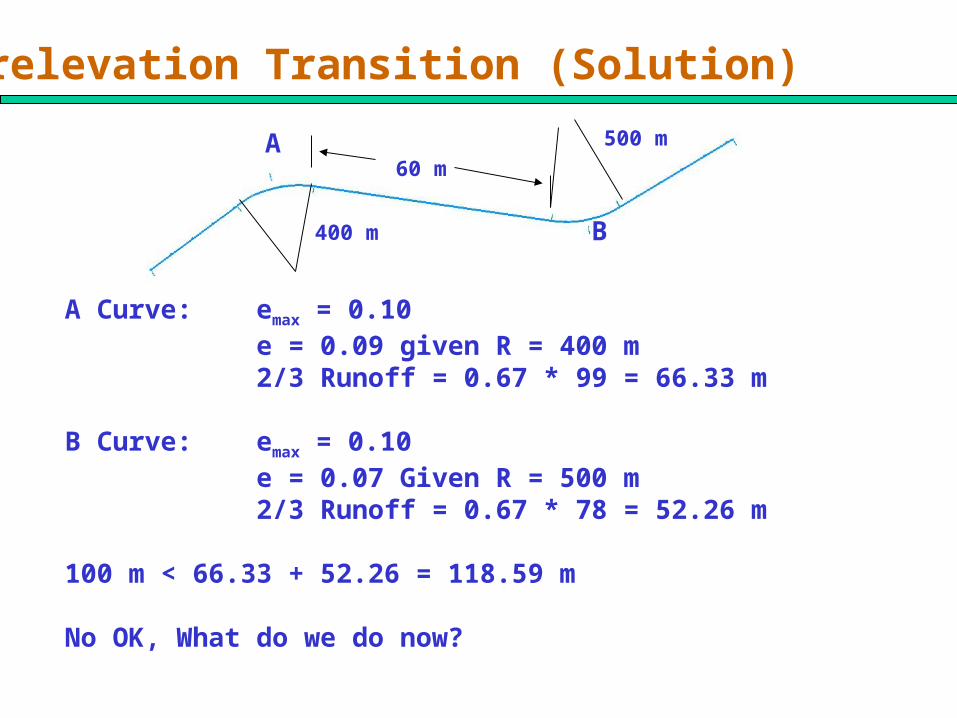
A Curve: emax = 0.10e = 0.09 given R = 400 m2/3 Runoff = 0.67 * 99 = 66.33 m
B Curve: emax = 0.10e = 0.07 Given R = 500 m2/3 Runoff = 0.67 * 78 = 52.26 m
100 m < 66.33 + 52.26 = 118.59 m
No OK, What do we do now?
Superelevation Transition (Solution)
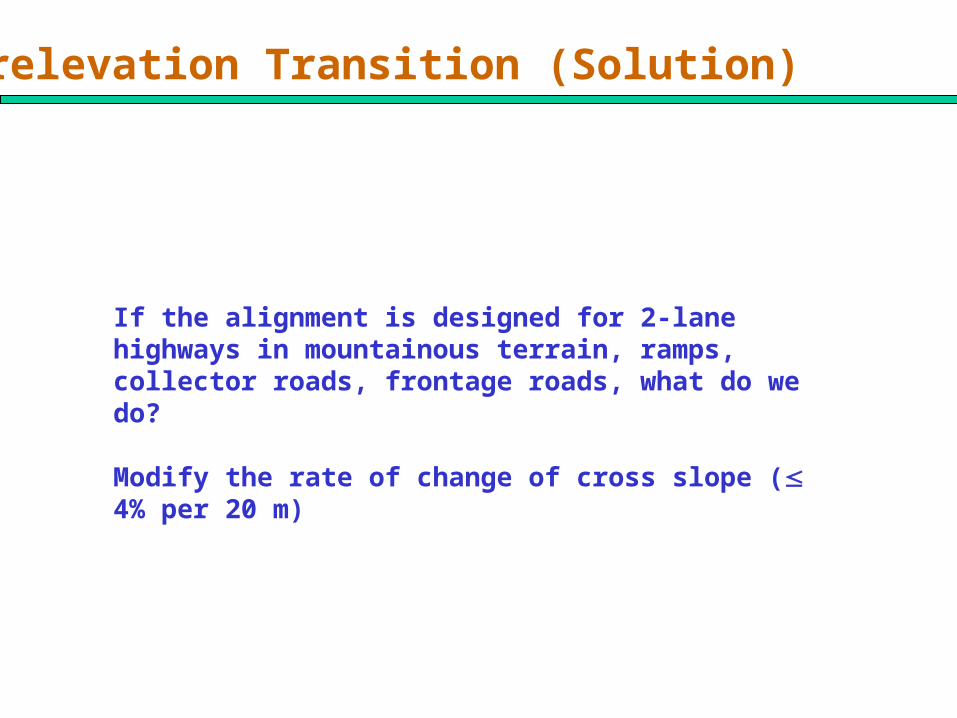
Superelevation Transition (Solution)
If the alignment is designed for 2-lane highways in mountainous terrain, ramps, collector roads, frontage roads, what do we do?
Modify the rate of change of cross slope ( 4% per 20 m)
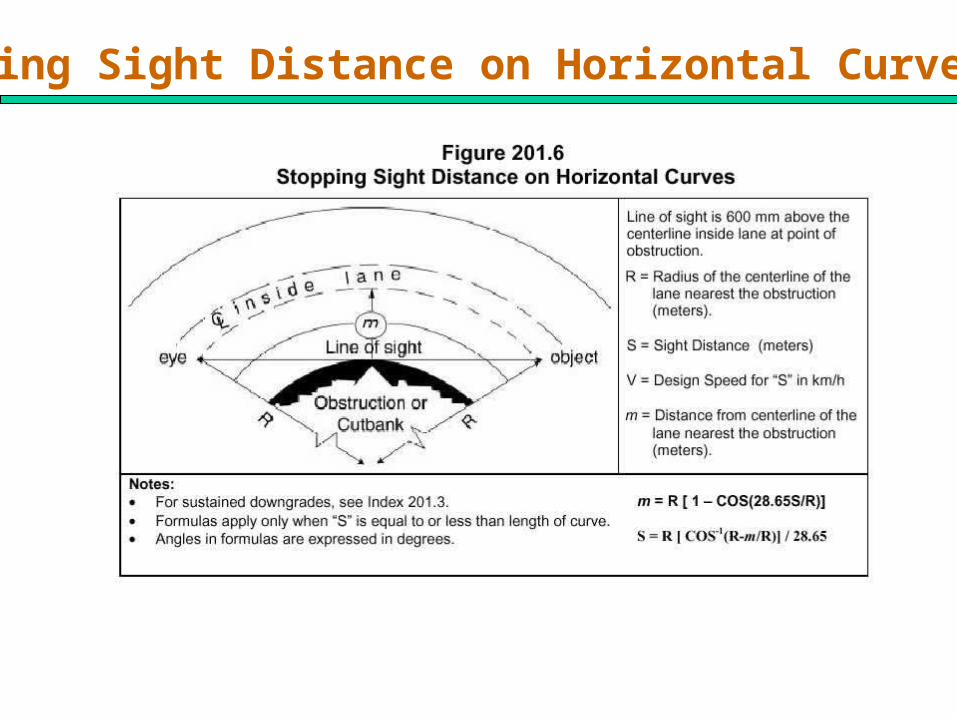
Stopping Sight Distance on Horizontal Curves

SSD on Horizontal Curves (Example)
A horizontal curve with a radius of 400 meters is designed on a two-lane highway that has design speed of 110 km/h. If the highway is flat at the curve section, determine the minimum distance a large McDonald’s billboard can be placed from the center line of the inside lane of the curve, without reducing the required SSD. Assume PIEV time of 2.5 sec and a = 3.4 m/sec2

SSD on Horizontal Curves (Solution)
meterm
m
sR
Rm
metersSSD
SSD
GgaV
VtSSD
21.14
))9.213*400
65.28cos(1(*400
))65.28
cos(1(
9.213
)081.94.3
(*254
1105.2*110*278.0
)(254*278.0
2
2

CalTrans Standards on Horizontal Alignments
Horizontal Alignment should provide at least the minimum SSD for the chosen design speed at all points of the highway
Curves should be designed with their radius greater than Rmin. If Rmin cannot provided enough lateral clearance to an obstruction, Figure 201.6 governs.
The Design Speed between successive curves should not more than 15 km/h due to alignment consistency
When < 10°, minimum curve length = 240 mWhen < 0.5°, no curve is needed
Compound curves should be avoided. Rshorter = 2/3Rlarger when Rshorter 300 mLarger radius curve follows smaller radius curve on 2-lane highway

CalTrans Standards on Horizontal Alignments
The connecting tangent on reversing curves should be greater than 2/3 runoff of the first curve and 2/3 runoff of the second curve. If it is not possible, 4% per 20 m governs. A minimum of 120 m should be considered when feasible.
Broken back curves are not desirable.
Alignment at bridges:
superelevation rate on bridge 10%Bridges should be out of 2/3 runoff of the curve at two ends.

CalTrans Standards on Horizontal Alignments
Superelevation:
3000 m radius curve, no superelevation is neededAxis of rotation
Centerline on undivided highwaysLeft edge of ETW on ramps and f-f connections
centerline on divided highways with medianwidth 20 m
median edges oftraveled way on divided highways with median
width > 20 m

Design Procedures of Horizontal Alignment
1. Investigate and assess the characters of the project area2. Determine individual elements of alignment
Curve Design: R min
curve length and Superelevation
Runoff3. Arrange Tangent Segments and Curves
4. Check Conformance to Design StandardsSight DistanceSuperelevation

Horizontal Alignments for Training Project
The Training Project involves the design of five horizontal alignments:
One for FreewayFour for Ramps

Freeway Horizontal Alignment Design
Two below PIs are given in the training project for the training project:
English PI #1 X = 2710.80 ft, Y = 2077.69 ftPI #2 X = 4295.19 ft, Y = 2573.65 ft
or
Metric PI #1 X = 826.25 m, Y = 633.28 mPI #2 X = 1309.17 m, Y = 784.45 m
A and B control points in terms of direction must be considered so that the freeway horizontal alignment is consistent with alignments outside of the project.
Live Demo on how to design the horizontal alignment through trial and error efforts

Freeway Horizontal Alignment

Ramps Horizontal Alignment Design
A diamond interchange is proposed for the training project
Three below basic elements should be designed for each ramp:
Freeway-Ramp ConnectorRamp AlignmentRamp-Local Road Connector

Freeway-Ramp Connector Design
Freeway-Ramp Connectors should be designed based on Figure 504.2a, Figure 504.2b, and Figure 504.2C.
Figure 504.2a Advisory standard for single-lane ramp entrance. Figure 504.2b Advisory standard for single-lane ramp exit.Figure 504.2c Advisory standard for ramp location on a curve
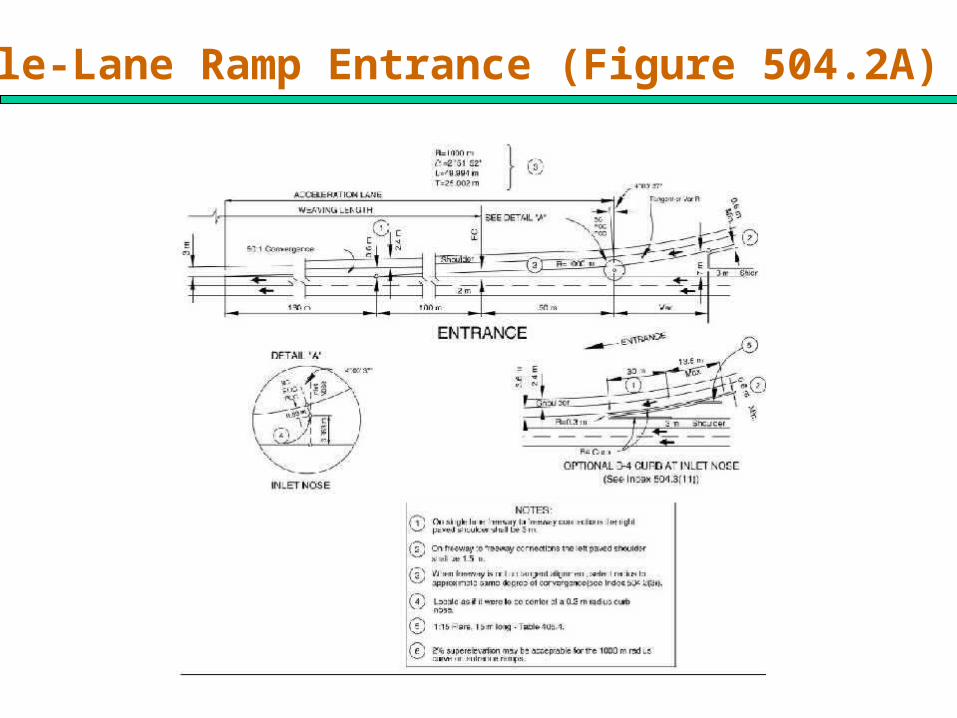
Single-Lane Ramp Entrance (Figure 504.2A)
Single-Lane Ramp Entrance (Figure 504.2A)
Discuss control points in the figure and clarify inlet nose, 2-m and 7-m points
When freeway is not on tangent alignment, select radius to approximate same degree of convergence.
Live Demo on how to obtain the control points using Microstation

Single-Lane Ramp Exit (Figure 504.2B)
Single-Lane Ramp Exit (Figure 504.2B)
Discuss control points in the figure and clarify exit nose, 2-m and 7-m points, and DL distance.
Minimum length between exit nose and end of ramp is 160 m for full stop at end of ramp
Live Demo on how to obtain the control points using Microstation

Ramp Location on a Curve (Figure 504.2C)
Ramp Location on a Curve (Figure 504.2C)
Standards shown in Figure 504.2C are for both ramp entrances and exits
Live Demo on how to draw the figure in Microstation
Ramp Alignment Design
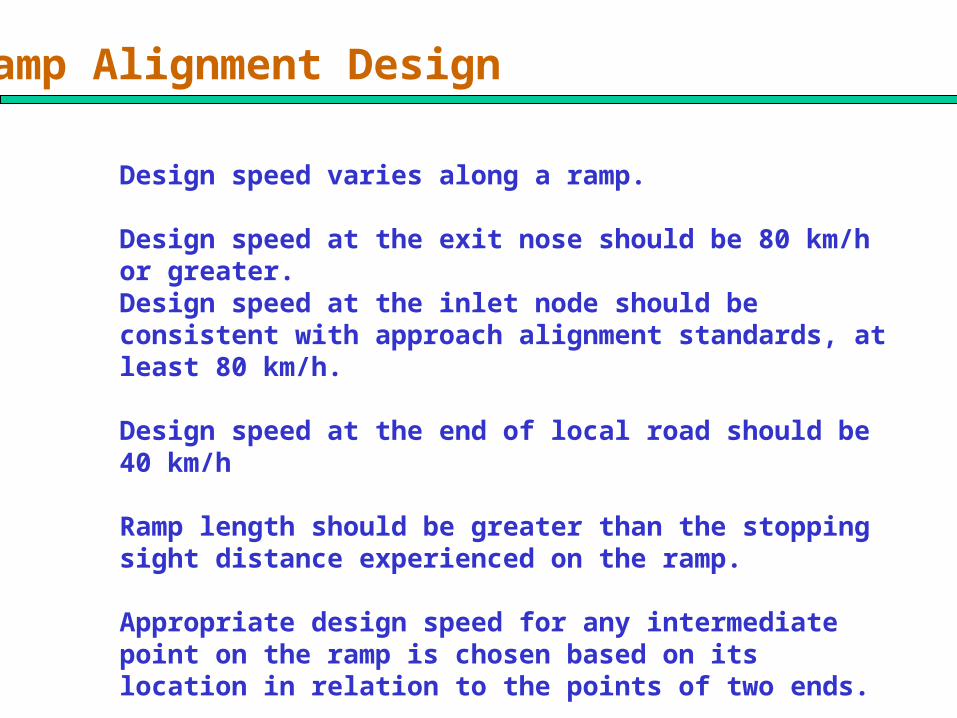
Design speed varies along a ramp.
Design speed at the exit nose should be 80 km/h or greater. Design speed at the inlet node should be consistent with approach alignment standards, at least 80 km/h.
Design speed at the end of local road should be 40 km/h
Ramp length should be greater than the stopping sight distance experienced on the ramp.
Appropriate design speed for any intermediate point on the ramp is chosen based on its location in relation to the points of two ends.

Ramp Widening
Ramps with curve radii of 90 m or less (outside ETW) and central angle greater than 60 degrees, the single lane ramp, and the lane furthest to the right should be widened in accordance with Table 504.3A below:
When do we need to widen ramps for trucks?
Ramp Radius (m) Widening (m) Lane Width (m)
<40 2.0 5.6 40-44 1.6 5.245-54 1.3 4.955-64 0.9 4.565-74 0.6 4.275-90 0.3 3.9>90 0 3.6

Ramp Length, Lane Drop, 1- or 2-lane Ramps
If the length of a single ramp exceeds 300 meters, an additional lane should be provided on the ramp to permit passing maneuvers.
If additional lanes are provided near all entrance ramp intersection, the lane drop should be 2/3 WV on the right.
When design year estimated volume exceeds 1500 equiv. pc/h, a 2-lane width of ramp should be provided initially.
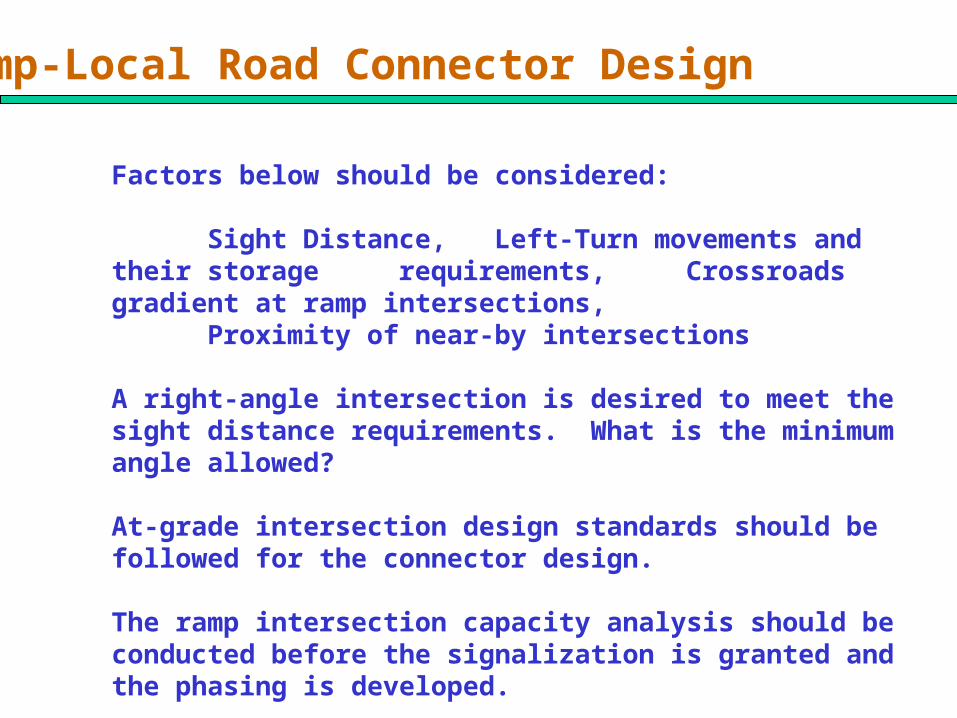
Ramp-Local Road Connector Design
Factors below should be considered:
Sight Distance, Left-Turn movements and their storage requirements, Crossroads gradient at ramp intersections,
Proximity of near-by intersections
A right-angle intersection is desired to meet the sight distance requirements. What is the minimum angle allowed?
At-grade intersection design standards should be followed for the connector design.
The ramp intersection capacity analysis should be conducted before the signalization is granted and the phasing is developed.

Angle of Intersection
Is the design OK?

Corner Sight Distance
Corner Sight Distance(Table 405.1 Page 400-9)
Design Speed CSD
40 90 50 110 60 130 70 150 80 170 90 190100 210110 230
CSD = 0.278 * Vmajor * 7.5 = 83.4 meters = 90 meters

Typical Connector Design

Ramp Setback
Where a separate right turn is provided at ramp terminals, no free turn due to concerns of pedestrians. 60 meters should be provided.
For left-turn maneuvers from an off-ramp at an unsignalized intersection, the length of crossroads open to view should be 0.278*V*7.5.
Ramp setback from an over-crossing structure follows Figure 504.3J.

Ramp Setback (Figure 504.3J)
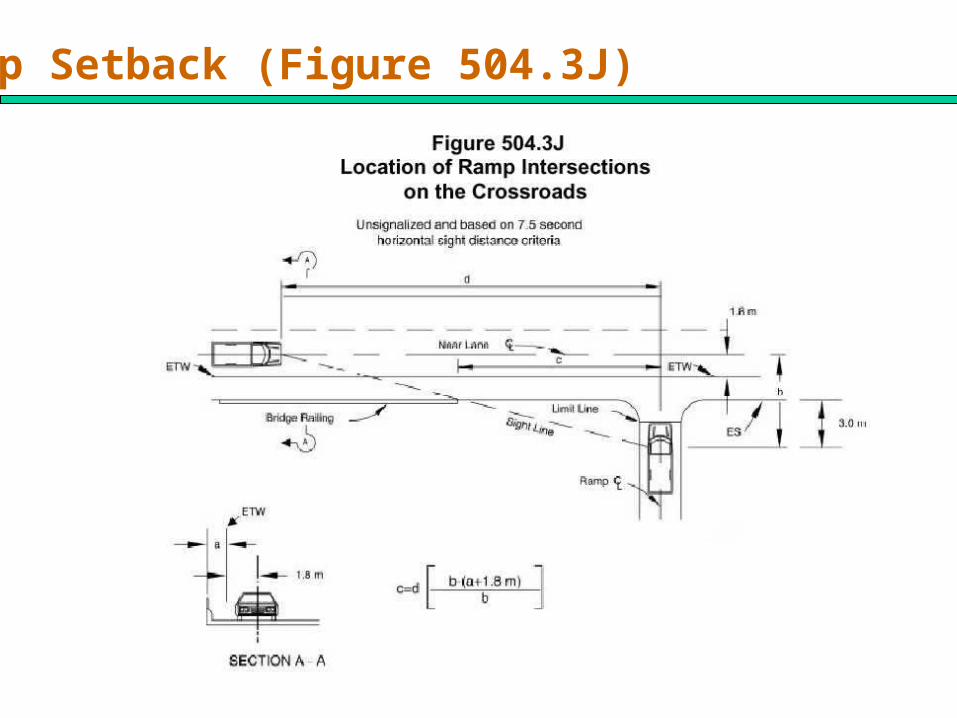
Ramp Setback (Figure 504.3J)

Ram Terminals and Local Intersections
The minimum distance (curb return to curb return) between ramps intersections and local intersections should be 125 meters, desirable 160 meters
When intersections are closely spaced., traffic operations should be applied to examine short weave and storage lengths and signal phasing.

Ramp Intersection Capacity Analysis

Eastbound Off-Ramp Design

Eastbound On-Ramp Design
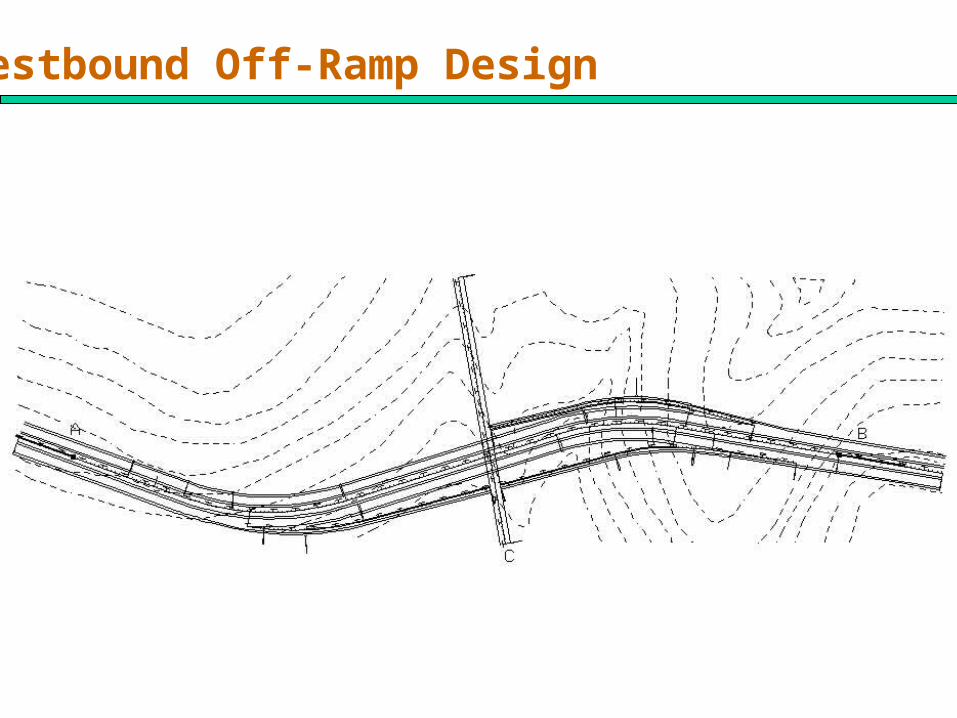
Westbound Off-Ramp Design

Westbound On-Ramp Design


