GAO United States General Accounting Office Report to Congressional Committees June 2000 HIGHWAY INFRASTRUCTURE FHWA’s Model for Estimating Highway Needs Is Generally Reasonable, Despite Limitations GAO/RCED-00-133
Transcript
GAOUnited States General Accounting Office
Report to Congressional Committees
June 2000 HIGHWAYINFRASTRUCTURE
FHWArsquos Model forEstimating HighwayNeeds Is GenerallyReasonable DespiteLimitations
GAORCED-00-133
Contents
Letter 3
Appendixes Appendix I Scope and Methodology 24
Appendix II Description of the HERS Model 26
Appendix III Results of Sensitivity Analyses Using theHERS Model 36
Appendix IV GAO Contacts and Staff Acknowledgments 38
Tables Table 1 Development of Highway Investment RequirementsReport and FHWArsquos Models 8
Table 2 The HERS Modelrsquos Estimates for Highways 13Table 3 Percentage Change in HERS Estimates Resulting From
Changes in Input Data 36
Figures Figure 1 FHWArsquos Projected Annual Highway and Bridge InvestmentRequirements 1998 through 2017 7
Figure 2 FHWArsquos Road Classification System 9Figure 3 Simplified Representation of the HERS Modeling Process 11Figure 4 Sensitivity of HERS Estimate to Changes in Certain
Assumptions 20Figure 5 Schematic of Process Used to Create HERS Data 28Figure 6 Simplified Representation of the Structure of the HERS
Model 31
Abbreviations
DOT Department of TransportationEPA Environmental Protection AgencyFHWA Federal Highway AdministrationGAO US General Accounting OfficeHERS Highway Economic Requirements SystemHPMS Highway Performance Monitoring SystemIRI International Roughness IndexPSR Present Servicability Rating
Page 1 GAORCED-00-133 FWHArsquos HERS Model
Page 2 GAORCED-00-133 FWHArsquos HERS Model
Page 3
United States General Accounting Office
Washington DC 20548
Page 3
Resources Community and
Economic Development Division
B-284060 Letter
June 5 2000
The Honorable Bob SmithChairmanThe Honorable Max S BaucusRanking Minority MemberCommittee on Environment and Public WorksUnited States Senate
The Honorable Bud ShusterChairmanThe Honorable James L OberstarRanking Democratic MemberCommittee on Transportation and InfrastructureHouse of Representatives
Transportation systems play a vital role in the nationrsquos economy byfacilitating the movement of people and goods The United States has madesignificant investments in its transportation infrastructure Effectivemanagement of this infrastructure depends in part on reliable methods forestimating the amount of continuing investment required for maintainingand improving the transportation system In this context the Congress hasrequired the Department of Transportation (DOT) to report every 2 yearson the nationrsquos need for investment to maintain and improve the nationrsquoshighways and bridgesTo help estimate these future investmentrequirements the Departmentrsquos Federal Highway Administration (FHWA)uses the Highway Economic Requirements System (HERS) computermodel
The Transportation Equity Act for the 21st Century (PL 105-178) directedGAO to evaluate and report to the Congress how the Department ofTransportation determines highway investment requirements using theHERS model Accordingly this report describes (1) the methodology themodel uses to generate its estimates of the nationrsquos highway investmentrequirements (2) the strengths and limitations of the model and (3) theusefulness of the HERS estimates for deciding on federal investments inhighway infrastructure In reporting on investment requirements DOTincludes estimates for highways bridges and transit systems This reportfocuses on highway investment requirements and the HERS modelrsquosportion of these requirements We used a draft of DOTrsquos latest Conditions
GAORCED-00-133 FWHArsquos HERS ModelGAORCED-00-133 FWHArsquos HERS Model
B-284060
and Performance Report dated January 10 2000 as the source of DOTrsquosestimated investment requirements for highways DOT approved thisreport for issuance on May 2 2000 without changes to this material Wereviewed the modelrsquos documentation and interviewed its developers andoperators evaluated the model using general economic standards formodels of this type interviewed experts in transportation modeling toobtain their views and interviewed legislative and executive branchofficials who use the model and its results See appendix I for moreinformation on the methodology we used and a list of the transportationmodeling experts we contacted
Results in Brief The HERS computer model estimates investment requirements for thenationrsquos highways by adding together the costs of highway improvementsthat the modelrsquos benefit-cost analyses indicate are warranted In making itsestimates the model relies on extensive data on highway segmentsthroughout the nation such as pavement conditions and expected growthin traffic which the states primarily collect and update The model alsouses information such as vehicle operating costs and emissions obtainedfrom other sources The HERS model uses the data to (1) project the futurecondition and performance of the highway system (2) assess whether anyhighway improvements are warranted and (3) select and implementappropriate improvements Such improvements range from resurfacing ahighway to adding lanes and are based on a comparison of the constructioncosts and the lifetime benefits of the improvement Adding a lane to relieveprojected congestion for example has benefits because the increasedcapacity can reduce travel time and vehicle operating costs FHWA uses theHERS model to estimate highway infrastructure improvement costs forcertain highways under several different scenarios For example under anldquoeconomic efficiencyrdquo scenario the HERS model estimates that for thesehighways the cost of constructing improvements for which the estimatedbenefits exceed the construction costs would be about $48 billion per year(1997 dollars) out of FHWArsquos overall estimate of $94 billion in investmentrequirements for all roads and bridges Similarly under a ldquomaintain currentconditionsrdquo scenario the HERS model estimates that for these highwaysthe least costly mix of improvements that would maintain the pavementcondition of the highways at current levels (1997) would be about$29 billion per year out of FHWArsquos overall estimate of $57 billion ininvestment requirements for all roads and bridges
The HERS model has several strengths that make it a unique andreasonable tool for estimating a general level of national highway
Page 4 GAORCED-00-133 FWHArsquos HERS Model
B-284060
investment requirements but it also has some limitations that affect theprecision of its results A major strength of the model is its ability to assessthe relative benefits and costs associated with alternative options forimproving the nationrsquos highway infrastructure This is a significantimprovement over FHWArsquos previous method which used engineeringstandards to identify highway deficiencies and estimated the cost ofcorrecting these deficiencies without regard to economic merit In June1999 the HERS model was reviewed by an expert panel which found thatFHWA has strengthened the model over time The model has limitationshowever in that it (1) does not completely account for the effect ofhighway improvements on all other highways and modes of transportation(2) does not fully account for the uncertainties associated with its methodsdata and assumptions (3) relies on a computational ldquoshortcutrdquo toapproximate the future lifetime benefits of an improvement and (4) usesdata that vary in quality The overall effect of these limitations on the HERSestimates cannot be determined however they indicate a level ofimprecision with the estimates Although FHWA plans to improve themodel by addressing the limitations in the computational shortcut and thedata transportation modeling experts generally agree that a more completeaccounting of the interrelationships between all highways andtransportation modes cannot be done with the current state of the art intransportation modeling In addition changing the model to account for theuncertainties in its methods data and assumptions would be costly
HERS estimates can be useful as a general guide for the investmentrequirements of the nationrsquos highways included in the model such as ruraland urban interstates and for assessing relative investment requirementsover time Nevertheless the limitations and inherent uncertaintiesassociated with making forecasts prevent the estimates from being aprecise forecast of highway investment requirements FHWA includes theHERS estimates in its current report on the conditions and performance ofthe nationrsquos highways bridges and transit systems In the report howeverFHWA does not clearly disclose the level of uncertainties in the HERSestimates Furthermore to derive a total estimate of highway investmentrequirements FHWA combines the HERS estimates with estimates forother types of highways and investments that are not based on benefit-costanalyses As a result the reportrsquos readers are not likely to be aware of theimprecision of the HERS estimates and the fact that only part of the totalhighway investment requirements is estimated on the basis of anassessment of the benefits and costs of alternative improvement options
Page 5 GAORCED-00-133 FWHArsquos HERS Model
B-284060
This report makes recommendations to improve the modelrsquosapproximation of the future lifetime benefits of highway improvements andFHWArsquos disclosure of some of the uncertainties associated with the modelrsquosestimates in its report to the Congress DOT generally agreed with theserecommendations
Background DOT submits biennial reports to the Congress detailing the state of thenationrsquos highways bridges and other surface transportation systems TheConditions and Performance Report to Congress known as the CampPReport fulfills the mandate1 for a report on future highway investmentrequirements that the Congress first established in 1965 The reportsinclude forecasts of investment requirements for the nationrsquos highways andbridges over the following 20 years
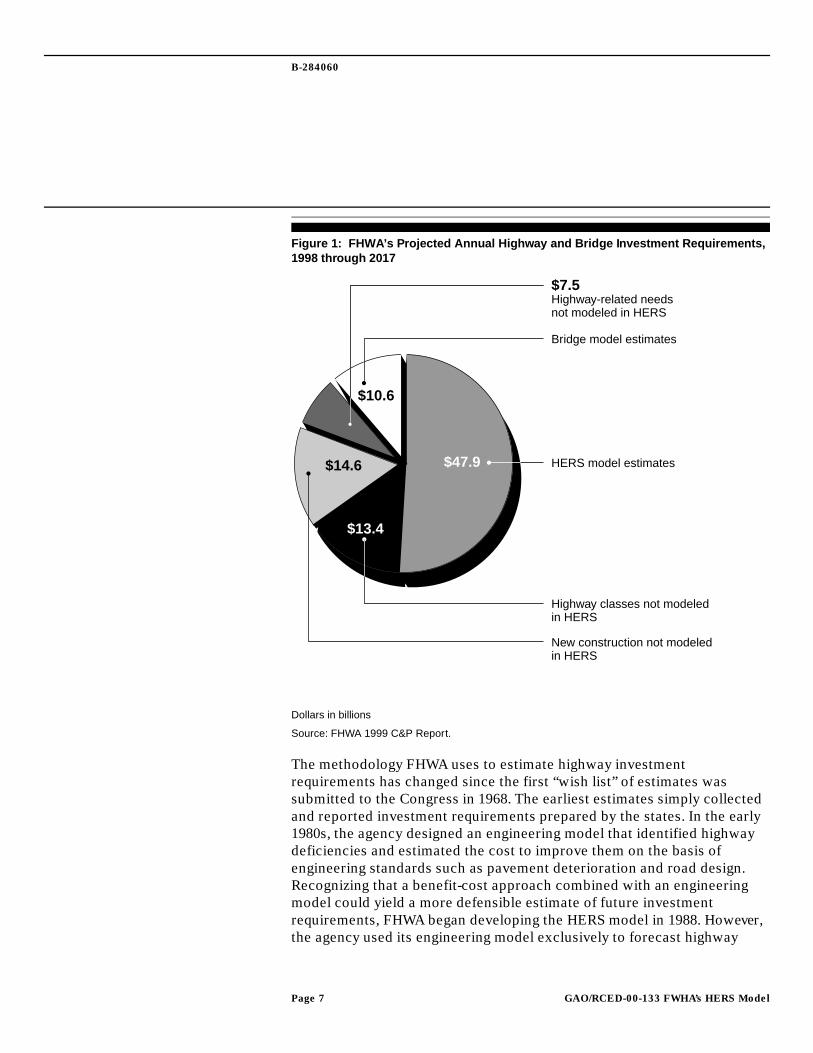
FHWArsquos estimates of total highway and bridge investment requirements inthe CampP Report combine estimates derived from the HERS model a bridgemodel and other types of estimates The HERS model uses benefit-costanalyses to estimate future highway investment requirements on the basisof information about existing highways On the other hand the bridgemodel is based on engineering data and does not currently use benefit-costanalyses in estimating investment requirements for bridges In additionFHWA supplements these two estimates by including the cost of improvingthose highways not modeled in HERS These costs include estimates fornew highways highway classes not included in the HERS model andhighway-related requirements such as safety enhancements trafficoperation improvements and environmental improvements FHWAestimates these costs by assuming that they represent a fixed percentage ofthe combined HERS and bridge modelsrsquo estimate of investmentrequirements The percentages are based on data from 1997 highwayexpenditures Of the total highway and bridge average annual investmentrequirements identified in the CampP Report ($94 billion) only 51 percent arederived using the HERS model and its benefit-cost analyses The remaining49 percent are derived using either the bridge model or the fixed-percentage procedure See figure 1
1 See 23 USC section 502(g) and 49 USC section 308(e)
Page 6 GAORCED-00-133 FWHArsquos HERS Model
B-284060
Figure 1 FHWArsquos Projected Annual Highway and Bridge Investment Requirements1998 through 2017
Dollars in billions
Source FHWA 1999 CampP Report
The methodology FHWA uses to estimate highway investmentrequirements has changed since the first ldquowish listrdquo of estimates wassubmitted to the Congress in 1968 The earliest estimates simply collectedand reported investment requirements prepared by the states In the early1980s the agency designed an engineering model that identified highwaydeficiencies and estimated the cost to improve them on the basis ofengineering standards such as pavement deterioration and road designRecognizing that a benefit-cost approach combined with an engineeringmodel could yield a more defensible estimate of future investmentrequirements FHWA began developing the HERS model in 1988 Howeverthe agency used its engineering model exclusively to forecast highway
$479 bull HERS model estimates
$134bull
Highway classes not modeledin HERS
$146bull
New construction not modeled in HERS
$75Highway-related needs not modeled in HERS
$106
Bridge model estimates
bull
bull
Page 7 GAORCED-00-133 FWHArsquos HERS Model
B-284060
investment requirements until the 1995 CampP Report This reportincorporated one estimate based on HERS benefit-cost analyses and asecond estimate based on the engineering model approach Table 1 outlinesFHWArsquos efforts to estimate highway investment requirements According toFHWA officials the HERS benefit-cost approach complies with anexecutive order2 that requires federal spending for infrastructure to bebased on a systematic analysis of expected benefits and costs
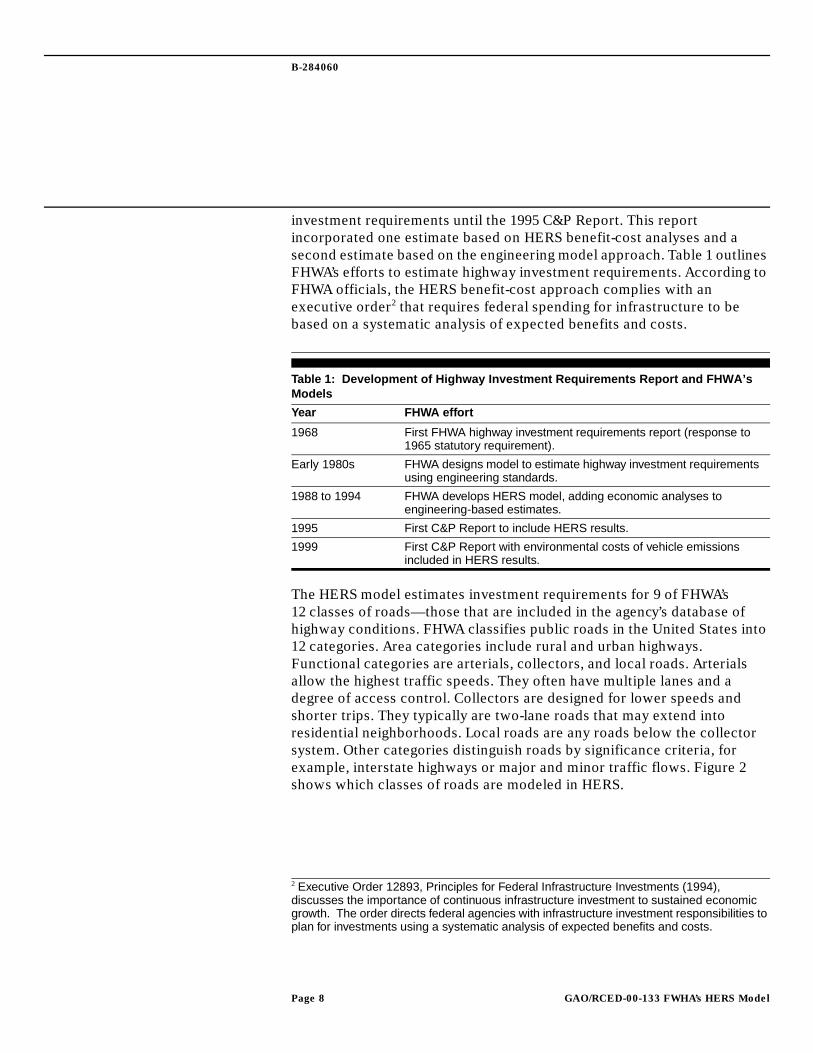
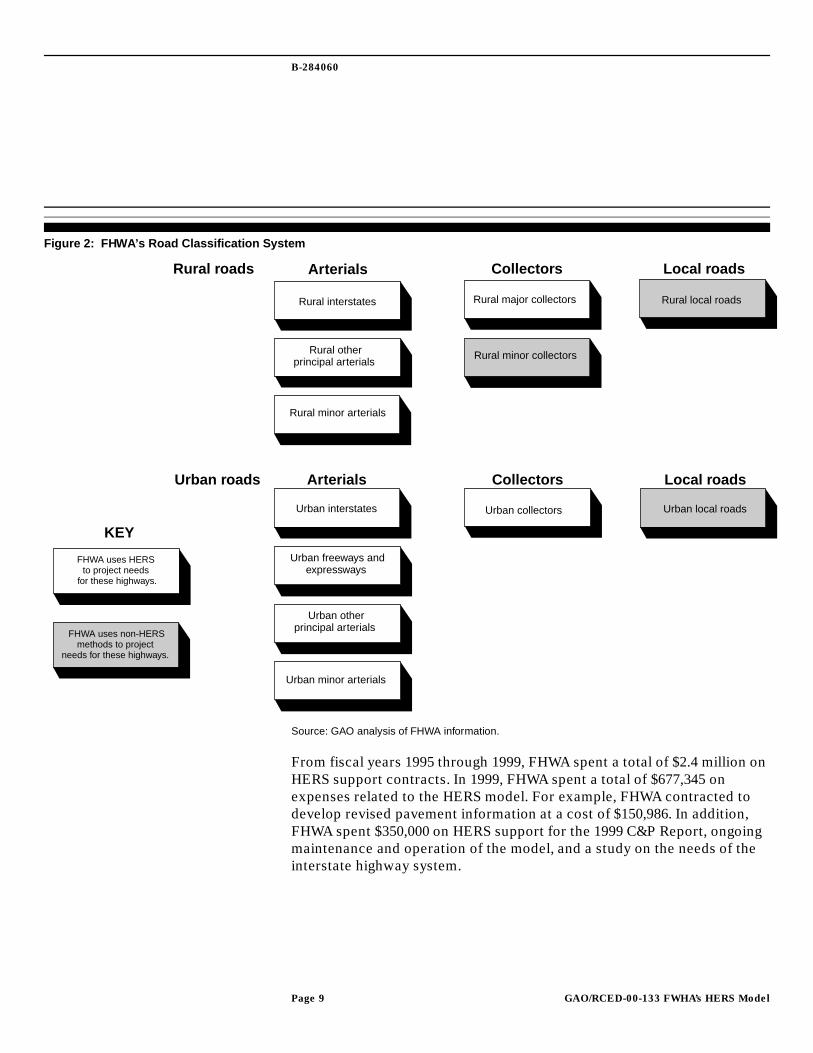
The HERS model estimates investment requirements for 9 of FHWArsquos12 classes of roadsmdashthose that are included in the agencyrsquos database ofhighway conditions FHWA classifies public roads in the United States into12 categories Area categories include rural and urban highwaysFunctional categories are arterials collectors and local roads Arterialsallow the highest traffic speeds They often have multiple lanes and adegree of access control Collectors are designed for lower speeds andshorter trips They typically are two-lane roads that may extend intoresidential neighborhoods Local roads are any roads below the collectorsystem Other categories distinguish roads by significance criteria forexample interstate highways or major and minor traffic flows Figure 2shows which classes of roads are modeled in HERS
2 Executive Order 12893 Principles for Federal Infrastructure Investments (1994)discusses the importance of continuous infrastructure investment to sustained economicgrowth The order directs federal agencies with infrastructure investment responsibilities toplan for investments using a systematic analysis of expected benefits and costs
Table 1 Development of Highway Investment Requirements Report and FHWArsquosModels
Early 1980s FHWA designs model to estimate highway investment requirementsusing engineering standards
1988 to 1994 FHWA develops HERS model adding economic analyses toengineering-based estimates
1995 First CampP Report to include HERS results
1999 First CampP Report with environmental costs of vehicle emissionsincluded in HERS results
Page 8 GAORCED-00-133 FWHArsquos HERS Model
B-284060
Figure 2 FHWArsquos Road Classification System
Source GAO analysis of FHWA information
From fiscal years 1995 through 1999 FHWA spent a total of $24 million onHERS support contracts In 1999 FHWA spent a total of $677345 onexpenses related to the HERS model For example FHWA contracted todevelop revised pavement information at a cost of $150986 In additionFHWA spent $350000 on HERS support for the 1999 CampP Report ongoingmaintenance and operation of the model and a study on the needs of theinterstate highway system
Rural interstates
Rural otherprincipal arterials
Rural minor arterials
Rural major collectors
Rural minor collectors
Rural local roads
Urban interstates
Urban freeways andexpressways
Urban otherprincipal arterials
Urban minor arterials
Urban collectors Urban local roads
Rural roads
Urban roads
Arterials Collectors
Arterials Collectors
Local roads
Local roads
FHWA uses HERS to project needs
for these highways
FHWA uses non-HERSmethods to project
needs for these highways
KEY
Page 9 GAORCED-00-133 FWHArsquos HERS Model
B-284060
The HERS Model UsesBenefit-Cost Analysesto Estimate HighwayInvestmentRequirements
To estimate future investment requirements3 the HERS model uses anextensive set of data on segments of highways throughout the nation toconduct benefit-cost analyses The HERS model uses these data to forecastthe condition and performance (congestion) of the highway segments overthe following 20 years and to evaluate whether improving the segments iseconomically justified The HERS model evaluates potential improvementson each segment by comparing their construction costs with their benefitsincluding reductions in travel times vehicle operating costs and accidentsto determine whether an improvement is warranted FHWA uses the HERSmodel to estimate highway investment requirements under severaldifferent scenarios
The HERS Model Relies onExtensive Data
To estimate investment requirements the HERS model uses a database ofinformation about highway conditions and performance submitted by thestates Using guidance developed by FHWA each state collects andannually updates data on a sample of highways representing nine highwayclasses These data include factors like highway capacity average annualdaily traffic pavement roughness and lane width In total the states collectand report to FHWA information on about 125000 highway segmentsranging in length from one block to 10 miles The states also developforecasts of traffic growth on each segment The HERS model usesldquoexpansionrdquo factors to generalize the estimated improvement costs forsegments to the highway classes they represent
In addition to the state-collected data the HERS model uses otherinformation that FHWA derives from various economic studies Forexample in estimating the benefits associated with highwayimprovements the HERS model counts as a benefit any reduction in traveltime brought about by the highway improvement In making thiscalculation FHWA uses hourly compensation data from the Department ofCommercersquos Bureau of Labor Statistics to quantify the dollar value of traveltime saved by travelers on work-related trips In addition as currentlymodeled in HERS highway improvements increase net traffic and hencetotal vehicle emissions As a result the HERS model subtracts the dollarvalue of the air pollution damages caused by vehicle emissions from the
3 In using ldquoinvestment requirementsrdquo we are referring to the HERS modelrsquos estimates ofaverage annual infrastructure improvement costs for the nine highway classes included inthe model
Page 10 GAORCED-00-133 FWHArsquos HERS Model
B-284060
benefits of making an improvement FHWA obtains emissions data forseveral classes of vehicles from the Environmental Protection Agency(EPA) FHWA also obtains dollar estimates from the economic literaturefor the human health and property damages caused by specific pollutants
The HERS Model Evaluatesthe Relative Benefits andCosts of AlternativeImprovement Options
The HERS model simulates the effects of infrastructure improvements forthe highways it models by comparing the relative benefits and costsassociated with alternative improvement options4 The HERS model beginsby assessing the current condition of the highway segments in the datasample The model then projects the future condition and performance ofthe segments based on expected changes in factors such as trafficpavement condition and average speed Performance is measured in termsof highway congestion The model makes its projections in four 5-yearincrements (funding periods) for a total of 20 years
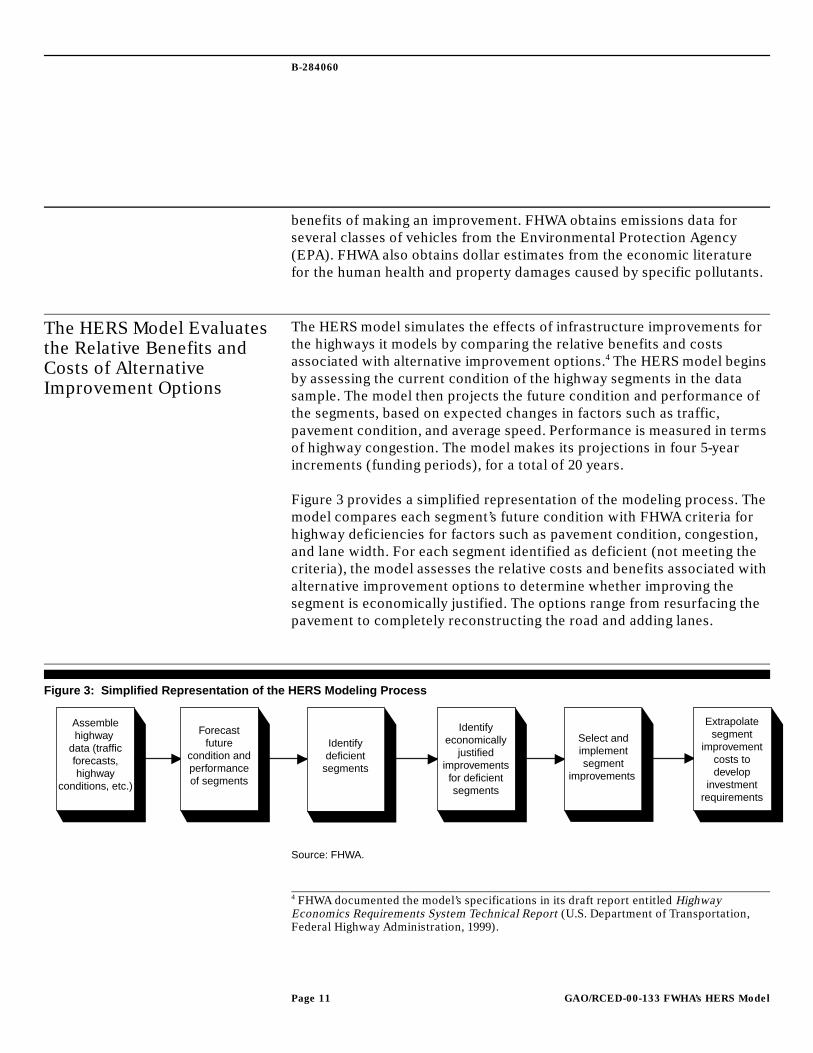
Figure 3 provides a simplified representation of the modeling process Themodel compares each segmentrsquos future condition with FHWA criteria forhighway deficiencies for factors such as pavement condition congestionand lane width For each segment identified as deficient (not meeting thecriteria) the model assesses the relative costs and benefits associated withalternative improvement options to determine whether improving thesegment is economically justified The options range from resurfacing thepavement to completely reconstructing the road and adding lanes
Figure 3 Simplified Representation of the HERS Modeling Process
Source FHWA
4 FHWA documented the modelrsquos specifications in its draft report entitled HighwayEconomics Requirements System Technical Report (US Department of TransportationFederal Highway Administration 1999)
Identifydeficient
segments
Assemble highway
data (traffic forecastshighway
conditions etc)
Forecast future
condition and performance of segments
Identify economically
justified improvements for deficient segments
Select and implement segment
improvements
Extrapolate segment
improvementcosts todevelop
investment requirements
Page 11 GAORCED-00-133 FWHArsquos HERS Model
B-284060
The HERS model calculates costs as the capital expenditures required toconstruct the improvement and calculates the benefits as reductions infactors like travel time vehicle operating costs and accidents over thelifetime of the improvement For example adding lanes in congested areascan be beneficial because the increased capacity can reduce travel timesand operating costs5 Future benefits are discounted to the present6 TheHERS model selects for implementation those improvements that areeconomically justified including those improvements for which theestimated benefits exceed the cost of constructing the improvement(positive net benefits) To estimate the investment requirements for thehighways it models the HERS model uses ldquoexpansionrdquo factors to generalizesegment improvement costs to the nine highway classes included in themodel The expansion factors enable the HERS model to relate informationabout the sampled segments to the highway classes they representInvestment requirements for the combined highway classes are obtained byadding together the estimates for the nine different classes Appendix IIdescribes the structure of the HERS model
The HERS Model EstimatesHighway InvestmentRequirements for SeveralDifferent Scenarios
FHWA uses the HERS model to forecast the investment requirements forthe highways represented in the model on the basis of several differentscenarios For example under the ldquoeconomic efficiencyrdquo scenario theHERS model selects for implementation those improvements that havepositive net benefits (benefits minus costs) The investment requirementsunder this scenario are about $48 billion per year from 1998 through 2017Similarly under the cost to ldquomaintain current (pavement) conditionsrdquoscenario the HERS model selects for implementation the least costly mixof improvements that would maintain average pavement conditions at 1997levels over the forecast period Under this scenario the investmentrequirements are about $29 billion per year In addition to these scenariosFHWA estimates the investment requirements for maintaining current
5 The HERS model also uses ldquoprice elasticityrdquo to assess the behavioral response of drivers tochanges in the cost of traveling on the highway Price elasticity mitigates to some extent thebeneficial aspect of making highway improvements For example because improving asegment lowers travel costs some drivers may respond by driving more frequently As aresult traffic on the improved segment may increase more quickly than anticipatedreducing the future benefits of the improvement
6 Discounting accounts for the fact that in general one dollar today is worth more than onedollar a year from now
Page 12 GAORCED-00-133 FWHArsquos HERS Model
B-284060
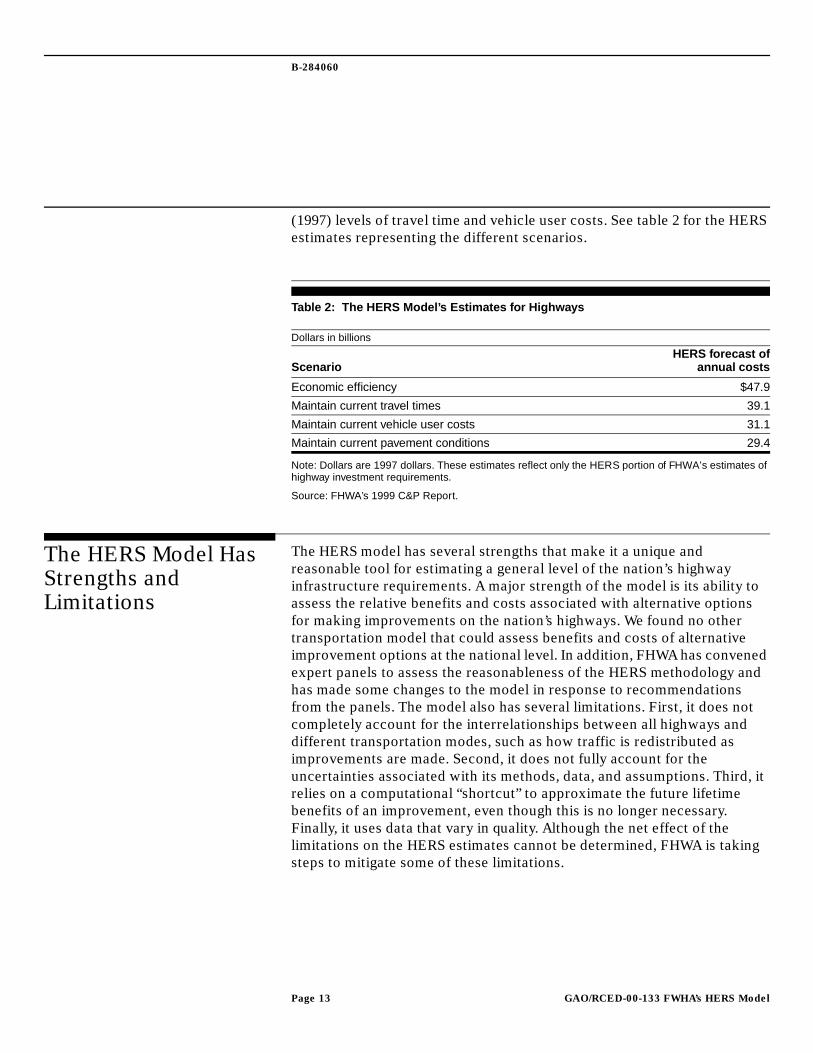
(1997) levels of travel time and vehicle user costs See table 2 for the HERSestimates representing the different scenarios
Table 2 The HERS Modelrsquos Estimates for Highways
Note Dollars are 1997 dollars These estimates reflect only the HERS portion of FHWArsquos estimates ofhighway investment requirements
Source FHWArsquos 1999 CampP Report
The HERS Model HasStrengths andLimitations
The HERS model has several strengths that make it a unique andreasonable tool for estimating a general level of the nationrsquos highwayinfrastructure requirements A major strength of the model is its ability toassess the relative benefits and costs associated with alternative optionsfor making improvements on the nationrsquos highways We found no othertransportation model that could assess benefits and costs of alternativeimprovement options at the national level In addition FHWA has convenedexpert panels to assess the reasonableness of the HERS methodology andhas made some changes to the model in response to recommendationsfrom the panels The model also has several limitations First it does notcompletely account for the interrelationships between all highways anddifferent transportation modes such as how traffic is redistributed asimprovements are made Second it does not fully account for theuncertainties associated with its methods data and assumptions Third itrelies on a computational ldquoshortcutrdquo to approximate the future lifetimebenefits of an improvement even though this is no longer necessaryFinally it uses data that vary in quality Although the net effect of thelimitations on the HERS estimates cannot be determined FHWA is takingsteps to mitigate some of these limitations
Dollars in billions
ScenarioHERS forecast of
annual costs
Economic efficiency $479
Maintain current travel times 391
Maintain current vehicle user costs 311
Maintain current pavement conditions 294
Page 13 GAORCED-00-133 FWHArsquos HERS Model
B-284060
The HERS Modelrsquos MajorStrength Is Its Applicationof Benefit-Cost Analyses inAssessing HighwayInvestments
The HERS modelrsquos major strength is its ability to assess the relativebenefits and costs associated with potential improvements in the nationrsquoshighways This is a significant improvement over FHWArsquos previousmethods which used engineering standards to identify deficiencies andselect improvements without regard to economic merit By contrast theHERS model selects for implementation only those improvements that areeconomically justified We found no model other than HERS that is capableof applying benefit-cost analyses in estimating investment requirements ata national level For example the World Bankrsquos Highway Design andMaintenance Standards model is designed to be used at the project level Inaddition a model known as StratBENCOST uses benefit-cost analyses toevaluate state and local highway projects7
Another strength of the HERS model is that FHWA has consulted withexperts in order to assess the modelrsquos reasonableness and improve it Forexample in June 1999 FHWA convened an expert panel consisting ofeconomists and engineers from the public and private sectors This panelfound that FHWA has strengthened the model over time and that the recentrefinements have increased its applicability and credibility
FHWA has also instituted several procedures to make the state-provideddata for the HERS model as reasonable as possible For example FHWAperiodically conducts workshops to inform state transportation officialsabout changes to the database used by the HERS model and FHWA staffare available to conduct additional training at the statesrsquo request Inaddition FHWA recently completed reassessing its database needs toeliminate unnecessary data items and reduce the statesrsquo data collectionburden Changes as a result of this reassessment became effective in 1999and the states will submit data reflecting these changes to FHWA in June2000 As a result of the reassessment FHWA identified the potential forreducing the number of sampled segments in the database to 80000 fromits current level of about 125000
The HERS Model Has SomeLimitations
Although the HERS model is a reasonable tool we noted that it has severallimitations First because the model analyzes each highway segmentindependently rather than the entire transportation system (collectively
7 StratBENCOST was developed by HLB Decision Economics Inc for the NationalCooperative Highway Research Program
Page 14 GAORCED-00-133 FWHArsquos HERS Model
B-284060
referred to as a network) it cannot completely reflect changes occurringamong all highways and modes in the transportation network at the sametime For example the HERS model does not capture the effect on trafficlevels of improving one highway segment while leaving neighboringsegments unimproved The HERS model incorporates information on howchanges in costs to users of vehicles affect the demand for travel (via ldquopriceelasticityrdquo) As a result FHWA officials assume that the HERS modelcaptures the net effect of all changes in the transportation network as wellas the overall economy However we did not find consensus among thetransportation modeling experts we interviewed that the HERS modelcompletely captures the net effect of all changes in the network Theimplication of this limitation is unclearmdashit may over- or under-estimate theeffect of changes in traffic resulting from a highway improvementNonetheless transportation modeling experts we talked to generally agreethat explicitly modeling the entire transportation network is not possiblewith the current state of the art in modeling or available data
Second because the HERS model is not designed to completely quantifythe uncertainties associated with its methods assumptions and data themodel cannot estimate the full range of uncertainties within which itsestimates vary As a result the precision of the modelrsquos estimates isunknown In making its estimates the HERS model relies on a variety ofestimating techniques and hundreds of variables all of which are subject tosome uncertainties Executive Order 12893 states that federal agencies inevaluating infrastructure investments should address uncertainty whenthe amount and timing of important benefits and costs are uncertain Forits CampP Report FHWA accounted for some uncertainties by conductingldquosensitivity analysesrdquo to measure how much the HERS estimates changewhen the value of certain key inputs or assumptions used in the model arechanged Nevertheless the sensitivity analyses do not account for all theuncertainties in the model We discussed this issue with one of the HERSmodelrsquos developers who indicated that according to his understanding ofthe model the uncertainty associated with the ldquosingle pointrdquo estimatescould range up to plus or minus 30 percent However changing the modelto fully account for uncertainties in its factors is not likely to be cost-effective because it could require extensive and expensive reprogramming
Third the HERS model uses a computational shortcut to approximate thelifetime benefits associated with an improvement Benefits and costsshould be measured over each improvementrsquos full lifetime 20 years ormore However in its initial evaluation of whether to improve a highwaysegment the HERS model calculates benefits such as reductions in travel
Page 15 GAORCED-00-133 FWHArsquos HERS Model
B-284060
time only during the first 5-year period To account for the benefitsaccruing after the first 5 years FHWA developed a shortcut that essentiallyuses an estimate of the improvementrsquos construction cost as a proxy for theimprovementrsquos remaining future benefits8 FHWA developed the shortcutseveral years ago when limitations in computer processing powernecessitated simplifying some of the calculations Several of thetransportation modeling experts we talked to question whether these costsare a reasonable approximation of future benefits Ideally the modelshould estimate the benefits associated with an improvement over its fulllifetime discounted to the present FHWA officials acknowledged that theshortcut is a limitation that is no longer necessary given recentimprovements in computer processing power
Fourth although FHWA has taken steps to ensure that the data used in theHERS model are reasonable some of these data vary in quality Forexample the HERS model relies on emissions data that some members ofFHWArsquos 1999 expert panel consider unrepresentative of actual conditionsTo estimate the emissions associated with traffic on a given segment themodel uses information from EPA on emissions rates per vehicle type andspeed Vehicle emissions however may depend more on how the vehicle isdriven than on the total miles driven FHWA officials told us they recognizethat the emissions data may not reflect actual conditions but included thedata to approximate the environmental effect of highway travel EPA iscurrently revising these emissions data
In addition we reported earlier that the pavement roughness data reportedby the states to FHWA are not comparable partly because the states usedifferent devices to measure roughness9 The HERS model uses theroughness data in projecting the pavement condition of each segmentMoreover some of the information used in the model is dated Forexample the pavement resurfacing costs used in the HERS model arebased on 1988 data (adjusted for inflation from 1988 to 1997)
Finally to project the future condition of the pavement the HERS modeluses information that does not fully capture the range of environmental
8 With this shortcut the HERS model assumes that the remaining future benefits of animprovement can be approximated by the costs that would be avoided by making theimprovement in the current 5-year period See appendix II for more information
9 Transportation Infrastructure Better Data Needed to Rate the Nationrsquos HighwayConditions (GAORCED-99-264 September 27 1999)
Page 16 GAORCED-00-133 FWHArsquos HERS Model
B-284060
conditions affecting the nationrsquos highways10 To account for the effect ofclimate on pavement condition for instance the model assumes allsegments face freezing and thawing conditions However segments inwarm and drier areas of the country rarely face freezing or thawingconditions and FHWA officials acknowledged that the pavementinformation does not completely account for these conditions Althoughthe effect of the variability in the quality of the data has not beendetermined it reduces confidence in the overall precision of the HERSestimates
FHWA Plans to Improve theHERS Model
FHWA recognizes that the HERS model has some limitations and is takingsteps to improve it For example FHWA officials said they plan to revisethe emissions data used in the HERS model as soon as EPA finishesrevising its emissions model In addition FHWA plans to update thepavement resurfacing costs currently based on 1988 data to represent1998 or 1999 costs FHWA also has contracted with one of the modelrsquosdevelopers to incorporate varied pavement performance information basedon different climate zones throughout the country instead of assuming oneclimate as is now done FHWA officials also expressed interest in revisingthe model to eliminate the computational shortcut used to approximatebenefits They said that as of March 2000 FHWA has not yet contracted tomake this improvement Furthermore beginning this fiscal year they planto modify the HERS model to incorporate the effects of user fees such asmotor fuel taxes into the modelrsquos assessment of the benefits and costs ofalternative highway improvements
In addition FHWA is currently developing a state-level ldquoprototyperdquo of theHERS model in order to provide the states with the ability to forecast state-level highway investment requirements FHWA is incorporating into themodel selected features from customized versions of the HERS modeldeveloped for transportation officials in Indiana and Oregon by a privatecontractor After the development of the state-level prototype is completeFHWA will provide the model to a limited number of states as part of a pilotprogram to determine the usefulness of the model for state-level highwayplanning
10 HERS uses a pavement deterioration ldquosubmodelrdquo to forecast pavement condition Seeappendix II
Page 17 GAORCED-00-133 FWHArsquos HERS Model
B-284060
HERS Estimates CanBe a Useful Tool to AidDecisionmaking butHave Limits
HERS estimates are useful as a general guide for the investmentrequirements of the nine highway classes represented in the model Inaddition the HERS estimates developed for the ldquoeconomic efficiencyrdquoscenario can be useful for assessing the relative requirements of thehighway classes over time Congressional and federal agency officials toldus they use the estimates as an overall indicator of highway needsHowever the limitations and inherent uncertainties associated withmaking forecasts prevent these estimates from being a precise forecast ofinvestment requirements In addition because the current version of theHERS model was designed to estimate investment requirements at thenational level the estimates derived from this model should not be used toproject investment needs for particular highway projects Finally aspresented in the 1999 CampP Report the uncertainties associated with theHERS estimates are not highlighted and the HERS estimates are combinedwith other estimates that are not based on an assessment of the relativebenefits and costs of alternative improvement options
HERS Estimates Are Usefulas a General Guide forInvestment Requirements
In general the HERS estimates provide legislative and executive branchofficials one source of information to use for decisionmaking Legislativeand executive branch officials told us that they use the estimates in theCampP Report to obtain general information on the nationrsquos need forinfrastructure investments Legislative branch officials told us that HERSestimates are more useful than previous estimates that were based onengineering analyses alone Furthermore different groups may use theHERS estimates in funding debates For example according to an FHWAofficial construction industry interests could use the higher investmentscenario estimate to show legislators a need for a higher level of highwayfunding
In addition to serving as a general guide the HERS estimates for theeconomic efficiency scenario can be useful in assessing the relativeinvestment requirements over time for the nine highway classesrepresented in the model Adjusting for inflation and changes in the modelrsquosformulas assumptions and data between reports the HERS estimatesfrom different reports can be compared to assess whether investmentrequirements are increasing decreasing or remaining the same Forexample using data developed for the 1995 CampP Report and the currentCampP Report FHWA found that the average annual highway investmentrequirements increased slightly from $461 billion to $479 billion (1997dollars)
Page 18 GAORCED-00-133 FWHArsquos HERS Model
B-284060
Although the HERS model provides a general estimate of the highwayinvestment requirements in our view it is important that the model not beused for other than its intended purpose First while some federal officialshave expressed an interest in using the HERS model to determine whichhighway projects should receive funding the current version of the HERSmodel was developed to estimate investment requirements nationwide Asa result the estimated investment requirements generated by the HERSmodel should not be used for project-level estimates
Second federal decisionmakers we spoke with expressed an interest inretrospectively comparing actual highway investments by the states withthose forecast by the HERS model This comparison could be misleadingbecause states may base their highway improvement decisions on criteriaother than those used in the HERS model For example under theeconomic efficiency scenario the model implements only thoseimprovements that are economically justified (that have positive netbenefits) However some states may fund highway improvements thatwould not pass the same economic test For example states may improve ahighway in an economically disadvantaged area in an attempt to fostereconomic development
Third although comparing the HERS estimates developed for theeconomic efficiency scenario in successive CampP Reports can be usefulmaking the same comparison using the HERS estimates for the maintaincurrent conditions scenario could be misleading Currently the data usedby the HERS model to establish the current condition of the highwaysystem are updated every year Because the HERS model uses the currentcondition of the highway system as a ldquobaselinerdquo in projecting futureinvestment requirements the HERS estimates for the maintain currentconditions scenario can be influenced by the prior level of state spendingFor example if state spending on highway improvements declines relativeto estimated investment requirements the condition of the highway systemmight also decline The subsequent HERS projection would be based on anew baseline reflecting a decline in the condition of the highway systemfrom the previous period Moreover the estimated investmentrequirements required to maintain the new current condition into thefuture would also decline since less investment would be required tomaintain a more deteriorated condition Such a decline in estimatedinvestment requirements over time however might be misconstrued toindicate that the condition of the highway infrastructure is improvingwhen in fact it would indicate a decline in the baseline condition
Page 19 GAORCED-00-133 FWHArsquos HERS Model
B-284060
HERS Estimates Could beMore Clearly Presented
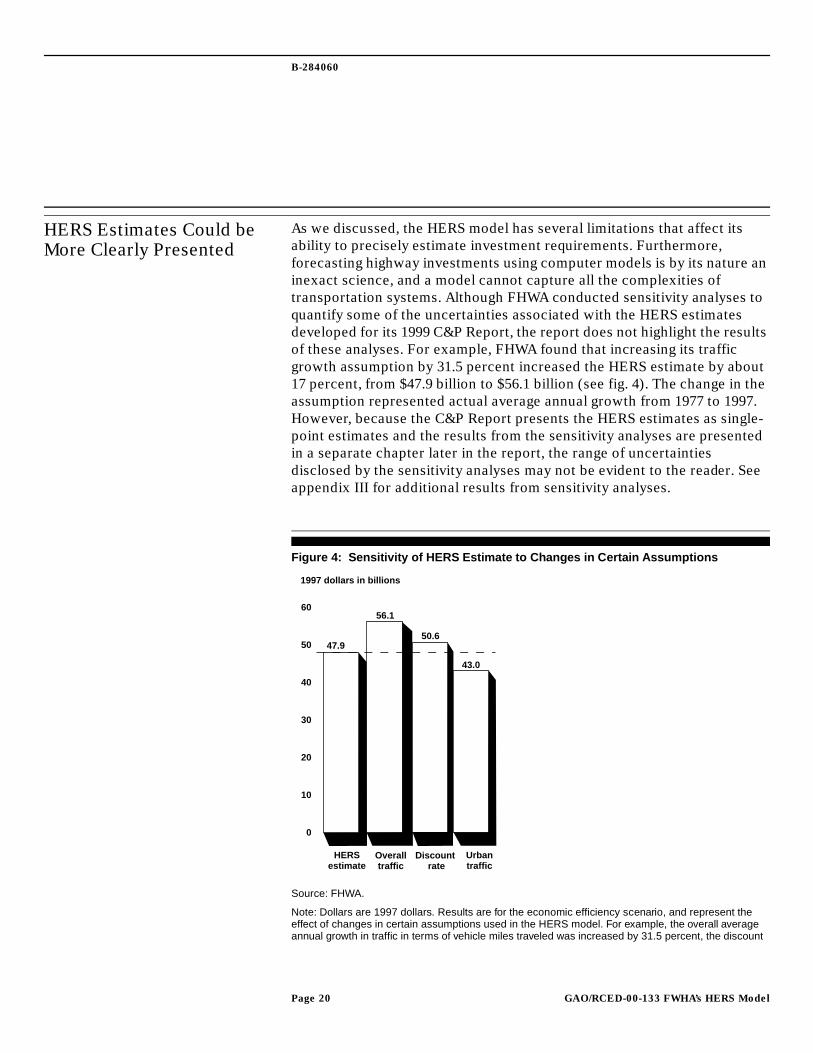
As we discussed the HERS model has several limitations that affect itsability to precisely estimate investment requirements Furthermoreforecasting highway investments using computer models is by its nature aninexact science and a model cannot capture all the complexities oftransportation systems Although FHWA conducted sensitivity analyses toquantify some of the uncertainties associated with the HERS estimatesdeveloped for its 1999 CampP Report the report does not highlight the resultsof these analyses For example FHWA found that increasing its trafficgrowth assumption by 315 percent increased the HERS estimate by about17 percent from $479 billion to $561 billion (see fig 4) The change in theassumption represented actual average annual growth from 1977 to 1997However because the CampP Report presents the HERS estimates as single-point estimates and the results from the sensitivity analyses are presentedin a separate chapter later in the report the range of uncertaintiesdisclosed by the sensitivity analyses may not be evident to the reader Seeappendix III for additional results from sensitivity analyses
Figure 4 Sensitivity of HERS Estimate to Changes in Certain Assumptions
Source FHWA
Note Dollars are 1997 dollars Results are for the economic efficiency scenario and represent theeffect of changes in certain assumptions used in the HERS model For example the overall averageannual growth in traffic in terms of vehicle miles traveled was increased by 315 percent the discount
1997 dollars in billions
0
10
20
30
40
50
60
479
561
506
430
HERSestimate
Overalltraffic
Discount rate
Urbantraffic
Page 20 GAORCED-00-133 FWHArsquos HERS Model
B-284060
rate was lowered from 7 to 4 percent and the average annual growth in traffic in the largest urbanizedareas was decreased by 100 percent (to no growth) In terms of the latter assumption about29 percent of the estimate represents highway improvements in the largest urbanized areas
In addition when reporting on investment requirements for highways andbridges the CampP Report did not clearly disclose that its estimates are onlypartially modeled using benefit-cost analyses Specifically only 51 percentof the reported investment requirement is based on the HERS model and itsbenefit-cost analyses The other 49 percent which consists of bridges andnon-modeled factors such as the construction of new highways is notbased on the same methodology and thus has not been proven to beeconomically justified As a result the estimates are technically notcomparable In addition FHWA views the highway investmentrequirements estimated outside the HERS model as less reliable Althoughthe CampP Report presents the estimates relating to highways and bridgesseparately it combines the HERS-modeled estimates with the non-modeledestimates Thus as currently presented it may not be evident to the readerthat only a portion of the total highway investment requirements is basedon benefit-cost analyses and as a result is economically justified (See fig 1for an analysis of these estimates)
Conclusions In developing the HERS model to forecast the investment requirements forthe nationrsquos highways FHWA has taken steps to enhance the modelrsquosintegrity and rigor Furthermore because the model incorporates benefit-cost analyses in selecting potential highway improvement projects forinclusion in its estimates it is a significant improvement over previousmethods which used engineering standards to identify highwaydeficiencies and estimated the cost of correcting these deficiencies withoutregard to economic merit The HERS model selects those improvementsthat are economically justified and as a result provides the Congress with amore useful and realistic estimate Although FHWA significantly improvedupon the analytical rigor of previous methods by incorporating benefit-costanalyses the HERS model has some limitations that affect the precision ofits estimates
While not all the limitations in the HERS model can be addressed becauseof the inherent complexities of modeling FHWA is taking steps to improvethe model FHWA has expressed interest in changing the model toeliminate the shortcut for calculating an improvementrsquos lifetime benefitsbut has not established a timeframe for this change It is also planning toimprove the modelrsquos information on pavement performance and costFHWA could present the modelrsquos estimates more effectively in its CampP
Page 21 GAORCED-00-133 FWHArsquos HERS Model
B-284060
Report to help the reportrsquos readers be aware of the full extent of the caveatsand uncertainties associated with the estimates In particular FHWA couldhighlight the uncertainties associated with the HERS estimates as indicatedby its sensitivity analyses so that readers of the report do not believe theestimates are more precise than they actually are Finally FHWArsquos CampPReport generally presents an overall estimate of all highway investmentrequirementsmdashcombining the HERS estimates with other estimates thatare developed using less rigorous methods The report could highlight thedifference between these estimates and note that FHWA has moreconfidence in the HERS-generated estimates
Recommendations In order to ensure that the HERS model achieves its objectives and that thelimits of its estimates and the estimates presented in future conditions andperformance reports are disclosed we recommend that the Secretary ofTransportation direct the Administrator of FHWA to
bull establish a timeframe for revising the HERS model in order to accountfor the expected lifetime benefits that are associated with alternativehighway improvement options
bull clarify when presenting the HERS estimates that there areuncertainties associated with the estimates and refer readers to thesensitivity analyses performed on the HERS model that illustrate theseuncertainties and
bull explain in the report that one portion of the estimate for highwayinvestment requirements is from the HERS model and is based onbenefit-cost analyses and that the other portion was calculated usingless reliable methods as well as the percentage that each of theseportions constitutes of the overall estimate
Agency Comments andOur Evaluation
We provided a draft of this report to the Department of Transportation forreview and comment We met with Department officials including theTeam Leader for Highway Needs and Investment Planning in the FederalHighway Administration These officials generally agreed with the findingsand recommendations in this report With regard to the recommendation toestablish a timeframe for accounting in the model for the expected lifetimebenefits of highway improvements the Department plans to eliminate thecomputational shortcut it uses to approximate future lifetime benefits intime to prepare estimates for the CampP Report it will issue in 2003 Inresponse to the recommendation to clarify the uncertainties associated
Page 22 GAORCED-00-133 FWHArsquos HERS Model
B-284060
with HERS estimates the Department plans to expand its use ofuncertainty analysis beyond the analysis in the 1999 report for the CampPReport for 2001 in order to provide a more complete discussion of thisissue Finally in response to the recommendation to distinguish betweenHERS model estimates and other less reliable estimates the Departmentplans to clarify and enhance its discussion of these differences in the CampPReport for 2001 including a figure similar to our figure 1 In addition theDepartment will work to expand the scope of HERS to consider more typesof highway deficiencies and solutions to address them in order to reducethe percentage of estimates using these less reliable methods TheDepartment also provided technical and clarifying comments which weincorporated into the report as appropriate
We conducted our review from September 1999 through April 2000 inaccordance with generally accepted government auditing standards
We will send copies of this report to cognizant congressional committeesthe Honorable Rodney E Slater Secretary of Transportation and theHonorable Kenneth R Wykle Administrator Federal HighwayAdministration
If you or your staff have any questions about this report please contact meat (202) 512-2834 Appendix IV lists key contacts and contributors to thisreport
John H Anderson JrDirector Transportation Issues
Page 23 GAORCED-00-133 FWHArsquos HERS Model
Appendix I
AppendixesScope and Methodology AppendixI
To assess the reasonableness of the Highway Economic RequirementsSystems (HERS) modelrsquos assumptions and data and the usefulness of themodelrsquos results we reviewed the Principles for Federal InfrastructureInvestments (Executive Order 12893) the Federal HighwayAdministrationrsquos (FHWA) June 1999 expert panelrsquos comments on the HERSmodel and several FHWA reports and documents on the HERS model from1994 through 1999
In addition we discussed the HERS methodology with FHWA economistsand engineers and two of the FHWA contractors that helped develop themodel Moreover we interviewed users of the HERSrsquo results includinglegislative and executive-branch officials several members of the June1999 HERS expert panel and other transportation modeling experts (seelist of names below) We attended the June 1999 expert panel meeting aswell as an FHWA-sponsored outreach meeting on the Conditions andPerformance Report (CampP Report) in November 1998 We used standardeconomic principles to evaluate the modelrsquos application of benefit-costanalyses and the key economic assumptions used in the model and weasked FHWA to provide us with results for sensitivity analyses conductedusing alternative values for price elasticity and the discount rate Inaddition we reviewed the methods used by other transportation models toassess highway investments
To assess the reasonableness of the data used in the HERS model wereviewed technical documents supporting the primary source of datamdashtheHighway Performance Monitoring System (HPMS) database In additionwe discussed the reliability of the HPMS data with FHWA officialsincluding the Chief of Highway Systems Performance Because FHWA usesa ldquopreprocessorrdquo to convert the HPMS data into a HERS input data file wereviewed the actions performed by the preprocessor to assess whether thevalues of the data elements in HPMS are consistent with those in the HERSinput data file To do this we asked FHWA to provide us with basicstatistics and frequencies for several key data elements in the HPMSdatabase both before and after the data were converted by thepreprocessor The data included average annual daily trafficsurfacepavement type weighted design speed peak and off-peak percentof vehicles with greater than four tires speed limit and wideningfeasibility For most of the data items the actions of the preprocessorproduced at most minor changes in a very small percentage of the dataelements For the data items for which the actions of the preprocessoraffected a larger percentage of the data elements we asked FHWA toconduct a sensitivity analysis in order to assess the effect of changes in the
Page 24 GAORCED-00-133 FWHArsquos HERS Model
Appendix I
Scope and Methodology
data items on the HERS estimates using the maximum economic efficiencyscenario We found that changes in these data items did not markedlychange the HERS estimates See appendix III for the results of thesesensitivity analyses
In August 1987 we reported on our review of FHWArsquos HPMS samplingplan1 We found it to be statistically reasonable for selecting highwaysections nationally For our current effort we reviewed FHWArsquos currentguidance which the states use to sample segments and found it consistentwith the guidance we reviewed in 1987
The individuals we contacted include the following experts
bull Adjo Amekudzi Assistant Professor of Civil and EnvironmentalEngineering Georgia Institute of Technology
bull Kenneth D Boyer Professor of Economics Department of EconomicsMichigan State University
bull Gregorio Camus Programmer Battelle Memorial Institutebull David J Forkenbrock Professor of Civil and Environmental
Engineering and Chair Public Policy Center University of Iowabull David Greene Economist Oak Ridge National Laboratorybull Chris Hoban Principal Highway Engineer The World Bankbull Douglass Lee Principal Investigator Volpe National Transportation
Centerbull Sue McNeil Professor of Civil and Environmental Engineering Carnegie
Mellon Universitybull Mike Markow Cambridge Systematicsbull Michael Meyer Professor and Chair School of Civil and Environmental
Engineering Georgia Institute of Technologybull Carl L Monismith Robert Horonjeff Professor of Civil and
Environmental Engineering and Professor in the Graduate SchoolUniversity of California at Berkeley
bull Arlee Reno Engineer Cambridge Systematicsbull Herb Weinblatt Principal Cambridge Systematics
1 Highway Needs An Evaluation of DOTrsquos Process for Assessing the Nationrsquos HighwayNeeds (GAORCED-87-136)
Page 25 GAORCED-00-133 FWHArsquos HERS Model
Appendix II
Description of the HERS Model AppendixII
This appendix describes the basic structure of the HERS computer modelThe HERS model simulates infrastructure improvement decisions for thehighways it models by comparing the relative benefits and costs associatedwith alternative improvement options In conducting its analysis HERSuses an extensive set of data that are primarily collected and updated bythe states and maintained by FHWA in the HPMS database In addition theHERS model consists of several submodels representing specific highwayprocesses including traffic growth pavement wear vehicle speedaccidents and highway improvement costs The analysis which is basedon the current condition of the highway system is conducted over four 5-year periods for a total of 20 years Information from the submodels isused to identify deficient segments evaluate alternative improvementoptions and select and implement improvements HERS uses benefit-costratios (benefits divided by costs) to evaluate and select improvementsunder several investment scenarios The costs are the capital expendituresnecessary to construct the improvement and the benefits includereductions in usersrsquo operating costs agency maintenance costs and theldquoresidual valuerdquo of an improvement Residual value represents the benefitsexpected to accrue over the future life of an improvement beyond theanalysis period used in the model HERS uses a computational shortcut toestimate residual value
Page 26 GAORCED-00-133 FWHArsquos HERS Model
Appendix II
Description of the HERS Model
HERS Uses anExtensive Data Set
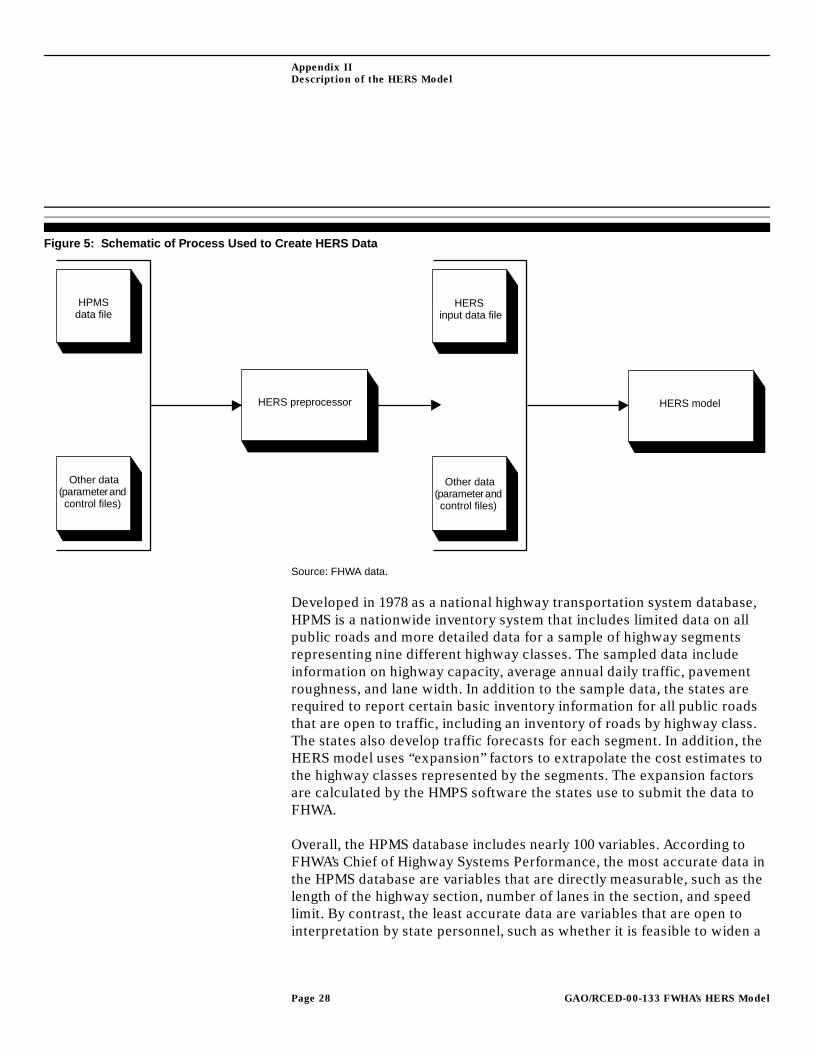
HERS uses input data that are created from the HPMS database and severalparameter and control files HPMS consists of all the data collected andupdated by the states on about 125000 randomly selected highwaysegments across the United States ranging in length from one block to 10miles The parameter and control files include information such asdeficiency and design standards and basic instructions for the modelThese data are converted to a HERS input file by a separate model calledthe ldquopreprocessorrdquo which aggregates all the data and performs variousdata manipulations For example the preprocessor assigns a speed limit of75 mph to segments with no legally mandated maximum speed limit and itconverts the International Roughness Index data developed by the states toa ldquomodifiedrdquo Present Serviceability Rating (PSR) index1 See figure 5 for arepresentation of the process used to create the HERS input data
1 The HERS pavement deterioration submodel was not designed to use the InternationalRoughness Index (IRI) so the preprocessor converts the IRI data to a ldquomodifiedrdquo PSR Theconversion is based on formulas developed by Al-Omari and Darter in RelationshipsBetween IRI and PSR Department of Civil Engineering University of Illinois 1992 Both IRIand PSR are measures of pavement condition but IRI strictly measures surface roughnesswhile PSR incorporates other types of pavement distress and may be based on professionaljudgement IRI is measured by a moving vehicle using non-contact sensors such as lasers
Page 27 GAORCED-00-133 FWHArsquos HERS Model
Appendix II
Description of the HERS Model
Figure 5 Schematic of Pr ocess Used to Create HERS Data
Source FHWA data
Developed in 1978 as a national highway transportation system databaseHPMS is a nationwide inventory system that includes limited data on allpublic roads and more detailed data for a sample of highway segmentsrepresenting nine different highway classes The sampled data includeinformation on highway capacity average annual daily traffic pavementroughness and lane width In addition to the sample data the states arerequired to report certain basic inventory information for all public roadsthat are open to traffic including an inventory of roads by highway classThe states also develop traffic forecasts for each segment In addition theHERS model uses ldquoexpansionrdquo factors to extrapolate the cost estimates tothe highway classes represented by the segments The expansion factorsare calculated by the HMPS software the states use to submit the data toFHWA
Overall the HPMS database includes nearly 100 variables According toFHWArsquos Chief of Highway Systems Performance the most accurate data inthe HPMS database are variables that are directly measurable such as thelength of the highway section number of lanes in the section and speedlimit By contrast the least accurate data are variables that are open tointerpretation by state personnel such as whether it is feasible to widen a
HERS preprocessor
HPMSdata file
HERS input data file
HERS model
Other data (parameter and control files)
Other data (parameter and control files)
Page 28 GAORCED-00-133 FWHArsquos HERS Model
Appendix II
Description of the HERS Model
segment and the estimated percent of trucks traveling in peak and off-peakperiods For example in assessing whether a segment can be widened onestate may view the potential high costs of widening as a detriment whileanother state may not In addition the states generally estimate the percentof trucks traveling during peak and off-peak periods from classificationcounts taken in a limited number of locations and of varying times anddurations
FHWA developed an HPMS field manual for the states to use in samplinghighway segments and identifying which data items to collect and how tomeasure them The sampling plan requires the states to select stratifiedrandom samples where the strata represent different volume groups fordifferent highway classes in the rural small urban and urbanized areas ofeach state Estimates of average annual daily traffic are based on volumecounts on each segment Since each state selects its own sampleimplementation of the sampling plan may vary
FHWA has instituted some measures to improve the reasonableness of theHPMS data FHWA provided the states with software they can use toassemble edit and submit their HPMS data This software automaticallyperforms checks for basic validity and missing data Once the states edittheir data they run an expansion subroutine that places an expansionfactor in each sample segmentrsquos record that is used to expand sample datato the full functional system Once FHWA receives the data from the statesthe data are passed through a software program that conducts basic logicchecks searches for anomalies and reviews the distributions of sample-related items FHWA staff review all items flagged during this check FHWAworks closely with the states to obtain answers to its questions concerningthe HPMS data Nonetheless the potential for some variability in HPMSdata remains because of potential differences in data collection techniquesamong the states
In addition from December 1996 through December 1998 FHWAreassessed its database needs in an effort to eliminate unnecessary dataitems and reduce the statesrsquo data collection burden2 As part of this effortFHWA conducted public meetings with state officials to obtain their viewson a future focus for the HPMS database As a result of the reassessmentFHWA will make significant changes to the HPMS database FHWA
2 Highway Performance Monitoring System Reassessment Final Report Revised April 1999FHWA-PL-99-001
Page 29 GAORCED-00-133 FWHArsquos HERS Model
Appendix II
Description of the HERS Model
changed the HPMS field manual and software to guide the states in makingneeded changes For example FHWA decided to delete some data that thestates have collected in the past but that it determined are no longerneeded such as the number of interchanges on segments In additionFHWA ldquocollapsedrdquo some data items into fewer categories to reduce stateofficialsrsquo time spent in collecting data For example the variable describingthe surface or pavement type was reported in 15 categories many of whichwere of little use so these were reduced to 6 categories In addition tothese changes the FHWA reassessment identified the potential forreducing the HPMS sample from over 125000 segments to 80000 segmentsto help reduce the statesrsquo data collection burden The states beganimplementing the changes during their data collection efforts in 1999 andwill report the revised data to FHWA by June 2000
The HERS input data and additional parameter and control data are usedby the HERS model to assess the relative benefits and costs of makinghighway improvements The post-preprocessor parameter and control datainclude information that is independent of specific segments such astravel-time costs widening feasibility criteria and the discount rate
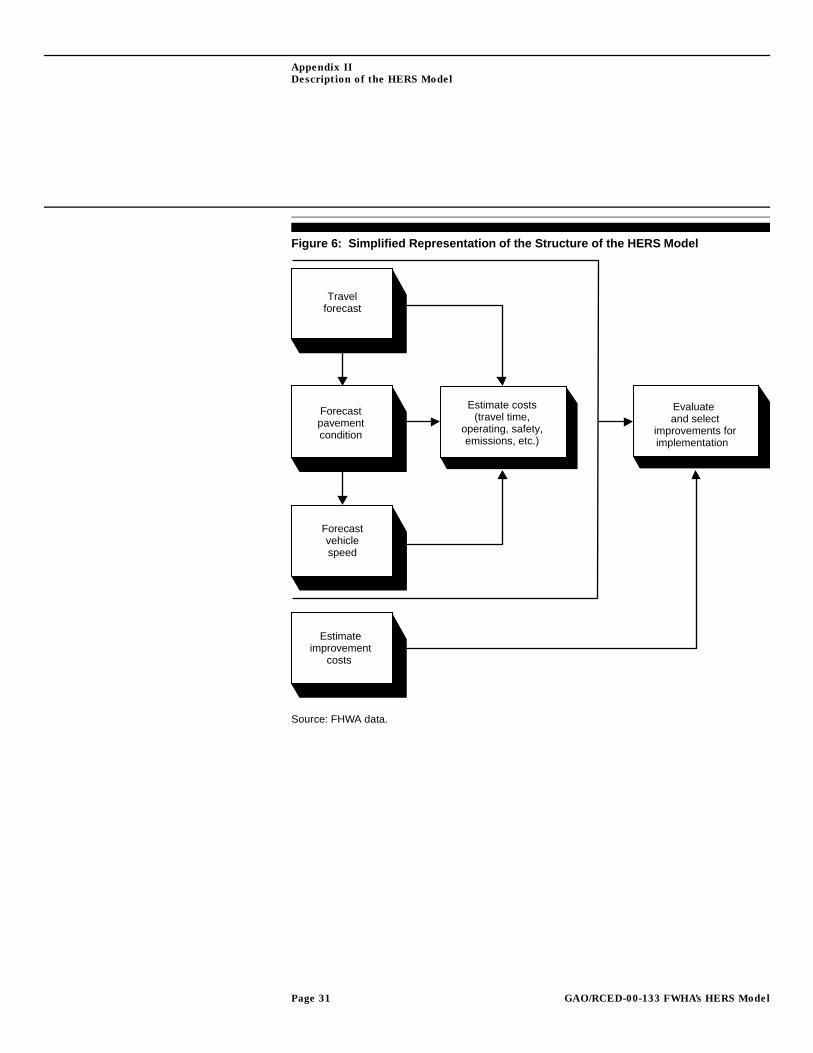
The HERS model consists of several submodels representing specifichighway processes such as traffic growth pavement wear operating costsemissions costs and highway improvement costs The submodels are usedto project the future condition and performance of the highway systemwith and without improvements (for example the baseline) for eachfunding period and each segment3 In addition the benefits associated withmaking highway improvements are estimated using several submodelslinked together Benefits are defined as reductions in user costs (traveltime safety vehicle operating costs) and agency maintenance costs Inaddition the ldquoresidual valuerdquo of an improvement is considered to be abenefit The implementation costs associated with making improvementsare estimated using an improvement cost submodel The information fromthe submodels is used to evaluate the benefits and costs of alternativeimprovement options and select for implementation improvements thatare economically justified See figure 6 for a simplified representation ofthe structure of the HERS model
3 In some analyses the baseline is a less ldquoaggressiverdquo improvement rather than noimprovement at all
Page 30 GAORCED-00-133 FWHArsquos HERS Model
Appendix II
Description of the HERS Model
Figure 6 Simplified Representation of the Structure of the HERS Model
Source FHWA data
Travel forecast
Forecast pavement condition
Forecast vehicle speed
Estimate improvement
costs
Estimate costs (travel time
operating safety emissions etc)
Evaluate and select
improvements for implementation
Page 31 GAORCED-00-133 FWHArsquos HERS Model
Appendix II
Description of the HERS Model
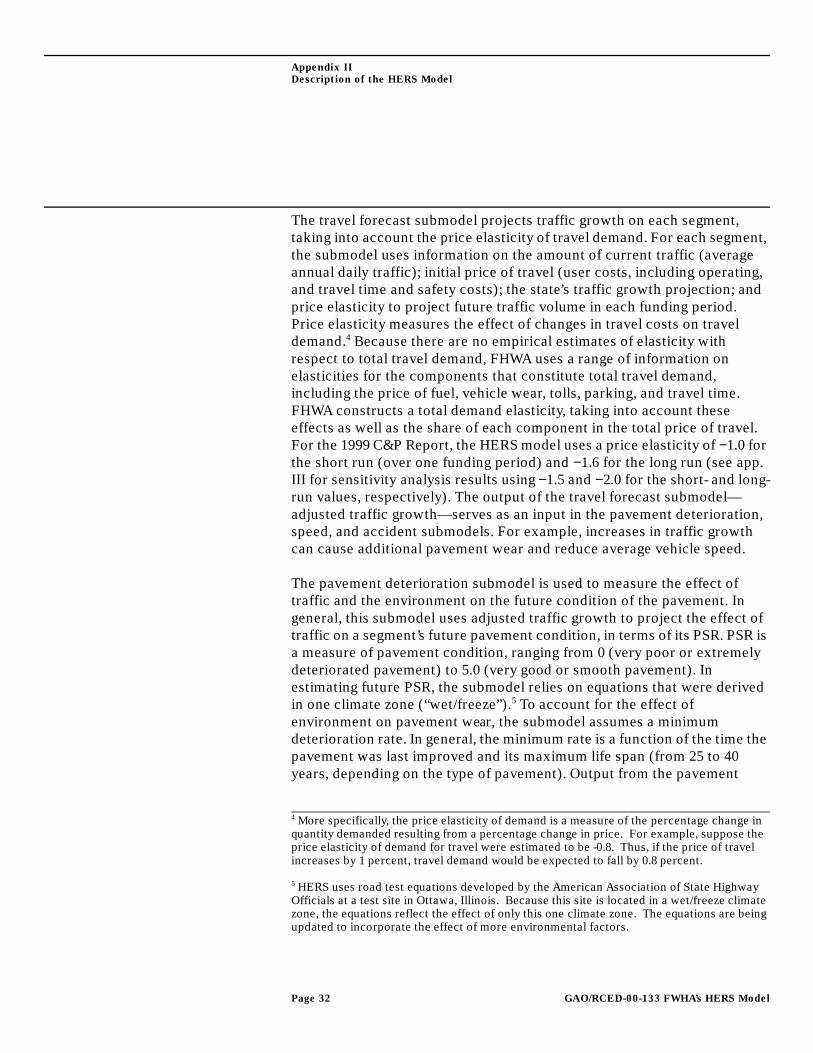
The travel forecast submodel projects traffic growth on each segmenttaking into account the price elasticity of travel demand For each segmentthe submodel uses information on the amount of current traffic (averageannual daily traffic) initial price of travel (user costs including operatingand travel time and safety costs) the statersquos traffic growth projection andprice elasticity to project future traffic volume in each funding periodPrice elasticity measures the effect of changes in travel costs on traveldemand4 Because there are no empirical estimates of elasticity withrespect to total travel demand FHWA uses a range of information onelasticities for the components that constitute total travel demandincluding the price of fuel vehicle wear tolls parking and travel timeFHWA constructs a total demand elasticity taking into account theseeffects as well as the share of each component in the total price of travelFor the 1999 CampP Report the HERS model uses a price elasticity of minus10 forthe short run (over one funding period) and minus16 for the long run (see appIII for sensitivity analysis results using minus15 and minus20 for the short- and long-run values respectively) The output of the travel forecast submodelmdashadjusted traffic growthmdashserves as an input in the pavement deteriorationspeed and accident submodels For example increases in traffic growthcan cause additional pavement wear and reduce average vehicle speed
The pavement deterioration submodel is used to measure the effect oftraffic and the environment on the future condition of the pavement Ingeneral this submodel uses adjusted traffic growth to project the effect oftraffic on a segmentrsquos future pavement condition in terms of its PSR PSR isa measure of pavement condition ranging from 0 (very poor or extremelydeteriorated pavement) to 50 (very good or smooth pavement) Inestimating future PSR the submodel relies on equations that were derivedin one climate zone (ldquowetfreezerdquo)5 To account for the effect ofenvironment on pavement wear the submodel assumes a minimumdeterioration rate In general the minimum rate is a function of the time thepavement was last improved and its maximum life span (from 25 to 40years depending on the type of pavement) Output from the pavement
4 More specifically the price elasticity of demand is a measure of the percentage change inquantity demanded resulting from a percentage change in price For example suppose theprice elasticity of demand for travel were estimated to be -08 Thus if the price of travelincreases by 1 percent travel demand would be expected to fall by 08 percent
5 HERS uses road test equations developed by the American Association of State HighwayOfficials at a test site in Ottawa Illinois Because this site is located in a wetfreeze climatezone the equations reflect the effect of only this one climate zone The equations are beingupdated to incorporate the effect of more environmental factors
Page 32 GAORCED-00-133 FWHArsquos HERS Model
Appendix II
Description of the HERS Model
deterioration submodel is used in the speed user operating costs andagency maintenance costs submodels For example increases in trafficgrowth can cause the pavement to deteriorate further increasing vehicleoperating costs Moreover worn pavement can reduce vehicle speeds slowtravel time and increase a vehiclersquos fuel and maintenance costs
The user costs submodel is used to assess the effect of future pavementcondition and vehicle speed on travel-time costs vehicle operating costsand safety costs Reductions in these costs brought about by highwayimprovements are considered ldquobenefitsrdquo In measuring travel-time coststhe submodel considers both the time spent traveling by drivers for workpurposes as well as by drivers for commuting leisure and other nonworkpurposes In the case of work-related trips the submodel estimates traveltime costs primarily on the basis of hourly compensation for each vehicleoccupant For the value of nonwork trips the submodel uses 60 percent ofeach occupantrsquos hourly compensation excluding fringe benefits
Vehicle operating costs are measured as a function of several factorsincluding pavement condition highway grades and curves and speedchange cycles (for example frequency of stopping) The submodelassesses the effect of these factors on various components of operatingcosts including fuel and oil consumption tire wear vehicle maintenanceand vehicle depreciation For example tire wear and vehicle maintenanceneeds can increase as pavement condition worsens In addition steepgrades and more frequent stopping can increase a vehiclersquos fuel and oilconsumption
The improvement cost submodel uses information on improvement typehighway class and terrain type (flat rolling and mountainous) to projectthe capital costs required to construct an improvement The capital costsrepresent the initial costs of constructing an improvement and depend onthe type of improvement In the case of improvements involvingresurfacing or reconstructing pavement and widening lanes improvementcosts represent initial construction costs and expenditures required toobtain rights of way For improvements that also involve an alignment theHERS model estimates an additional cost that represents the cost requiredto improve a segmentrsquos substandard curves and grades In addition to theseimprovements the model estimates the cost of improving substandardconditions on urban freeways requiring reconstruction in certaincircumstances (for example when shoulders are unfinished) Theimprovementsrsquo costs are used in evaluating the benefits and costs ofalternative improvement options
Page 33 GAORCED-00-133 FWHArsquos HERS Model
Appendix II
Description of the HERS Model
The HERS model uses information from the submodels to identify deficientsegments evaluate the benefits and costs of alternative improvementoptions and select and implement improvements The model calculatesbenefit-cost ratios (total benefits divided by capital costs) to evaluatealternative improvement options for deficient segments Improvementsthat meet specific investment criteria are selected and implemented Forexample under the economic efficiency scenario the HERS modelimplements for each deficient segment the most ldquoaggressiverdquo improvementwith a benefit-cost ratio greater than 1 In so doing the model maximizesnet benefits and as a result generates an economically efficient solutionldquoAggressiverdquo refers to the type of improvement that the model considersFor example both the resurfacing and pavement reconstructionimprovement types might improve the condition of a segment butpavement reconstruction would be the more aggressive option because itrequires more extensive construction The HERS model extrapolatesimprovement costs using expansion factors in the HPMS database Themodel combines the expanded improvement costs for all segments andsummarizes them by highway functional class
HERS Uses ComputationalShortcut to EstimateLifetime Benefits of anImprovement
For certain portions of the analysis the HERS model uses a ldquoshortcutrdquo toapproximate the benefits that would accrue over the lifetime of animprovement For example for deficient segments the model begins byconducting an analysis for one funding-period (5 years) to assess whetherthe segment should be improved in the current funding period or in somelater period A ldquono improvementrdquo baseline is used to evaluate the timing ofthis investment decision Because an improvement will continue to provideannual benefits after the first funding period is over the modelapproximates these future benefits using information on the improvementrsquoscost More specifically these future benefits are approximated by theimprovementrsquos construction cost minus the depreciation in theimprovement after the first funding period plus the cost savings from nothaving to maintain an unimproved segment in later funding periods Thetotal amount is referred to as the ldquoresidual valuerdquo of the improvement andis added to the other benefits associated with making an improvementIdeally in evaluating alternative improvement options the HERS modelshould compare estimated implementation costs with the present value ofbenefits expected to occur in each future funding period According to oneof the modelrsquos developers limitations in computer processing power whenthe HERS model was first developed prevented them from accounting forthe full life cycle of benefits As a result they developed a computationallysimpler algorithm to evaluate and select improvements The developer also
Page 34 GAORCED-00-133 FWHArsquos HERS Model
Appendix II
Description of the HERS Model
indicated that computational time is no longer an issue because of theimprovement in processing speeds
Page 35 GAORCED-00-133 FWHArsquos HERS Model
Appendix III
Results of Sensitivity Analyses Using theHERS Model AppendixIII
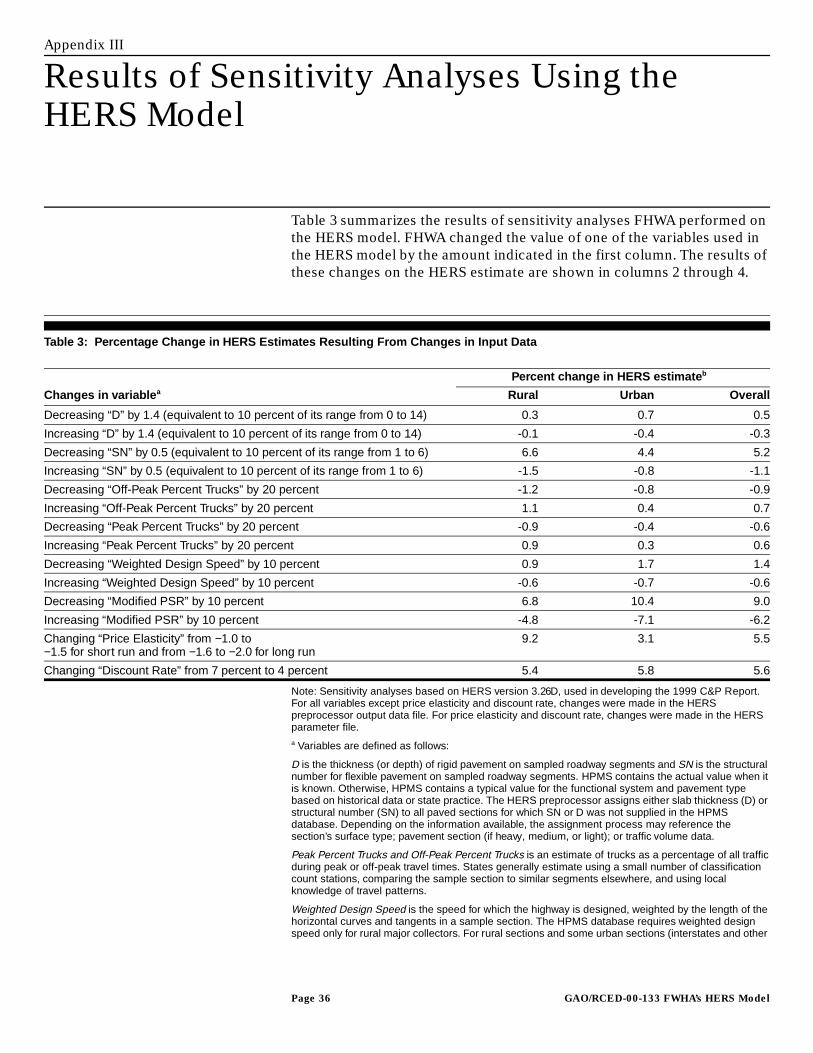
Table 3 summarizes the results of sensitivity analyses FHWA performed onthe HERS model FHWA changed the value of one of the variables used inthe HERS model by the amount indicated in the first column The results ofthese changes on the HERS estimate are shown in columns 2 through 4
Table 3 Percentage Change in HERS Estimates Resulting From Changes in Input Data
Note Sensitivity analyses based on HERS version 326D used in developing the 1999 CampP ReportFor all variables except price elasticity and discount rate changes were made in the HERSpreprocessor output data file For price elasticity and discount rate changes were made in the HERSparameter filea Variables are defined as follows
D is the thickness (or depth) of rigid pavement on sampled roadway segments and SN is the structuralnumber for flexible pavement on sampled roadway segments HPMS contains the actual value when itis known Otherwise HPMS contains a typical value for the functional system and pavement typebased on historical data or state practice The HERS preprocessor assigns either slab thickness (D) orstructural number (SN) to all paved sections for which SN or D was not supplied in the HPMSdatabase Depending on the information available the assignment process may reference thesectionrsquos surface type pavement section (if heavy medium or light) or traffic volume data
Peak Percent Trucks and Off-Peak Percent Trucks is an estimate of trucks as a percentage of all trafficduring peak or off-peak travel times States generally estimate using a small number of classificationcount stations comparing the sample section to similar segments elsewhere and using localknowledge of travel patterns
Weighted Design Speed is the speed for which the highway is designed weighted by the length of thehorizontal curves and tangents in a sample section The HPMS database requires weighted designspeed only for rural major collectors For rural sections and some urban sections (interstates and other
Percent change in HERS estimate b
Changes in variable a Rural Urban Overall
Decreasing ldquoDrdquo by 14 (equivalent to 10 percent of its range from 0 to 14) 03 07 05
Increasing ldquoDrdquo by 14 (equivalent to 10 percent of its range from 0 to 14) -01 -04 -03
Decreasing ldquoSNrdquo by 05 (equivalent to 10 percent of its range from 1 to 6) 66 44 52
Increasing ldquoSNrdquo by 05 (equivalent to 10 percent of its range from 1 to 6) -15 -08 -11
Decreasing ldquoOff-Peak Percent Trucksrdquo by 20 percent -12 -08 -09
Increasing ldquoOff-Peak Percent Trucksrdquo by 20 percent 11 04 07
Decreasing ldquoPeak Percent Trucksrdquo by 20 percent -09 -04 -06
Increasing ldquoPeak Percent Trucksrdquo by 20 percent 09 03 06
Decreasing ldquoWeighted Design Speedrdquo by 10 percent 09 17 14
Increasing ldquoWeighted Design Speedrdquo by 10 percent -06 -07 -06
Decreasing ldquoModified PSRrdquo by 10 percent 68 104 90
Increasing ldquoModified PSRrdquo by 10 percent -48 -71 -62
Changing ldquoPrice Elasticityrdquo from minus10 tominus15 for short run and from minus16 to minus20 for long run
92 31 55
Changing ldquoDiscount Raterdquo from 7 percent to 4 percent 54 58 56
Page 36 GAORCED-00-133 FWHArsquos HERS Model
Appendix III
Results of Sensitivity Analyses Using the
HERS Model
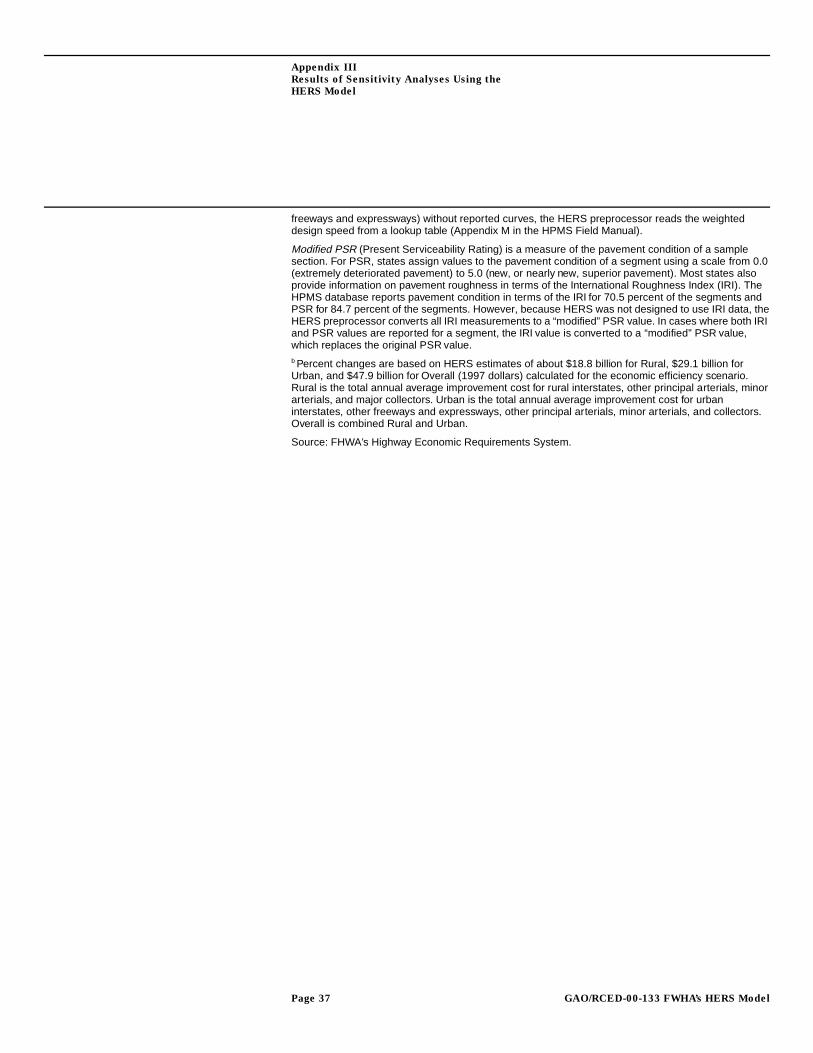
freeways and expressways) without reported curves the HERS preprocessor reads the weighteddesign speed from a lookup table (Appendix M in the HPMS Field Manual)
Modified PSR (Present Serviceability Rating) is a measure of the pavement condition of a samplesection For PSR states assign values to the pavement condition of a segment using a scale from 00(extremely deteriorated pavement) to 50 (new or nearly new superior pavement) Most states alsoprovide information on pavement roughness in terms of the International Roughness Index (IRI) TheHPMS database reports pavement condition in terms of the IRI for 705 percent of the segments andPSR for 847 percent of the segments However because HERS was not designed to use IRI data theHERS preprocessor converts all IRI measurements to a ldquomodifiedrdquo PSR value In cases where both IRIand PSR values are reported for a segment the IRI value is converted to a ldquomodifiedrdquo PSR valuewhich replaces the original PSR valueb Percent changes are based on HERS estimates of about $188 billion for Rural $291 billion forUrban and $479 billion for Overall (1997 dollars) calculated for the economic efficiency scenarioRural is the total annual average improvement cost for rural interstates other principal arterials minorarterials and major collectors Urban is the total annual average improvement cost for urbaninterstates other freeways and expressways other principal arterials minor arterials and collectorsOverall is combined Rural and Urban
Source FHWArsquos Highway Economic Requirements System
Page 37 GAORCED-00-133 FWHArsquos HERS Model
Appendix IV
GAO Contacts and Staff Acknowledgments AppendixIV
GAO Contacts John H Anderson Jr (202) 512-2834
Katherine Siggerud (202) 512-2834
StaffAcknowledgments
In addition to those named above Richard Calhoon Catherine ColwellTimothy J Guinane Mehrzad Nadji Judy K Pagano Raymond Sendejasand Phyllis F Scheinberg made key contributions to this report
Page 38 GAORCED-00-133 FWHArsquos HERS Model
(348194) Letter
Ordering Information The first copy of each GAO report is free Additional copies ofreports are $2 each A check or money order should be made out tothe Superintendent of Documents VISA and MasterCard creditcards are accepted also
Orders for 100 or more copies to be mailed to a single address arediscounted 25 percent
Orders by mailUS General Accounting OfficePO Box 37050Washington DC 20013
Orders by visitingRoom 1100700 4th St NW (corner of 4th and G Sts NW)US General Accounting OfficeWashington DC
Orders by phone(202) 512-6000fax (202) 512-6061TDD (202) 512-2537
Each day GAO issues a list of newly available reports andtestimony To receive facsimile copies of the daily list or any listfrom the past 30 days please call (202) 512-6000 using a touchtonephone A recorded menu will provide information on how to obtainthese lists
Orders by InternetFor information on how to access GAO reports on the Internetsend an e-mail message with ldquoinfordquo in the body to
infowwwgaogov
or visit GAOrsquos World Wide Web home page at
httpwwwgaogov
To Report FraudWaste or Abuse inFederal Programs
Contact one
bull Web site httpwwwgaogovfraudnetfraudnethtm
bull e-mail fraudnetgaogov
bull 1-800-424-5454 (automated answering system)
United StatesGeneral Accounting OfficeWashington DC 20548-0001
Official BusinessPenalty for Private Use $300
Address Correction Requested
Bulk RatePostage amp Fees Paid
GAOPermit No GI00
Appendixes
Appendix I Scope and Methodology
Appendix II Description of the HERS Model
Appendix III Results of Sensitivity Analyses Using the HERS Model
Appendix IV GAO Contacts and Staff Acknowledgments
Scope and Methodology
Description of the HERS Model
Results of Sensitivity Analyses Using the HERS Model
GAO Contacts and Staff Acknowledgments
Contents
Letter 3
Appendixes Appendix I Scope and Methodology 24
Appendix II Description of the HERS Model 26
Appendix III Results of Sensitivity Analyses Using theHERS Model 36
Appendix IV GAO Contacts and Staff Acknowledgments 38
Tables Table 1 Development of Highway Investment RequirementsReport and FHWArsquos Models 8
Table 2 The HERS Modelrsquos Estimates for Highways 13Table 3 Percentage Change in HERS Estimates Resulting From
Changes in Input Data 36
Figures Figure 1 FHWArsquos Projected Annual Highway and Bridge InvestmentRequirements 1998 through 2017 7
Figure 2 FHWArsquos Road Classification System 9Figure 3 Simplified Representation of the HERS Modeling Process 11Figure 4 Sensitivity of HERS Estimate to Changes in Certain
Assumptions 20Figure 5 Schematic of Process Used to Create HERS Data 28Figure 6 Simplified Representation of the Structure of the HERS
Model 31
Abbreviations
DOT Department of TransportationEPA Environmental Protection AgencyFHWA Federal Highway AdministrationGAO US General Accounting OfficeHERS Highway Economic Requirements SystemHPMS Highway Performance Monitoring SystemIRI International Roughness IndexPSR Present Servicability Rating
Page 1 GAORCED-00-133 FWHArsquos HERS Model
Page 2 GAORCED-00-133 FWHArsquos HERS Model
Page 3
United States General Accounting Office
Washington DC 20548
Page 3
Resources Community and
Economic Development Division
B-284060 Letter
June 5 2000
The Honorable Bob SmithChairmanThe Honorable Max S BaucusRanking Minority MemberCommittee on Environment and Public WorksUnited States Senate
The Honorable Bud ShusterChairmanThe Honorable James L OberstarRanking Democratic MemberCommittee on Transportation and InfrastructureHouse of Representatives
Transportation systems play a vital role in the nationrsquos economy byfacilitating the movement of people and goods The United States has madesignificant investments in its transportation infrastructure Effectivemanagement of this infrastructure depends in part on reliable methods forestimating the amount of continuing investment required for maintainingand improving the transportation system In this context the Congress hasrequired the Department of Transportation (DOT) to report every 2 yearson the nationrsquos need for investment to maintain and improve the nationrsquoshighways and bridgesTo help estimate these future investmentrequirements the Departmentrsquos Federal Highway Administration (FHWA)uses the Highway Economic Requirements System (HERS) computermodel
The Transportation Equity Act for the 21st Century (PL 105-178) directedGAO to evaluate and report to the Congress how the Department ofTransportation determines highway investment requirements using theHERS model Accordingly this report describes (1) the methodology themodel uses to generate its estimates of the nationrsquos highway investmentrequirements (2) the strengths and limitations of the model and (3) theusefulness of the HERS estimates for deciding on federal investments inhighway infrastructure In reporting on investment requirements DOTincludes estimates for highways bridges and transit systems This reportfocuses on highway investment requirements and the HERS modelrsquosportion of these requirements We used a draft of DOTrsquos latest Conditions
GAORCED-00-133 FWHArsquos HERS ModelGAORCED-00-133 FWHArsquos HERS Model
B-284060
and Performance Report dated January 10 2000 as the source of DOTrsquosestimated investment requirements for highways DOT approved thisreport for issuance on May 2 2000 without changes to this material Wereviewed the modelrsquos documentation and interviewed its developers andoperators evaluated the model using general economic standards formodels of this type interviewed experts in transportation modeling toobtain their views and interviewed legislative and executive branchofficials who use the model and its results See appendix I for moreinformation on the methodology we used and a list of the transportationmodeling experts we contacted
Results in Brief The HERS computer model estimates investment requirements for thenationrsquos highways by adding together the costs of highway improvementsthat the modelrsquos benefit-cost analyses indicate are warranted In making itsestimates the model relies on extensive data on highway segmentsthroughout the nation such as pavement conditions and expected growthin traffic which the states primarily collect and update The model alsouses information such as vehicle operating costs and emissions obtainedfrom other sources The HERS model uses the data to (1) project the futurecondition and performance of the highway system (2) assess whether anyhighway improvements are warranted and (3) select and implementappropriate improvements Such improvements range from resurfacing ahighway to adding lanes and are based on a comparison of the constructioncosts and the lifetime benefits of the improvement Adding a lane to relieveprojected congestion for example has benefits because the increasedcapacity can reduce travel time and vehicle operating costs FHWA uses theHERS model to estimate highway infrastructure improvement costs forcertain highways under several different scenarios For example under anldquoeconomic efficiencyrdquo scenario the HERS model estimates that for thesehighways the cost of constructing improvements for which the estimatedbenefits exceed the construction costs would be about $48 billion per year(1997 dollars) out of FHWArsquos overall estimate of $94 billion in investmentrequirements for all roads and bridges Similarly under a ldquomaintain currentconditionsrdquo scenario the HERS model estimates that for these highwaysthe least costly mix of improvements that would maintain the pavementcondition of the highways at current levels (1997) would be about$29 billion per year out of FHWArsquos overall estimate of $57 billion ininvestment requirements for all roads and bridges
The HERS model has several strengths that make it a unique andreasonable tool for estimating a general level of national highway
Page 4 GAORCED-00-133 FWHArsquos HERS Model
B-284060
investment requirements but it also has some limitations that affect theprecision of its results A major strength of the model is its ability to assessthe relative benefits and costs associated with alternative options forimproving the nationrsquos highway infrastructure This is a significantimprovement over FHWArsquos previous method which used engineeringstandards to identify highway deficiencies and estimated the cost ofcorrecting these deficiencies without regard to economic merit In June1999 the HERS model was reviewed by an expert panel which found thatFHWA has strengthened the model over time The model has limitationshowever in that it (1) does not completely account for the effect ofhighway improvements on all other highways and modes of transportation(2) does not fully account for the uncertainties associated with its methodsdata and assumptions (3) relies on a computational ldquoshortcutrdquo toapproximate the future lifetime benefits of an improvement and (4) usesdata that vary in quality The overall effect of these limitations on the HERSestimates cannot be determined however they indicate a level ofimprecision with the estimates Although FHWA plans to improve themodel by addressing the limitations in the computational shortcut and thedata transportation modeling experts generally agree that a more completeaccounting of the interrelationships between all highways andtransportation modes cannot be done with the current state of the art intransportation modeling In addition changing the model to account for theuncertainties in its methods data and assumptions would be costly
HERS estimates can be useful as a general guide for the investmentrequirements of the nationrsquos highways included in the model such as ruraland urban interstates and for assessing relative investment requirementsover time Nevertheless the limitations and inherent uncertaintiesassociated with making forecasts prevent the estimates from being aprecise forecast of highway investment requirements FHWA includes theHERS estimates in its current report on the conditions and performance ofthe nationrsquos highways bridges and transit systems In the report howeverFHWA does not clearly disclose the level of uncertainties in the HERSestimates Furthermore to derive a total estimate of highway investmentrequirements FHWA combines the HERS estimates with estimates forother types of highways and investments that are not based on benefit-costanalyses As a result the reportrsquos readers are not likely to be aware of theimprecision of the HERS estimates and the fact that only part of the totalhighway investment requirements is estimated on the basis of anassessment of the benefits and costs of alternative improvement options
Page 5 GAORCED-00-133 FWHArsquos HERS Model
B-284060
This report makes recommendations to improve the modelrsquosapproximation of the future lifetime benefits of highway improvements andFHWArsquos disclosure of some of the uncertainties associated with the modelrsquosestimates in its report to the Congress DOT generally agreed with theserecommendations
Background DOT submits biennial reports to the Congress detailing the state of thenationrsquos highways bridges and other surface transportation systems TheConditions and Performance Report to Congress known as the CampPReport fulfills the mandate1 for a report on future highway investmentrequirements that the Congress first established in 1965 The reportsinclude forecasts of investment requirements for the nationrsquos highways andbridges over the following 20 years
FHWArsquos estimates of total highway and bridge investment requirements inthe CampP Report combine estimates derived from the HERS model a bridgemodel and other types of estimates The HERS model uses benefit-costanalyses to estimate future highway investment requirements on the basisof information about existing highways On the other hand the bridgemodel is based on engineering data and does not currently use benefit-costanalyses in estimating investment requirements for bridges In additionFHWA supplements these two estimates by including the cost of improvingthose highways not modeled in HERS These costs include estimates fornew highways highway classes not included in the HERS model andhighway-related requirements such as safety enhancements trafficoperation improvements and environmental improvements FHWAestimates these costs by assuming that they represent a fixed percentage ofthe combined HERS and bridge modelsrsquo estimate of investmentrequirements The percentages are based on data from 1997 highwayexpenditures Of the total highway and bridge average annual investmentrequirements identified in the CampP Report ($94 billion) only 51 percent arederived using the HERS model and its benefit-cost analyses The remaining49 percent are derived using either the bridge model or the fixed-percentage procedure See figure 1
1 See 23 USC section 502(g) and 49 USC section 308(e)
Page 6 GAORCED-00-133 FWHArsquos HERS Model
B-284060
Figure 1 FHWArsquos Projected Annual Highway and Bridge Investment Requirements1998 through 2017
Dollars in billions
Source FHWA 1999 CampP Report
The methodology FHWA uses to estimate highway investmentrequirements has changed since the first ldquowish listrdquo of estimates wassubmitted to the Congress in 1968 The earliest estimates simply collectedand reported investment requirements prepared by the states In the early1980s the agency designed an engineering model that identified highwaydeficiencies and estimated the cost to improve them on the basis ofengineering standards such as pavement deterioration and road designRecognizing that a benefit-cost approach combined with an engineeringmodel could yield a more defensible estimate of future investmentrequirements FHWA began developing the HERS model in 1988 Howeverthe agency used its engineering model exclusively to forecast highway
$479 bull HERS model estimates
$134bull
Highway classes not modeledin HERS
$146bull
New construction not modeled in HERS
$75Highway-related needs not modeled in HERS
$106
Bridge model estimates
bull
bull
Page 7 GAORCED-00-133 FWHArsquos HERS Model
B-284060
investment requirements until the 1995 CampP Report This reportincorporated one estimate based on HERS benefit-cost analyses and asecond estimate based on the engineering model approach Table 1 outlinesFHWArsquos efforts to estimate highway investment requirements According toFHWA officials the HERS benefit-cost approach complies with anexecutive order2 that requires federal spending for infrastructure to bebased on a systematic analysis of expected benefits and costs
The HERS model estimates investment requirements for 9 of FHWArsquos12 classes of roadsmdashthose that are included in the agencyrsquos database ofhighway conditions FHWA classifies public roads in the United States into12 categories Area categories include rural and urban highwaysFunctional categories are arterials collectors and local roads Arterialsallow the highest traffic speeds They often have multiple lanes and adegree of access control Collectors are designed for lower speeds andshorter trips They typically are two-lane roads that may extend intoresidential neighborhoods Local roads are any roads below the collectorsystem Other categories distinguish roads by significance criteria forexample interstate highways or major and minor traffic flows Figure 2shows which classes of roads are modeled in HERS
2 Executive Order 12893 Principles for Federal Infrastructure Investments (1994)discusses the importance of continuous infrastructure investment to sustained economicgrowth The order directs federal agencies with infrastructure investment responsibilities toplan for investments using a systematic analysis of expected benefits and costs
Table 1 Development of Highway Investment Requirements Report and FHWArsquosModels
Early 1980s FHWA designs model to estimate highway investment requirementsusing engineering standards
1988 to 1994 FHWA develops HERS model adding economic analyses toengineering-based estimates
1995 First CampP Report to include HERS results
1999 First CampP Report with environmental costs of vehicle emissionsincluded in HERS results
Page 8 GAORCED-00-133 FWHArsquos HERS Model
B-284060
Figure 2 FHWArsquos Road Classification System
Source GAO analysis of FHWA information
From fiscal years 1995 through 1999 FHWA spent a total of $24 million onHERS support contracts In 1999 FHWA spent a total of $677345 onexpenses related to the HERS model For example FHWA contracted todevelop revised pavement information at a cost of $150986 In additionFHWA spent $350000 on HERS support for the 1999 CampP Report ongoingmaintenance and operation of the model and a study on the needs of theinterstate highway system
Rural interstates
Rural otherprincipal arterials
Rural minor arterials
Rural major collectors
Rural minor collectors
Rural local roads
Urban interstates
Urban freeways andexpressways
Urban otherprincipal arterials
Urban minor arterials
Urban collectors Urban local roads
Rural roads
Urban roads
Arterials Collectors
Arterials Collectors
Local roads
Local roads
FHWA uses HERS to project needs
for these highways
FHWA uses non-HERSmethods to project
needs for these highways
KEY
Page 9 GAORCED-00-133 FWHArsquos HERS Model
B-284060
The HERS Model UsesBenefit-Cost Analysesto Estimate HighwayInvestmentRequirements
To estimate future investment requirements3 the HERS model uses anextensive set of data on segments of highways throughout the nation toconduct benefit-cost analyses The HERS model uses these data to forecastthe condition and performance (congestion) of the highway segments overthe following 20 years and to evaluate whether improving the segments iseconomically justified The HERS model evaluates potential improvementson each segment by comparing their construction costs with their benefitsincluding reductions in travel times vehicle operating costs and accidentsto determine whether an improvement is warranted FHWA uses the HERSmodel to estimate highway investment requirements under severaldifferent scenarios
The HERS Model Relies onExtensive Data
To estimate investment requirements the HERS model uses a database ofinformation about highway conditions and performance submitted by thestates Using guidance developed by FHWA each state collects andannually updates data on a sample of highways representing nine highwayclasses These data include factors like highway capacity average annualdaily traffic pavement roughness and lane width In total the states collectand report to FHWA information on about 125000 highway segmentsranging in length from one block to 10 miles The states also developforecasts of traffic growth on each segment The HERS model usesldquoexpansionrdquo factors to generalize the estimated improvement costs forsegments to the highway classes they represent
In addition to the state-collected data the HERS model uses otherinformation that FHWA derives from various economic studies Forexample in estimating the benefits associated with highwayimprovements the HERS model counts as a benefit any reduction in traveltime brought about by the highway improvement In making thiscalculation FHWA uses hourly compensation data from the Department ofCommercersquos Bureau of Labor Statistics to quantify the dollar value of traveltime saved by travelers on work-related trips In addition as currentlymodeled in HERS highway improvements increase net traffic and hencetotal vehicle emissions As a result the HERS model subtracts the dollarvalue of the air pollution damages caused by vehicle emissions from the
3 In using ldquoinvestment requirementsrdquo we are referring to the HERS modelrsquos estimates ofaverage annual infrastructure improvement costs for the nine highway classes included inthe model
Page 10 GAORCED-00-133 FWHArsquos HERS Model
B-284060
benefits of making an improvement FHWA obtains emissions data forseveral classes of vehicles from the Environmental Protection Agency(EPA) FHWA also obtains dollar estimates from the economic literaturefor the human health and property damages caused by specific pollutants
The HERS Model Evaluatesthe Relative Benefits andCosts of AlternativeImprovement Options
The HERS model simulates the effects of infrastructure improvements forthe highways it models by comparing the relative benefits and costsassociated with alternative improvement options4 The HERS model beginsby assessing the current condition of the highway segments in the datasample The model then projects the future condition and performance ofthe segments based on expected changes in factors such as trafficpavement condition and average speed Performance is measured in termsof highway congestion The model makes its projections in four 5-yearincrements (funding periods) for a total of 20 years
Figure 3 provides a simplified representation of the modeling process Themodel compares each segmentrsquos future condition with FHWA criteria forhighway deficiencies for factors such as pavement condition congestionand lane width For each segment identified as deficient (not meeting thecriteria) the model assesses the relative costs and benefits associated withalternative improvement options to determine whether improving thesegment is economically justified The options range from resurfacing thepavement to completely reconstructing the road and adding lanes
Figure 3 Simplified Representation of the HERS Modeling Process
Source FHWA
4 FHWA documented the modelrsquos specifications in its draft report entitled HighwayEconomics Requirements System Technical Report (US Department of TransportationFederal Highway Administration 1999)
Identifydeficient
segments
Assemble highway
data (traffic forecastshighway
conditions etc)
Forecast future
condition and performance of segments
Identify economically
justified improvements for deficient segments
Select and implement segment
improvements
Extrapolate segment
improvementcosts todevelop
investment requirements
Page 11 GAORCED-00-133 FWHArsquos HERS Model
B-284060
The HERS model calculates costs as the capital expenditures required toconstruct the improvement and calculates the benefits as reductions infactors like travel time vehicle operating costs and accidents over thelifetime of the improvement For example adding lanes in congested areascan be beneficial because the increased capacity can reduce travel timesand operating costs5 Future benefits are discounted to the present6 TheHERS model selects for implementation those improvements that areeconomically justified including those improvements for which theestimated benefits exceed the cost of constructing the improvement(positive net benefits) To estimate the investment requirements for thehighways it models the HERS model uses ldquoexpansionrdquo factors to generalizesegment improvement costs to the nine highway classes included in themodel The expansion factors enable the HERS model to relate informationabout the sampled segments to the highway classes they representInvestment requirements for the combined highway classes are obtained byadding together the estimates for the nine different classes Appendix IIdescribes the structure of the HERS model
The HERS Model EstimatesHighway InvestmentRequirements for SeveralDifferent Scenarios
FHWA uses the HERS model to forecast the investment requirements forthe highways represented in the model on the basis of several differentscenarios For example under the ldquoeconomic efficiencyrdquo scenario theHERS model selects for implementation those improvements that havepositive net benefits (benefits minus costs) The investment requirementsunder this scenario are about $48 billion per year from 1998 through 2017Similarly under the cost to ldquomaintain current (pavement) conditionsrdquoscenario the HERS model selects for implementation the least costly mixof improvements that would maintain average pavement conditions at 1997levels over the forecast period Under this scenario the investmentrequirements are about $29 billion per year In addition to these scenariosFHWA estimates the investment requirements for maintaining current
5 The HERS model also uses ldquoprice elasticityrdquo to assess the behavioral response of drivers tochanges in the cost of traveling on the highway Price elasticity mitigates to some extent thebeneficial aspect of making highway improvements For example because improving asegment lowers travel costs some drivers may respond by driving more frequently As aresult traffic on the improved segment may increase more quickly than anticipatedreducing the future benefits of the improvement
6 Discounting accounts for the fact that in general one dollar today is worth more than onedollar a year from now
Page 12 GAORCED-00-133 FWHArsquos HERS Model
B-284060
(1997) levels of travel time and vehicle user costs See table 2 for the HERSestimates representing the different scenarios
Table 2 The HERS Modelrsquos Estimates for Highways
Note Dollars are 1997 dollars These estimates reflect only the HERS portion of FHWArsquos estimates ofhighway investment requirements
Source FHWArsquos 1999 CampP Report
The HERS Model HasStrengths andLimitations
The HERS model has several strengths that make it a unique andreasonable tool for estimating a general level of the nationrsquos highwayinfrastructure requirements A major strength of the model is its ability toassess the relative benefits and costs associated with alternative optionsfor making improvements on the nationrsquos highways We found no othertransportation model that could assess benefits and costs of alternativeimprovement options at the national level In addition FHWA has convenedexpert panels to assess the reasonableness of the HERS methodology andhas made some changes to the model in response to recommendationsfrom the panels The model also has several limitations First it does notcompletely account for the interrelationships between all highways anddifferent transportation modes such as how traffic is redistributed asimprovements are made Second it does not fully account for theuncertainties associated with its methods data and assumptions Third itrelies on a computational ldquoshortcutrdquo to approximate the future lifetimebenefits of an improvement even though this is no longer necessaryFinally it uses data that vary in quality Although the net effect of thelimitations on the HERS estimates cannot be determined FHWA is takingsteps to mitigate some of these limitations
Dollars in billions
ScenarioHERS forecast of
annual costs
Economic efficiency $479
Maintain current travel times 391
Maintain current vehicle user costs 311
Maintain current pavement conditions 294
Page 13 GAORCED-00-133 FWHArsquos HERS Model
B-284060
The HERS Modelrsquos MajorStrength Is Its Applicationof Benefit-Cost Analyses inAssessing HighwayInvestments
The HERS modelrsquos major strength is its ability to assess the relativebenefits and costs associated with potential improvements in the nationrsquoshighways This is a significant improvement over FHWArsquos previousmethods which used engineering standards to identify deficiencies andselect improvements without regard to economic merit By contrast theHERS model selects for implementation only those improvements that areeconomically justified We found no model other than HERS that is capableof applying benefit-cost analyses in estimating investment requirements ata national level For example the World Bankrsquos Highway Design andMaintenance Standards model is designed to be used at the project level Inaddition a model known as StratBENCOST uses benefit-cost analyses toevaluate state and local highway projects7
Another strength of the HERS model is that FHWA has consulted withexperts in order to assess the modelrsquos reasonableness and improve it Forexample in June 1999 FHWA convened an expert panel consisting ofeconomists and engineers from the public and private sectors This panelfound that FHWA has strengthened the model over time and that the recentrefinements have increased its applicability and credibility
FHWA has also instituted several procedures to make the state-provideddata for the HERS model as reasonable as possible For example FHWAperiodically conducts workshops to inform state transportation officialsabout changes to the database used by the HERS model and FHWA staffare available to conduct additional training at the statesrsquo request Inaddition FHWA recently completed reassessing its database needs toeliminate unnecessary data items and reduce the statesrsquo data collectionburden Changes as a result of this reassessment became effective in 1999and the states will submit data reflecting these changes to FHWA in June2000 As a result of the reassessment FHWA identified the potential forreducing the number of sampled segments in the database to 80000 fromits current level of about 125000
The HERS Model Has SomeLimitations
Although the HERS model is a reasonable tool we noted that it has severallimitations First because the model analyzes each highway segmentindependently rather than the entire transportation system (collectively
7 StratBENCOST was developed by HLB Decision Economics Inc for the NationalCooperative Highway Research Program
Page 14 GAORCED-00-133 FWHArsquos HERS Model
B-284060
referred to as a network) it cannot completely reflect changes occurringamong all highways and modes in the transportation network at the sametime For example the HERS model does not capture the effect on trafficlevels of improving one highway segment while leaving neighboringsegments unimproved The HERS model incorporates information on howchanges in costs to users of vehicles affect the demand for travel (via ldquopriceelasticityrdquo) As a result FHWA officials assume that the HERS modelcaptures the net effect of all changes in the transportation network as wellas the overall economy However we did not find consensus among thetransportation modeling experts we interviewed that the HERS modelcompletely captures the net effect of all changes in the network Theimplication of this limitation is unclearmdashit may over- or under-estimate theeffect of changes in traffic resulting from a highway improvementNonetheless transportation modeling experts we talked to generally agreethat explicitly modeling the entire transportation network is not possiblewith the current state of the art in modeling or available data
Second because the HERS model is not designed to completely quantifythe uncertainties associated with its methods assumptions and data themodel cannot estimate the full range of uncertainties within which itsestimates vary As a result the precision of the modelrsquos estimates isunknown In making its estimates the HERS model relies on a variety ofestimating techniques and hundreds of variables all of which are subject tosome uncertainties Executive Order 12893 states that federal agencies inevaluating infrastructure investments should address uncertainty whenthe amount and timing of important benefits and costs are uncertain Forits CampP Report FHWA accounted for some uncertainties by conductingldquosensitivity analysesrdquo to measure how much the HERS estimates changewhen the value of certain key inputs or assumptions used in the model arechanged Nevertheless the sensitivity analyses do not account for all theuncertainties in the model We discussed this issue with one of the HERSmodelrsquos developers who indicated that according to his understanding ofthe model the uncertainty associated with the ldquosingle pointrdquo estimatescould range up to plus or minus 30 percent However changing the modelto fully account for uncertainties in its factors is not likely to be cost-effective because it could require extensive and expensive reprogramming
Third the HERS model uses a computational shortcut to approximate thelifetime benefits associated with an improvement Benefits and costsshould be measured over each improvementrsquos full lifetime 20 years ormore However in its initial evaluation of whether to improve a highwaysegment the HERS model calculates benefits such as reductions in travel
Page 15 GAORCED-00-133 FWHArsquos HERS Model
B-284060
time only during the first 5-year period To account for the benefitsaccruing after the first 5 years FHWA developed a shortcut that essentiallyuses an estimate of the improvementrsquos construction cost as a proxy for theimprovementrsquos remaining future benefits8 FHWA developed the shortcutseveral years ago when limitations in computer processing powernecessitated simplifying some of the calculations Several of thetransportation modeling experts we talked to question whether these costsare a reasonable approximation of future benefits Ideally the modelshould estimate the benefits associated with an improvement over its fulllifetime discounted to the present FHWA officials acknowledged that theshortcut is a limitation that is no longer necessary given recentimprovements in computer processing power
Fourth although FHWA has taken steps to ensure that the data used in theHERS model are reasonable some of these data vary in quality Forexample the HERS model relies on emissions data that some members ofFHWArsquos 1999 expert panel consider unrepresentative of actual conditionsTo estimate the emissions associated with traffic on a given segment themodel uses information from EPA on emissions rates per vehicle type andspeed Vehicle emissions however may depend more on how the vehicle isdriven than on the total miles driven FHWA officials told us they recognizethat the emissions data may not reflect actual conditions but included thedata to approximate the environmental effect of highway travel EPA iscurrently revising these emissions data
In addition we reported earlier that the pavement roughness data reportedby the states to FHWA are not comparable partly because the states usedifferent devices to measure roughness9 The HERS model uses theroughness data in projecting the pavement condition of each segmentMoreover some of the information used in the model is dated Forexample the pavement resurfacing costs used in the HERS model arebased on 1988 data (adjusted for inflation from 1988 to 1997)
Finally to project the future condition of the pavement the HERS modeluses information that does not fully capture the range of environmental
8 With this shortcut the HERS model assumes that the remaining future benefits of animprovement can be approximated by the costs that would be avoided by making theimprovement in the current 5-year period See appendix II for more information
9 Transportation Infrastructure Better Data Needed to Rate the Nationrsquos HighwayConditions (GAORCED-99-264 September 27 1999)
Page 16 GAORCED-00-133 FWHArsquos HERS Model
B-284060
conditions affecting the nationrsquos highways10 To account for the effect ofclimate on pavement condition for instance the model assumes allsegments face freezing and thawing conditions However segments inwarm and drier areas of the country rarely face freezing or thawingconditions and FHWA officials acknowledged that the pavementinformation does not completely account for these conditions Althoughthe effect of the variability in the quality of the data has not beendetermined it reduces confidence in the overall precision of the HERSestimates
FHWA Plans to Improve theHERS Model
FHWA recognizes that the HERS model has some limitations and is takingsteps to improve it For example FHWA officials said they plan to revisethe emissions data used in the HERS model as soon as EPA finishesrevising its emissions model In addition FHWA plans to update thepavement resurfacing costs currently based on 1988 data to represent1998 or 1999 costs FHWA also has contracted with one of the modelrsquosdevelopers to incorporate varied pavement performance information basedon different climate zones throughout the country instead of assuming oneclimate as is now done FHWA officials also expressed interest in revisingthe model to eliminate the computational shortcut used to approximatebenefits They said that as of March 2000 FHWA has not yet contracted tomake this improvement Furthermore beginning this fiscal year they planto modify the HERS model to incorporate the effects of user fees such asmotor fuel taxes into the modelrsquos assessment of the benefits and costs ofalternative highway improvements
In addition FHWA is currently developing a state-level ldquoprototyperdquo of theHERS model in order to provide the states with the ability to forecast state-level highway investment requirements FHWA is incorporating into themodel selected features from customized versions of the HERS modeldeveloped for transportation officials in Indiana and Oregon by a privatecontractor After the development of the state-level prototype is completeFHWA will provide the model to a limited number of states as part of a pilotprogram to determine the usefulness of the model for state-level highwayplanning
10 HERS uses a pavement deterioration ldquosubmodelrdquo to forecast pavement condition Seeappendix II
Page 17 GAORCED-00-133 FWHArsquos HERS Model
B-284060
HERS Estimates CanBe a Useful Tool to AidDecisionmaking butHave Limits
HERS estimates are useful as a general guide for the investmentrequirements of the nine highway classes represented in the model Inaddition the HERS estimates developed for the ldquoeconomic efficiencyrdquoscenario can be useful for assessing the relative requirements of thehighway classes over time Congressional and federal agency officials toldus they use the estimates as an overall indicator of highway needsHowever the limitations and inherent uncertainties associated withmaking forecasts prevent these estimates from being a precise forecast ofinvestment requirements In addition because the current version of theHERS model was designed to estimate investment requirements at thenational level the estimates derived from this model should not be used toproject investment needs for particular highway projects Finally aspresented in the 1999 CampP Report the uncertainties associated with theHERS estimates are not highlighted and the HERS estimates are combinedwith other estimates that are not based on an assessment of the relativebenefits and costs of alternative improvement options
HERS Estimates Are Usefulas a General Guide forInvestment Requirements
In general the HERS estimates provide legislative and executive branchofficials one source of information to use for decisionmaking Legislativeand executive branch officials told us that they use the estimates in theCampP Report to obtain general information on the nationrsquos need forinfrastructure investments Legislative branch officials told us that HERSestimates are more useful than previous estimates that were based onengineering analyses alone Furthermore different groups may use theHERS estimates in funding debates For example according to an FHWAofficial construction industry interests could use the higher investmentscenario estimate to show legislators a need for a higher level of highwayfunding
In addition to serving as a general guide the HERS estimates for theeconomic efficiency scenario can be useful in assessing the relativeinvestment requirements over time for the nine highway classesrepresented in the model Adjusting for inflation and changes in the modelrsquosformulas assumptions and data between reports the HERS estimatesfrom different reports can be compared to assess whether investmentrequirements are increasing decreasing or remaining the same Forexample using data developed for the 1995 CampP Report and the currentCampP Report FHWA found that the average annual highway investmentrequirements increased slightly from $461 billion to $479 billion (1997dollars)
Page 18 GAORCED-00-133 FWHArsquos HERS Model
B-284060
Although the HERS model provides a general estimate of the highwayinvestment requirements in our view it is important that the model not beused for other than its intended purpose First while some federal officialshave expressed an interest in using the HERS model to determine whichhighway projects should receive funding the current version of the HERSmodel was developed to estimate investment requirements nationwide Asa result the estimated investment requirements generated by the HERSmodel should not be used for project-level estimates
Second federal decisionmakers we spoke with expressed an interest inretrospectively comparing actual highway investments by the states withthose forecast by the HERS model This comparison could be misleadingbecause states may base their highway improvement decisions on criteriaother than those used in the HERS model For example under theeconomic efficiency scenario the model implements only thoseimprovements that are economically justified (that have positive netbenefits) However some states may fund highway improvements thatwould not pass the same economic test For example states may improve ahighway in an economically disadvantaged area in an attempt to fostereconomic development
Third although comparing the HERS estimates developed for theeconomic efficiency scenario in successive CampP Reports can be usefulmaking the same comparison using the HERS estimates for the maintaincurrent conditions scenario could be misleading Currently the data usedby the HERS model to establish the current condition of the highwaysystem are updated every year Because the HERS model uses the currentcondition of the highway system as a ldquobaselinerdquo in projecting futureinvestment requirements the HERS estimates for the maintain currentconditions scenario can be influenced by the prior level of state spendingFor example if state spending on highway improvements declines relativeto estimated investment requirements the condition of the highway systemmight also decline The subsequent HERS projection would be based on anew baseline reflecting a decline in the condition of the highway systemfrom the previous period Moreover the estimated investmentrequirements required to maintain the new current condition into thefuture would also decline since less investment would be required tomaintain a more deteriorated condition Such a decline in estimatedinvestment requirements over time however might be misconstrued toindicate that the condition of the highway infrastructure is improvingwhen in fact it would indicate a decline in the baseline condition
Page 19 GAORCED-00-133 FWHArsquos HERS Model
B-284060
HERS Estimates Could beMore Clearly Presented
As we discussed the HERS model has several limitations that affect itsability to precisely estimate investment requirements Furthermoreforecasting highway investments using computer models is by its nature aninexact science and a model cannot capture all the complexities oftransportation systems Although FHWA conducted sensitivity analyses toquantify some of the uncertainties associated with the HERS estimatesdeveloped for its 1999 CampP Report the report does not highlight the resultsof these analyses For example FHWA found that increasing its trafficgrowth assumption by 315 percent increased the HERS estimate by about17 percent from $479 billion to $561 billion (see fig 4) The change in theassumption represented actual average annual growth from 1977 to 1997However because the CampP Report presents the HERS estimates as single-point estimates and the results from the sensitivity analyses are presentedin a separate chapter later in the report the range of uncertaintiesdisclosed by the sensitivity analyses may not be evident to the reader Seeappendix III for additional results from sensitivity analyses
Figure 4 Sensitivity of HERS Estimate to Changes in Certain Assumptions
Source FHWA
Note Dollars are 1997 dollars Results are for the economic efficiency scenario and represent theeffect of changes in certain assumptions used in the HERS model For example the overall averageannual growth in traffic in terms of vehicle miles traveled was increased by 315 percent the discount
1997 dollars in billions
0
10
20
30
40
50
60
479
561
506
430
HERSestimate
Overalltraffic
Discount rate
Urbantraffic
Page 20 GAORCED-00-133 FWHArsquos HERS Model
B-284060
rate was lowered from 7 to 4 percent and the average annual growth in traffic in the largest urbanizedareas was decreased by 100 percent (to no growth) In terms of the latter assumption about29 percent of the estimate represents highway improvements in the largest urbanized areas
In addition when reporting on investment requirements for highways andbridges the CampP Report did not clearly disclose that its estimates are onlypartially modeled using benefit-cost analyses Specifically only 51 percentof the reported investment requirement is based on the HERS model and itsbenefit-cost analyses The other 49 percent which consists of bridges andnon-modeled factors such as the construction of new highways is notbased on the same methodology and thus has not been proven to beeconomically justified As a result the estimates are technically notcomparable In addition FHWA views the highway investmentrequirements estimated outside the HERS model as less reliable Althoughthe CampP Report presents the estimates relating to highways and bridgesseparately it combines the HERS-modeled estimates with the non-modeledestimates Thus as currently presented it may not be evident to the readerthat only a portion of the total highway investment requirements is basedon benefit-cost analyses and as a result is economically justified (See fig 1for an analysis of these estimates)
Conclusions In developing the HERS model to forecast the investment requirements forthe nationrsquos highways FHWA has taken steps to enhance the modelrsquosintegrity and rigor Furthermore because the model incorporates benefit-cost analyses in selecting potential highway improvement projects forinclusion in its estimates it is a significant improvement over previousmethods which used engineering standards to identify highwaydeficiencies and estimated the cost of correcting these deficiencies withoutregard to economic merit The HERS model selects those improvementsthat are economically justified and as a result provides the Congress with amore useful and realistic estimate Although FHWA significantly improvedupon the analytical rigor of previous methods by incorporating benefit-costanalyses the HERS model has some limitations that affect the precision ofits estimates
While not all the limitations in the HERS model can be addressed becauseof the inherent complexities of modeling FHWA is taking steps to improvethe model FHWA has expressed interest in changing the model toeliminate the shortcut for calculating an improvementrsquos lifetime benefitsbut has not established a timeframe for this change It is also planning toimprove the modelrsquos information on pavement performance and costFHWA could present the modelrsquos estimates more effectively in its CampP
Page 21 GAORCED-00-133 FWHArsquos HERS Model
B-284060
Report to help the reportrsquos readers be aware of the full extent of the caveatsand uncertainties associated with the estimates In particular FHWA couldhighlight the uncertainties associated with the HERS estimates as indicatedby its sensitivity analyses so that readers of the report do not believe theestimates are more precise than they actually are Finally FHWArsquos CampPReport generally presents an overall estimate of all highway investmentrequirementsmdashcombining the HERS estimates with other estimates thatare developed using less rigorous methods The report could highlight thedifference between these estimates and note that FHWA has moreconfidence in the HERS-generated estimates
Recommendations In order to ensure that the HERS model achieves its objectives and that thelimits of its estimates and the estimates presented in future conditions andperformance reports are disclosed we recommend that the Secretary ofTransportation direct the Administrator of FHWA to
bull establish a timeframe for revising the HERS model in order to accountfor the expected lifetime benefits that are associated with alternativehighway improvement options
bull clarify when presenting the HERS estimates that there areuncertainties associated with the estimates and refer readers to thesensitivity analyses performed on the HERS model that illustrate theseuncertainties and
bull explain in the report that one portion of the estimate for highwayinvestment requirements is from the HERS model and is based onbenefit-cost analyses and that the other portion was calculated usingless reliable methods as well as the percentage that each of theseportions constitutes of the overall estimate
Agency Comments andOur Evaluation
We provided a draft of this report to the Department of Transportation forreview and comment We met with Department officials including theTeam Leader for Highway Needs and Investment Planning in the FederalHighway Administration These officials generally agreed with the findingsand recommendations in this report With regard to the recommendation toestablish a timeframe for accounting in the model for the expected lifetimebenefits of highway improvements the Department plans to eliminate thecomputational shortcut it uses to approximate future lifetime benefits intime to prepare estimates for the CampP Report it will issue in 2003 Inresponse to the recommendation to clarify the uncertainties associated
Page 22 GAORCED-00-133 FWHArsquos HERS Model
B-284060
with HERS estimates the Department plans to expand its use ofuncertainty analysis beyond the analysis in the 1999 report for the CampPReport for 2001 in order to provide a more complete discussion of thisissue Finally in response to the recommendation to distinguish betweenHERS model estimates and other less reliable estimates the Departmentplans to clarify and enhance its discussion of these differences in the CampPReport for 2001 including a figure similar to our figure 1 In addition theDepartment will work to expand the scope of HERS to consider more typesof highway deficiencies and solutions to address them in order to reducethe percentage of estimates using these less reliable methods TheDepartment also provided technical and clarifying comments which weincorporated into the report as appropriate
We conducted our review from September 1999 through April 2000 inaccordance with generally accepted government auditing standards
We will send copies of this report to cognizant congressional committeesthe Honorable Rodney E Slater Secretary of Transportation and theHonorable Kenneth R Wykle Administrator Federal HighwayAdministration
If you or your staff have any questions about this report please contact meat (202) 512-2834 Appendix IV lists key contacts and contributors to thisreport
John H Anderson JrDirector Transportation Issues
Page 23 GAORCED-00-133 FWHArsquos HERS Model
Appendix I
AppendixesScope and Methodology AppendixI
To assess the reasonableness of the Highway Economic RequirementsSystems (HERS) modelrsquos assumptions and data and the usefulness of themodelrsquos results we reviewed the Principles for Federal InfrastructureInvestments (Executive Order 12893) the Federal HighwayAdministrationrsquos (FHWA) June 1999 expert panelrsquos comments on the HERSmodel and several FHWA reports and documents on the HERS model from1994 through 1999
In addition we discussed the HERS methodology with FHWA economistsand engineers and two of the FHWA contractors that helped develop themodel Moreover we interviewed users of the HERSrsquo results includinglegislative and executive-branch officials several members of the June1999 HERS expert panel and other transportation modeling experts (seelist of names below) We attended the June 1999 expert panel meeting aswell as an FHWA-sponsored outreach meeting on the Conditions andPerformance Report (CampP Report) in November 1998 We used standardeconomic principles to evaluate the modelrsquos application of benefit-costanalyses and the key economic assumptions used in the model and weasked FHWA to provide us with results for sensitivity analyses conductedusing alternative values for price elasticity and the discount rate Inaddition we reviewed the methods used by other transportation models toassess highway investments
To assess the reasonableness of the data used in the HERS model wereviewed technical documents supporting the primary source of datamdashtheHighway Performance Monitoring System (HPMS) database In additionwe discussed the reliability of the HPMS data with FHWA officialsincluding the Chief of Highway Systems Performance Because FHWA usesa ldquopreprocessorrdquo to convert the HPMS data into a HERS input data file wereviewed the actions performed by the preprocessor to assess whether thevalues of the data elements in HPMS are consistent with those in the HERSinput data file To do this we asked FHWA to provide us with basicstatistics and frequencies for several key data elements in the HPMSdatabase both before and after the data were converted by thepreprocessor The data included average annual daily trafficsurfacepavement type weighted design speed peak and off-peak percentof vehicles with greater than four tires speed limit and wideningfeasibility For most of the data items the actions of the preprocessorproduced at most minor changes in a very small percentage of the dataelements For the data items for which the actions of the preprocessoraffected a larger percentage of the data elements we asked FHWA toconduct a sensitivity analysis in order to assess the effect of changes in the
Page 24 GAORCED-00-133 FWHArsquos HERS Model
Appendix I
Scope and Methodology
data items on the HERS estimates using the maximum economic efficiencyscenario We found that changes in these data items did not markedlychange the HERS estimates See appendix III for the results of thesesensitivity analyses
In August 1987 we reported on our review of FHWArsquos HPMS samplingplan1 We found it to be statistically reasonable for selecting highwaysections nationally For our current effort we reviewed FHWArsquos currentguidance which the states use to sample segments and found it consistentwith the guidance we reviewed in 1987
The individuals we contacted include the following experts
bull Adjo Amekudzi Assistant Professor of Civil and EnvironmentalEngineering Georgia Institute of Technology
bull Kenneth D Boyer Professor of Economics Department of EconomicsMichigan State University
bull Gregorio Camus Programmer Battelle Memorial Institutebull David J Forkenbrock Professor of Civil and Environmental
Engineering and Chair Public Policy Center University of Iowabull David Greene Economist Oak Ridge National Laboratorybull Chris Hoban Principal Highway Engineer The World Bankbull Douglass Lee Principal Investigator Volpe National Transportation
Centerbull Sue McNeil Professor of Civil and Environmental Engineering Carnegie
Mellon Universitybull Mike Markow Cambridge Systematicsbull Michael Meyer Professor and Chair School of Civil and Environmental
Engineering Georgia Institute of Technologybull Carl L Monismith Robert Horonjeff Professor of Civil and
Environmental Engineering and Professor in the Graduate SchoolUniversity of California at Berkeley
bull Arlee Reno Engineer Cambridge Systematicsbull Herb Weinblatt Principal Cambridge Systematics
1 Highway Needs An Evaluation of DOTrsquos Process for Assessing the Nationrsquos HighwayNeeds (GAORCED-87-136)
Page 25 GAORCED-00-133 FWHArsquos HERS Model
Appendix II
Description of the HERS Model AppendixII
This appendix describes the basic structure of the HERS computer modelThe HERS model simulates infrastructure improvement decisions for thehighways it models by comparing the relative benefits and costs associatedwith alternative improvement options In conducting its analysis HERSuses an extensive set of data that are primarily collected and updated bythe states and maintained by FHWA in the HPMS database In addition theHERS model consists of several submodels representing specific highwayprocesses including traffic growth pavement wear vehicle speedaccidents and highway improvement costs The analysis which is basedon the current condition of the highway system is conducted over four 5-year periods for a total of 20 years Information from the submodels isused to identify deficient segments evaluate alternative improvementoptions and select and implement improvements HERS uses benefit-costratios (benefits divided by costs) to evaluate and select improvementsunder several investment scenarios The costs are the capital expendituresnecessary to construct the improvement and the benefits includereductions in usersrsquo operating costs agency maintenance costs and theldquoresidual valuerdquo of an improvement Residual value represents the benefitsexpected to accrue over the future life of an improvement beyond theanalysis period used in the model HERS uses a computational shortcut toestimate residual value
Page 26 GAORCED-00-133 FWHArsquos HERS Model
Appendix II
Description of the HERS Model
HERS Uses anExtensive Data Set
HERS uses input data that are created from the HPMS database and severalparameter and control files HPMS consists of all the data collected andupdated by the states on about 125000 randomly selected highwaysegments across the United States ranging in length from one block to 10miles The parameter and control files include information such asdeficiency and design standards and basic instructions for the modelThese data are converted to a HERS input file by a separate model calledthe ldquopreprocessorrdquo which aggregates all the data and performs variousdata manipulations For example the preprocessor assigns a speed limit of75 mph to segments with no legally mandated maximum speed limit and itconverts the International Roughness Index data developed by the states toa ldquomodifiedrdquo Present Serviceability Rating (PSR) index1 See figure 5 for arepresentation of the process used to create the HERS input data
1 The HERS pavement deterioration submodel was not designed to use the InternationalRoughness Index (IRI) so the preprocessor converts the IRI data to a ldquomodifiedrdquo PSR Theconversion is based on formulas developed by Al-Omari and Darter in RelationshipsBetween IRI and PSR Department of Civil Engineering University of Illinois 1992 Both IRIand PSR are measures of pavement condition but IRI strictly measures surface roughnesswhile PSR incorporates other types of pavement distress and may be based on professionaljudgement IRI is measured by a moving vehicle using non-contact sensors such as lasers
Page 27 GAORCED-00-133 FWHArsquos HERS Model
Appendix II
Description of the HERS Model
Figure 5 Schematic of Pr ocess Used to Create HERS Data
Source FHWA data
Developed in 1978 as a national highway transportation system databaseHPMS is a nationwide inventory system that includes limited data on allpublic roads and more detailed data for a sample of highway segmentsrepresenting nine different highway classes The sampled data includeinformation on highway capacity average annual daily traffic pavementroughness and lane width In addition to the sample data the states arerequired to report certain basic inventory information for all public roadsthat are open to traffic including an inventory of roads by highway classThe states also develop traffic forecasts for each segment In addition theHERS model uses ldquoexpansionrdquo factors to extrapolate the cost estimates tothe highway classes represented by the segments The expansion factorsare calculated by the HMPS software the states use to submit the data toFHWA
Overall the HPMS database includes nearly 100 variables According toFHWArsquos Chief of Highway Systems Performance the most accurate data inthe HPMS database are variables that are directly measurable such as thelength of the highway section number of lanes in the section and speedlimit By contrast the least accurate data are variables that are open tointerpretation by state personnel such as whether it is feasible to widen a
HERS preprocessor
HPMSdata file
HERS input data file
HERS model
Other data (parameter and control files)
Other data (parameter and control files)
Page 28 GAORCED-00-133 FWHArsquos HERS Model
Appendix II
Description of the HERS Model
segment and the estimated percent of trucks traveling in peak and off-peakperiods For example in assessing whether a segment can be widened onestate may view the potential high costs of widening as a detriment whileanother state may not In addition the states generally estimate the percentof trucks traveling during peak and off-peak periods from classificationcounts taken in a limited number of locations and of varying times anddurations
FHWA developed an HPMS field manual for the states to use in samplinghighway segments and identifying which data items to collect and how tomeasure them The sampling plan requires the states to select stratifiedrandom samples where the strata represent different volume groups fordifferent highway classes in the rural small urban and urbanized areas ofeach state Estimates of average annual daily traffic are based on volumecounts on each segment Since each state selects its own sampleimplementation of the sampling plan may vary
FHWA has instituted some measures to improve the reasonableness of theHPMS data FHWA provided the states with software they can use toassemble edit and submit their HPMS data This software automaticallyperforms checks for basic validity and missing data Once the states edittheir data they run an expansion subroutine that places an expansionfactor in each sample segmentrsquos record that is used to expand sample datato the full functional system Once FHWA receives the data from the statesthe data are passed through a software program that conducts basic logicchecks searches for anomalies and reviews the distributions of sample-related items FHWA staff review all items flagged during this check FHWAworks closely with the states to obtain answers to its questions concerningthe HPMS data Nonetheless the potential for some variability in HPMSdata remains because of potential differences in data collection techniquesamong the states
In addition from December 1996 through December 1998 FHWAreassessed its database needs in an effort to eliminate unnecessary dataitems and reduce the statesrsquo data collection burden2 As part of this effortFHWA conducted public meetings with state officials to obtain their viewson a future focus for the HPMS database As a result of the reassessmentFHWA will make significant changes to the HPMS database FHWA
2 Highway Performance Monitoring System Reassessment Final Report Revised April 1999FHWA-PL-99-001
Page 29 GAORCED-00-133 FWHArsquos HERS Model
Appendix II
Description of the HERS Model
changed the HPMS field manual and software to guide the states in makingneeded changes For example FHWA decided to delete some data that thestates have collected in the past but that it determined are no longerneeded such as the number of interchanges on segments In additionFHWA ldquocollapsedrdquo some data items into fewer categories to reduce stateofficialsrsquo time spent in collecting data For example the variable describingthe surface or pavement type was reported in 15 categories many of whichwere of little use so these were reduced to 6 categories In addition tothese changes the FHWA reassessment identified the potential forreducing the HPMS sample from over 125000 segments to 80000 segmentsto help reduce the statesrsquo data collection burden The states beganimplementing the changes during their data collection efforts in 1999 andwill report the revised data to FHWA by June 2000
The HERS input data and additional parameter and control data are usedby the HERS model to assess the relative benefits and costs of makinghighway improvements The post-preprocessor parameter and control datainclude information that is independent of specific segments such astravel-time costs widening feasibility criteria and the discount rate
The HERS model consists of several submodels representing specifichighway processes such as traffic growth pavement wear operating costsemissions costs and highway improvement costs The submodels are usedto project the future condition and performance of the highway systemwith and without improvements (for example the baseline) for eachfunding period and each segment3 In addition the benefits associated withmaking highway improvements are estimated using several submodelslinked together Benefits are defined as reductions in user costs (traveltime safety vehicle operating costs) and agency maintenance costs Inaddition the ldquoresidual valuerdquo of an improvement is considered to be abenefit The implementation costs associated with making improvementsare estimated using an improvement cost submodel The information fromthe submodels is used to evaluate the benefits and costs of alternativeimprovement options and select for implementation improvements thatare economically justified See figure 6 for a simplified representation ofthe structure of the HERS model
3 In some analyses the baseline is a less ldquoaggressiverdquo improvement rather than noimprovement at all
Page 30 GAORCED-00-133 FWHArsquos HERS Model
Appendix II
Description of the HERS Model
Figure 6 Simplified Representation of the Structure of the HERS Model
Source FHWA data
Travel forecast
Forecast pavement condition
Forecast vehicle speed
Estimate improvement
costs
Estimate costs (travel time
operating safety emissions etc)
Evaluate and select
improvements for implementation
Page 31 GAORCED-00-133 FWHArsquos HERS Model
Appendix II
Description of the HERS Model
The travel forecast submodel projects traffic growth on each segmenttaking into account the price elasticity of travel demand For each segmentthe submodel uses information on the amount of current traffic (averageannual daily traffic) initial price of travel (user costs including operatingand travel time and safety costs) the statersquos traffic growth projection andprice elasticity to project future traffic volume in each funding periodPrice elasticity measures the effect of changes in travel costs on traveldemand4 Because there are no empirical estimates of elasticity withrespect to total travel demand FHWA uses a range of information onelasticities for the components that constitute total travel demandincluding the price of fuel vehicle wear tolls parking and travel timeFHWA constructs a total demand elasticity taking into account theseeffects as well as the share of each component in the total price of travelFor the 1999 CampP Report the HERS model uses a price elasticity of minus10 forthe short run (over one funding period) and minus16 for the long run (see appIII for sensitivity analysis results using minus15 and minus20 for the short- and long-run values respectively) The output of the travel forecast submodelmdashadjusted traffic growthmdashserves as an input in the pavement deteriorationspeed and accident submodels For example increases in traffic growthcan cause additional pavement wear and reduce average vehicle speed
The pavement deterioration submodel is used to measure the effect oftraffic and the environment on the future condition of the pavement Ingeneral this submodel uses adjusted traffic growth to project the effect oftraffic on a segmentrsquos future pavement condition in terms of its PSR PSR isa measure of pavement condition ranging from 0 (very poor or extremelydeteriorated pavement) to 50 (very good or smooth pavement) Inestimating future PSR the submodel relies on equations that were derivedin one climate zone (ldquowetfreezerdquo)5 To account for the effect ofenvironment on pavement wear the submodel assumes a minimumdeterioration rate In general the minimum rate is a function of the time thepavement was last improved and its maximum life span (from 25 to 40years depending on the type of pavement) Output from the pavement
4 More specifically the price elasticity of demand is a measure of the percentage change inquantity demanded resulting from a percentage change in price For example suppose theprice elasticity of demand for travel were estimated to be -08 Thus if the price of travelincreases by 1 percent travel demand would be expected to fall by 08 percent
5 HERS uses road test equations developed by the American Association of State HighwayOfficials at a test site in Ottawa Illinois Because this site is located in a wetfreeze climatezone the equations reflect the effect of only this one climate zone The equations are beingupdated to incorporate the effect of more environmental factors
Page 32 GAORCED-00-133 FWHArsquos HERS Model
Appendix II
Description of the HERS Model
deterioration submodel is used in the speed user operating costs andagency maintenance costs submodels For example increases in trafficgrowth can cause the pavement to deteriorate further increasing vehicleoperating costs Moreover worn pavement can reduce vehicle speeds slowtravel time and increase a vehiclersquos fuel and maintenance costs
The user costs submodel is used to assess the effect of future pavementcondition and vehicle speed on travel-time costs vehicle operating costsand safety costs Reductions in these costs brought about by highwayimprovements are considered ldquobenefitsrdquo In measuring travel-time coststhe submodel considers both the time spent traveling by drivers for workpurposes as well as by drivers for commuting leisure and other nonworkpurposes In the case of work-related trips the submodel estimates traveltime costs primarily on the basis of hourly compensation for each vehicleoccupant For the value of nonwork trips the submodel uses 60 percent ofeach occupantrsquos hourly compensation excluding fringe benefits
Vehicle operating costs are measured as a function of several factorsincluding pavement condition highway grades and curves and speedchange cycles (for example frequency of stopping) The submodelassesses the effect of these factors on various components of operatingcosts including fuel and oil consumption tire wear vehicle maintenanceand vehicle depreciation For example tire wear and vehicle maintenanceneeds can increase as pavement condition worsens In addition steepgrades and more frequent stopping can increase a vehiclersquos fuel and oilconsumption
The improvement cost submodel uses information on improvement typehighway class and terrain type (flat rolling and mountainous) to projectthe capital costs required to construct an improvement The capital costsrepresent the initial costs of constructing an improvement and depend onthe type of improvement In the case of improvements involvingresurfacing or reconstructing pavement and widening lanes improvementcosts represent initial construction costs and expenditures required toobtain rights of way For improvements that also involve an alignment theHERS model estimates an additional cost that represents the cost requiredto improve a segmentrsquos substandard curves and grades In addition to theseimprovements the model estimates the cost of improving substandardconditions on urban freeways requiring reconstruction in certaincircumstances (for example when shoulders are unfinished) Theimprovementsrsquo costs are used in evaluating the benefits and costs ofalternative improvement options
Page 33 GAORCED-00-133 FWHArsquos HERS Model
Appendix II
Description of the HERS Model
The HERS model uses information from the submodels to identify deficientsegments evaluate the benefits and costs of alternative improvementoptions and select and implement improvements The model calculatesbenefit-cost ratios (total benefits divided by capital costs) to evaluatealternative improvement options for deficient segments Improvementsthat meet specific investment criteria are selected and implemented Forexample under the economic efficiency scenario the HERS modelimplements for each deficient segment the most ldquoaggressiverdquo improvementwith a benefit-cost ratio greater than 1 In so doing the model maximizesnet benefits and as a result generates an economically efficient solutionldquoAggressiverdquo refers to the type of improvement that the model considersFor example both the resurfacing and pavement reconstructionimprovement types might improve the condition of a segment butpavement reconstruction would be the more aggressive option because itrequires more extensive construction The HERS model extrapolatesimprovement costs using expansion factors in the HPMS database Themodel combines the expanded improvement costs for all segments andsummarizes them by highway functional class
HERS Uses ComputationalShortcut to EstimateLifetime Benefits of anImprovement
For certain portions of the analysis the HERS model uses a ldquoshortcutrdquo toapproximate the benefits that would accrue over the lifetime of animprovement For example for deficient segments the model begins byconducting an analysis for one funding-period (5 years) to assess whetherthe segment should be improved in the current funding period or in somelater period A ldquono improvementrdquo baseline is used to evaluate the timing ofthis investment decision Because an improvement will continue to provideannual benefits after the first funding period is over the modelapproximates these future benefits using information on the improvementrsquoscost More specifically these future benefits are approximated by theimprovementrsquos construction cost minus the depreciation in theimprovement after the first funding period plus the cost savings from nothaving to maintain an unimproved segment in later funding periods Thetotal amount is referred to as the ldquoresidual valuerdquo of the improvement andis added to the other benefits associated with making an improvementIdeally in evaluating alternative improvement options the HERS modelshould compare estimated implementation costs with the present value ofbenefits expected to occur in each future funding period According to oneof the modelrsquos developers limitations in computer processing power whenthe HERS model was first developed prevented them from accounting forthe full life cycle of benefits As a result they developed a computationallysimpler algorithm to evaluate and select improvements The developer also
Page 34 GAORCED-00-133 FWHArsquos HERS Model
Appendix II
Description of the HERS Model
indicated that computational time is no longer an issue because of theimprovement in processing speeds
Page 35 GAORCED-00-133 FWHArsquos HERS Model
Appendix III
Results of Sensitivity Analyses Using theHERS Model AppendixIII
Table 3 summarizes the results of sensitivity analyses FHWA performed onthe HERS model FHWA changed the value of one of the variables used inthe HERS model by the amount indicated in the first column The results ofthese changes on the HERS estimate are shown in columns 2 through 4
Table 3 Percentage Change in HERS Estimates Resulting From Changes in Input Data
Note Sensitivity analyses based on HERS version 326D used in developing the 1999 CampP ReportFor all variables except price elasticity and discount rate changes were made in the HERSpreprocessor output data file For price elasticity and discount rate changes were made in the HERSparameter filea Variables are defined as follows
D is the thickness (or depth) of rigid pavement on sampled roadway segments and SN is the structuralnumber for flexible pavement on sampled roadway segments HPMS contains the actual value when itis known Otherwise HPMS contains a typical value for the functional system and pavement typebased on historical data or state practice The HERS preprocessor assigns either slab thickness (D) orstructural number (SN) to all paved sections for which SN or D was not supplied in the HPMSdatabase Depending on the information available the assignment process may reference thesectionrsquos surface type pavement section (if heavy medium or light) or traffic volume data
Peak Percent Trucks and Off-Peak Percent Trucks is an estimate of trucks as a percentage of all trafficduring peak or off-peak travel times States generally estimate using a small number of classificationcount stations comparing the sample section to similar segments elsewhere and using localknowledge of travel patterns
Weighted Design Speed is the speed for which the highway is designed weighted by the length of thehorizontal curves and tangents in a sample section The HPMS database requires weighted designspeed only for rural major collectors For rural sections and some urban sections (interstates and other
Percent change in HERS estimate b
Changes in variable a Rural Urban Overall
Decreasing ldquoDrdquo by 14 (equivalent to 10 percent of its range from 0 to 14) 03 07 05
Increasing ldquoDrdquo by 14 (equivalent to 10 percent of its range from 0 to 14) -01 -04 -03
Decreasing ldquoSNrdquo by 05 (equivalent to 10 percent of its range from 1 to 6) 66 44 52
Increasing ldquoSNrdquo by 05 (equivalent to 10 percent of its range from 1 to 6) -15 -08 -11
Decreasing ldquoOff-Peak Percent Trucksrdquo by 20 percent -12 -08 -09
Increasing ldquoOff-Peak Percent Trucksrdquo by 20 percent 11 04 07
Decreasing ldquoPeak Percent Trucksrdquo by 20 percent -09 -04 -06
Increasing ldquoPeak Percent Trucksrdquo by 20 percent 09 03 06
Decreasing ldquoWeighted Design Speedrdquo by 10 percent 09 17 14
Increasing ldquoWeighted Design Speedrdquo by 10 percent -06 -07 -06
Decreasing ldquoModified PSRrdquo by 10 percent 68 104 90
Increasing ldquoModified PSRrdquo by 10 percent -48 -71 -62
Changing ldquoPrice Elasticityrdquo from minus10 tominus15 for short run and from minus16 to minus20 for long run
92 31 55
Changing ldquoDiscount Raterdquo from 7 percent to 4 percent 54 58 56
Page 36 GAORCED-00-133 FWHArsquos HERS Model
Appendix III
Results of Sensitivity Analyses Using the
HERS Model
freeways and expressways) without reported curves the HERS preprocessor reads the weighteddesign speed from a lookup table (Appendix M in the HPMS Field Manual)
Modified PSR (Present Serviceability Rating) is a measure of the pavement condition of a samplesection For PSR states assign values to the pavement condition of a segment using a scale from 00(extremely deteriorated pavement) to 50 (new or nearly new superior pavement) Most states alsoprovide information on pavement roughness in terms of the International Roughness Index (IRI) TheHPMS database reports pavement condition in terms of the IRI for 705 percent of the segments andPSR for 847 percent of the segments However because HERS was not designed to use IRI data theHERS preprocessor converts all IRI measurements to a ldquomodifiedrdquo PSR value In cases where both IRIand PSR values are reported for a segment the IRI value is converted to a ldquomodifiedrdquo PSR valuewhich replaces the original PSR valueb Percent changes are based on HERS estimates of about $188 billion for Rural $291 billion forUrban and $479 billion for Overall (1997 dollars) calculated for the economic efficiency scenarioRural is the total annual average improvement cost for rural interstates other principal arterials minorarterials and major collectors Urban is the total annual average improvement cost for urbaninterstates other freeways and expressways other principal arterials minor arterials and collectorsOverall is combined Rural and Urban
Source FHWArsquos Highway Economic Requirements System
Page 37 GAORCED-00-133 FWHArsquos HERS Model
Appendix IV
GAO Contacts and Staff Acknowledgments AppendixIV
GAO Contacts John H Anderson Jr (202) 512-2834
Katherine Siggerud (202) 512-2834
StaffAcknowledgments
In addition to those named above Richard Calhoon Catherine ColwellTimothy J Guinane Mehrzad Nadji Judy K Pagano Raymond Sendejasand Phyllis F Scheinberg made key contributions to this report
Page 38 GAORCED-00-133 FWHArsquos HERS Model
(348194) Letter
Ordering Information The first copy of each GAO report is free Additional copies ofreports are $2 each A check or money order should be made out tothe Superintendent of Documents VISA and MasterCard creditcards are accepted also
Orders for 100 or more copies to be mailed to a single address arediscounted 25 percent
Orders by mailUS General Accounting OfficePO Box 37050Washington DC 20013
Orders by visitingRoom 1100700 4th St NW (corner of 4th and G Sts NW)US General Accounting OfficeWashington DC
Orders by phone(202) 512-6000fax (202) 512-6061TDD (202) 512-2537
Each day GAO issues a list of newly available reports andtestimony To receive facsimile copies of the daily list or any listfrom the past 30 days please call (202) 512-6000 using a touchtonephone A recorded menu will provide information on how to obtainthese lists
Orders by InternetFor information on how to access GAO reports on the Internetsend an e-mail message with ldquoinfordquo in the body to
infowwwgaogov
or visit GAOrsquos World Wide Web home page at
httpwwwgaogov
To Report FraudWaste or Abuse inFederal Programs
Contact one
bull Web site httpwwwgaogovfraudnetfraudnethtm
bull e-mail fraudnetgaogov
bull 1-800-424-5454 (automated answering system)
United StatesGeneral Accounting OfficeWashington DC 20548-0001
Official BusinessPenalty for Private Use $300
Address Correction Requested
Bulk RatePostage amp Fees Paid
GAOPermit No GI00
Appendixes
Appendix I Scope and Methodology
Appendix II Description of the HERS Model
Appendix III Results of Sensitivity Analyses Using the HERS Model
Appendix IV GAO Contacts and Staff Acknowledgments
Scope and Methodology
Description of the HERS Model
Results of Sensitivity Analyses Using the HERS Model
GAO Contacts and Staff Acknowledgments
Page 3
United States General Accounting Office
Washington DC 20548
Page 3
Resources Community and
Economic Development Division
B-284060 Letter
June 5 2000
The Honorable Bob SmithChairmanThe Honorable Max S BaucusRanking Minority MemberCommittee on Environment and Public WorksUnited States Senate
The Honorable Bud ShusterChairmanThe Honorable James L OberstarRanking Democratic MemberCommittee on Transportation and InfrastructureHouse of Representatives
Transportation systems play a vital role in the nationrsquos economy byfacilitating the movement of people and goods The United States has madesignificant investments in its transportation infrastructure Effectivemanagement of this infrastructure depends in part on reliable methods forestimating the amount of continuing investment required for maintainingand improving the transportation system In this context the Congress hasrequired the Department of Transportation (DOT) to report every 2 yearson the nationrsquos need for investment to maintain and improve the nationrsquoshighways and bridgesTo help estimate these future investmentrequirements the Departmentrsquos Federal Highway Administration (FHWA)uses the Highway Economic Requirements System (HERS) computermodel
The Transportation Equity Act for the 21st Century (PL 105-178) directedGAO to evaluate and report to the Congress how the Department ofTransportation determines highway investment requirements using theHERS model Accordingly this report describes (1) the methodology themodel uses to generate its estimates of the nationrsquos highway investmentrequirements (2) the strengths and limitations of the model and (3) theusefulness of the HERS estimates for deciding on federal investments inhighway infrastructure In reporting on investment requirements DOTincludes estimates for highways bridges and transit systems This reportfocuses on highway investment requirements and the HERS modelrsquosportion of these requirements We used a draft of DOTrsquos latest Conditions
GAORCED-00-133 FWHArsquos HERS ModelGAORCED-00-133 FWHArsquos HERS Model
B-284060
and Performance Report dated January 10 2000 as the source of DOTrsquosestimated investment requirements for highways DOT approved thisreport for issuance on May 2 2000 without changes to this material Wereviewed the modelrsquos documentation and interviewed its developers andoperators evaluated the model using general economic standards formodels of this type interviewed experts in transportation modeling toobtain their views and interviewed legislative and executive branchofficials who use the model and its results See appendix I for moreinformation on the methodology we used and a list of the transportationmodeling experts we contacted
Results in Brief The HERS computer model estimates investment requirements for thenationrsquos highways by adding together the costs of highway improvementsthat the modelrsquos benefit-cost analyses indicate are warranted In making itsestimates the model relies on extensive data on highway segmentsthroughout the nation such as pavement conditions and expected growthin traffic which the states primarily collect and update The model alsouses information such as vehicle operating costs and emissions obtainedfrom other sources The HERS model uses the data to (1) project the futurecondition and performance of the highway system (2) assess whether anyhighway improvements are warranted and (3) select and implementappropriate improvements Such improvements range from resurfacing ahighway to adding lanes and are based on a comparison of the constructioncosts and the lifetime benefits of the improvement Adding a lane to relieveprojected congestion for example has benefits because the increasedcapacity can reduce travel time and vehicle operating costs FHWA uses theHERS model to estimate highway infrastructure improvement costs forcertain highways under several different scenarios For example under anldquoeconomic efficiencyrdquo scenario the HERS model estimates that for thesehighways the cost of constructing improvements for which the estimatedbenefits exceed the construction costs would be about $48 billion per year(1997 dollars) out of FHWArsquos overall estimate of $94 billion in investmentrequirements for all roads and bridges Similarly under a ldquomaintain currentconditionsrdquo scenario the HERS model estimates that for these highwaysthe least costly mix of improvements that would maintain the pavementcondition of the highways at current levels (1997) would be about$29 billion per year out of FHWArsquos overall estimate of $57 billion ininvestment requirements for all roads and bridges
The HERS model has several strengths that make it a unique andreasonable tool for estimating a general level of national highway
Page 4 GAORCED-00-133 FWHArsquos HERS Model
B-284060
investment requirements but it also has some limitations that affect theprecision of its results A major strength of the model is its ability to assessthe relative benefits and costs associated with alternative options forimproving the nationrsquos highway infrastructure This is a significantimprovement over FHWArsquos previous method which used engineeringstandards to identify highway deficiencies and estimated the cost ofcorrecting these deficiencies without regard to economic merit In June1999 the HERS model was reviewed by an expert panel which found thatFHWA has strengthened the model over time The model has limitationshowever in that it (1) does not completely account for the effect ofhighway improvements on all other highways and modes of transportation(2) does not fully account for the uncertainties associated with its methodsdata and assumptions (3) relies on a computational ldquoshortcutrdquo toapproximate the future lifetime benefits of an improvement and (4) usesdata that vary in quality The overall effect of these limitations on the HERSestimates cannot be determined however they indicate a level ofimprecision with the estimates Although FHWA plans to improve themodel by addressing the limitations in the computational shortcut and thedata transportation modeling experts generally agree that a more completeaccounting of the interrelationships between all highways andtransportation modes cannot be done with the current state of the art intransportation modeling In addition changing the model to account for theuncertainties in its methods data and assumptions would be costly
HERS estimates can be useful as a general guide for the investmentrequirements of the nationrsquos highways included in the model such as ruraland urban interstates and for assessing relative investment requirementsover time Nevertheless the limitations and inherent uncertaintiesassociated with making forecasts prevent the estimates from being aprecise forecast of highway investment requirements FHWA includes theHERS estimates in its current report on the conditions and performance ofthe nationrsquos highways bridges and transit systems In the report howeverFHWA does not clearly disclose the level of uncertainties in the HERSestimates Furthermore to derive a total estimate of highway investmentrequirements FHWA combines the HERS estimates with estimates forother types of highways and investments that are not based on benefit-costanalyses As a result the reportrsquos readers are not likely to be aware of theimprecision of the HERS estimates and the fact that only part of the totalhighway investment requirements is estimated on the basis of anassessment of the benefits and costs of alternative improvement options
Page 5 GAORCED-00-133 FWHArsquos HERS Model
B-284060
This report makes recommendations to improve the modelrsquosapproximation of the future lifetime benefits of highway improvements andFHWArsquos disclosure of some of the uncertainties associated with the modelrsquosestimates in its report to the Congress DOT generally agreed with theserecommendations
Background DOT submits biennial reports to the Congress detailing the state of thenationrsquos highways bridges and other surface transportation systems TheConditions and Performance Report to Congress known as the CampPReport fulfills the mandate1 for a report on future highway investmentrequirements that the Congress first established in 1965 The reportsinclude forecasts of investment requirements for the nationrsquos highways andbridges over the following 20 years
FHWArsquos estimates of total highway and bridge investment requirements inthe CampP Report combine estimates derived from the HERS model a bridgemodel and other types of estimates The HERS model uses benefit-costanalyses to estimate future highway investment requirements on the basisof information about existing highways On the other hand the bridgemodel is based on engineering data and does not currently use benefit-costanalyses in estimating investment requirements for bridges In additionFHWA supplements these two estimates by including the cost of improvingthose highways not modeled in HERS These costs include estimates fornew highways highway classes not included in the HERS model andhighway-related requirements such as safety enhancements trafficoperation improvements and environmental improvements FHWAestimates these costs by assuming that they represent a fixed percentage ofthe combined HERS and bridge modelsrsquo estimate of investmentrequirements The percentages are based on data from 1997 highwayexpenditures Of the total highway and bridge average annual investmentrequirements identified in the CampP Report ($94 billion) only 51 percent arederived using the HERS model and its benefit-cost analyses The remaining49 percent are derived using either the bridge model or the fixed-percentage procedure See figure 1
1 See 23 USC section 502(g) and 49 USC section 308(e)
Page 6 GAORCED-00-133 FWHArsquos HERS Model
B-284060
Figure 1 FHWArsquos Projected Annual Highway and Bridge Investment Requirements1998 through 2017
Dollars in billions
Source FHWA 1999 CampP Report
The methodology FHWA uses to estimate highway investmentrequirements has changed since the first ldquowish listrdquo of estimates wassubmitted to the Congress in 1968 The earliest estimates simply collectedand reported investment requirements prepared by the states In the early1980s the agency designed an engineering model that identified highwaydeficiencies and estimated the cost to improve them on the basis ofengineering standards such as pavement deterioration and road designRecognizing that a benefit-cost approach combined with an engineeringmodel could yield a more defensible estimate of future investmentrequirements FHWA began developing the HERS model in 1988 Howeverthe agency used its engineering model exclusively to forecast highway
$479 bull HERS model estimates
$134bull
Highway classes not modeledin HERS
$146bull
New construction not modeled in HERS
$75Highway-related needs not modeled in HERS
$106
Bridge model estimates
bull
bull
Page 7 GAORCED-00-133 FWHArsquos HERS Model
B-284060
investment requirements until the 1995 CampP Report This reportincorporated one estimate based on HERS benefit-cost analyses and asecond estimate based on the engineering model approach Table 1 outlinesFHWArsquos efforts to estimate highway investment requirements According toFHWA officials the HERS benefit-cost approach complies with anexecutive order2 that requires federal spending for infrastructure to bebased on a systematic analysis of expected benefits and costs
The HERS model estimates investment requirements for 9 of FHWArsquos12 classes of roadsmdashthose that are included in the agencyrsquos database ofhighway conditions FHWA classifies public roads in the United States into12 categories Area categories include rural and urban highwaysFunctional categories are arterials collectors and local roads Arterialsallow the highest traffic speeds They often have multiple lanes and adegree of access control Collectors are designed for lower speeds andshorter trips They typically are two-lane roads that may extend intoresidential neighborhoods Local roads are any roads below the collectorsystem Other categories distinguish roads by significance criteria forexample interstate highways or major and minor traffic flows Figure 2shows which classes of roads are modeled in HERS
2 Executive Order 12893 Principles for Federal Infrastructure Investments (1994)discusses the importance of continuous infrastructure investment to sustained economicgrowth The order directs federal agencies with infrastructure investment responsibilities toplan for investments using a systematic analysis of expected benefits and costs
Table 1 Development of Highway Investment Requirements Report and FHWArsquosModels
Early 1980s FHWA designs model to estimate highway investment requirementsusing engineering standards
1988 to 1994 FHWA develops HERS model adding economic analyses toengineering-based estimates
1995 First CampP Report to include HERS results
1999 First CampP Report with environmental costs of vehicle emissionsincluded in HERS results
Page 8 GAORCED-00-133 FWHArsquos HERS Model
B-284060
Figure 2 FHWArsquos Road Classification System
Source GAO analysis of FHWA information
From fiscal years 1995 through 1999 FHWA spent a total of $24 million onHERS support contracts In 1999 FHWA spent a total of $677345 onexpenses related to the HERS model For example FHWA contracted todevelop revised pavement information at a cost of $150986 In additionFHWA spent $350000 on HERS support for the 1999 CampP Report ongoingmaintenance and operation of the model and a study on the needs of theinterstate highway system
Rural interstates
Rural otherprincipal arterials
Rural minor arterials
Rural major collectors
Rural minor collectors
Rural local roads
Urban interstates
Urban freeways andexpressways
Urban otherprincipal arterials
Urban minor arterials
Urban collectors Urban local roads
Rural roads
Urban roads
Arterials Collectors
Arterials Collectors
Local roads
Local roads
FHWA uses HERS to project needs
for these highways
FHWA uses non-HERSmethods to project
needs for these highways
KEY
Page 9 GAORCED-00-133 FWHArsquos HERS Model
B-284060
The HERS Model UsesBenefit-Cost Analysesto Estimate HighwayInvestmentRequirements
To estimate future investment requirements3 the HERS model uses anextensive set of data on segments of highways throughout the nation toconduct benefit-cost analyses The HERS model uses these data to forecastthe condition and performance (congestion) of the highway segments overthe following 20 years and to evaluate whether improving the segments iseconomically justified The HERS model evaluates potential improvementson each segment by comparing their construction costs with their benefitsincluding reductions in travel times vehicle operating costs and accidentsto determine whether an improvement is warranted FHWA uses the HERSmodel to estimate highway investment requirements under severaldifferent scenarios
The HERS Model Relies onExtensive Data
To estimate investment requirements the HERS model uses a database ofinformation about highway conditions and performance submitted by thestates Using guidance developed by FHWA each state collects andannually updates data on a sample of highways representing nine highwayclasses These data include factors like highway capacity average annualdaily traffic pavement roughness and lane width In total the states collectand report to FHWA information on about 125000 highway segmentsranging in length from one block to 10 miles The states also developforecasts of traffic growth on each segment The HERS model usesldquoexpansionrdquo factors to generalize the estimated improvement costs forsegments to the highway classes they represent
In addition to the state-collected data the HERS model uses otherinformation that FHWA derives from various economic studies Forexample in estimating the benefits associated with highwayimprovements the HERS model counts as a benefit any reduction in traveltime brought about by the highway improvement In making thiscalculation FHWA uses hourly compensation data from the Department ofCommercersquos Bureau of Labor Statistics to quantify the dollar value of traveltime saved by travelers on work-related trips In addition as currentlymodeled in HERS highway improvements increase net traffic and hencetotal vehicle emissions As a result the HERS model subtracts the dollarvalue of the air pollution damages caused by vehicle emissions from the
3 In using ldquoinvestment requirementsrdquo we are referring to the HERS modelrsquos estimates ofaverage annual infrastructure improvement costs for the nine highway classes included inthe model
Page 10 GAORCED-00-133 FWHArsquos HERS Model
B-284060
benefits of making an improvement FHWA obtains emissions data forseveral classes of vehicles from the Environmental Protection Agency(EPA) FHWA also obtains dollar estimates from the economic literaturefor the human health and property damages caused by specific pollutants
The HERS Model Evaluatesthe Relative Benefits andCosts of AlternativeImprovement Options
The HERS model simulates the effects of infrastructure improvements forthe highways it models by comparing the relative benefits and costsassociated with alternative improvement options4 The HERS model beginsby assessing the current condition of the highway segments in the datasample The model then projects the future condition and performance ofthe segments based on expected changes in factors such as trafficpavement condition and average speed Performance is measured in termsof highway congestion The model makes its projections in four 5-yearincrements (funding periods) for a total of 20 years
Figure 3 provides a simplified representation of the modeling process Themodel compares each segmentrsquos future condition with FHWA criteria forhighway deficiencies for factors such as pavement condition congestionand lane width For each segment identified as deficient (not meeting thecriteria) the model assesses the relative costs and benefits associated withalternative improvement options to determine whether improving thesegment is economically justified The options range from resurfacing thepavement to completely reconstructing the road and adding lanes
Figure 3 Simplified Representation of the HERS Modeling Process
Source FHWA
4 FHWA documented the modelrsquos specifications in its draft report entitled HighwayEconomics Requirements System Technical Report (US Department of TransportationFederal Highway Administration 1999)
Identifydeficient
segments
Assemble highway
data (traffic forecastshighway
conditions etc)
Forecast future
condition and performance of segments
Identify economically
justified improvements for deficient segments
Select and implement segment
improvements
Extrapolate segment
improvementcosts todevelop
investment requirements
Page 11 GAORCED-00-133 FWHArsquos HERS Model
B-284060
The HERS model calculates costs as the capital expenditures required toconstruct the improvement and calculates the benefits as reductions infactors like travel time vehicle operating costs and accidents over thelifetime of the improvement For example adding lanes in congested areascan be beneficial because the increased capacity can reduce travel timesand operating costs5 Future benefits are discounted to the present6 TheHERS model selects for implementation those improvements that areeconomically justified including those improvements for which theestimated benefits exceed the cost of constructing the improvement(positive net benefits) To estimate the investment requirements for thehighways it models the HERS model uses ldquoexpansionrdquo factors to generalizesegment improvement costs to the nine highway classes included in themodel The expansion factors enable the HERS model to relate informationabout the sampled segments to the highway classes they representInvestment requirements for the combined highway classes are obtained byadding together the estimates for the nine different classes Appendix IIdescribes the structure of the HERS model
The HERS Model EstimatesHighway InvestmentRequirements for SeveralDifferent Scenarios
FHWA uses the HERS model to forecast the investment requirements forthe highways represented in the model on the basis of several differentscenarios For example under the ldquoeconomic efficiencyrdquo scenario theHERS model selects for implementation those improvements that havepositive net benefits (benefits minus costs) The investment requirementsunder this scenario are about $48 billion per year from 1998 through 2017Similarly under the cost to ldquomaintain current (pavement) conditionsrdquoscenario the HERS model selects for implementation the least costly mixof improvements that would maintain average pavement conditions at 1997levels over the forecast period Under this scenario the investmentrequirements are about $29 billion per year In addition to these scenariosFHWA estimates the investment requirements for maintaining current
5 The HERS model also uses ldquoprice elasticityrdquo to assess the behavioral response of drivers tochanges in the cost of traveling on the highway Price elasticity mitigates to some extent thebeneficial aspect of making highway improvements For example because improving asegment lowers travel costs some drivers may respond by driving more frequently As aresult traffic on the improved segment may increase more quickly than anticipatedreducing the future benefits of the improvement
6 Discounting accounts for the fact that in general one dollar today is worth more than onedollar a year from now
Page 12 GAORCED-00-133 FWHArsquos HERS Model
B-284060
(1997) levels of travel time and vehicle user costs See table 2 for the HERSestimates representing the different scenarios
Table 2 The HERS Modelrsquos Estimates for Highways
Note Dollars are 1997 dollars These estimates reflect only the HERS portion of FHWArsquos estimates ofhighway investment requirements
Source FHWArsquos 1999 CampP Report
The HERS Model HasStrengths andLimitations
The HERS model has several strengths that make it a unique andreasonable tool for estimating a general level of the nationrsquos highwayinfrastructure requirements A major strength of the model is its ability toassess the relative benefits and costs associated with alternative optionsfor making improvements on the nationrsquos highways We found no othertransportation model that could assess benefits and costs of alternativeimprovement options at the national level In addition FHWA has convenedexpert panels to assess the reasonableness of the HERS methodology andhas made some changes to the model in response to recommendationsfrom the panels The model also has several limitations First it does notcompletely account for the interrelationships between all highways anddifferent transportation modes such as how traffic is redistributed asimprovements are made Second it does not fully account for theuncertainties associated with its methods data and assumptions Third itrelies on a computational ldquoshortcutrdquo to approximate the future lifetimebenefits of an improvement even though this is no longer necessaryFinally it uses data that vary in quality Although the net effect of thelimitations on the HERS estimates cannot be determined FHWA is takingsteps to mitigate some of these limitations
Dollars in billions
ScenarioHERS forecast of
annual costs
Economic efficiency $479
Maintain current travel times 391
Maintain current vehicle user costs 311
Maintain current pavement conditions 294
Page 13 GAORCED-00-133 FWHArsquos HERS Model
B-284060
The HERS Modelrsquos MajorStrength Is Its Applicationof Benefit-Cost Analyses inAssessing HighwayInvestments
The HERS modelrsquos major strength is its ability to assess the relativebenefits and costs associated with potential improvements in the nationrsquoshighways This is a significant improvement over FHWArsquos previousmethods which used engineering standards to identify deficiencies andselect improvements without regard to economic merit By contrast theHERS model selects for implementation only those improvements that areeconomically justified We found no model other than HERS that is capableof applying benefit-cost analyses in estimating investment requirements ata national level For example the World Bankrsquos Highway Design andMaintenance Standards model is designed to be used at the project level Inaddition a model known as StratBENCOST uses benefit-cost analyses toevaluate state and local highway projects7
Another strength of the HERS model is that FHWA has consulted withexperts in order to assess the modelrsquos reasonableness and improve it Forexample in June 1999 FHWA convened an expert panel consisting ofeconomists and engineers from the public and private sectors This panelfound that FHWA has strengthened the model over time and that the recentrefinements have increased its applicability and credibility
FHWA has also instituted several procedures to make the state-provideddata for the HERS model as reasonable as possible For example FHWAperiodically conducts workshops to inform state transportation officialsabout changes to the database used by the HERS model and FHWA staffare available to conduct additional training at the statesrsquo request Inaddition FHWA recently completed reassessing its database needs toeliminate unnecessary data items and reduce the statesrsquo data collectionburden Changes as a result of this reassessment became effective in 1999and the states will submit data reflecting these changes to FHWA in June2000 As a result of the reassessment FHWA identified the potential forreducing the number of sampled segments in the database to 80000 fromits current level of about 125000
The HERS Model Has SomeLimitations
Although the HERS model is a reasonable tool we noted that it has severallimitations First because the model analyzes each highway segmentindependently rather than the entire transportation system (collectively
7 StratBENCOST was developed by HLB Decision Economics Inc for the NationalCooperative Highway Research Program
Page 14 GAORCED-00-133 FWHArsquos HERS Model
B-284060
referred to as a network) it cannot completely reflect changes occurringamong all highways and modes in the transportation network at the sametime For example the HERS model does not capture the effect on trafficlevels of improving one highway segment while leaving neighboringsegments unimproved The HERS model incorporates information on howchanges in costs to users of vehicles affect the demand for travel (via ldquopriceelasticityrdquo) As a result FHWA officials assume that the HERS modelcaptures the net effect of all changes in the transportation network as wellas the overall economy However we did not find consensus among thetransportation modeling experts we interviewed that the HERS modelcompletely captures the net effect of all changes in the network Theimplication of this limitation is unclearmdashit may over- or under-estimate theeffect of changes in traffic resulting from a highway improvementNonetheless transportation modeling experts we talked to generally agreethat explicitly modeling the entire transportation network is not possiblewith the current state of the art in modeling or available data
Second because the HERS model is not designed to completely quantifythe uncertainties associated with its methods assumptions and data themodel cannot estimate the full range of uncertainties within which itsestimates vary As a result the precision of the modelrsquos estimates isunknown In making its estimates the HERS model relies on a variety ofestimating techniques and hundreds of variables all of which are subject tosome uncertainties Executive Order 12893 states that federal agencies inevaluating infrastructure investments should address uncertainty whenthe amount and timing of important benefits and costs are uncertain Forits CampP Report FHWA accounted for some uncertainties by conductingldquosensitivity analysesrdquo to measure how much the HERS estimates changewhen the value of certain key inputs or assumptions used in the model arechanged Nevertheless the sensitivity analyses do not account for all theuncertainties in the model We discussed this issue with one of the HERSmodelrsquos developers who indicated that according to his understanding ofthe model the uncertainty associated with the ldquosingle pointrdquo estimatescould range up to plus or minus 30 percent However changing the modelto fully account for uncertainties in its factors is not likely to be cost-effective because it could require extensive and expensive reprogramming
Third the HERS model uses a computational shortcut to approximate thelifetime benefits associated with an improvement Benefits and costsshould be measured over each improvementrsquos full lifetime 20 years ormore However in its initial evaluation of whether to improve a highwaysegment the HERS model calculates benefits such as reductions in travel
Page 15 GAORCED-00-133 FWHArsquos HERS Model
B-284060
time only during the first 5-year period To account for the benefitsaccruing after the first 5 years FHWA developed a shortcut that essentiallyuses an estimate of the improvementrsquos construction cost as a proxy for theimprovementrsquos remaining future benefits8 FHWA developed the shortcutseveral years ago when limitations in computer processing powernecessitated simplifying some of the calculations Several of thetransportation modeling experts we talked to question whether these costsare a reasonable approximation of future benefits Ideally the modelshould estimate the benefits associated with an improvement over its fulllifetime discounted to the present FHWA officials acknowledged that theshortcut is a limitation that is no longer necessary given recentimprovements in computer processing power
Fourth although FHWA has taken steps to ensure that the data used in theHERS model are reasonable some of these data vary in quality Forexample the HERS model relies on emissions data that some members ofFHWArsquos 1999 expert panel consider unrepresentative of actual conditionsTo estimate the emissions associated with traffic on a given segment themodel uses information from EPA on emissions rates per vehicle type andspeed Vehicle emissions however may depend more on how the vehicle isdriven than on the total miles driven FHWA officials told us they recognizethat the emissions data may not reflect actual conditions but included thedata to approximate the environmental effect of highway travel EPA iscurrently revising these emissions data
In addition we reported earlier that the pavement roughness data reportedby the states to FHWA are not comparable partly because the states usedifferent devices to measure roughness9 The HERS model uses theroughness data in projecting the pavement condition of each segmentMoreover some of the information used in the model is dated Forexample the pavement resurfacing costs used in the HERS model arebased on 1988 data (adjusted for inflation from 1988 to 1997)
Finally to project the future condition of the pavement the HERS modeluses information that does not fully capture the range of environmental
8 With this shortcut the HERS model assumes that the remaining future benefits of animprovement can be approximated by the costs that would be avoided by making theimprovement in the current 5-year period See appendix II for more information
9 Transportation Infrastructure Better Data Needed to Rate the Nationrsquos HighwayConditions (GAORCED-99-264 September 27 1999)
Page 16 GAORCED-00-133 FWHArsquos HERS Model
B-284060
conditions affecting the nationrsquos highways10 To account for the effect ofclimate on pavement condition for instance the model assumes allsegments face freezing and thawing conditions However segments inwarm and drier areas of the country rarely face freezing or thawingconditions and FHWA officials acknowledged that the pavementinformation does not completely account for these conditions Althoughthe effect of the variability in the quality of the data has not beendetermined it reduces confidence in the overall precision of the HERSestimates
FHWA Plans to Improve theHERS Model
FHWA recognizes that the HERS model has some limitations and is takingsteps to improve it For example FHWA officials said they plan to revisethe emissions data used in the HERS model as soon as EPA finishesrevising its emissions model In addition FHWA plans to update thepavement resurfacing costs currently based on 1988 data to represent1998 or 1999 costs FHWA also has contracted with one of the modelrsquosdevelopers to incorporate varied pavement performance information basedon different climate zones throughout the country instead of assuming oneclimate as is now done FHWA officials also expressed interest in revisingthe model to eliminate the computational shortcut used to approximatebenefits They said that as of March 2000 FHWA has not yet contracted tomake this improvement Furthermore beginning this fiscal year they planto modify the HERS model to incorporate the effects of user fees such asmotor fuel taxes into the modelrsquos assessment of the benefits and costs ofalternative highway improvements
In addition FHWA is currently developing a state-level ldquoprototyperdquo of theHERS model in order to provide the states with the ability to forecast state-level highway investment requirements FHWA is incorporating into themodel selected features from customized versions of the HERS modeldeveloped for transportation officials in Indiana and Oregon by a privatecontractor After the development of the state-level prototype is completeFHWA will provide the model to a limited number of states as part of a pilotprogram to determine the usefulness of the model for state-level highwayplanning
10 HERS uses a pavement deterioration ldquosubmodelrdquo to forecast pavement condition Seeappendix II
Page 17 GAORCED-00-133 FWHArsquos HERS Model
B-284060
HERS Estimates CanBe a Useful Tool to AidDecisionmaking butHave Limits
HERS estimates are useful as a general guide for the investmentrequirements of the nine highway classes represented in the model Inaddition the HERS estimates developed for the ldquoeconomic efficiencyrdquoscenario can be useful for assessing the relative requirements of thehighway classes over time Congressional and federal agency officials toldus they use the estimates as an overall indicator of highway needsHowever the limitations and inherent uncertainties associated withmaking forecasts prevent these estimates from being a precise forecast ofinvestment requirements In addition because the current version of theHERS model was designed to estimate investment requirements at thenational level the estimates derived from this model should not be used toproject investment needs for particular highway projects Finally aspresented in the 1999 CampP Report the uncertainties associated with theHERS estimates are not highlighted and the HERS estimates are combinedwith other estimates that are not based on an assessment of the relativebenefits and costs of alternative improvement options
HERS Estimates Are Usefulas a General Guide forInvestment Requirements
In general the HERS estimates provide legislative and executive branchofficials one source of information to use for decisionmaking Legislativeand executive branch officials told us that they use the estimates in theCampP Report to obtain general information on the nationrsquos need forinfrastructure investments Legislative branch officials told us that HERSestimates are more useful than previous estimates that were based onengineering analyses alone Furthermore different groups may use theHERS estimates in funding debates For example according to an FHWAofficial construction industry interests could use the higher investmentscenario estimate to show legislators a need for a higher level of highwayfunding
In addition to serving as a general guide the HERS estimates for theeconomic efficiency scenario can be useful in assessing the relativeinvestment requirements over time for the nine highway classesrepresented in the model Adjusting for inflation and changes in the modelrsquosformulas assumptions and data between reports the HERS estimatesfrom different reports can be compared to assess whether investmentrequirements are increasing decreasing or remaining the same Forexample using data developed for the 1995 CampP Report and the currentCampP Report FHWA found that the average annual highway investmentrequirements increased slightly from $461 billion to $479 billion (1997dollars)
Page 18 GAORCED-00-133 FWHArsquos HERS Model
B-284060
Although the HERS model provides a general estimate of the highwayinvestment requirements in our view it is important that the model not beused for other than its intended purpose First while some federal officialshave expressed an interest in using the HERS model to determine whichhighway projects should receive funding the current version of the HERSmodel was developed to estimate investment requirements nationwide Asa result the estimated investment requirements generated by the HERSmodel should not be used for project-level estimates
Second federal decisionmakers we spoke with expressed an interest inretrospectively comparing actual highway investments by the states withthose forecast by the HERS model This comparison could be misleadingbecause states may base their highway improvement decisions on criteriaother than those used in the HERS model For example under theeconomic efficiency scenario the model implements only thoseimprovements that are economically justified (that have positive netbenefits) However some states may fund highway improvements thatwould not pass the same economic test For example states may improve ahighway in an economically disadvantaged area in an attempt to fostereconomic development
Third although comparing the HERS estimates developed for theeconomic efficiency scenario in successive CampP Reports can be usefulmaking the same comparison using the HERS estimates for the maintaincurrent conditions scenario could be misleading Currently the data usedby the HERS model to establish the current condition of the highwaysystem are updated every year Because the HERS model uses the currentcondition of the highway system as a ldquobaselinerdquo in projecting futureinvestment requirements the HERS estimates for the maintain currentconditions scenario can be influenced by the prior level of state spendingFor example if state spending on highway improvements declines relativeto estimated investment requirements the condition of the highway systemmight also decline The subsequent HERS projection would be based on anew baseline reflecting a decline in the condition of the highway systemfrom the previous period Moreover the estimated investmentrequirements required to maintain the new current condition into thefuture would also decline since less investment would be required tomaintain a more deteriorated condition Such a decline in estimatedinvestment requirements over time however might be misconstrued toindicate that the condition of the highway infrastructure is improvingwhen in fact it would indicate a decline in the baseline condition
Page 19 GAORCED-00-133 FWHArsquos HERS Model
B-284060
HERS Estimates Could beMore Clearly Presented
As we discussed the HERS model has several limitations that affect itsability to precisely estimate investment requirements Furthermoreforecasting highway investments using computer models is by its nature aninexact science and a model cannot capture all the complexities oftransportation systems Although FHWA conducted sensitivity analyses toquantify some of the uncertainties associated with the HERS estimatesdeveloped for its 1999 CampP Report the report does not highlight the resultsof these analyses For example FHWA found that increasing its trafficgrowth assumption by 315 percent increased the HERS estimate by about17 percent from $479 billion to $561 billion (see fig 4) The change in theassumption represented actual average annual growth from 1977 to 1997However because the CampP Report presents the HERS estimates as single-point estimates and the results from the sensitivity analyses are presentedin a separate chapter later in the report the range of uncertaintiesdisclosed by the sensitivity analyses may not be evident to the reader Seeappendix III for additional results from sensitivity analyses
Figure 4 Sensitivity of HERS Estimate to Changes in Certain Assumptions
Source FHWA
Note Dollars are 1997 dollars Results are for the economic efficiency scenario and represent theeffect of changes in certain assumptions used in the HERS model For example the overall averageannual growth in traffic in terms of vehicle miles traveled was increased by 315 percent the discount
1997 dollars in billions
0
10
20
30
40
50
60
479
561
506
430
HERSestimate
Overalltraffic
Discount rate
Urbantraffic
Page 20 GAORCED-00-133 FWHArsquos HERS Model
B-284060
rate was lowered from 7 to 4 percent and the average annual growth in traffic in the largest urbanizedareas was decreased by 100 percent (to no growth) In terms of the latter assumption about29 percent of the estimate represents highway improvements in the largest urbanized areas
In addition when reporting on investment requirements for highways andbridges the CampP Report did not clearly disclose that its estimates are onlypartially modeled using benefit-cost analyses Specifically only 51 percentof the reported investment requirement is based on the HERS model and itsbenefit-cost analyses The other 49 percent which consists of bridges andnon-modeled factors such as the construction of new highways is notbased on the same methodology and thus has not been proven to beeconomically justified As a result the estimates are technically notcomparable In addition FHWA views the highway investmentrequirements estimated outside the HERS model as less reliable Althoughthe CampP Report presents the estimates relating to highways and bridgesseparately it combines the HERS-modeled estimates with the non-modeledestimates Thus as currently presented it may not be evident to the readerthat only a portion of the total highway investment requirements is basedon benefit-cost analyses and as a result is economically justified (See fig 1for an analysis of these estimates)
Conclusions In developing the HERS model to forecast the investment requirements forthe nationrsquos highways FHWA has taken steps to enhance the modelrsquosintegrity and rigor Furthermore because the model incorporates benefit-cost analyses in selecting potential highway improvement projects forinclusion in its estimates it is a significant improvement over previousmethods which used engineering standards to identify highwaydeficiencies and estimated the cost of correcting these deficiencies withoutregard to economic merit The HERS model selects those improvementsthat are economically justified and as a result provides the Congress with amore useful and realistic estimate Although FHWA significantly improvedupon the analytical rigor of previous methods by incorporating benefit-costanalyses the HERS model has some limitations that affect the precision ofits estimates
While not all the limitations in the HERS model can be addressed becauseof the inherent complexities of modeling FHWA is taking steps to improvethe model FHWA has expressed interest in changing the model toeliminate the shortcut for calculating an improvementrsquos lifetime benefitsbut has not established a timeframe for this change It is also planning toimprove the modelrsquos information on pavement performance and costFHWA could present the modelrsquos estimates more effectively in its CampP
Page 21 GAORCED-00-133 FWHArsquos HERS Model
B-284060
Report to help the reportrsquos readers be aware of the full extent of the caveatsand uncertainties associated with the estimates In particular FHWA couldhighlight the uncertainties associated with the HERS estimates as indicatedby its sensitivity analyses so that readers of the report do not believe theestimates are more precise than they actually are Finally FHWArsquos CampPReport generally presents an overall estimate of all highway investmentrequirementsmdashcombining the HERS estimates with other estimates thatare developed using less rigorous methods The report could highlight thedifference between these estimates and note that FHWA has moreconfidence in the HERS-generated estimates
Recommendations In order to ensure that the HERS model achieves its objectives and that thelimits of its estimates and the estimates presented in future conditions andperformance reports are disclosed we recommend that the Secretary ofTransportation direct the Administrator of FHWA to
bull establish a timeframe for revising the HERS model in order to accountfor the expected lifetime benefits that are associated with alternativehighway improvement options
bull clarify when presenting the HERS estimates that there areuncertainties associated with the estimates and refer readers to thesensitivity analyses performed on the HERS model that illustrate theseuncertainties and
bull explain in the report that one portion of the estimate for highwayinvestment requirements is from the HERS model and is based onbenefit-cost analyses and that the other portion was calculated usingless reliable methods as well as the percentage that each of theseportions constitutes of the overall estimate
Agency Comments andOur Evaluation
We provided a draft of this report to the Department of Transportation forreview and comment We met with Department officials including theTeam Leader for Highway Needs and Investment Planning in the FederalHighway Administration These officials generally agreed with the findingsand recommendations in this report With regard to the recommendation toestablish a timeframe for accounting in the model for the expected lifetimebenefits of highway improvements the Department plans to eliminate thecomputational shortcut it uses to approximate future lifetime benefits intime to prepare estimates for the CampP Report it will issue in 2003 Inresponse to the recommendation to clarify the uncertainties associated
Page 22 GAORCED-00-133 FWHArsquos HERS Model
B-284060
with HERS estimates the Department plans to expand its use ofuncertainty analysis beyond the analysis in the 1999 report for the CampPReport for 2001 in order to provide a more complete discussion of thisissue Finally in response to the recommendation to distinguish betweenHERS model estimates and other less reliable estimates the Departmentplans to clarify and enhance its discussion of these differences in the CampPReport for 2001 including a figure similar to our figure 1 In addition theDepartment will work to expand the scope of HERS to consider more typesof highway deficiencies and solutions to address them in order to reducethe percentage of estimates using these less reliable methods TheDepartment also provided technical and clarifying comments which weincorporated into the report as appropriate
We conducted our review from September 1999 through April 2000 inaccordance with generally accepted government auditing standards
We will send copies of this report to cognizant congressional committeesthe Honorable Rodney E Slater Secretary of Transportation and theHonorable Kenneth R Wykle Administrator Federal HighwayAdministration
If you or your staff have any questions about this report please contact meat (202) 512-2834 Appendix IV lists key contacts and contributors to thisreport
John H Anderson JrDirector Transportation Issues
Page 23 GAORCED-00-133 FWHArsquos HERS Model
Appendix I
AppendixesScope and Methodology AppendixI
To assess the reasonableness of the Highway Economic RequirementsSystems (HERS) modelrsquos assumptions and data and the usefulness of themodelrsquos results we reviewed the Principles for Federal InfrastructureInvestments (Executive Order 12893) the Federal HighwayAdministrationrsquos (FHWA) June 1999 expert panelrsquos comments on the HERSmodel and several FHWA reports and documents on the HERS model from1994 through 1999
In addition we discussed the HERS methodology with FHWA economistsand engineers and two of the FHWA contractors that helped develop themodel Moreover we interviewed users of the HERSrsquo results includinglegislative and executive-branch officials several members of the June1999 HERS expert panel and other transportation modeling experts (seelist of names below) We attended the June 1999 expert panel meeting aswell as an FHWA-sponsored outreach meeting on the Conditions andPerformance Report (CampP Report) in November 1998 We used standardeconomic principles to evaluate the modelrsquos application of benefit-costanalyses and the key economic assumptions used in the model and weasked FHWA to provide us with results for sensitivity analyses conductedusing alternative values for price elasticity and the discount rate Inaddition we reviewed the methods used by other transportation models toassess highway investments
To assess the reasonableness of the data used in the HERS model wereviewed technical documents supporting the primary source of datamdashtheHighway Performance Monitoring System (HPMS) database In additionwe discussed the reliability of the HPMS data with FHWA officialsincluding the Chief of Highway Systems Performance Because FHWA usesa ldquopreprocessorrdquo to convert the HPMS data into a HERS input data file wereviewed the actions performed by the preprocessor to assess whether thevalues of the data elements in HPMS are consistent with those in the HERSinput data file To do this we asked FHWA to provide us with basicstatistics and frequencies for several key data elements in the HPMSdatabase both before and after the data were converted by thepreprocessor The data included average annual daily trafficsurfacepavement type weighted design speed peak and off-peak percentof vehicles with greater than four tires speed limit and wideningfeasibility For most of the data items the actions of the preprocessorproduced at most minor changes in a very small percentage of the dataelements For the data items for which the actions of the preprocessoraffected a larger percentage of the data elements we asked FHWA toconduct a sensitivity analysis in order to assess the effect of changes in the
Page 24 GAORCED-00-133 FWHArsquos HERS Model
Appendix I
Scope and Methodology
data items on the HERS estimates using the maximum economic efficiencyscenario We found that changes in these data items did not markedlychange the HERS estimates See appendix III for the results of thesesensitivity analyses
In August 1987 we reported on our review of FHWArsquos HPMS samplingplan1 We found it to be statistically reasonable for selecting highwaysections nationally For our current effort we reviewed FHWArsquos currentguidance which the states use to sample segments and found it consistentwith the guidance we reviewed in 1987
The individuals we contacted include the following experts
bull Adjo Amekudzi Assistant Professor of Civil and EnvironmentalEngineering Georgia Institute of Technology
bull Kenneth D Boyer Professor of Economics Department of EconomicsMichigan State University
bull Gregorio Camus Programmer Battelle Memorial Institutebull David J Forkenbrock Professor of Civil and Environmental
Engineering and Chair Public Policy Center University of Iowabull David Greene Economist Oak Ridge National Laboratorybull Chris Hoban Principal Highway Engineer The World Bankbull Douglass Lee Principal Investigator Volpe National Transportation
Centerbull Sue McNeil Professor of Civil and Environmental Engineering Carnegie
Mellon Universitybull Mike Markow Cambridge Systematicsbull Michael Meyer Professor and Chair School of Civil and Environmental
Engineering Georgia Institute of Technologybull Carl L Monismith Robert Horonjeff Professor of Civil and
Environmental Engineering and Professor in the Graduate SchoolUniversity of California at Berkeley
bull Arlee Reno Engineer Cambridge Systematicsbull Herb Weinblatt Principal Cambridge Systematics
1 Highway Needs An Evaluation of DOTrsquos Process for Assessing the Nationrsquos HighwayNeeds (GAORCED-87-136)
Page 25 GAORCED-00-133 FWHArsquos HERS Model
Appendix II
Description of the HERS Model AppendixII
This appendix describes the basic structure of the HERS computer modelThe HERS model simulates infrastructure improvement decisions for thehighways it models by comparing the relative benefits and costs associatedwith alternative improvement options In conducting its analysis HERSuses an extensive set of data that are primarily collected and updated bythe states and maintained by FHWA in the HPMS database In addition theHERS model consists of several submodels representing specific highwayprocesses including traffic growth pavement wear vehicle speedaccidents and highway improvement costs The analysis which is basedon the current condition of the highway system is conducted over four 5-year periods for a total of 20 years Information from the submodels isused to identify deficient segments evaluate alternative improvementoptions and select and implement improvements HERS uses benefit-costratios (benefits divided by costs) to evaluate and select improvementsunder several investment scenarios The costs are the capital expendituresnecessary to construct the improvement and the benefits includereductions in usersrsquo operating costs agency maintenance costs and theldquoresidual valuerdquo of an improvement Residual value represents the benefitsexpected to accrue over the future life of an improvement beyond theanalysis period used in the model HERS uses a computational shortcut toestimate residual value
Page 26 GAORCED-00-133 FWHArsquos HERS Model
Appendix II
Description of the HERS Model
HERS Uses anExtensive Data Set
HERS uses input data that are created from the HPMS database and severalparameter and control files HPMS consists of all the data collected andupdated by the states on about 125000 randomly selected highwaysegments across the United States ranging in length from one block to 10miles The parameter and control files include information such asdeficiency and design standards and basic instructions for the modelThese data are converted to a HERS input file by a separate model calledthe ldquopreprocessorrdquo which aggregates all the data and performs variousdata manipulations For example the preprocessor assigns a speed limit of75 mph to segments with no legally mandated maximum speed limit and itconverts the International Roughness Index data developed by the states toa ldquomodifiedrdquo Present Serviceability Rating (PSR) index1 See figure 5 for arepresentation of the process used to create the HERS input data
1 The HERS pavement deterioration submodel was not designed to use the InternationalRoughness Index (IRI) so the preprocessor converts the IRI data to a ldquomodifiedrdquo PSR Theconversion is based on formulas developed by Al-Omari and Darter in RelationshipsBetween IRI and PSR Department of Civil Engineering University of Illinois 1992 Both IRIand PSR are measures of pavement condition but IRI strictly measures surface roughnesswhile PSR incorporates other types of pavement distress and may be based on professionaljudgement IRI is measured by a moving vehicle using non-contact sensors such as lasers
Page 27 GAORCED-00-133 FWHArsquos HERS Model
Appendix II
Description of the HERS Model
Figure 5 Schematic of Pr ocess Used to Create HERS Data
Source FHWA data
Developed in 1978 as a national highway transportation system databaseHPMS is a nationwide inventory system that includes limited data on allpublic roads and more detailed data for a sample of highway segmentsrepresenting nine different highway classes The sampled data includeinformation on highway capacity average annual daily traffic pavementroughness and lane width In addition to the sample data the states arerequired to report certain basic inventory information for all public roadsthat are open to traffic including an inventory of roads by highway classThe states also develop traffic forecasts for each segment In addition theHERS model uses ldquoexpansionrdquo factors to extrapolate the cost estimates tothe highway classes represented by the segments The expansion factorsare calculated by the HMPS software the states use to submit the data toFHWA
Overall the HPMS database includes nearly 100 variables According toFHWArsquos Chief of Highway Systems Performance the most accurate data inthe HPMS database are variables that are directly measurable such as thelength of the highway section number of lanes in the section and speedlimit By contrast the least accurate data are variables that are open tointerpretation by state personnel such as whether it is feasible to widen a
HERS preprocessor
HPMSdata file
HERS input data file
HERS model
Other data (parameter and control files)
Other data (parameter and control files)
Page 28 GAORCED-00-133 FWHArsquos HERS Model
Appendix II
Description of the HERS Model
segment and the estimated percent of trucks traveling in peak and off-peakperiods For example in assessing whether a segment can be widened onestate may view the potential high costs of widening as a detriment whileanother state may not In addition the states generally estimate the percentof trucks traveling during peak and off-peak periods from classificationcounts taken in a limited number of locations and of varying times anddurations
FHWA developed an HPMS field manual for the states to use in samplinghighway segments and identifying which data items to collect and how tomeasure them The sampling plan requires the states to select stratifiedrandom samples where the strata represent different volume groups fordifferent highway classes in the rural small urban and urbanized areas ofeach state Estimates of average annual daily traffic are based on volumecounts on each segment Since each state selects its own sampleimplementation of the sampling plan may vary
FHWA has instituted some measures to improve the reasonableness of theHPMS data FHWA provided the states with software they can use toassemble edit and submit their HPMS data This software automaticallyperforms checks for basic validity and missing data Once the states edittheir data they run an expansion subroutine that places an expansionfactor in each sample segmentrsquos record that is used to expand sample datato the full functional system Once FHWA receives the data from the statesthe data are passed through a software program that conducts basic logicchecks searches for anomalies and reviews the distributions of sample-related items FHWA staff review all items flagged during this check FHWAworks closely with the states to obtain answers to its questions concerningthe HPMS data Nonetheless the potential for some variability in HPMSdata remains because of potential differences in data collection techniquesamong the states
In addition from December 1996 through December 1998 FHWAreassessed its database needs in an effort to eliminate unnecessary dataitems and reduce the statesrsquo data collection burden2 As part of this effortFHWA conducted public meetings with state officials to obtain their viewson a future focus for the HPMS database As a result of the reassessmentFHWA will make significant changes to the HPMS database FHWA
2 Highway Performance Monitoring System Reassessment Final Report Revised April 1999FHWA-PL-99-001
Page 29 GAORCED-00-133 FWHArsquos HERS Model
Appendix II
Description of the HERS Model
changed the HPMS field manual and software to guide the states in makingneeded changes For example FHWA decided to delete some data that thestates have collected in the past but that it determined are no longerneeded such as the number of interchanges on segments In additionFHWA ldquocollapsedrdquo some data items into fewer categories to reduce stateofficialsrsquo time spent in collecting data For example the variable describingthe surface or pavement type was reported in 15 categories many of whichwere of little use so these were reduced to 6 categories In addition tothese changes the FHWA reassessment identified the potential forreducing the HPMS sample from over 125000 segments to 80000 segmentsto help reduce the statesrsquo data collection burden The states beganimplementing the changes during their data collection efforts in 1999 andwill report the revised data to FHWA by June 2000
The HERS input data and additional parameter and control data are usedby the HERS model to assess the relative benefits and costs of makinghighway improvements The post-preprocessor parameter and control datainclude information that is independent of specific segments such astravel-time costs widening feasibility criteria and the discount rate
The HERS model consists of several submodels representing specifichighway processes such as traffic growth pavement wear operating costsemissions costs and highway improvement costs The submodels are usedto project the future condition and performance of the highway systemwith and without improvements (for example the baseline) for eachfunding period and each segment3 In addition the benefits associated withmaking highway improvements are estimated using several submodelslinked together Benefits are defined as reductions in user costs (traveltime safety vehicle operating costs) and agency maintenance costs Inaddition the ldquoresidual valuerdquo of an improvement is considered to be abenefit The implementation costs associated with making improvementsare estimated using an improvement cost submodel The information fromthe submodels is used to evaluate the benefits and costs of alternativeimprovement options and select for implementation improvements thatare economically justified See figure 6 for a simplified representation ofthe structure of the HERS model
3 In some analyses the baseline is a less ldquoaggressiverdquo improvement rather than noimprovement at all
Page 30 GAORCED-00-133 FWHArsquos HERS Model
Appendix II
Description of the HERS Model
Figure 6 Simplified Representation of the Structure of the HERS Model
Source FHWA data
Travel forecast
Forecast pavement condition
Forecast vehicle speed
Estimate improvement
costs
Estimate costs (travel time
operating safety emissions etc)
Evaluate and select
improvements for implementation
Page 31 GAORCED-00-133 FWHArsquos HERS Model
Appendix II
Description of the HERS Model
The travel forecast submodel projects traffic growth on each segmenttaking into account the price elasticity of travel demand For each segmentthe submodel uses information on the amount of current traffic (averageannual daily traffic) initial price of travel (user costs including operatingand travel time and safety costs) the statersquos traffic growth projection andprice elasticity to project future traffic volume in each funding periodPrice elasticity measures the effect of changes in travel costs on traveldemand4 Because there are no empirical estimates of elasticity withrespect to total travel demand FHWA uses a range of information onelasticities for the components that constitute total travel demandincluding the price of fuel vehicle wear tolls parking and travel timeFHWA constructs a total demand elasticity taking into account theseeffects as well as the share of each component in the total price of travelFor the 1999 CampP Report the HERS model uses a price elasticity of minus10 forthe short run (over one funding period) and minus16 for the long run (see appIII for sensitivity analysis results using minus15 and minus20 for the short- and long-run values respectively) The output of the travel forecast submodelmdashadjusted traffic growthmdashserves as an input in the pavement deteriorationspeed and accident submodels For example increases in traffic growthcan cause additional pavement wear and reduce average vehicle speed
The pavement deterioration submodel is used to measure the effect oftraffic and the environment on the future condition of the pavement Ingeneral this submodel uses adjusted traffic growth to project the effect oftraffic on a segmentrsquos future pavement condition in terms of its PSR PSR isa measure of pavement condition ranging from 0 (very poor or extremelydeteriorated pavement) to 50 (very good or smooth pavement) Inestimating future PSR the submodel relies on equations that were derivedin one climate zone (ldquowetfreezerdquo)5 To account for the effect ofenvironment on pavement wear the submodel assumes a minimumdeterioration rate In general the minimum rate is a function of the time thepavement was last improved and its maximum life span (from 25 to 40years depending on the type of pavement) Output from the pavement
4 More specifically the price elasticity of demand is a measure of the percentage change inquantity demanded resulting from a percentage change in price For example suppose theprice elasticity of demand for travel were estimated to be -08 Thus if the price of travelincreases by 1 percent travel demand would be expected to fall by 08 percent
5 HERS uses road test equations developed by the American Association of State HighwayOfficials at a test site in Ottawa Illinois Because this site is located in a wetfreeze climatezone the equations reflect the effect of only this one climate zone The equations are beingupdated to incorporate the effect of more environmental factors
Page 32 GAORCED-00-133 FWHArsquos HERS Model
Appendix II
Description of the HERS Model
deterioration submodel is used in the speed user operating costs andagency maintenance costs submodels For example increases in trafficgrowth can cause the pavement to deteriorate further increasing vehicleoperating costs Moreover worn pavement can reduce vehicle speeds slowtravel time and increase a vehiclersquos fuel and maintenance costs
The user costs submodel is used to assess the effect of future pavementcondition and vehicle speed on travel-time costs vehicle operating costsand safety costs Reductions in these costs brought about by highwayimprovements are considered ldquobenefitsrdquo In measuring travel-time coststhe submodel considers both the time spent traveling by drivers for workpurposes as well as by drivers for commuting leisure and other nonworkpurposes In the case of work-related trips the submodel estimates traveltime costs primarily on the basis of hourly compensation for each vehicleoccupant For the value of nonwork trips the submodel uses 60 percent ofeach occupantrsquos hourly compensation excluding fringe benefits
Vehicle operating costs are measured as a function of several factorsincluding pavement condition highway grades and curves and speedchange cycles (for example frequency of stopping) The submodelassesses the effect of these factors on various components of operatingcosts including fuel and oil consumption tire wear vehicle maintenanceand vehicle depreciation For example tire wear and vehicle maintenanceneeds can increase as pavement condition worsens In addition steepgrades and more frequent stopping can increase a vehiclersquos fuel and oilconsumption
The improvement cost submodel uses information on improvement typehighway class and terrain type (flat rolling and mountainous) to projectthe capital costs required to construct an improvement The capital costsrepresent the initial costs of constructing an improvement and depend onthe type of improvement In the case of improvements involvingresurfacing or reconstructing pavement and widening lanes improvementcosts represent initial construction costs and expenditures required toobtain rights of way For improvements that also involve an alignment theHERS model estimates an additional cost that represents the cost requiredto improve a segmentrsquos substandard curves and grades In addition to theseimprovements the model estimates the cost of improving substandardconditions on urban freeways requiring reconstruction in certaincircumstances (for example when shoulders are unfinished) Theimprovementsrsquo costs are used in evaluating the benefits and costs ofalternative improvement options
Page 33 GAORCED-00-133 FWHArsquos HERS Model
Appendix II
Description of the HERS Model
The HERS model uses information from the submodels to identify deficientsegments evaluate the benefits and costs of alternative improvementoptions and select and implement improvements The model calculatesbenefit-cost ratios (total benefits divided by capital costs) to evaluatealternative improvement options for deficient segments Improvementsthat meet specific investment criteria are selected and implemented Forexample under the economic efficiency scenario the HERS modelimplements for each deficient segment the most ldquoaggressiverdquo improvementwith a benefit-cost ratio greater than 1 In so doing the model maximizesnet benefits and as a result generates an economically efficient solutionldquoAggressiverdquo refers to the type of improvement that the model considersFor example both the resurfacing and pavement reconstructionimprovement types might improve the condition of a segment butpavement reconstruction would be the more aggressive option because itrequires more extensive construction The HERS model extrapolatesimprovement costs using expansion factors in the HPMS database Themodel combines the expanded improvement costs for all segments andsummarizes them by highway functional class
HERS Uses ComputationalShortcut to EstimateLifetime Benefits of anImprovement
For certain portions of the analysis the HERS model uses a ldquoshortcutrdquo toapproximate the benefits that would accrue over the lifetime of animprovement For example for deficient segments the model begins byconducting an analysis for one funding-period (5 years) to assess whetherthe segment should be improved in the current funding period or in somelater period A ldquono improvementrdquo baseline is used to evaluate the timing ofthis investment decision Because an improvement will continue to provideannual benefits after the first funding period is over the modelapproximates these future benefits using information on the improvementrsquoscost More specifically these future benefits are approximated by theimprovementrsquos construction cost minus the depreciation in theimprovement after the first funding period plus the cost savings from nothaving to maintain an unimproved segment in later funding periods Thetotal amount is referred to as the ldquoresidual valuerdquo of the improvement andis added to the other benefits associated with making an improvementIdeally in evaluating alternative improvement options the HERS modelshould compare estimated implementation costs with the present value ofbenefits expected to occur in each future funding period According to oneof the modelrsquos developers limitations in computer processing power whenthe HERS model was first developed prevented them from accounting forthe full life cycle of benefits As a result they developed a computationallysimpler algorithm to evaluate and select improvements The developer also
Page 34 GAORCED-00-133 FWHArsquos HERS Model
Appendix II
Description of the HERS Model
indicated that computational time is no longer an issue because of theimprovement in processing speeds
Page 35 GAORCED-00-133 FWHArsquos HERS Model
Appendix III
Results of Sensitivity Analyses Using theHERS Model AppendixIII
Table 3 summarizes the results of sensitivity analyses FHWA performed onthe HERS model FHWA changed the value of one of the variables used inthe HERS model by the amount indicated in the first column The results ofthese changes on the HERS estimate are shown in columns 2 through 4
Table 3 Percentage Change in HERS Estimates Resulting From Changes in Input Data
Note Sensitivity analyses based on HERS version 326D used in developing the 1999 CampP ReportFor all variables except price elasticity and discount rate changes were made in the HERSpreprocessor output data file For price elasticity and discount rate changes were made in the HERSparameter filea Variables are defined as follows
D is the thickness (or depth) of rigid pavement on sampled roadway segments and SN is the structuralnumber for flexible pavement on sampled roadway segments HPMS contains the actual value when itis known Otherwise HPMS contains a typical value for the functional system and pavement typebased on historical data or state practice The HERS preprocessor assigns either slab thickness (D) orstructural number (SN) to all paved sections for which SN or D was not supplied in the HPMSdatabase Depending on the information available the assignment process may reference thesectionrsquos surface type pavement section (if heavy medium or light) or traffic volume data
Peak Percent Trucks and Off-Peak Percent Trucks is an estimate of trucks as a percentage of all trafficduring peak or off-peak travel times States generally estimate using a small number of classificationcount stations comparing the sample section to similar segments elsewhere and using localknowledge of travel patterns
Weighted Design Speed is the speed for which the highway is designed weighted by the length of thehorizontal curves and tangents in a sample section The HPMS database requires weighted designspeed only for rural major collectors For rural sections and some urban sections (interstates and other
Percent change in HERS estimate b
Changes in variable a Rural Urban Overall
Decreasing ldquoDrdquo by 14 (equivalent to 10 percent of its range from 0 to 14) 03 07 05
Increasing ldquoDrdquo by 14 (equivalent to 10 percent of its range from 0 to 14) -01 -04 -03
Decreasing ldquoSNrdquo by 05 (equivalent to 10 percent of its range from 1 to 6) 66 44 52
Increasing ldquoSNrdquo by 05 (equivalent to 10 percent of its range from 1 to 6) -15 -08 -11
Decreasing ldquoOff-Peak Percent Trucksrdquo by 20 percent -12 -08 -09
Increasing ldquoOff-Peak Percent Trucksrdquo by 20 percent 11 04 07
Decreasing ldquoPeak Percent Trucksrdquo by 20 percent -09 -04 -06
Increasing ldquoPeak Percent Trucksrdquo by 20 percent 09 03 06
Decreasing ldquoWeighted Design Speedrdquo by 10 percent 09 17 14
Increasing ldquoWeighted Design Speedrdquo by 10 percent -06 -07 -06
Decreasing ldquoModified PSRrdquo by 10 percent 68 104 90
Increasing ldquoModified PSRrdquo by 10 percent -48 -71 -62
Changing ldquoPrice Elasticityrdquo from minus10 tominus15 for short run and from minus16 to minus20 for long run
92 31 55
Changing ldquoDiscount Raterdquo from 7 percent to 4 percent 54 58 56
Page 36 GAORCED-00-133 FWHArsquos HERS Model
Appendix III
Results of Sensitivity Analyses Using the
HERS Model
freeways and expressways) without reported curves the HERS preprocessor reads the weighteddesign speed from a lookup table (Appendix M in the HPMS Field Manual)
Modified PSR (Present Serviceability Rating) is a measure of the pavement condition of a samplesection For PSR states assign values to the pavement condition of a segment using a scale from 00(extremely deteriorated pavement) to 50 (new or nearly new superior pavement) Most states alsoprovide information on pavement roughness in terms of the International Roughness Index (IRI) TheHPMS database reports pavement condition in terms of the IRI for 705 percent of the segments andPSR for 847 percent of the segments However because HERS was not designed to use IRI data theHERS preprocessor converts all IRI measurements to a ldquomodifiedrdquo PSR value In cases where both IRIand PSR values are reported for a segment the IRI value is converted to a ldquomodifiedrdquo PSR valuewhich replaces the original PSR valueb Percent changes are based on HERS estimates of about $188 billion for Rural $291 billion forUrban and $479 billion for Overall (1997 dollars) calculated for the economic efficiency scenarioRural is the total annual average improvement cost for rural interstates other principal arterials minorarterials and major collectors Urban is the total annual average improvement cost for urbaninterstates other freeways and expressways other principal arterials minor arterials and collectorsOverall is combined Rural and Urban
Source FHWArsquos Highway Economic Requirements System
Page 37 GAORCED-00-133 FWHArsquos HERS Model
Appendix IV
GAO Contacts and Staff Acknowledgments AppendixIV
GAO Contacts John H Anderson Jr (202) 512-2834
Katherine Siggerud (202) 512-2834
StaffAcknowledgments
In addition to those named above Richard Calhoon Catherine ColwellTimothy J Guinane Mehrzad Nadji Judy K Pagano Raymond Sendejasand Phyllis F Scheinberg made key contributions to this report
Page 38 GAORCED-00-133 FWHArsquos HERS Model
(348194) Letter
Ordering Information The first copy of each GAO report is free Additional copies ofreports are $2 each A check or money order should be made out tothe Superintendent of Documents VISA and MasterCard creditcards are accepted also
Orders for 100 or more copies to be mailed to a single address arediscounted 25 percent
Orders by mailUS General Accounting OfficePO Box 37050Washington DC 20013
Orders by visitingRoom 1100700 4th St NW (corner of 4th and G Sts NW)US General Accounting OfficeWashington DC
Orders by phone(202) 512-6000fax (202) 512-6061TDD (202) 512-2537
Each day GAO issues a list of newly available reports andtestimony To receive facsimile copies of the daily list or any listfrom the past 30 days please call (202) 512-6000 using a touchtonephone A recorded menu will provide information on how to obtainthese lists
Orders by InternetFor information on how to access GAO reports on the Internetsend an e-mail message with ldquoinfordquo in the body to
infowwwgaogov
or visit GAOrsquos World Wide Web home page at
httpwwwgaogov
To Report FraudWaste or Abuse inFederal Programs
Contact one
bull Web site httpwwwgaogovfraudnetfraudnethtm
bull e-mail fraudnetgaogov
bull 1-800-424-5454 (automated answering system)
United StatesGeneral Accounting OfficeWashington DC 20548-0001
Official BusinessPenalty for Private Use $300
Address Correction Requested
Bulk RatePostage amp Fees Paid
GAOPermit No GI00
Appendixes
Appendix I Scope and Methodology
Appendix II Description of the HERS Model
Appendix III Results of Sensitivity Analyses Using the HERS Model
Appendix IV GAO Contacts and Staff Acknowledgments
Scope and Methodology
Description of the HERS Model
Results of Sensitivity Analyses Using the HERS Model
GAO Contacts and Staff Acknowledgments
B-284060
with HERS estimates the Department plans to expand its use ofuncertainty analysis beyond the analysis in the 1999 report for the CampPReport for 2001 in order to provide a more complete discussion of thisissue Finally in response to the recommendation to distinguish betweenHERS model estimates and other less reliable estimates the Departmentplans to clarify and enhance its discussion of these differences in the CampPReport for 2001 including a figure similar to our figure 1 In addition theDepartment will work to expand the scope of HERS to consider more typesof highway deficiencies and solutions to address them in order to reducethe percentage of estimates using these less reliable methods TheDepartment also provided technical and clarifying comments which weincorporated into the report as appropriate
We conducted our review from September 1999 through April 2000 inaccordance with generally accepted government auditing standards
We will send copies of this report to cognizant congressional committeesthe Honorable Rodney E Slater Secretary of Transportation and theHonorable Kenneth R Wykle Administrator Federal HighwayAdministration
If you or your staff have any questions about this report please contact meat (202) 512-2834 Appendix IV lists key contacts and contributors to thisreport
John H Anderson JrDirector Transportation Issues
Page 23 GAORCED-00-133 FWHArsquos HERS Model
Appendix I
AppendixesScope and Methodology AppendixI
To assess the reasonableness of the Highway Economic RequirementsSystems (HERS) modelrsquos assumptions and data and the usefulness of themodelrsquos results we reviewed the Principles for Federal InfrastructureInvestments (Executive Order 12893) the Federal HighwayAdministrationrsquos (FHWA) June 1999 expert panelrsquos comments on the HERSmodel and several FHWA reports and documents on the HERS model from1994 through 1999
In addition we discussed the HERS methodology with FHWA economistsand engineers and two of the FHWA contractors that helped develop themodel Moreover we interviewed users of the HERSrsquo results includinglegislative and executive-branch officials several members of the June1999 HERS expert panel and other transportation modeling experts (seelist of names below) We attended the June 1999 expert panel meeting aswell as an FHWA-sponsored outreach meeting on the Conditions andPerformance Report (CampP Report) in November 1998 We used standardeconomic principles to evaluate the modelrsquos application of benefit-costanalyses and the key economic assumptions used in the model and weasked FHWA to provide us with results for sensitivity analyses conductedusing alternative values for price elasticity and the discount rate Inaddition we reviewed the methods used by other transportation models toassess highway investments
To assess the reasonableness of the data used in the HERS model wereviewed technical documents supporting the primary source of datamdashtheHighway Performance Monitoring System (HPMS) database In additionwe discussed the reliability of the HPMS data with FHWA officialsincluding the Chief of Highway Systems Performance Because FHWA usesa ldquopreprocessorrdquo to convert the HPMS data into a HERS input data file wereviewed the actions performed by the preprocessor to assess whether thevalues of the data elements in HPMS are consistent with those in the HERSinput data file To do this we asked FHWA to provide us with basicstatistics and frequencies for several key data elements in the HPMSdatabase both before and after the data were converted by thepreprocessor The data included average annual daily trafficsurfacepavement type weighted design speed peak and off-peak percentof vehicles with greater than four tires speed limit and wideningfeasibility For most of the data items the actions of the preprocessorproduced at most minor changes in a very small percentage of the dataelements For the data items for which the actions of the preprocessoraffected a larger percentage of the data elements we asked FHWA toconduct a sensitivity analysis in order to assess the effect of changes in the
Page 24 GAORCED-00-133 FWHArsquos HERS Model
Appendix I
Scope and Methodology
data items on the HERS estimates using the maximum economic efficiencyscenario We found that changes in these data items did not markedlychange the HERS estimates See appendix III for the results of thesesensitivity analyses
In August 1987 we reported on our review of FHWArsquos HPMS samplingplan1 We found it to be statistically reasonable for selecting highwaysections nationally For our current effort we reviewed FHWArsquos currentguidance which the states use to sample segments and found it consistentwith the guidance we reviewed in 1987
The individuals we contacted include the following experts
bull Adjo Amekudzi Assistant Professor of Civil and EnvironmentalEngineering Georgia Institute of Technology
bull Kenneth D Boyer Professor of Economics Department of EconomicsMichigan State University
bull Gregorio Camus Programmer Battelle Memorial Institutebull David J Forkenbrock Professor of Civil and Environmental
Engineering and Chair Public Policy Center University of Iowabull David Greene Economist Oak Ridge National Laboratorybull Chris Hoban Principal Highway Engineer The World Bankbull Douglass Lee Principal Investigator Volpe National Transportation
Centerbull Sue McNeil Professor of Civil and Environmental Engineering Carnegie
Mellon Universitybull Mike Markow Cambridge Systematicsbull Michael Meyer Professor and Chair School of Civil and Environmental
Engineering Georgia Institute of Technologybull Carl L Monismith Robert Horonjeff Professor of Civil and
Environmental Engineering and Professor in the Graduate SchoolUniversity of California at Berkeley
bull Arlee Reno Engineer Cambridge Systematicsbull Herb Weinblatt Principal Cambridge Systematics
1 Highway Needs An Evaluation of DOTrsquos Process for Assessing the Nationrsquos HighwayNeeds (GAORCED-87-136)
Page 25 GAORCED-00-133 FWHArsquos HERS Model
Appendix II
Description of the HERS Model AppendixII
This appendix describes the basic structure of the HERS computer modelThe HERS model simulates infrastructure improvement decisions for thehighways it models by comparing the relative benefits and costs associatedwith alternative improvement options In conducting its analysis HERSuses an extensive set of data that are primarily collected and updated bythe states and maintained by FHWA in the HPMS database In addition theHERS model consists of several submodels representing specific highwayprocesses including traffic growth pavement wear vehicle speedaccidents and highway improvement costs The analysis which is basedon the current condition of the highway system is conducted over four 5-year periods for a total of 20 years Information from the submodels isused to identify deficient segments evaluate alternative improvementoptions and select and implement improvements HERS uses benefit-costratios (benefits divided by costs) to evaluate and select improvementsunder several investment scenarios The costs are the capital expendituresnecessary to construct the improvement and the benefits includereductions in usersrsquo operating costs agency maintenance costs and theldquoresidual valuerdquo of an improvement Residual value represents the benefitsexpected to accrue over the future life of an improvement beyond theanalysis period used in the model HERS uses a computational shortcut toestimate residual value
Page 26 GAORCED-00-133 FWHArsquos HERS Model
Appendix II
Description of the HERS Model
HERS Uses anExtensive Data Set
HERS uses input data that are created from the HPMS database and severalparameter and control files HPMS consists of all the data collected andupdated by the states on about 125000 randomly selected highwaysegments across the United States ranging in length from one block to 10miles The parameter and control files include information such asdeficiency and design standards and basic instructions for the modelThese data are converted to a HERS input file by a separate model calledthe ldquopreprocessorrdquo which aggregates all the data and performs variousdata manipulations For example the preprocessor assigns a speed limit of75 mph to segments with no legally mandated maximum speed limit and itconverts the International Roughness Index data developed by the states toa ldquomodifiedrdquo Present Serviceability Rating (PSR) index1 See figure 5 for arepresentation of the process used to create the HERS input data
1 The HERS pavement deterioration submodel was not designed to use the InternationalRoughness Index (IRI) so the preprocessor converts the IRI data to a ldquomodifiedrdquo PSR Theconversion is based on formulas developed by Al-Omari and Darter in RelationshipsBetween IRI and PSR Department of Civil Engineering University of Illinois 1992 Both IRIand PSR are measures of pavement condition but IRI strictly measures surface roughnesswhile PSR incorporates other types of pavement distress and may be based on professionaljudgement IRI is measured by a moving vehicle using non-contact sensors such as lasers
Page 27 GAORCED-00-133 FWHArsquos HERS Model
Appendix II
Description of the HERS Model
Figure 5 Schematic of Pr ocess Used to Create HERS Data
Source FHWA data
Developed in 1978 as a national highway transportation system databaseHPMS is a nationwide inventory system that includes limited data on allpublic roads and more detailed data for a sample of highway segmentsrepresenting nine different highway classes The sampled data includeinformation on highway capacity average annual daily traffic pavementroughness and lane width In addition to the sample data the states arerequired to report certain basic inventory information for all public roadsthat are open to traffic including an inventory of roads by highway classThe states also develop traffic forecasts for each segment In addition theHERS model uses ldquoexpansionrdquo factors to extrapolate the cost estimates tothe highway classes represented by the segments The expansion factorsare calculated by the HMPS software the states use to submit the data toFHWA
Overall the HPMS database includes nearly 100 variables According toFHWArsquos Chief of Highway Systems Performance the most accurate data inthe HPMS database are variables that are directly measurable such as thelength of the highway section number of lanes in the section and speedlimit By contrast the least accurate data are variables that are open tointerpretation by state personnel such as whether it is feasible to widen a
HERS preprocessor
HPMSdata file
HERS input data file
HERS model
Other data (parameter and control files)
Other data (parameter and control files)
Page 28 GAORCED-00-133 FWHArsquos HERS Model
Appendix II
Description of the HERS Model
segment and the estimated percent of trucks traveling in peak and off-peakperiods For example in assessing whether a segment can be widened onestate may view the potential high costs of widening as a detriment whileanother state may not In addition the states generally estimate the percentof trucks traveling during peak and off-peak periods from classificationcounts taken in a limited number of locations and of varying times anddurations
FHWA developed an HPMS field manual for the states to use in samplinghighway segments and identifying which data items to collect and how tomeasure them The sampling plan requires the states to select stratifiedrandom samples where the strata represent different volume groups fordifferent highway classes in the rural small urban and urbanized areas ofeach state Estimates of average annual daily traffic are based on volumecounts on each segment Since each state selects its own sampleimplementation of the sampling plan may vary
FHWA has instituted some measures to improve the reasonableness of theHPMS data FHWA provided the states with software they can use toassemble edit and submit their HPMS data This software automaticallyperforms checks for basic validity and missing data Once the states edittheir data they run an expansion subroutine that places an expansionfactor in each sample segmentrsquos record that is used to expand sample datato the full functional system Once FHWA receives the data from the statesthe data are passed through a software program that conducts basic logicchecks searches for anomalies and reviews the distributions of sample-related items FHWA staff review all items flagged during this check FHWAworks closely with the states to obtain answers to its questions concerningthe HPMS data Nonetheless the potential for some variability in HPMSdata remains because of potential differences in data collection techniquesamong the states
In addition from December 1996 through December 1998 FHWAreassessed its database needs in an effort to eliminate unnecessary dataitems and reduce the statesrsquo data collection burden2 As part of this effortFHWA conducted public meetings with state officials to obtain their viewson a future focus for the HPMS database As a result of the reassessmentFHWA will make significant changes to the HPMS database FHWA
2 Highway Performance Monitoring System Reassessment Final Report Revised April 1999FHWA-PL-99-001
Page 29 GAORCED-00-133 FWHArsquos HERS Model
Appendix II
Description of the HERS Model
changed the HPMS field manual and software to guide the states in makingneeded changes For example FHWA decided to delete some data that thestates have collected in the past but that it determined are no longerneeded such as the number of interchanges on segments In additionFHWA ldquocollapsedrdquo some data items into fewer categories to reduce stateofficialsrsquo time spent in collecting data For example the variable describingthe surface or pavement type was reported in 15 categories many of whichwere of little use so these were reduced to 6 categories In addition tothese changes the FHWA reassessment identified the potential forreducing the HPMS sample from over 125000 segments to 80000 segmentsto help reduce the statesrsquo data collection burden The states beganimplementing the changes during their data collection efforts in 1999 andwill report the revised data to FHWA by June 2000
The HERS input data and additional parameter and control data are usedby the HERS model to assess the relative benefits and costs of makinghighway improvements The post-preprocessor parameter and control datainclude information that is independent of specific segments such astravel-time costs widening feasibility criteria and the discount rate
The HERS model consists of several submodels representing specifichighway processes such as traffic growth pavement wear operating costsemissions costs and highway improvement costs The submodels are usedto project the future condition and performance of the highway systemwith and without improvements (for example the baseline) for eachfunding period and each segment3 In addition the benefits associated withmaking highway improvements are estimated using several submodelslinked together Benefits are defined as reductions in user costs (traveltime safety vehicle operating costs) and agency maintenance costs Inaddition the ldquoresidual valuerdquo of an improvement is considered to be abenefit The implementation costs associated with making improvementsare estimated using an improvement cost submodel The information fromthe submodels is used to evaluate the benefits and costs of alternativeimprovement options and select for implementation improvements thatare economically justified See figure 6 for a simplified representation ofthe structure of the HERS model
3 In some analyses the baseline is a less ldquoaggressiverdquo improvement rather than noimprovement at all
Page 30 GAORCED-00-133 FWHArsquos HERS Model
Appendix II
Description of the HERS Model
Figure 6 Simplified Representation of the Structure of the HERS Model
Source FHWA data
Travel forecast
Forecast pavement condition
Forecast vehicle speed
Estimate improvement
costs
Estimate costs (travel time
operating safety emissions etc)
Evaluate and select
improvements for implementation
Page 31 GAORCED-00-133 FWHArsquos HERS Model
Appendix II
Description of the HERS Model
The travel forecast submodel projects traffic growth on each segmenttaking into account the price elasticity of travel demand For each segmentthe submodel uses information on the amount of current traffic (averageannual daily traffic) initial price of travel (user costs including operatingand travel time and safety costs) the statersquos traffic growth projection andprice elasticity to project future traffic volume in each funding periodPrice elasticity measures the effect of changes in travel costs on traveldemand4 Because there are no empirical estimates of elasticity withrespect to total travel demand FHWA uses a range of information onelasticities for the components that constitute total travel demandincluding the price of fuel vehicle wear tolls parking and travel timeFHWA constructs a total demand elasticity taking into account theseeffects as well as the share of each component in the total price of travelFor the 1999 CampP Report the HERS model uses a price elasticity of minus10 forthe short run (over one funding period) and minus16 for the long run (see appIII for sensitivity analysis results using minus15 and minus20 for the short- and long-run values respectively) The output of the travel forecast submodelmdashadjusted traffic growthmdashserves as an input in the pavement deteriorationspeed and accident submodels For example increases in traffic growthcan cause additional pavement wear and reduce average vehicle speed
The pavement deterioration submodel is used to measure the effect oftraffic and the environment on the future condition of the pavement Ingeneral this submodel uses adjusted traffic growth to project the effect oftraffic on a segmentrsquos future pavement condition in terms of its PSR PSR isa measure of pavement condition ranging from 0 (very poor or extremelydeteriorated pavement) to 50 (very good or smooth pavement) Inestimating future PSR the submodel relies on equations that were derivedin one climate zone (ldquowetfreezerdquo)5 To account for the effect ofenvironment on pavement wear the submodel assumes a minimumdeterioration rate In general the minimum rate is a function of the time thepavement was last improved and its maximum life span (from 25 to 40years depending on the type of pavement) Output from the pavement
4 More specifically the price elasticity of demand is a measure of the percentage change inquantity demanded resulting from a percentage change in price For example suppose theprice elasticity of demand for travel were estimated to be -08 Thus if the price of travelincreases by 1 percent travel demand would be expected to fall by 08 percent
5 HERS uses road test equations developed by the American Association of State HighwayOfficials at a test site in Ottawa Illinois Because this site is located in a wetfreeze climatezone the equations reflect the effect of only this one climate zone The equations are beingupdated to incorporate the effect of more environmental factors
Page 32 GAORCED-00-133 FWHArsquos HERS Model
Appendix II
Description of the HERS Model
deterioration submodel is used in the speed user operating costs andagency maintenance costs submodels For example increases in trafficgrowth can cause the pavement to deteriorate further increasing vehicleoperating costs Moreover worn pavement can reduce vehicle speeds slowtravel time and increase a vehiclersquos fuel and maintenance costs
The user costs submodel is used to assess the effect of future pavementcondition and vehicle speed on travel-time costs vehicle operating costsand safety costs Reductions in these costs brought about by highwayimprovements are considered ldquobenefitsrdquo In measuring travel-time coststhe submodel considers both the time spent traveling by drivers for workpurposes as well as by drivers for commuting leisure and other nonworkpurposes In the case of work-related trips the submodel estimates traveltime costs primarily on the basis of hourly compensation for each vehicleoccupant For the value of nonwork trips the submodel uses 60 percent ofeach occupantrsquos hourly compensation excluding fringe benefits
Vehicle operating costs are measured as a function of several factorsincluding pavement condition highway grades and curves and speedchange cycles (for example frequency of stopping) The submodelassesses the effect of these factors on various components of operatingcosts including fuel and oil consumption tire wear vehicle maintenanceand vehicle depreciation For example tire wear and vehicle maintenanceneeds can increase as pavement condition worsens In addition steepgrades and more frequent stopping can increase a vehiclersquos fuel and oilconsumption
The improvement cost submodel uses information on improvement typehighway class and terrain type (flat rolling and mountainous) to projectthe capital costs required to construct an improvement The capital costsrepresent the initial costs of constructing an improvement and depend onthe type of improvement In the case of improvements involvingresurfacing or reconstructing pavement and widening lanes improvementcosts represent initial construction costs and expenditures required toobtain rights of way For improvements that also involve an alignment theHERS model estimates an additional cost that represents the cost requiredto improve a segmentrsquos substandard curves and grades In addition to theseimprovements the model estimates the cost of improving substandardconditions on urban freeways requiring reconstruction in certaincircumstances (for example when shoulders are unfinished) Theimprovementsrsquo costs are used in evaluating the benefits and costs ofalternative improvement options
Page 33 GAORCED-00-133 FWHArsquos HERS Model
Appendix II
Description of the HERS Model
The HERS model uses information from the submodels to identify deficientsegments evaluate the benefits and costs of alternative improvementoptions and select and implement improvements The model calculatesbenefit-cost ratios (total benefits divided by capital costs) to evaluatealternative improvement options for deficient segments Improvementsthat meet specific investment criteria are selected and implemented Forexample under the economic efficiency scenario the HERS modelimplements for each deficient segment the most ldquoaggressiverdquo improvementwith a benefit-cost ratio greater than 1 In so doing the model maximizesnet benefits and as a result generates an economically efficient solutionldquoAggressiverdquo refers to the type of improvement that the model considersFor example both the resurfacing and pavement reconstructionimprovement types might improve the condition of a segment butpavement reconstruction would be the more aggressive option because itrequires more extensive construction The HERS model extrapolatesimprovement costs using expansion factors in the HPMS database Themodel combines the expanded improvement costs for all segments andsummarizes them by highway functional class
HERS Uses ComputationalShortcut to EstimateLifetime Benefits of anImprovement
For certain portions of the analysis the HERS model uses a ldquoshortcutrdquo toapproximate the benefits that would accrue over the lifetime of animprovement For example for deficient segments the model begins byconducting an analysis for one funding-period (5 years) to assess whetherthe segment should be improved in the current funding period or in somelater period A ldquono improvementrdquo baseline is used to evaluate the timing ofthis investment decision Because an improvement will continue to provideannual benefits after the first funding period is over the modelapproximates these future benefits using information on the improvementrsquoscost More specifically these future benefits are approximated by theimprovementrsquos construction cost minus the depreciation in theimprovement after the first funding period plus the cost savings from nothaving to maintain an unimproved segment in later funding periods Thetotal amount is referred to as the ldquoresidual valuerdquo of the improvement andis added to the other benefits associated with making an improvementIdeally in evaluating alternative improvement options the HERS modelshould compare estimated implementation costs with the present value ofbenefits expected to occur in each future funding period According to oneof the modelrsquos developers limitations in computer processing power whenthe HERS model was first developed prevented them from accounting forthe full life cycle of benefits As a result they developed a computationallysimpler algorithm to evaluate and select improvements The developer also
Page 34 GAORCED-00-133 FWHArsquos HERS Model
Appendix II
Description of the HERS Model
indicated that computational time is no longer an issue because of theimprovement in processing speeds
Page 35 GAORCED-00-133 FWHArsquos HERS Model
Appendix III
Results of Sensitivity Analyses Using theHERS Model AppendixIII
Table 3 summarizes the results of sensitivity analyses FHWA performed onthe HERS model FHWA changed the value of one of the variables used inthe HERS model by the amount indicated in the first column The results ofthese changes on the HERS estimate are shown in columns 2 through 4
Table 3 Percentage Change in HERS Estimates Resulting From Changes in Input Data
Note Sensitivity analyses based on HERS version 326D used in developing the 1999 CampP ReportFor all variables except price elasticity and discount rate changes were made in the HERSpreprocessor output data file For price elasticity and discount rate changes were made in the HERSparameter filea Variables are defined as follows
D is the thickness (or depth) of rigid pavement on sampled roadway segments and SN is the structuralnumber for flexible pavement on sampled roadway segments HPMS contains the actual value when itis known Otherwise HPMS contains a typical value for the functional system and pavement typebased on historical data or state practice The HERS preprocessor assigns either slab thickness (D) orstructural number (SN) to all paved sections for which SN or D was not supplied in the HPMSdatabase Depending on the information available the assignment process may reference thesectionrsquos surface type pavement section (if heavy medium or light) or traffic volume data
Peak Percent Trucks and Off-Peak Percent Trucks is an estimate of trucks as a percentage of all trafficduring peak or off-peak travel times States generally estimate using a small number of classificationcount stations comparing the sample section to similar segments elsewhere and using localknowledge of travel patterns
Weighted Design Speed is the speed for which the highway is designed weighted by the length of thehorizontal curves and tangents in a sample section The HPMS database requires weighted designspeed only for rural major collectors For rural sections and some urban sections (interstates and other
Percent change in HERS estimate b
Changes in variable a Rural Urban Overall
Decreasing ldquoDrdquo by 14 (equivalent to 10 percent of its range from 0 to 14) 03 07 05
Increasing ldquoDrdquo by 14 (equivalent to 10 percent of its range from 0 to 14) -01 -04 -03
Decreasing ldquoSNrdquo by 05 (equivalent to 10 percent of its range from 1 to 6) 66 44 52
Increasing ldquoSNrdquo by 05 (equivalent to 10 percent of its range from 1 to 6) -15 -08 -11
Decreasing ldquoOff-Peak Percent Trucksrdquo by 20 percent -12 -08 -09
Increasing ldquoOff-Peak Percent Trucksrdquo by 20 percent 11 04 07
Decreasing ldquoPeak Percent Trucksrdquo by 20 percent -09 -04 -06
Increasing ldquoPeak Percent Trucksrdquo by 20 percent 09 03 06
Decreasing ldquoWeighted Design Speedrdquo by 10 percent 09 17 14
Increasing ldquoWeighted Design Speedrdquo by 10 percent -06 -07 -06
Decreasing ldquoModified PSRrdquo by 10 percent 68 104 90
Increasing ldquoModified PSRrdquo by 10 percent -48 -71 -62
Changing ldquoPrice Elasticityrdquo from minus10 tominus15 for short run and from minus16 to minus20 for long run
92 31 55
Changing ldquoDiscount Raterdquo from 7 percent to 4 percent 54 58 56
Page 36 GAORCED-00-133 FWHArsquos HERS Model
Appendix III
Results of Sensitivity Analyses Using the
HERS Model
freeways and expressways) without reported curves the HERS preprocessor reads the weighteddesign speed from a lookup table (Appendix M in the HPMS Field Manual)
Modified PSR (Present Serviceability Rating) is a measure of the pavement condition of a samplesection For PSR states assign values to the pavement condition of a segment using a scale from 00(extremely deteriorated pavement) to 50 (new or nearly new superior pavement) Most states alsoprovide information on pavement roughness in terms of the International Roughness Index (IRI) TheHPMS database reports pavement condition in terms of the IRI for 705 percent of the segments andPSR for 847 percent of the segments However because HERS was not designed to use IRI data theHERS preprocessor converts all IRI measurements to a ldquomodifiedrdquo PSR value In cases where both IRIand PSR values are reported for a segment the IRI value is converted to a ldquomodifiedrdquo PSR valuewhich replaces the original PSR valueb Percent changes are based on HERS estimates of about $188 billion for Rural $291 billion forUrban and $479 billion for Overall (1997 dollars) calculated for the economic efficiency scenarioRural is the total annual average improvement cost for rural interstates other principal arterials minorarterials and major collectors Urban is the total annual average improvement cost for urbaninterstates other freeways and expressways other principal arterials minor arterials and collectorsOverall is combined Rural and Urban
Source FHWArsquos Highway Economic Requirements System
Page 37 GAORCED-00-133 FWHArsquos HERS Model
Appendix IV
GAO Contacts and Staff Acknowledgments AppendixIV
GAO Contacts John H Anderson Jr (202) 512-2834
Katherine Siggerud (202) 512-2834
StaffAcknowledgments
In addition to those named above Richard Calhoon Catherine ColwellTimothy J Guinane Mehrzad Nadji Judy K Pagano Raymond Sendejasand Phyllis F Scheinberg made key contributions to this report
Page 38 GAORCED-00-133 FWHArsquos HERS Model
(348194) Letter
Ordering Information The first copy of each GAO report is free Additional copies ofreports are $2 each A check or money order should be made out tothe Superintendent of Documents VISA and MasterCard creditcards are accepted also
Orders for 100 or more copies to be mailed to a single address arediscounted 25 percent
Orders by mailUS General Accounting OfficePO Box 37050Washington DC 20013
Orders by visitingRoom 1100700 4th St NW (corner of 4th and G Sts NW)US General Accounting OfficeWashington DC
Orders by phone(202) 512-6000fax (202) 512-6061TDD (202) 512-2537
Each day GAO issues a list of newly available reports andtestimony To receive facsimile copies of the daily list or any listfrom the past 30 days please call (202) 512-6000 using a touchtonephone A recorded menu will provide information on how to obtainthese lists
Orders by InternetFor information on how to access GAO reports on the Internetsend an e-mail message with ldquoinfordquo in the body to
infowwwgaogov
or visit GAOrsquos World Wide Web home page at
httpwwwgaogov
To Report FraudWaste or Abuse inFederal Programs
Contact one
bull Web site httpwwwgaogovfraudnetfraudnethtm
bull e-mail fraudnetgaogov
bull 1-800-424-5454 (automated answering system)
United StatesGeneral Accounting OfficeWashington DC 20548-0001
Official BusinessPenalty for Private Use $300
Address Correction Requested
Bulk RatePostage amp Fees Paid
GAOPermit No GI00
Appendixes
Appendix I Scope and Methodology
Appendix II Description of the HERS Model
Appendix III Results of Sensitivity Analyses Using the HERS Model
Appendix IV GAO Contacts and Staff Acknowledgments
Scope and Methodology
Description of the HERS Model
Results of Sensitivity Analyses Using the HERS Model
GAO Contacts and Staff Acknowledgments
Appendix I
Scope and Methodology
data items on the HERS estimates using the maximum economic efficiencyscenario We found that changes in these data items did not markedlychange the HERS estimates See appendix III for the results of thesesensitivity analyses
In August 1987 we reported on our review of FHWArsquos HPMS samplingplan1 We found it to be statistically reasonable for selecting highwaysections nationally For our current effort we reviewed FHWArsquos currentguidance which the states use to sample segments and found it consistentwith the guidance we reviewed in 1987
The individuals we contacted include the following experts
bull Adjo Amekudzi Assistant Professor of Civil and EnvironmentalEngineering Georgia Institute of Technology
bull Kenneth D Boyer Professor of Economics Department of EconomicsMichigan State University
bull Gregorio Camus Programmer Battelle Memorial Institutebull David J Forkenbrock Professor of Civil and Environmental
Engineering and Chair Public Policy Center University of Iowabull David Greene Economist Oak Ridge National Laboratorybull Chris Hoban Principal Highway Engineer The World Bankbull Douglass Lee Principal Investigator Volpe National Transportation
Centerbull Sue McNeil Professor of Civil and Environmental Engineering Carnegie
Mellon Universitybull Mike Markow Cambridge Systematicsbull Michael Meyer Professor and Chair School of Civil and Environmental
Engineering Georgia Institute of Technologybull Carl L Monismith Robert Horonjeff Professor of Civil and
Environmental Engineering and Professor in the Graduate SchoolUniversity of California at Berkeley
bull Arlee Reno Engineer Cambridge Systematicsbull Herb Weinblatt Principal Cambridge Systematics
1 Highway Needs An Evaluation of DOTrsquos Process for Assessing the Nationrsquos HighwayNeeds (GAORCED-87-136)
Page 25 GAORCED-00-133 FWHArsquos HERS Model
Appendix II
Description of the HERS Model AppendixII
This appendix describes the basic structure of the HERS computer modelThe HERS model simulates infrastructure improvement decisions for thehighways it models by comparing the relative benefits and costs associatedwith alternative improvement options In conducting its analysis HERSuses an extensive set of data that are primarily collected and updated bythe states and maintained by FHWA in the HPMS database In addition theHERS model consists of several submodels representing specific highwayprocesses including traffic growth pavement wear vehicle speedaccidents and highway improvement costs The analysis which is basedon the current condition of the highway system is conducted over four 5-year periods for a total of 20 years Information from the submodels isused to identify deficient segments evaluate alternative improvementoptions and select and implement improvements HERS uses benefit-costratios (benefits divided by costs) to evaluate and select improvementsunder several investment scenarios The costs are the capital expendituresnecessary to construct the improvement and the benefits includereductions in usersrsquo operating costs agency maintenance costs and theldquoresidual valuerdquo of an improvement Residual value represents the benefitsexpected to accrue over the future life of an improvement beyond theanalysis period used in the model HERS uses a computational shortcut toestimate residual value
Page 26 GAORCED-00-133 FWHArsquos HERS Model
Appendix II
Description of the HERS Model
HERS Uses anExtensive Data Set
HERS uses input data that are created from the HPMS database and severalparameter and control files HPMS consists of all the data collected andupdated by the states on about 125000 randomly selected highwaysegments across the United States ranging in length from one block to 10miles The parameter and control files include information such asdeficiency and design standards and basic instructions for the modelThese data are converted to a HERS input file by a separate model calledthe ldquopreprocessorrdquo which aggregates all the data and performs variousdata manipulations For example the preprocessor assigns a speed limit of75 mph to segments with no legally mandated maximum speed limit and itconverts the International Roughness Index data developed by the states toa ldquomodifiedrdquo Present Serviceability Rating (PSR) index1 See figure 5 for arepresentation of the process used to create the HERS input data
1 The HERS pavement deterioration submodel was not designed to use the InternationalRoughness Index (IRI) so the preprocessor converts the IRI data to a ldquomodifiedrdquo PSR Theconversion is based on formulas developed by Al-Omari and Darter in RelationshipsBetween IRI and PSR Department of Civil Engineering University of Illinois 1992 Both IRIand PSR are measures of pavement condition but IRI strictly measures surface roughnesswhile PSR incorporates other types of pavement distress and may be based on professionaljudgement IRI is measured by a moving vehicle using non-contact sensors such as lasers
Page 27 GAORCED-00-133 FWHArsquos HERS Model
Appendix II
Description of the HERS Model
Figure 5 Schematic of Pr ocess Used to Create HERS Data
Source FHWA data
Developed in 1978 as a national highway transportation system databaseHPMS is a nationwide inventory system that includes limited data on allpublic roads and more detailed data for a sample of highway segmentsrepresenting nine different highway classes The sampled data includeinformation on highway capacity average annual daily traffic pavementroughness and lane width In addition to the sample data the states arerequired to report certain basic inventory information for all public roadsthat are open to traffic including an inventory of roads by highway classThe states also develop traffic forecasts for each segment In addition theHERS model uses ldquoexpansionrdquo factors to extrapolate the cost estimates tothe highway classes represented by the segments The expansion factorsare calculated by the HMPS software the states use to submit the data toFHWA
Overall the HPMS database includes nearly 100 variables According toFHWArsquos Chief of Highway Systems Performance the most accurate data inthe HPMS database are variables that are directly measurable such as thelength of the highway section number of lanes in the section and speedlimit By contrast the least accurate data are variables that are open tointerpretation by state personnel such as whether it is feasible to widen a
HERS preprocessor
HPMSdata file
HERS input data file
HERS model
Other data (parameter and control files)
Other data (parameter and control files)
Page 28 GAORCED-00-133 FWHArsquos HERS Model
Appendix II
Description of the HERS Model
segment and the estimated percent of trucks traveling in peak and off-peakperiods For example in assessing whether a segment can be widened onestate may view the potential high costs of widening as a detriment whileanother state may not In addition the states generally estimate the percentof trucks traveling during peak and off-peak periods from classificationcounts taken in a limited number of locations and of varying times anddurations
FHWA developed an HPMS field manual for the states to use in samplinghighway segments and identifying which data items to collect and how tomeasure them The sampling plan requires the states to select stratifiedrandom samples where the strata represent different volume groups fordifferent highway classes in the rural small urban and urbanized areas ofeach state Estimates of average annual daily traffic are based on volumecounts on each segment Since each state selects its own sampleimplementation of the sampling plan may vary
FHWA has instituted some measures to improve the reasonableness of theHPMS data FHWA provided the states with software they can use toassemble edit and submit their HPMS data This software automaticallyperforms checks for basic validity and missing data Once the states edittheir data they run an expansion subroutine that places an expansionfactor in each sample segmentrsquos record that is used to expand sample datato the full functional system Once FHWA receives the data from the statesthe data are passed through a software program that conducts basic logicchecks searches for anomalies and reviews the distributions of sample-related items FHWA staff review all items flagged during this check FHWAworks closely with the states to obtain answers to its questions concerningthe HPMS data Nonetheless the potential for some variability in HPMSdata remains because of potential differences in data collection techniquesamong the states
In addition from December 1996 through December 1998 FHWAreassessed its database needs in an effort to eliminate unnecessary dataitems and reduce the statesrsquo data collection burden2 As part of this effortFHWA conducted public meetings with state officials to obtain their viewson a future focus for the HPMS database As a result of the reassessmentFHWA will make significant changes to the HPMS database FHWA
2 Highway Performance Monitoring System Reassessment Final Report Revised April 1999FHWA-PL-99-001
Page 29 GAORCED-00-133 FWHArsquos HERS Model
Appendix II
Description of the HERS Model
changed the HPMS field manual and software to guide the states in makingneeded changes For example FHWA decided to delete some data that thestates have collected in the past but that it determined are no longerneeded such as the number of interchanges on segments In additionFHWA ldquocollapsedrdquo some data items into fewer categories to reduce stateofficialsrsquo time spent in collecting data For example the variable describingthe surface or pavement type was reported in 15 categories many of whichwere of little use so these were reduced to 6 categories In addition tothese changes the FHWA reassessment identified the potential forreducing the HPMS sample from over 125000 segments to 80000 segmentsto help reduce the statesrsquo data collection burden The states beganimplementing the changes during their data collection efforts in 1999 andwill report the revised data to FHWA by June 2000
The HERS input data and additional parameter and control data are usedby the HERS model to assess the relative benefits and costs of makinghighway improvements The post-preprocessor parameter and control datainclude information that is independent of specific segments such astravel-time costs widening feasibility criteria and the discount rate
The HERS model consists of several submodels representing specifichighway processes such as traffic growth pavement wear operating costsemissions costs and highway improvement costs The submodels are usedto project the future condition and performance of the highway systemwith and without improvements (for example the baseline) for eachfunding period and each segment3 In addition the benefits associated withmaking highway improvements are estimated using several submodelslinked together Benefits are defined as reductions in user costs (traveltime safety vehicle operating costs) and agency maintenance costs Inaddition the ldquoresidual valuerdquo of an improvement is considered to be abenefit The implementation costs associated with making improvementsare estimated using an improvement cost submodel The information fromthe submodels is used to evaluate the benefits and costs of alternativeimprovement options and select for implementation improvements thatare economically justified See figure 6 for a simplified representation ofthe structure of the HERS model
3 In some analyses the baseline is a less ldquoaggressiverdquo improvement rather than noimprovement at all
Page 30 GAORCED-00-133 FWHArsquos HERS Model
Appendix II
Description of the HERS Model
Figure 6 Simplified Representation of the Structure of the HERS Model
Source FHWA data
Travel forecast
Forecast pavement condition
Forecast vehicle speed
Estimate improvement
costs
Estimate costs (travel time
operating safety emissions etc)
Evaluate and select
improvements for implementation
Page 31 GAORCED-00-133 FWHArsquos HERS Model
Appendix II
Description of the HERS Model
The travel forecast submodel projects traffic growth on each segmenttaking into account the price elasticity of travel demand For each segmentthe submodel uses information on the amount of current traffic (averageannual daily traffic) initial price of travel (user costs including operatingand travel time and safety costs) the statersquos traffic growth projection andprice elasticity to project future traffic volume in each funding periodPrice elasticity measures the effect of changes in travel costs on traveldemand4 Because there are no empirical estimates of elasticity withrespect to total travel demand FHWA uses a range of information onelasticities for the components that constitute total travel demandincluding the price of fuel vehicle wear tolls parking and travel timeFHWA constructs a total demand elasticity taking into account theseeffects as well as the share of each component in the total price of travelFor the 1999 CampP Report the HERS model uses a price elasticity of minus10 forthe short run (over one funding period) and minus16 for the long run (see appIII for sensitivity analysis results using minus15 and minus20 for the short- and long-run values respectively) The output of the travel forecast submodelmdashadjusted traffic growthmdashserves as an input in the pavement deteriorationspeed and accident submodels For example increases in traffic growthcan cause additional pavement wear and reduce average vehicle speed
The pavement deterioration submodel is used to measure the effect oftraffic and the environment on the future condition of the pavement Ingeneral this submodel uses adjusted traffic growth to project the effect oftraffic on a segmentrsquos future pavement condition in terms of its PSR PSR isa measure of pavement condition ranging from 0 (very poor or extremelydeteriorated pavement) to 50 (very good or smooth pavement) Inestimating future PSR the submodel relies on equations that were derivedin one climate zone (ldquowetfreezerdquo)5 To account for the effect ofenvironment on pavement wear the submodel assumes a minimumdeterioration rate In general the minimum rate is a function of the time thepavement was last improved and its maximum life span (from 25 to 40years depending on the type of pavement) Output from the pavement
4 More specifically the price elasticity of demand is a measure of the percentage change inquantity demanded resulting from a percentage change in price For example suppose theprice elasticity of demand for travel were estimated to be -08 Thus if the price of travelincreases by 1 percent travel demand would be expected to fall by 08 percent
5 HERS uses road test equations developed by the American Association of State HighwayOfficials at a test site in Ottawa Illinois Because this site is located in a wetfreeze climatezone the equations reflect the effect of only this one climate zone The equations are beingupdated to incorporate the effect of more environmental factors
Page 32 GAORCED-00-133 FWHArsquos HERS Model
Appendix II
Description of the HERS Model
deterioration submodel is used in the speed user operating costs andagency maintenance costs submodels For example increases in trafficgrowth can cause the pavement to deteriorate further increasing vehicleoperating costs Moreover worn pavement can reduce vehicle speeds slowtravel time and increase a vehiclersquos fuel and maintenance costs
The user costs submodel is used to assess the effect of future pavementcondition and vehicle speed on travel-time costs vehicle operating costsand safety costs Reductions in these costs brought about by highwayimprovements are considered ldquobenefitsrdquo In measuring travel-time coststhe submodel considers both the time spent traveling by drivers for workpurposes as well as by drivers for commuting leisure and other nonworkpurposes In the case of work-related trips the submodel estimates traveltime costs primarily on the basis of hourly compensation for each vehicleoccupant For the value of nonwork trips the submodel uses 60 percent ofeach occupantrsquos hourly compensation excluding fringe benefits
Vehicle operating costs are measured as a function of several factorsincluding pavement condition highway grades and curves and speedchange cycles (for example frequency of stopping) The submodelassesses the effect of these factors on various components of operatingcosts including fuel and oil consumption tire wear vehicle maintenanceand vehicle depreciation For example tire wear and vehicle maintenanceneeds can increase as pavement condition worsens In addition steepgrades and more frequent stopping can increase a vehiclersquos fuel and oilconsumption
The improvement cost submodel uses information on improvement typehighway class and terrain type (flat rolling and mountainous) to projectthe capital costs required to construct an improvement The capital costsrepresent the initial costs of constructing an improvement and depend onthe type of improvement In the case of improvements involvingresurfacing or reconstructing pavement and widening lanes improvementcosts represent initial construction costs and expenditures required toobtain rights of way For improvements that also involve an alignment theHERS model estimates an additional cost that represents the cost requiredto improve a segmentrsquos substandard curves and grades In addition to theseimprovements the model estimates the cost of improving substandardconditions on urban freeways requiring reconstruction in certaincircumstances (for example when shoulders are unfinished) Theimprovementsrsquo costs are used in evaluating the benefits and costs ofalternative improvement options
Page 33 GAORCED-00-133 FWHArsquos HERS Model
Appendix II
Description of the HERS Model
The HERS model uses information from the submodels to identify deficientsegments evaluate the benefits and costs of alternative improvementoptions and select and implement improvements The model calculatesbenefit-cost ratios (total benefits divided by capital costs) to evaluatealternative improvement options for deficient segments Improvementsthat meet specific investment criteria are selected and implemented Forexample under the economic efficiency scenario the HERS modelimplements for each deficient segment the most ldquoaggressiverdquo improvementwith a benefit-cost ratio greater than 1 In so doing the model maximizesnet benefits and as a result generates an economically efficient solutionldquoAggressiverdquo refers to the type of improvement that the model considersFor example both the resurfacing and pavement reconstructionimprovement types might improve the condition of a segment butpavement reconstruction would be the more aggressive option because itrequires more extensive construction The HERS model extrapolatesimprovement costs using expansion factors in the HPMS database Themodel combines the expanded improvement costs for all segments andsummarizes them by highway functional class
HERS Uses ComputationalShortcut to EstimateLifetime Benefits of anImprovement
For certain portions of the analysis the HERS model uses a ldquoshortcutrdquo toapproximate the benefits that would accrue over the lifetime of animprovement For example for deficient segments the model begins byconducting an analysis for one funding-period (5 years) to assess whetherthe segment should be improved in the current funding period or in somelater period A ldquono improvementrdquo baseline is used to evaluate the timing ofthis investment decision Because an improvement will continue to provideannual benefits after the first funding period is over the modelapproximates these future benefits using information on the improvementrsquoscost More specifically these future benefits are approximated by theimprovementrsquos construction cost minus the depreciation in theimprovement after the first funding period plus the cost savings from nothaving to maintain an unimproved segment in later funding periods Thetotal amount is referred to as the ldquoresidual valuerdquo of the improvement andis added to the other benefits associated with making an improvementIdeally in evaluating alternative improvement options the HERS modelshould compare estimated implementation costs with the present value ofbenefits expected to occur in each future funding period According to oneof the modelrsquos developers limitations in computer processing power whenthe HERS model was first developed prevented them from accounting forthe full life cycle of benefits As a result they developed a computationallysimpler algorithm to evaluate and select improvements The developer also
Page 34 GAORCED-00-133 FWHArsquos HERS Model
Appendix II
Description of the HERS Model
indicated that computational time is no longer an issue because of theimprovement in processing speeds
Page 35 GAORCED-00-133 FWHArsquos HERS Model
Appendix III
Results of Sensitivity Analyses Using theHERS Model AppendixIII
Table 3 summarizes the results of sensitivity analyses FHWA performed onthe HERS model FHWA changed the value of one of the variables used inthe HERS model by the amount indicated in the first column The results ofthese changes on the HERS estimate are shown in columns 2 through 4
Table 3 Percentage Change in HERS Estimates Resulting From Changes in Input Data
Note Sensitivity analyses based on HERS version 326D used in developing the 1999 CampP ReportFor all variables except price elasticity and discount rate changes were made in the HERSpreprocessor output data file For price elasticity and discount rate changes were made in the HERSparameter filea Variables are defined as follows
D is the thickness (or depth) of rigid pavement on sampled roadway segments and SN is the structuralnumber for flexible pavement on sampled roadway segments HPMS contains the actual value when itis known Otherwise HPMS contains a typical value for the functional system and pavement typebased on historical data or state practice The HERS preprocessor assigns either slab thickness (D) orstructural number (SN) to all paved sections for which SN or D was not supplied in the HPMSdatabase Depending on the information available the assignment process may reference thesectionrsquos surface type pavement section (if heavy medium or light) or traffic volume data
Peak Percent Trucks and Off-Peak Percent Trucks is an estimate of trucks as a percentage of all trafficduring peak or off-peak travel times States generally estimate using a small number of classificationcount stations comparing the sample section to similar segments elsewhere and using localknowledge of travel patterns
Weighted Design Speed is the speed for which the highway is designed weighted by the length of thehorizontal curves and tangents in a sample section The HPMS database requires weighted designspeed only for rural major collectors For rural sections and some urban sections (interstates and other
Percent change in HERS estimate b
Changes in variable a Rural Urban Overall
Decreasing ldquoDrdquo by 14 (equivalent to 10 percent of its range from 0 to 14) 03 07 05
Increasing ldquoDrdquo by 14 (equivalent to 10 percent of its range from 0 to 14) -01 -04 -03
Decreasing ldquoSNrdquo by 05 (equivalent to 10 percent of its range from 1 to 6) 66 44 52
Increasing ldquoSNrdquo by 05 (equivalent to 10 percent of its range from 1 to 6) -15 -08 -11
Decreasing ldquoOff-Peak Percent Trucksrdquo by 20 percent -12 -08 -09
Increasing ldquoOff-Peak Percent Trucksrdquo by 20 percent 11 04 07
Decreasing ldquoPeak Percent Trucksrdquo by 20 percent -09 -04 -06
Increasing ldquoPeak Percent Trucksrdquo by 20 percent 09 03 06
Decreasing ldquoWeighted Design Speedrdquo by 10 percent 09 17 14
Increasing ldquoWeighted Design Speedrdquo by 10 percent -06 -07 -06
Decreasing ldquoModified PSRrdquo by 10 percent 68 104 90
Increasing ldquoModified PSRrdquo by 10 percent -48 -71 -62
Changing ldquoPrice Elasticityrdquo from minus10 tominus15 for short run and from minus16 to minus20 for long run
92 31 55
Changing ldquoDiscount Raterdquo from 7 percent to 4 percent 54 58 56
Page 36 GAORCED-00-133 FWHArsquos HERS Model
Appendix III
Results of Sensitivity Analyses Using the
HERS Model
freeways and expressways) without reported curves the HERS preprocessor reads the weighteddesign speed from a lookup table (Appendix M in the HPMS Field Manual)
Modified PSR (Present Serviceability Rating) is a measure of the pavement condition of a samplesection For PSR states assign values to the pavement condition of a segment using a scale from 00(extremely deteriorated pavement) to 50 (new or nearly new superior pavement) Most states alsoprovide information on pavement roughness in terms of the International Roughness Index (IRI) TheHPMS database reports pavement condition in terms of the IRI for 705 percent of the segments andPSR for 847 percent of the segments However because HERS was not designed to use IRI data theHERS preprocessor converts all IRI measurements to a ldquomodifiedrdquo PSR value In cases where both IRIand PSR values are reported for a segment the IRI value is converted to a ldquomodifiedrdquo PSR valuewhich replaces the original PSR valueb Percent changes are based on HERS estimates of about $188 billion for Rural $291 billion forUrban and $479 billion for Overall (1997 dollars) calculated for the economic efficiency scenarioRural is the total annual average improvement cost for rural interstates other principal arterials minorarterials and major collectors Urban is the total annual average improvement cost for urbaninterstates other freeways and expressways other principal arterials minor arterials and collectorsOverall is combined Rural and Urban
Source FHWArsquos Highway Economic Requirements System
Page 37 GAORCED-00-133 FWHArsquos HERS Model
Appendix IV
GAO Contacts and Staff Acknowledgments AppendixIV
GAO Contacts John H Anderson Jr (202) 512-2834
Katherine Siggerud (202) 512-2834
StaffAcknowledgments
In addition to those named above Richard Calhoon Catherine ColwellTimothy J Guinane Mehrzad Nadji Judy K Pagano Raymond Sendejasand Phyllis F Scheinberg made key contributions to this report
Page 38 GAORCED-00-133 FWHArsquos HERS Model
(348194) Letter
Ordering Information The first copy of each GAO report is free Additional copies ofreports are $2 each A check or money order should be made out tothe Superintendent of Documents VISA and MasterCard creditcards are accepted also
Orders for 100 or more copies to be mailed to a single address arediscounted 25 percent
Orders by mailUS General Accounting OfficePO Box 37050Washington DC 20013
Orders by visitingRoom 1100700 4th St NW (corner of 4th and G Sts NW)US General Accounting OfficeWashington DC
Orders by phone(202) 512-6000fax (202) 512-6061TDD (202) 512-2537
Each day GAO issues a list of newly available reports andtestimony To receive facsimile copies of the daily list or any listfrom the past 30 days please call (202) 512-6000 using a touchtonephone A recorded menu will provide information on how to obtainthese lists
Orders by InternetFor information on how to access GAO reports on the Internetsend an e-mail message with ldquoinfordquo in the body to
infowwwgaogov
or visit GAOrsquos World Wide Web home page at
httpwwwgaogov
To Report FraudWaste or Abuse inFederal Programs
Contact one
bull Web site httpwwwgaogovfraudnetfraudnethtm
bull e-mail fraudnetgaogov
bull 1-800-424-5454 (automated answering system)
United StatesGeneral Accounting OfficeWashington DC 20548-0001
Official BusinessPenalty for Private Use $300
Address Correction Requested
Bulk RatePostage amp Fees Paid
GAOPermit No GI00
Appendixes
Appendix I Scope and Methodology
Appendix II Description of the HERS Model
Appendix III Results of Sensitivity Analyses Using the HERS Model
Appendix IV GAO Contacts and Staff Acknowledgments
Scope and Methodology
Description of the HERS Model
Results of Sensitivity Analyses Using the HERS Model
GAO Contacts and Staff Acknowledgments
Appendix II
Description of the HERS Model
indicated that computational time is no longer an issue because of theimprovement in processing speeds
Page 35 GAORCED-00-133 FWHArsquos HERS Model
Appendix III
Results of Sensitivity Analyses Using theHERS Model AppendixIII
Table 3 summarizes the results of sensitivity analyses FHWA performed onthe HERS model FHWA changed the value of one of the variables used inthe HERS model by the amount indicated in the first column The results ofthese changes on the HERS estimate are shown in columns 2 through 4
Table 3 Percentage Change in HERS Estimates Resulting From Changes in Input Data
Note Sensitivity analyses based on HERS version 326D used in developing the 1999 CampP ReportFor all variables except price elasticity and discount rate changes were made in the HERSpreprocessor output data file For price elasticity and discount rate changes were made in the HERSparameter filea Variables are defined as follows
D is the thickness (or depth) of rigid pavement on sampled roadway segments and SN is the structuralnumber for flexible pavement on sampled roadway segments HPMS contains the actual value when itis known Otherwise HPMS contains a typical value for the functional system and pavement typebased on historical data or state practice The HERS preprocessor assigns either slab thickness (D) orstructural number (SN) to all paved sections for which SN or D was not supplied in the HPMSdatabase Depending on the information available the assignment process may reference thesectionrsquos surface type pavement section (if heavy medium or light) or traffic volume data
Peak Percent Trucks and Off-Peak Percent Trucks is an estimate of trucks as a percentage of all trafficduring peak or off-peak travel times States generally estimate using a small number of classificationcount stations comparing the sample section to similar segments elsewhere and using localknowledge of travel patterns
Weighted Design Speed is the speed for which the highway is designed weighted by the length of thehorizontal curves and tangents in a sample section The HPMS database requires weighted designspeed only for rural major collectors For rural sections and some urban sections (interstates and other
Percent change in HERS estimate b
Changes in variable a Rural Urban Overall
Decreasing ldquoDrdquo by 14 (equivalent to 10 percent of its range from 0 to 14) 03 07 05
Increasing ldquoDrdquo by 14 (equivalent to 10 percent of its range from 0 to 14) -01 -04 -03
Decreasing ldquoSNrdquo by 05 (equivalent to 10 percent of its range from 1 to 6) 66 44 52
Increasing ldquoSNrdquo by 05 (equivalent to 10 percent of its range from 1 to 6) -15 -08 -11
Decreasing ldquoOff-Peak Percent Trucksrdquo by 20 percent -12 -08 -09
Increasing ldquoOff-Peak Percent Trucksrdquo by 20 percent 11 04 07
Decreasing ldquoPeak Percent Trucksrdquo by 20 percent -09 -04 -06
Increasing ldquoPeak Percent Trucksrdquo by 20 percent 09 03 06
Decreasing ldquoWeighted Design Speedrdquo by 10 percent 09 17 14
Increasing ldquoWeighted Design Speedrdquo by 10 percent -06 -07 -06
Decreasing ldquoModified PSRrdquo by 10 percent 68 104 90
Increasing ldquoModified PSRrdquo by 10 percent -48 -71 -62
Changing ldquoPrice Elasticityrdquo from minus10 tominus15 for short run and from minus16 to minus20 for long run
92 31 55
Changing ldquoDiscount Raterdquo from 7 percent to 4 percent 54 58 56
Page 36 GAORCED-00-133 FWHArsquos HERS Model
Appendix III
Results of Sensitivity Analyses Using the
HERS Model
freeways and expressways) without reported curves the HERS preprocessor reads the weighteddesign speed from a lookup table (Appendix M in the HPMS Field Manual)
Modified PSR (Present Serviceability Rating) is a measure of the pavement condition of a samplesection For PSR states assign values to the pavement condition of a segment using a scale from 00(extremely deteriorated pavement) to 50 (new or nearly new superior pavement) Most states alsoprovide information on pavement roughness in terms of the International Roughness Index (IRI) TheHPMS database reports pavement condition in terms of the IRI for 705 percent of the segments andPSR for 847 percent of the segments However because HERS was not designed to use IRI data theHERS preprocessor converts all IRI measurements to a ldquomodifiedrdquo PSR value In cases where both IRIand PSR values are reported for a segment the IRI value is converted to a ldquomodifiedrdquo PSR valuewhich replaces the original PSR valueb Percent changes are based on HERS estimates of about $188 billion for Rural $291 billion forUrban and $479 billion for Overall (1997 dollars) calculated for the economic efficiency scenarioRural is the total annual average improvement cost for rural interstates other principal arterials minorarterials and major collectors Urban is the total annual average improvement cost for urbaninterstates other freeways and expressways other principal arterials minor arterials and collectorsOverall is combined Rural and Urban
Source FHWArsquos Highway Economic Requirements System
Page 37 GAORCED-00-133 FWHArsquos HERS Model
Appendix IV
GAO Contacts and Staff Acknowledgments AppendixIV
GAO Contacts John H Anderson Jr (202) 512-2834
Katherine Siggerud (202) 512-2834
StaffAcknowledgments
In addition to those named above Richard Calhoon Catherine ColwellTimothy J Guinane Mehrzad Nadji Judy K Pagano Raymond Sendejasand Phyllis F Scheinberg made key contributions to this report
Page 38 GAORCED-00-133 FWHArsquos HERS Model
(348194) Letter
Ordering Information The first copy of each GAO report is free Additional copies ofreports are $2 each A check or money order should be made out tothe Superintendent of Documents VISA and MasterCard creditcards are accepted also
Orders for 100 or more copies to be mailed to a single address arediscounted 25 percent
Orders by mailUS General Accounting OfficePO Box 37050Washington DC 20013
Orders by visitingRoom 1100700 4th St NW (corner of 4th and G Sts NW)US General Accounting OfficeWashington DC
Orders by phone(202) 512-6000fax (202) 512-6061TDD (202) 512-2537
Each day GAO issues a list of newly available reports andtestimony To receive facsimile copies of the daily list or any listfrom the past 30 days please call (202) 512-6000 using a touchtonephone A recorded menu will provide information on how to obtainthese lists
Orders by InternetFor information on how to access GAO reports on the Internetsend an e-mail message with ldquoinfordquo in the body to
infowwwgaogov
or visit GAOrsquos World Wide Web home page at
httpwwwgaogov
To Report FraudWaste or Abuse inFederal Programs
Contact one
bull Web site httpwwwgaogovfraudnetfraudnethtm
bull e-mail fraudnetgaogov
bull 1-800-424-5454 (automated answering system)
United StatesGeneral Accounting OfficeWashington DC 20548-0001
Official BusinessPenalty for Private Use $300
Address Correction Requested
Bulk RatePostage amp Fees Paid
GAOPermit No GI00
Appendixes
Appendix I Scope and Methodology
Appendix II Description of the HERS Model
Appendix III Results of Sensitivity Analyses Using the HERS Model
Appendix IV GAO Contacts and Staff Acknowledgments
Scope and Methodology
Description of the HERS Model
Results of Sensitivity Analyses Using the HERS Model
GAO Contacts and Staff Acknowledgments
Appendix III
Results of Sensitivity Analyses Using the
HERS Model
freeways and expressways) without reported curves the HERS preprocessor reads the weighteddesign speed from a lookup table (Appendix M in the HPMS Field Manual)
Modified PSR (Present Serviceability Rating) is a measure of the pavement condition of a samplesection For PSR states assign values to the pavement condition of a segment using a scale from 00(extremely deteriorated pavement) to 50 (new or nearly new superior pavement) Most states alsoprovide information on pavement roughness in terms of the International Roughness Index (IRI) TheHPMS database reports pavement condition in terms of the IRI for 705 percent of the segments andPSR for 847 percent of the segments However because HERS was not designed to use IRI data theHERS preprocessor converts all IRI measurements to a ldquomodifiedrdquo PSR value In cases where both IRIand PSR values are reported for a segment the IRI value is converted to a ldquomodifiedrdquo PSR valuewhich replaces the original PSR valueb Percent changes are based on HERS estimates of about $188 billion for Rural $291 billion forUrban and $479 billion for Overall (1997 dollars) calculated for the economic efficiency scenarioRural is the total annual average improvement cost for rural interstates other principal arterials minorarterials and major collectors Urban is the total annual average improvement cost for urbaninterstates other freeways and expressways other principal arterials minor arterials and collectorsOverall is combined Rural and Urban
Source FHWArsquos Highway Economic Requirements System
Page 37 GAORCED-00-133 FWHArsquos HERS Model
Appendix IV
GAO Contacts and Staff Acknowledgments AppendixIV
GAO Contacts John H Anderson Jr (202) 512-2834
Katherine Siggerud (202) 512-2834
StaffAcknowledgments
In addition to those named above Richard Calhoon Catherine ColwellTimothy J Guinane Mehrzad Nadji Judy K Pagano Raymond Sendejasand Phyllis F Scheinberg made key contributions to this report
Page 38 GAORCED-00-133 FWHArsquos HERS Model
(348194) Letter
Ordering Information The first copy of each GAO report is free Additional copies ofreports are $2 each A check or money order should be made out tothe Superintendent of Documents VISA and MasterCard creditcards are accepted also
Orders for 100 or more copies to be mailed to a single address arediscounted 25 percent
Orders by mailUS General Accounting OfficePO Box 37050Washington DC 20013
Orders by visitingRoom 1100700 4th St NW (corner of 4th and G Sts NW)US General Accounting OfficeWashington DC
Orders by phone(202) 512-6000fax (202) 512-6061TDD (202) 512-2537
Each day GAO issues a list of newly available reports andtestimony To receive facsimile copies of the daily list or any listfrom the past 30 days please call (202) 512-6000 using a touchtonephone A recorded menu will provide information on how to obtainthese lists
Orders by InternetFor information on how to access GAO reports on the Internetsend an e-mail message with ldquoinfordquo in the body to
infowwwgaogov
or visit GAOrsquos World Wide Web home page at
httpwwwgaogov
To Report FraudWaste or Abuse inFederal Programs
Contact one
bull Web site httpwwwgaogovfraudnetfraudnethtm
bull e-mail fraudnetgaogov
bull 1-800-424-5454 (automated answering system)
United StatesGeneral Accounting OfficeWashington DC 20548-0001
Official BusinessPenalty for Private Use $300
Address Correction Requested
Bulk RatePostage amp Fees Paid
GAOPermit No GI00
Appendixes
Appendix I Scope and Methodology
Appendix II Description of the HERS Model
Appendix III Results of Sensitivity Analyses Using the HERS Model
Appendix IV GAO Contacts and Staff Acknowledgments
Scope and Methodology
Description of the HERS Model
Results of Sensitivity Analyses Using the HERS Model
GAO Contacts and Staff Acknowledgments
United StatesGeneral Accounting OfficeWashington DC 20548-0001
Official BusinessPenalty for Private Use $300
Address Correction Requested
Bulk RatePostage amp Fees Paid
GAOPermit No GI00
Appendixes
Appendix I Scope and Methodology
Appendix II Description of the HERS Model
Appendix III Results of Sensitivity Analyses Using the HERS Model
Appendix IV GAO Contacts and Staff Acknowledgments
Scope and Methodology
Description of the HERS Model
Results of Sensitivity Analyses Using the HERS Model