87
HIH Case Study on Provisioning Round 2 30 Aprl 2000 A Core Curriculum for Insurance Supervisors
�
HIH Case Studyon Provisioning
Round 230 Apr�l 2000
A Core Curriculum for Insurance Supervisors

Copyright © 2006 International Association of Insurance Supervisors (IAIS).All rights reserved.
The material in this module is copyrighted. It may be used for training by competent organiza-tions with permission. Please contact the IAIS to seek permission.
�
HIH Case Study on Provisioning (Round 2)
The primary objective of this round of the case study is to ascertain what role, if any, poor measurement or misstatement of insurance liabilities played in the collapse of HIH; what warning signals, if any, were provided by the information that was available to the regulator; and what actions, if any, would be appropriate for a regulator in the face of such information.
It is relevant to note that, since round 1, HIH has successfully bid for and taken over FAI Insurance.
Attached is a briefing note prepared by the senior manager of the branch respon-sible for HIH.
Your tasks for this round are to assess the information provided in order to:
• Identify and list major concerns with HIH’s outstanding claims provision (OCP), identifying any particular portfolios that cause you concern
• Draft a brief memo to the APRA board (a bullet point outline is sufficient) indi-cating your concern, if any, regarding HIH’s OCP and its effect on HIH’s regula-tory solvency position. This memo should recommend and justify (in terms of the law) a course of supervisory action.

Insurance Superv�s�on Core Curr�culum
2
MEMORANDUM FOR GENERAL MANAGERBRIEFING NOTE ON HIH INSURANCE LIMITED
30 September 2000
At a recent industry function, two participants from another general insurance com-pany suggested that APRA should have a close look at the claims provisioning practices of HIH. In addition to this market intelligence, we have also received an anonymous document from an ex-HIH employee which criticizes the company’s approach in a number of areas, including provisioning. This information is somewhat at odds with our own risk rating of HIH as low risk (see Attachment 2).
In light of this information and given past concerns about the level of provisioning within FAI (now part of the HIH Group), I believe it is timely to closely review the ad-equacy of HIH’s outstanding claims provisions (OCP).
I have attached the following for your information:
• Attachment 1—Relevant extracts from the briefing note prepared for APRA’s first prudential visit to HIH earlier this month.
• Attachment 2—A file note prepared earlier this month in relation to the an-nual review of HIH C&G as at 30 June 1999. Appended to Attachment 2 are a printout from APRA’s Genesis Analytic System showing HIH’s claims assess-ment for June 1999 (based on Quarterly return data) and the HIH (C&G) an-nual returns (form 108) to APRA as at 30 June 1999 and 31 December 1997.
• Attachment 3—A file note providing extracts from an anonymous document received by APRA entitled “HIH Due Diligence”.
• Attachment 4—A memorandum from a meeting with HIH’s consulting actuary David Slee conducted as a follow up to the anonymous report.
• Attachment 5—Conclusions from a paper presented to the Institute of Actuaries of Australia seminar in November 1997 titled “Public and Products Liability—Experience, Expectations, Expensive?”
• Attachment 6—Extract from a paper entitled “Lack of Industry Profitability and Other Stories” by Peter McCarthy and Geoff Trahair (well respected company actuaries) presented to the Institute of Actuaries of Australia’s Twelfth General Insurance Seminar in November 1999. As with Attachment 5 the issues appear to be relevant to HIH.
Senior Manager

HIH Case Study on Prov�s�on�ng (Round 2)
3
Attachment 1
Memorandum
Extracts from Briefing Note on HIH for First Prudential Visit (Scheduled for 9 March)
7 March 2000
Introduction
HIH Insurance is currently the second largest General Insurance group in Australia, after NRMA/RACV (in terms of Inside Australia business). It has approximately 13% market share by Gross Earned Premium and 15% market share by Total Assets.
HIH Insurance Limited changed its financial year-end from 31 December to 30 June and the reporting period to June 1999 is therefore an 18-month period. APRA and ASIC both approved the above changes.
Acquisitions
A number of acquisitions took place in the 1998/1999 financial year. The most signifi-cant of these, in terms of impact on HIH’s asset structure, liabilities, product distribu-tion and many other areas, was the acquisition of FAI.
Investment Strategy
The takeover of FAI confirmed HIH’s strategies to secure a major market share position in Australia, change its business mix and to diversify distribution into every available distribution channel. HIH continues to adopt the strategy of selling non-core assets inherited from FAI. Recent media reports about the intention to sell its interest in the St Moritz Hotel in New York were confirmed on the 2nd of March, when HIH announced a deal to sell 50% of its stake in the property for US $65 million and lease the other 50% on a 75-year lease.
HIH’s investment strategy is based on the premise that the Group’s business risk should not be compounded by asset risk. HIH’s preferred strategy is to hold a large pro-portion of cash and fixed interest assets, the cashflows of which are matched with the expected cashflows of the liabilities.

Insurance Superv�s�on Core Curr�culum
�
Ratings
Standard & Poor’s has given a financial strength rating of A- (Strong) to all the core un-derwriting entities in the HIH Insurance Group. This includes all the major Australian subsidiaries: CIC Insurance, FAI General Insurance and HIH Casualty and General.
Solvency & Capital
HIH Insurance Group has net assets of $946.4 million (see summary balance sheet for June 1999 in Annex). This includes Intangibles and future income tax benefits which are excluded from the statutory solvency calculation. The assets that can be counted to-wards solvency total $572.7 million. The required solvency margin for the group, based on the 15% of Outstanding Claims Provision test (the operative test for HIH) is $397.4 million. This gives HIH Insurance Group a solvency surplus of $175.3 million (solvency coverage of 144%). The calculations are summarized below:
There are views in the market that HIH’s capital ratios are too low. These views were not supported by the Standard & Poor’s report (February 2000), which stated that:
“Capitalization is considered sound in the context of the nature of HIH’s insurance risk profile, the use of subordinated debt and hybrid instruments to support solvency, and the level of growth assets present”
S&P maintained its A- rating for the group. A recent report by ABN-AMRO ex-pressed an opinion that the capital problem lies in funding high levels of future growth. The report stated that modest organic growth can be met by existing capital resources and reinsurance, but faster (e.g. double-digit) growth in net premiums will need a cap-ital issue.
Overall, I believe that HIH’s capital levels are adequate provided future growth is predominantly organic rather than by takeover. There was mention in a recent news-
June �999 $m $m $m
Shareholders’ Equity 946.4
Less Statutory Exclusions
Intangibles –346.5
Future Income Tax Benefit –27.2 –373.7
Net Assets less Statutory Exclusions 572.7
OCP net of Reinsurance recoveries 2,649.3
Minimum solvency (15% x OCP) 397.4
Solvency Surplus 175.3
Solvency Coverage 1.44

HIH Case Study on Prov�s�on�ng (Round 2)
�
paper article that HIH may be considering a capital raising in the first half of 2000. At this point HIH still has a sizeable issue of Convertible and Converting Notes. These will need to convert to equity to support further growth.
Assets
For a break-down of some of HIH’s asset classes as at June 1999 see the summary bal-ance sheet in the attached annex.
According to their 1999 Annual Report all assets are measured at net market value (market less estimated selling costs) at balance date. Changes in market value between balance dates are recognized in the profit and loss account. Market values of non-traded assets are recorded at independent valuations or at the directors’ valuations based on current economic conditions.
With the exception of some investments taken over from FAI, HIH has a relatively conservative investment strategy. The group believes that an aggressive investment strategy would introduce volatility to performance.
The effect of the FAI acquisition on the investment portfolio has been to add sub-stantial amounts of property and equity as well as some other classes of investments. A recent article in the Sydney Morning Herald hinted that HIH is keen to reduce the amount of property in its investment portfolio. I believe this to be a move in the right direction.
Liabilities
HIH’s outstanding claims provision for the Group rose from $2 billion to $3.7 billion between 31/12/1997 and 30/6/1999. This was largely due to the acquisition of FAI. The ABN-AMRO report mentioned above, expressed some concerns regarding HIH’s claims reserves. It stated that some market analysts perceive them to be inadequate, but it stressed that these views are unproven. It is hard to assess the adequacy of HIH’s OCP without an actuarial review, but the recently signed agreement between HIH and Swiss Re and the $250 million deterioration in the current OCP cover should provide some comfort to APRA.
HIH has $0.5 billion in various borrowings including bond issues, various loans and convertible notes issue. There are a number of hybrid instruments issued by HIH and they include Converting Notes currently at $213.1 million all classified as equity and Convertible Notes at $121 million of which $65.3 million is equity and the re-maining $56 million is debt.

Insurance Superv�s�on Core Curr�culum
�
Reinsurance
The HIH Group has two sets of reinsurance arrangements in place. The first one is a tra-ditional reinsurance program and the second one a balance sheet protection program in the form of financial reinsurance with a profit-smoothing component.
APRA has recently approved a balance sheet protection agreement between HIH and Swiss Re as reinsurance. This is a five-year (from 1 July 1999 to 30 June 2004) multi-class agreement that sits on top of the existing reinsurance program. It provides some protection in case there is some deterioration in the current OCP as well as acts as a profit smoothing mechanism. It is a self-funding program with a small amount of risk transfer (which was deemed to be sufficient for the program to be treated as rein-surance) and it will have an effect of reducing the volatility in reported earnings of the Group and the Share Price.
Outlook
A number of events took place in recent months which should translate into a more positive outlook for HIH in terms of profitability. The recent rise in interest rates (and bond yields) and any further rises will have a positive effect on the group. A recent fall in the value of the bond portfolio was and will be offset by a similar fall in the OCP, as the group matches its assets and liabilities. Any new cash inflows will be invested at higher yields, and should thereby have a positive effect on operating results.
Diversification of the US worker’s compensation business out of California and rising premium rates in California will have a strong positive effect on the performance of the region. Performance in the UK market should also improve with reductions of net retentions on the catastrophe account and the unlikely scenario of continued fre-quency and severity catastrophes in the world.
The profit smoothing agreement with Swiss Re will reduce the volatility of earn-ings over the next few years. The most likely scenario is that HIH Insurance will report higher (than actual) earnings in the first two years of the agreement (i.e. 1999/2000 and 2000/2001) and lower (than actual) earnings in the remaining years. The expected strong rise in premium rates over the two to three years is expected to neutralize the effect of reduced earnings in the later years of the agreement.
There are a number of threats to HIH which have the potential to significantly af-fect its results in the future. Rising reinsurance premiums will undoubtedly have a large impact, especially for a company that cedes almost a third of its premiums. HIH will either have to increase its retentions (as they have indicated they might do with the first catastrophe layer—increasing event retentions to $20 million) or pay higher reinsur-ance premiums. Both strategies have disadvantages.
The new Goods and Services Tax (GST) system of indirect taxes (to be introduced on 1 July of this year) will also test HIH’s computer systems. The ability of computer

HIH Case Study on Prov�s�on�ng (Round 2)
�
systems to cope will be tested as will the adequacy of provisions raised to cope with the tax liability. The last and probably most significant threat is the possibility of a property and sharemarket correction in the future. The fall in property prices in Sydney would have a strong effect on the profit and loss statement as would a fall in stock prices. HIH has a significant exposure to the property market. The group has a hedging program in place for its equity book, but this might prove not to be enough.
Overall the outlook for HIH Insurance Group is strong and, provided no extraor-dinary event like a large market correction or another Sydney hailstorm occurs, the group should see improved results in the future.
Senior Analyst

Insurance Superv�s�on Core Curr�culum
�
Annex to File Note 7 March 2000
Summary of Audited Balance Sheet for HIH Group as at June 1999
June �999 $m $m
Current Assets 3,596.8
Cash 638.7
Receivables 1,427.0
Investments 803.5
Reinsurance recoveries receivable 415.5
Deferred acquisition costs 278.3
Other 33.8
Non-Current Assets 3,264.5
Receivables 35.0
Investments 1,790.1
Plant and equipment 147.8
Reinsurance recoveries receivable 634.7
Intangibles 346.5
Other 310.4
Plus:
NSW Workers Compensation Statutory Funds 864.1
Total Assets 7,725.4
Current Liabilities 3,289.1
Creditors and borrowings 754.5
Provisions 46.3
Outstanding Claims 1,415.5
Unearned premiums 1,038.9
Other 33.9
Non-Current Liabilities 2,625.8
Creditors and borrowings 335.8
Provisions 6.0
Outstanding claims 2,284.0
Plus:
NSW Workers Compensation Statutory Funds 864.1
Total Liabilities 6,779.0
Net Assets 946.4
Shareholders’ Equity
Share Capital 684.2
Convertible Notes 65.3
Converting Notes 213.1
Reserves –1.0
Retained profits –26.5
Total equity of Parent Entity 935.1
Outside equity interests in controlled entities 11.3
Total Shareholders’ Equity 946.4

HIH Case Study on Prov�s�on�ng (Round 2)
9
Attachment 2
Note for File APRA
Ref: HIH C&G Annual Review as at 30 June 199924 March 2000
IntroductionHIH Casualty and General Insurance Limited (HIH C&G) is one of three main un-derwriters in the HIH Group, which is the second largest general insurance group in Australia, after NRMA. The group writes business in all classes and in all states in Aus-tralia as well as UK, New Zealand, Hong Kong, Argentina and California. Total assets of the group are approximately $8 billion with net assets at $1 billion. The group’s net premium revenue is about $2 billion.
HIH has taken over a number of companies in recent times, including CIC Insur-ance, FAI Insurance and most recently World Marine and General Insurance (bought from BHP). Thus the group continues to face a number of challenges, trying to achieve as many benefits from these acquisitions as possible.
HIH C&G specializes in commercial underwriting, with casualty classes (PI, Public Liability, Worker’s Compensation (WC) and Commercial Motor Vehicle (CMV)) and Marine & Aviation being the main classes it underwrites. The company has paid up capital of $439.225 m and is categorized as low priority. An unqualified auditor’s state-ment was signed by the approved auditor Mr. Alan P. Davies of Arthur Anderson.
A consultation took place with HIH on March 9, 2000. It took the form of a number of presentations by the upper management of the company.
Solvency
Solvency Surplus $169.7 m (In Total); $278.1 m (Inside Australia)Solvency Coverage 2.5 (In Total); 4.66 (Inside Australia)The solvency surplus rose over the past 18 months from $130.2 m to $169.7 m.
Insurance Superv�s�on Core Curr�culum
�0
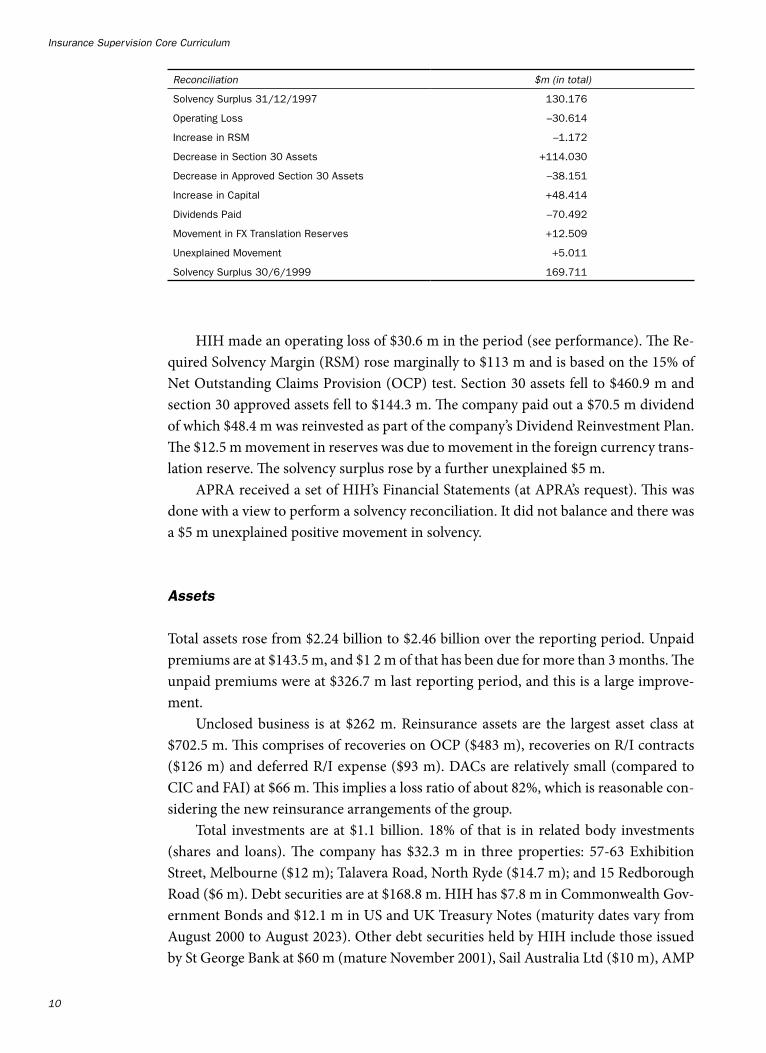
HIH made an operating loss of $30.6 m in the period (see performance). The Re-quired Solvency Margin (RSM) rose marginally to $113 m and is based on the 15% of Net Outstanding Claims Provision (OCP) test. Section 30 assets fell to $460.9 m and section 30 approved assets fell to $144.3 m. The company paid out a $70.5 m dividend of which $48.4 m was reinvested as part of the company’s Dividend Reinvestment Plan. The $12.5 m movement in reserves was due to movement in the foreign currency trans-lation reserve. The solvency surplus rose by a further unexplained $5 m.
APRA received a set of HIH’s Financial Statements (at APRA’s request). This was done with a view to perform a solvency reconciliation. It did not balance and there was a $5 m unexplained positive movement in solvency.
Assets
Total assets rose from $2.24 billion to $2.46 billion over the reporting period. Unpaid premiums are at $143.5 m, and $1 2 m of that has been due for more than 3 months. The unpaid premiums were at $326.7 m last reporting period, and this is a large improve-ment.
Unclosed business is at $262 m. Reinsurance assets are the largest asset class at $702.5 m. This comprises of recoveries on OCP ($483 m), recoveries on R/I contracts ($126 m) and deferred R/I expense ($93 m). DACs are relatively small (compared to CIC and FAI) at $66 m. This implies a loss ratio of about 82%, which is reasonable con-sidering the new reinsurance arrangements of the group.
Total investments are at $1.1 billion. 18% of that is in related body investments (shares and loans). The company has $32.3 m in three properties: 57-63 Exhibition Street, Melbourne ($12 m); Talavera Road, North Ryde ($14.7 m); and 15 Redborough Road ($6 m). Debt securities are at $168.8 m. HIH has $7.8 m in Commonwealth Gov-ernment Bonds and $12.1 m in US and UK Treasury Notes (maturity dates vary from August 2000 to August 2023). Other debt securities held by HIH include those issued by St George Bank at $60 m (mature November 2001), Sail Australia Ltd ($10 m), AMP
Reconc�l�at�on $m (�n total)
Solvency Surplus 31/12/1997 130.176
Operating Loss –30.614
Increase in RSM –1.172
Decrease in Section 30 Assets +114.030
Decrease in Approved Section 30 Assets –38.151
Increase in Capital +48.414
Dividends Paid –70.492
Movement in FX Translation Reserves +12.509
Unexplained Movement +5.011
Solvency Surplus 30/6/1999 169.711

HIH Case Study on Prov�s�on�ng (Round 2)
��
Infrastructure Trust ($17.9 m), Goldman Sachs ($3.7 m) and KFW International Fi-nance ($2.5 m). QTC, WATC and NSWTC (State issued Treasury Corporations) Bonds are at $53.8 m. They have various maturity dates and as seen above are issued by a number of different issuers.
$244 m (10%) is in various unlisted equity unit trusts including Lend Lease Invest-ment Trust ($134.8 m), First State Fund ($65.2 m), Macquarie Investment Limited ($8.9 m) and State Street Unit Trust ($23 m). HIH also has $20.3 m worth of direct share-holding in 29 companies. This portfolio appears well diversified with Keycorp Ltd ($3.9 m), News Corporation Ltd ($1.9 m), Rio Tinto Ltd ($1.36 m) and NAB ($1 m) being the four largest shareholdings.
HIH has $129 m (5.2%) in various deposits - $35 m is with SG, $31.2 m in BT Fu-tures account (all inside Australia) and $19.3 m is with AMP and $15.4 m with Courts (both in UK).
Total loans are at $152.4 m (2.2%). Staff loans are at $566K (excluded under sec-tion 30). Loans to non-related parties are at $55 m. The largest ones are to Lonplot Pty Ltd at $39.9 m, Wylde Street Potts Point at $9.6 m and Merwala P/L at $3.9 m. Loans to various related bodies are at $97 m
Related body shareholdings are a very significant item at $350.8 m (14.2%). There is a $197.7 m stake in CIC Insurance Ltd ($17.1 m of that has been section 30 approved - solvency surplus); $127.1 m stake in CIC General Insurance Holdings Ltd (all section 30 approved); $21.4 m stake in HIH (NSW) Pty Ltd (not approved); and various others (not approved).
HIH uses equity and bond futures as a hedging tool. They reported an aggregate exposure to all derivatives at $27.2 m. Currently the BT futures held have market value of $3.5 m.
Liabilities
Total liabilities rose from $1.6 billion to $1.865 billion. UPP is the second largest liability at $359.6 m (19.3%). After adjusting the total premium figure, to only reflect the last 12 months, the UPP to Total Premium ratio is at 48.6%. The OCP rose from $1.05 billion to $1.236 billion (17.8% rise). The inside Australia reported provision is lower than the actuarial estimate (there are no data about the outside Australia provisions). The classes of business with a deficit include Marine & Aviation ($5 m deficit), public & products liability ($77 m deficit), WC ($6 m) and other ($31 m). It is uncertain whether any pru-dential margins have been included in the actuarial estimates. It would appear prudent from APRA’s perspective to request an actuarial review of the OCP calculation.
The claims assessment form produced by Genesis (see Appendix) has produced a number of ‘alerts’. Average provisions for PI and WC are marginally below ‘standard amounts’; loss ratio for HH is lower and for PI, PL and I/T higher than the ‘standard range’; Average Provisioning divided by Average Settlement Cost is too low for PI, PL
Insurance Superv�s�on Core Curr�culum
�2
and WC; and Provisions divided by Net Claims Paid is too low for ISR, Aviation, PI, PL, Travel and LT. I do not consider any of the above to be too significant.
Other large liabilities include amounts due on R/I at $184 m (9.9%), bank balances at $22.3 m, all other provisions at $38 m and other creditors at $25.8 m.
Performance
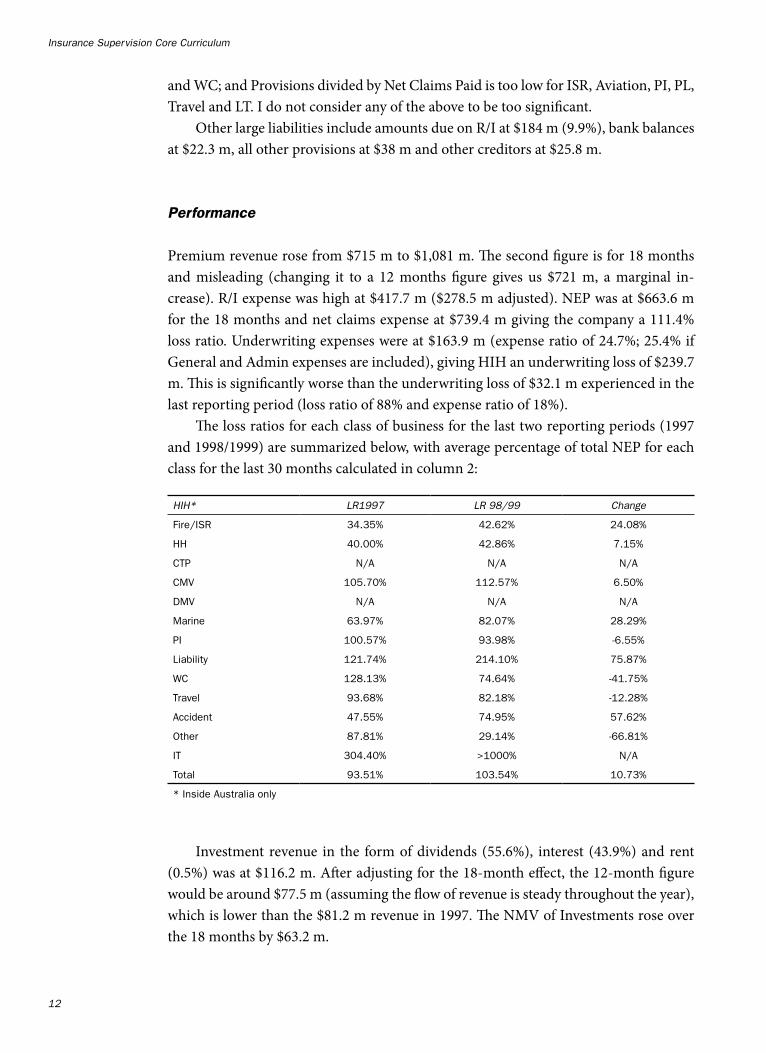
Premium revenue rose from $715 m to $1,081 m. The second figure is for 18 months and misleading (changing it to a 12 months figure gives us $721 m, a marginal in-crease). R/I expense was high at $417.7 m ($278.5 m adjusted). NEP was at $663.6 m for the 18 months and net claims expense at $739.4 m giving the company a 111.4% loss ratio. Underwriting expenses were at $163.9 m (expense ratio of 24.7%; 25.4% if General and Admin expenses are included), giving HIH an underwriting loss of $239.7 m. This is significantly worse than the underwriting loss of $32.1 m experienced in the last reporting period (loss ratio of 88% and expense ratio of 18%).
The loss ratios for each class of business for the last two reporting periods (1997 and 1998/1999) are summarized below, with average percentage of total NEP for each class for the last 30 months calculated in column 2:
Investment revenue in the form of dividends (55.6%), interest (43.9%) and rent (0.5%) was at $116.2 m. After adjusting for the 18-month effect, the 12-month figure would be around $77.5 m (assuming the flow of revenue is steady throughout the year), which is lower than the $81.2 m revenue in 1997. The NMV of Investments rose over the 18 months by $63.2 m.
HIH* LR�99� LR 9�/99 Change
Fire/ISR 34.35% 42.62% 24.08%
HH 40.00% 42.86% 7.15%
CTP N/A N/A N/A
CMV 105.70% 112.57% 6.50%
DMV N/A N/A N/A
Marine 63.97% 82.07% 28.29%
PI 100.57% 93.98% -6.55%
Liability 121.74% 214.10% 75.87%
WC 128.13% 74.64% -41.75%
Travel 93.68% 82.18% -12.28%
Accident 47.55% 74.95% 57.62%
Other 87.81% 29.14% -66.81%
IT 304.40% >1000% N/A
Total 93.51% 103.54% 10.73%
* Inside Australia only

HIH Case Study on Prov�s�on�ng (Round 2)
�3
Overall the company made an operating loss of $30.614 m, which is significantly worse than the operating profit of $53 m made in 1997 and $72.6 m made in 1996.
Premiums
Total premiums for the 18-month period were $1.1 billion in total and $0.8bn inside Australia. Total Outwards R/I Premiums were very substantial at $511 m in total and $382 m inside Australia. Premium Revenue was at $1.08 billion in total and $786 m inside Australia.
Premium Income figures are at $58 m in total and $172 m inside Australia. These appear very small and this is due to the very large R/I premium paid by HIH. The Premium Income figure is an annual figure and is net of Reinsurance premium paid. Thus the unusual size of the figure reported this period. With regards to the required solvency margin, the 15% of OCP test appears sufficient.
Reinsurance
All the companies in the HIH Group (including this one) have Highest Risk Retention (HRR) at $5 m and Maximum Event Retention (MER) at $10 m. The HRR to adjusted NTA ratio is at 1.77% (in total) and the MER is covered 16.97 times by the solvency surplus (in total).
HIH has large acceptance limits in most classes (mostly due to the large amount of corporate business it writes). Some examples are ISR (Large commercial property cover) at $240 m, Public Liability at $100 m, PI at $25 m and construction at $120 m.
Net Prem�um Revenue ($’000) �99� % �99�/�999
Adj. �99�/�999* %
ISR 20,885 5.6% 46,538 31,025 9.7%
HH 5 0.0% 7 5 0.0%
CTP 0 0.0% 0 0 0.0%
CMV 27,077 7.3% 19,656 13,104 4.1%
DMV 0 0.0% 0 0 0.0%
Marine/Aviation 68,318 18.4% 128,976 85,984 26.9%
PI 87,219 23.5% 124,810 83,207 26.0%
Public Liability 73,286 19.7% 46,214 30,809 9.6%
WC 29.790 8.0% 31,790 21,193 6.6%
Travel 29,623 8.0% 50,654 33,769 10.5%
Other Accident 18,341 4.9% 15,597 10,398 3.2%
Other 9,464 2.5% 15,571 10,381 3.2%
Inward Treaty 7,623 2.1% 523 349 0.1%
Total 371,631 100.0% 480,336 320,224 100.0%
*Adjusted by multiplying times 2/3 in order to have an estimate of the 12 month figure.

Insurance Superv�s�on Core Curr�culum
��
The catastrophe cover arranged is $550 m and appears adequate considering the largest exposure for HIH is in Brisbane at $665.7 m and Sydney at $1.36 billion. This catas-trophe cover is for the whole group (the largest exposure of the group is to Brisbane at $7.8 billion at 5% probable maximum loss (i.e. $390 m exposure)). The cover purchased appears adequate.
In addition to the above, HIH (the group) has entered into a “smoothing arrange-ment” with Swiss Re. It is a multi-term (5 years), multi-class agreement, under which Swiss Re will cover losses above 70% (for the first 2 years), and above 71% (for the remaining 3 years). The premium for this cover is equal to 5% of NEP (equivalent to 5% in terms of loss ratio). This means that HIH has cover above 75%. The maximum limit of the cover in any one-year is 25% (i.e. to 95% loss ratio) and $1 billion over the 5 year period. This cover is taken in addition to the existing reinsurance program, which cannot be changed under the terms of the “smoothing arrangement”.
This “smoothing arrangement” should provide HIH with more stable earning over the next five years, which is very important from APRA’s perspective. Mr. Ray Gosling (Reinsurance Manager in HIH) has confirmed that the agreement with Swiss Re is al-most finalized and that APRA will receive a copy of the agreement in the near future. Mr. Gosling wants to organize another meeting with APRA to discuss any issues that might arise as a result of the review of the agreement.
Annual to Quarterly Comparisons
There are large discrepancies between the annual and quarterly return. It is important to keep in mind that the annual return is audited and thus more likely to be correct. Overall the assets on the quarterly return are $63.2 m smaller than on the annual return and liabilities are $108.3 m smaller.
Issues
Profitability is a large issue with large losses recorded by FAI and HIH ($155 m and $80 m loss respectively). Out of the three main companies, only CIC Insurance managed to record a positive operating result ($18 m). This is quite small compared to the large losses reported by HIH and FAI (-14.3% and -46.3% return on net assets). The net asset figure here is as at 30 June 1999 (end of period rather than beginning of period).
The profitability should return to the company in this financial for three reasons. The insurance premium rates are said to be rising. This has been reported by a number of sources (other companies, media and stockbrokers). Cost savings from the merger with FAI should begin to be fully realized in this financial year. Thirdly the “smoothing arrangement” with Swiss Re should make the results more stable over the next five years. Hopefully there will be no need for further increase in provisioning due to the

HIH Case Study on Prov�s�on�ng (Round 2)
��
Goods and Services Tax (introduced in Australia from 1/7/2000) and no more large extraordinary losses due to the sale of non-core assets inherited with FAI.
Recommendation
HIH complies with all the requirements and appears adequately solvent. No action is recommended and category low is appropriate.

Insurance Superv�s�on Core Curr�culum
��
Appendix—Tables

HIH Case Study on Prov�s�on�ng (Round 2)
��

Insurance Superv�s�on Core Curr�culum
��

HIH Case Study on Prov�s�on�ng (Round 2)
�9
Attachment 3
Note for File APRA
Ref: Anonymous Document entitled “HIH Due Diligence”2
24 March 2000
We have received a report entitled “HIH Insurance Due Diligence” from an ex-em-ployee of HIH criticizing the company’s approach in a number of areas such as provi-sioning, accounting policies, reinsurance arrangements, management skills and capital sufficiency. The employee is an accountant and was employed by HIH in their internal accounting group. We understand that he was of about middle level of seniority. He came to APRA after first going to the Insurance Council and being turned away.
Although the report has been sent to APRA as an anonymous document, the au-thor of the report had previously met with the analysts responsible for HIH to discuss his concerns. The report is in response to the analyst’s request for the concerns to be put into writing.
I have only included relevant sections of the document covering claims reserving practices and some other relevant aspects, including solvency.
HIH Insurance Due Diligence
In Australia, we have seen the consequences of failure of the buyer to undertake a com-plete due diligence process. Both AMP on GIO and HIH on FAI are classic cases of the buyer being caught unawares with severe consequences to share prices. More recently, there is now the case of HIH supposedly refusing two potential suitors the opportunity to undertake a full due diligence. In the cases of GIO and FAI, hindsight has shown that the acquisitions would probably not have proceeded if a full due diligence was under-taken or, at least, not at the price paid.
In the case of HIH, they have apparently denied other parties the opportunity of performing a due diligence. If one were to do a due diligence on HIH then what would be the main areas of review in order to ensure that the fair value of the net assets of the company could be ascertained with a greater degree of certainty? The following provides a discussion on the possible exposures, which exist or are likely to exist in an organization such as HIH, and addresses the due diligence process that may be applied in order to arrive at a possible range for a fair net asset value.
HIH is quite a diverse organization having been the result of mergers of CE Heath and CIC in 1995, CMG in 1996, and FAI in 1998. Both CIC and FAI had histories, also involving mergers, going back many decades. HIH also has a wide geographical pres-
2. It should be noted that, in real time, this report was not received until several months after the date of this round.
Insurance Superv�s�on Core Curr�culum
20
ence through the Americas, UK, and Asia. The areas requiring special consideration in a due diligence on HIH would include the following:
• Claims provisioning• Asset valuations• Accounting policies• Portfolio profitability and likely developments• Run-off exposures• Reinsurance arrangements—normal and one-off• Management stills and incentives• Capital sufficiency
It is only after having considered each of these matters that an informed view would be able to be taken on the fair value of the net assets of the HIH Group.
• Claims Provisioning Practices• The issues here would include:• Level of prudential margins• Run-off exposures• Technical adjustments• Actuarial valuations
It is generally accepted that most insurance companies should set claims provisions at a central estimate level and then hold a prudential margin on top of that to achieve a greater degree of confidence that the provisions are adequately stated. The adding of a prudential margin is considered particularly necessary in the case of long-tail port-folios. Most insurers would carry a prudential margin of in excess of 10% with some carrying up to 25%.
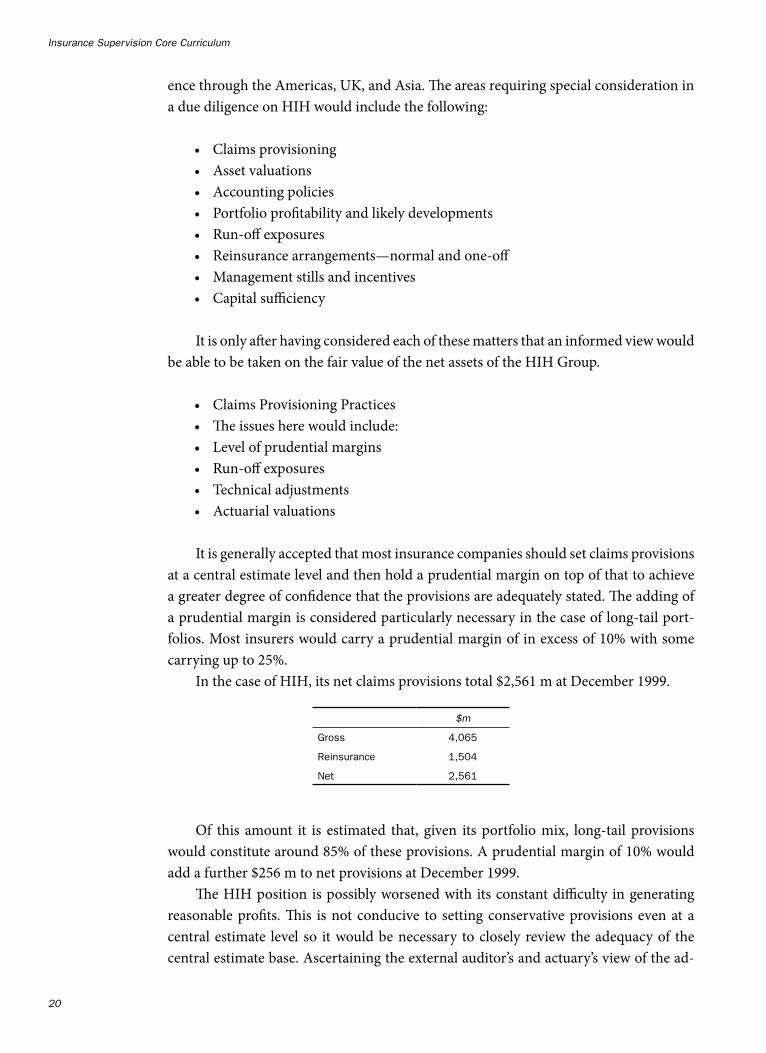
In the case of HIH, its net claims provisions total $2,561 m at December 1999.
Of this amount it is estimated that, given its portfolio mix, long-tail provisions would constitute around 85% of these provisions. A prudential margin of 10% would add a further $256 m to net provisions at December 1999.
The HIH position is possibly worsened with its constant difficulty in generating reasonable profits. This is not conducive to setting conservative provisions even at a central estimate level so it would be necessary to closely review the adequacy of the central estimate base. Ascertaining the external auditor’s and actuary’s view of the ad-
$m
Gross 4,065
Reinsurance 1,504
Net 2,561

HIH Case Study on Prov�s�on�ng (Round 2)
2�
equacy of provisions would be an essential phase of the due diligence process. If a low-end central estimate outcome were used, then greater concern would obviously exist.
A conservative increase for a prudential margin would, therefore, be $260 m (10%) and possibly as much as $390 m (15%).
The Group has inherited from both FAI and CIC a range of historical liability expo-sures from old group companies in those organizations. These would range from CIC’s asbestosis cover through CSR and US inward reinsurance liability business from FAI. On top of these, there is still a possibility of exposure to the Heath inward reinsurance liability business written in the US and UK. It would be necessary to quantify the extent of these exposures and what action, if any, has been taken to contain them. ACE, who as CIGNA was lead on the CSR account, are still seeing development of CSR asbestosis claims. Carlingford (part of CIC group) also participated on CSR. With the passing of time the collectibility of reinsurance increases the potential for a greater net exposure. Exposure to latent claims and uncollectible reinsurance needs to be closely examined. On those inward reinsurance exposures which have already been settled it would be necessary to review the terms of those settlements to ensure that none of the settlement cost is in the form of delayed payments, the expense for which will not be booked until a future period. On the remaining inward reinsurance liability exposures close care would need to be taken to undertake a full review of any potential exposures. Exposures on this inward reinsurance business could be in the range of $50 m to $100 m given the GIO and Reac scenarios.
The level of discounting of HIH provisions at December 1999 was at 6.8% which is at the high end of the range. Inflation at 5.7% is at the low end after allowing for the level of superimposed and economic inflation expected of a long tail dominated claims liabilities. A small decrease in discount and a small increase in inflation generating a 0.5% decrease in the real rate of return would add $35 m to net claims provisions. The basis of claims provision discounting, therefore, would need to be closely examined.
The asset/liability matching is an issue as the claims liabilities are not fully matched by fixed interest investments. It is necessary to bring into the matching process riskier assets such as equities and property. Cash and fixed interest investments at December 1999 totaled $1867 m and represented only 73% of net provisions. No risk adjustment would appear to have been made for the risk adjusted rate or return on equities and property investments, which are used to balance the match of liabilities and invest-ments. A 0.5% decrease in discounting to adjust for risk would add another $35 m to claims provisions. Again, a close examination of discount rates from this perspective would also be necessary.
HIH has indicated that it has put in place one-off reinsurance arrangements to protect the total provisions. The method of discounting recoveries on reinsurance con-tracts would need to be examined to ascertain if any exposure arose from the method of discount applied to aggregate stop-loss reinsurance recoveries. Exposure could be up to $10 m if inappropriate discounting methods have been applied to reinsurance recoveries.
Insurance Superv�s�on Core Curr�culum
22
The basis of determination of future claims handling provisions needs to be ascer-tained. If a run-off cost basis as opposed to the more correct ongoing operation method has been used, claims provisions could be artificially decreased. A 1% increase in FCHC (applied to gross discounted provisions) would add $40 m to claims provisions.
The HIH actuary, David Slee, has been associated with HIH over twenty years. With HIH being one of his main clients, the issue of total independence is a concern. Such a concern is exacerbated with the use of one-off reinsurance contracts, run-off exposures, and absence of prudential margins. As well, the long standing association with Arthur Andersen and the make up of the Audit Committee further the total inde-pendence concern scenario as recently expressed in the financial press.
Asset Valuation Practices
There are several asset categories in the HIH balance sheet that would require close examination in a due diligence. They include:
• Intangibles• Other assets• Fixed assets• Properties• Deferred acquisition costs
By far the major asset valuation exposure is that of goodwill. The goodwill is dom-inated by the FAI acquisition although the level of goodwill held for HIH America should also be examined given recent problems in this area.
In the six months to June 1999 the level of HIH’s goodwill increased by $312.5 m predominantly due to the acquisition of FAI ($275 m). The FAI goodwill would have been arrived at after taking account of such items including:
• Overvaluation of the FAI investment assets• Reinsurance exposures• Undervaluation on claims reserves• Underwriting results 30 June 1998 to 31 December 1998• Integration costs
These adverse net asset adjustments could have been offset by a future income tax benefit on them and the partial recognition of unbooked tax losses. The goodwill would have been even higher if the loss on Oceanic Coal was not reported as an abnormal item.

HIH Case Study on Prov�s�on�ng (Round 2)
23
The accounting for goodwill needs to be closely examined to ensure that firstly its method of determination is understood and the appropriateness of that method con-sidered.
The $275 m goodwill on FAI is being amortized over a period of twenty years. Given the underlying profitability and size of this business then its value is extremely doubtful. The initial market expectation of the goodwill on the acquisition was less than $100 m. At $275 m it is clearly overvalued. A reduction in net assets of $225 m would be not unrealistic.
The other goodwill built up in the year to June 1999 needs to be understood. If it related to HIH America then the value of this adjustment is particularly questionable given the profitability of this market even with rate increases. Under-provisioning in HIH America at the date of acquisition could have been partially offset by the booking of discount on provisions as the US does not discount provisions under US GAAP. The practice of providing for policyholder dividends in the US workers compensation market and the extent to which future exposures have been provisioned needs to be un-derstood. The end result could well be an abnormally high level of goodwill and an un-derstated policyholder dividend liability. Reinsurance arrangements for HIH America need to be examined with a view to ascertaining if an exposure also exists as regards future reinsurance contracts. Overall net tangible assets could need to be decreased by up to $20 m. Any goodwill reduction would be in addition to this.
Other assets consist of:
• Future income tax benefits—timing differences• Future income tax benefits—tax losses• Investments in associated companies• Prepayments and deferred expenses
The value of future income tax benefits in the Group at $150 m plus is question-able. Tax paid by the Group in the period 1 January 1997 to 31 December 1999 (3 years) has totaled $16.8 m. Given the level of under-provisioning and low profitability, it will be several years before any benefit can be gained from this asset (if ever). The one-off reinsurance contracts may assist in utilizing the losses to a certain degree but under-provisioning could well offset this benefit. There remains an exposure to the Group if the tax office were to view any one-off reinsurance contract as financial reinsurance as discussed in Ruling TR 96/2. If this were to be the case then there is a possible dividend imputation exposure.
The possible exposure on FITB could be up to $100 m.Investments in associates are dominated by Home Security International, Nam
Seng, a listed Thailand motor insurer, and a UK property holding. Valuation methods/basis of these investments are not disclosed. However, consistent with claims provi-sioning, it is possible that they would not be conservative. A due diligence process

Insurance Superv�s�on Core Curr�culum
2�
would closely consider these valuations and independent advice would certainly need to be taken.
The possible exposure on investments in associates could be up to $25 m.Prepayments and deferred expenses need to be examined for the deferral of com-
puter development expenditure, in particular, IS2. The future viability of this system would need to be closely considered given its development problems. The deferral or capitalization of IS2 expenditure would need to be considered given QBE’s rejection of this insurance system. The possible exposure on prepayments and deferred expenses could be up to $15 m. This decrease could be offset by a potential surplus, which ex-ists in the superannuation fund of $20 m, that is, if the benefit has not already been booked.
Fixed assets are comprised of leasehold improvements and computer and office equipment. The value of IS2 related items, again, needs to be closely considered.
The possible exposure on fixed assets could be up to $30 m.The valuation of the HIH property portfolio is subject to one’s view on the value of
St Moritz and the reliability of the valuations on the other property holdings. Properties have been valued at directors’ valuation having regard to the valuations carried out by registered valuers. If the same aggressive approach to claims reserving is taken to prop-erty valuations then close attention to the valuation of these assets would be required. A due diligence process would closely consider these valuations and independent advice would certainly need to be taken.
The possible exposure on property investments could be up to $25 m.Deferred acquisition costs comprise deferred commission and deferred under-
writing costs. The level of deferral of underwriting expenses is at the high end of rea-sonableness at 27.9% of unearned premiums. Given the net commission ratio is 10% and the total expense ratio is 14.7% then a deferral at 27.9% raises questions as to the overstatement of this asset. Assuming even 75% of underwriting expenses are defer-rable then the ratio to unearned premium should be around 21%. The due diligence process would need to closely examine the basis for the calculation of deferred indirect acquisition costs.
A conservative reduction of deferred expenses would be, therefore, around $70 m. This may be potentially overstated as net earned premium is artificially low due to the impact of smoothing reinsurance contracts.
Accounting PoliciesThe accounting approach to several areas would require close attention including
those covering:
• One-off reinsurance contracts• Goodwill amortization• Deferred expenses• Net discount rate adjustment• Superannuation surplus

HIH Case Study on Prov�s�on�ng (Round 2)
2�
• Reclassification of items within the profit and loss• Cash flow statement
The method of accounting for one-off reinsurance contracts as applied by FAI and HIH from June 1998 requires close review. It would be necessary to examine for the possibility of a reinsurance smoothing transaction being interpreted as a transfer of risk. All documentation relating to the one-off reinsurance transactions would need to be reviewed so as to understand their impact on the reported results for each of the reporting periods from June 1998.
Concern in this area arises from the extent of the loss on the reinsurance account for the recent reporting periods. For example, the HIH loss ratio on reinsurance for the six months to December 1999 was 125% compared with the gross loss ratio of 90%. The June 1998 FAI accounts depict a similar scenario.
Goodwill arising from the FAI acquisition is being amortized over a period of 20 years. Clearly both the period and quantum are questionable. The fading FAI di-rect market presence (advertising cut back significantly), potential deregulation of the Queensland CTP market, a disbanded corporate portfolio, deferral of NSW workers privatization and departure of the entire FAI executive and senior management tem significantly reduces the value in the name or business of FAI.
The expense deferral policy as regards underwriting expenses appears to take into account a higher than normal proportion of management costs, which is possibly stretching the definition of indirect acquisition costs to the limit. Again, the accounting policy and methodology would need to be closely examined for appropriateness.
Lloyd’s business profitability is usually recognized at the end of three years at the time the underwriting year is closed. The HIH method of accounting would need to be examined to ensure that is understood and considered for appropriateness. The treat-ment of discount on reinsurance to close would also need to be examined.
The net discount rate adjustment is a unique reporting line to HIH. It unclear defi-nition possibly enables adjustments to be made above or below the underwriting line to boost the underwriting result. The basis of calculation of this item in the P&L over recent years needs to be reviewed to consider its appropriateness.
The accounting treatment of the surplus in the superannuation fund needs to be understood.
In an environment of a wide range of one-off adjustments the quantum of the ben-efits of those adjustments needs to be examined in order to ascertain the real trend of the underlying results.
The cash flow statement is one of the truer indicators of the financial direction of HIH. A negative underwriting cash flow is now evident. As with accounting profit it is important to review basis of compilation of the cash flow statement. In particular, the treatment of payments under one-off reinsurance contracts would need to be closely examined to ensure that the correct cash flows are reflected in the statement.
Insurance Superv�s�on Core Curr�culum
2�
At June 1999 an abnormal item of $50 m was booked with respect to the estimated impact of the GST legislation on pre 30 June 2000 claims. The determination of this adjustment and subsequent appraisal thereof needs to be considered. In particular, it would be necessary to consider how any increase or decrease in this adjustment has been reflected through the P&L in subsequent periods.
Annual and quarterly reports to APRA returns need to be examined particularly in regard to the treatment of one-off transactions and the allocation of reinsurance and expense costs between the licensed Australian insurers and other companies in the Group.
The accounting treatment of major disputes/transactions that the Group has en-countered in recent years would need to be closely examined. There would include:
• US inward liability reinsurance• Charman inward reinsurance• FAI Life• One-Tel• St Moritz• OCAL
It is noted that Arthur Andersen were the signing auditors on the FAI June 1998 accounts and are the auditors of HIH. Obviously, they have been able to be comfortable with the accounting policies adopted by both FAI and HIH over recent years. Given the range and complexity of possible areas of concern then their rationale for agreeing to the treatment of these items would need to be closely considered in the due diligence process.
Capital Sufficiency
Australian insurance regulators currently apply several solvency tests to insurance com-panies. The ratio of net assets to net outstanding claims must be greater than 15% and the ratio of net assets to net written premium must be greater than 20%.
Net tangible assets in the case of HIH excluded goodwill ($330 m) but include sub-ordinated bond debt ($160 m). At December 1999 the net tangible assets of HIH were thus determined as follows:

HIH Case Study on Prov�s�on�ng (Round 2)
2�
The above indicates if the net tangible assets of HIH were to be decreased by more than $400 m then the Group would be below the current solvency requirements of APRA.
The possible adjustments to net tangible assets outlined herein are summarized as follows:
The bottom line is certainly uncomfortable. The impact of the potential net tangible asset adjustments outlined herein adds to between $750 m and $1,100 m. Obviously a full due diligence would be necessary to achieve a firmer view. Even if the best outcome is discounted 50% severe solvency concerns would still exist.
$m
Reported net assets 962
Less goodwill (330)
Add subordinated debt 160
Net tangible assets 792
Net outstanding claims 2,561
Claims solvency ratio 31%
Solvency margin (claims) 408
Net written premium 1,885
NWP solvency 42%
Solvency margin (premium) 415
Best$m
Worst$m
Claims provisions prudential margin
260 390
Claims historical exposures 50 100
Discounting 35 50
Asset risk adjustment 35 50
Reinsurance discounting 10 10
Claims handling 40 40
FITB 100 150
Investments in Associates 20 20
Deferred expenses 15 15
Fixed assets 30 50
Property valuations 25 25
Deferred acquisition costs 70 100
Reinsurance profit smoothing 40 80
Employment contracts 20 20
Total potential adjustments 750 1,100

Insurance Superv�s�on Core Curr�culum
2�
Conclusion
The extent of issues which need to be addressed in the due diligence process on a gen-eral insurer clearly indicates that it is a complex process. The potential range of out-comes is quite frightening as has been evidenced by GIO and to a lesser degree FAI. In the case of HIH similar scenarios could also exist. Unless an appropriate due diligence is undertaken on HIH by a potential bidder then clearly they are taking a major risk of over paying by a significant amount.
The problem for HIH is how to overcome present market perceptions of its finan-cial strength. Certainly allowing a due diligence to be undertaken would calm market concerns.
The issues raised in this due diligence document have broader implications for a number of parties other than investors including:
• APRA• Rating agencies• Auditors on general insurers• Actuaries of insurers• Financial analysts
It is essential for the stability of the general insurance industry and for shareholders and policyholders that these parties are able to properly interpret the financial posi-tion of the insurers. Confidence in these parties being able to achieve this is somewhat doubtful.
Anonymous

HIH Case Study on Prov�s�on�ng (Round 2)
29
Attachment 4
Memorandum for General Manager
Notes on Interview with David Slee —- Consulting Actuary to HIH Insurance
20 April 2000
The following notes summarize a meeting we held with David Slee, consulting actuary to HIH, in following up the anonymous “HIH Due Diligence” report. The note includes a brief background to his relationship with HIH and the way that his actuarial review of their OCP was conducted. It then raises a number of issues. A copy of Slee’s full Actu-arial Report for June 1999 is attached in the Appendix to this note.
1. Background
DaviD Slee anD hiS relationShip with hih
Slee is, and has been since 1967, a Fellow of both the Institute of Actuaries of Australia and the Institute of Actuaries (United Kingdom). He has approximately 40 years ex-perience in the insurance industry, both as a consulting actuary and as a director or manager of a number of insurance companies.
In 1989 Slee incorporated his actuarial practice and since that time has performed all his work through, and as the consulting actuary of, Slee Consulting. Slee was a long-term acquaintance of CE Heath’s CEO, Ray Williams, having provided both manage-rial and actuarial services to various insurance companies associated with Williams. For the 6 years in the early 1980s, prior to establishing his own practice, Slee had been an employee of Heath. At the time of incorporation, CE Heath Casualty and General Insurance Limited initially took a 49 per cent shareholding in the company, with Slee taking the remaining 51 per cent.
In 1992 he suggested to Williams that, because by that time Slee Consulting was carrying out a reasonable (and increasing) quantity of work for CE Heath, they should dissolve the relationship between the two companies so that they would not only be independent, but also be seen to be independent. Slee purchased CE Heath’s interest in the business.
Slee Consulting had clients other than CE Heath. During the period 1989 to 1995, Slee estimates that the work he performed for CE Heath accounted for about 20 per cent of his work. From about 1996 onwards HIH took up a growing proportion of Slee’s time. Slee estimated that during the year ending 30 June 1998 somewhere between 50 per cent and 80 per cent of Slee Consulting’s revenue was derived from HIH. In 1998

Insurance Superv�s�on Core Curr�culum
30
Slee was appointed consulting actuary for the entire HIH group and the percentage of revenue derived from HIH work has continued to grow.
In addition to his work on HIH outstanding claims liabilities (see below), Slee has, from time to time, been asked to provide advice and assistance in relation to a number of other discrete matters. He provides HIH with some limited actuarial assistance and advice in relation to pricing and premium levels in particular portfolios. He also as-sisted HIH in relation to various acquisitions and mergers (including CIC and CMG). In relation to reinsurance, he did some work on retention levels in 1994 and 1997. Slee also participated in several training programs for HIH staff to explain the actuarial pro-cess and the general method of operation of an insurance organization.
Up to December 1996, Slee’s instructions had been to assess the value of the specific classes of business identified in the terms of reference of his reports. In January 1998, Williams raised with Slee the possibility that he be instructed to prepare valuations for the purpose of ‘testing provisions on a global basis’. In discussing the terms of reference for the appointment Slee was told by CFO Dominic Fodera that he was not to include a prudential margin in his valuations, as this would be determined by the directors on a global basis.
Slee explained that the terms of reference for his valuations are agreed orally (usu-ally with Fodera) and then set out in his reports. There are no lengthy discussions on this topic. He understands, and believes the HIH executive directors understand, that his task is to test the aggregate of the net discounted claims provision which the com-pany proposes to book.
Slee emphasized that his task is to arrive at a central estimate (an estimate that has a 50% probability of adequacy) of HIH’s group or global OCL. He sees his task as being to determine an unbiased central estimate which can be compared with the proposed booked value.
Slee said that he understands his instructions to be to test the aggregate or global booked value, and not that of any of the individual companies or divisions. He also em-phasized the fact that his instructions were merely to test the booked provision, and not to make any recommendation as to the reserve or provision which ought to be booked. He regards the latter as a separate task.
the proviSion Setting proceSS at hih
The provision setting process within HIH differed in some respects from portfolio to portfolio. Essentially, however, the process appears to be as follows.
David Slee is retained to provide his assessment of the central estimate of the HIH group’s OCL. He does so through semi-annual reports. Slee’s total figure for each bal-ance date is intended to be a figure against which the reasonableness or adequacy of the total booked figure or provision proposed for HIH’s consolidated accounts can be

HIH Case Study on Prov�s�on�ng (Round 2)
3�
tested. As Slee’s total figure is a central estimate (in accordance with his instructions) it includes no prudential margin.
For each balance date, senior management put forward their estimate of the OCL for each division. Every six months there is a meeting at which both the management and actuarial estimates of each division’s OCL are discussed and considered. Those in attendance at the meetings vary over time, and from division to division, but the meet-ings always include Dominic Fodera, Terry Cassidy and David Slee. Following these meetings, senior management, led by Fodera, settle on a central estimate figure for each portfolio of business. The total of these figures is the figure that HIH books as its group OCP at the relevant balance date. It is argued to represent management’s assessment of the central estimate of the group’s OCL.
My impression from our discussion with Slee is that the consideration given to the adequacy of HIH’s proposed OCP at the various committee meetings is generally brief and seldom descends to particularity. From time to time there is some discussion of the discrepancies between the HIH, and actuary figures. However, given the corre-spondence between the total group HIH and actuary figures, the provisions proposed by management are usually the figures approved by the board.
inStructionS anD aSSumptionS in the Slee reportS
In addition to the overall instruction to test the proposed booked provision, Slee is in-structed to make a number of assumptions in preparing his valuations. The instructions or assumptions are disclosed in a relatively consistent manner in each of Slee’s reports. For example, in the 30 June 1999 report, under the heading ‘Terms of Reference’, after referring to his instruction to test the booked value of the proposed provision in the balance sheet of the Holding Company for all outstanding claims including claims in-curred but not reported (IBNR), and future claims handing costs (FCHC) as at 30 June 1999, Slee set out the following ‘conditions which were determined by the company:
• the rate of discount to be used is 6.42 per cent per annum;• the allowance for FCHC is generally to be 2 per cent of gross liabilities;• all reinsurance is to be considered fully recoverable;• where it is inappropriate to use actuarial methods, to use case estimates (par-
ticularly where there are individual items subject to law suits and in some short-term business);
• no prudential margin is to be included, nor should any allowance be made for mismatch of assets to liabilities;
• the portfolio is worldwide and in the time frame available other actuaries’ re-ports may be used to assist in the testing process; and
• the report should be as simple as possible, so that the essential features are easily understood.

Insurance Superv�s�on Core Curr�culum
32
Broadly equivalent instructions and assumptions are disclosed in each of the Slee reports.
The appropriateness and effect of a number of these individual instructions and assumptions are considered below. But, there are some matters of relevance to them all. For example, PS 300 (actuarial standard) relevantly provides:
• the actuary’s report should state the extent of compliance with this standard, the reasons for not complying fully with this standard, and any restrictions on the actuary;
• where the principal requires the actuary to use specific assumptions the actuary must clearly state the circumstances, discuss whether or not the assumptions are reasonable and consistent with this standard, and discuss the implications of divergence from this standard; and
• the actuary should not recommend or support a provision which is less than the central estimate of the liabilities.
In short, if an actuary is constrained in a way which leads to the valuation result being less than the central estimate of the liabilities, the actuary must clearly disclose that the result is less than the central estimate of the liabilities, and preferably quantify the shortfall.
Since Slee does not suggest anywhere in his reports that his valuations of the OCL were less than a central estimate,2 a reader of Slee’s reports would understand them to contain his central estimate of HIH’s OCL, notwithstanding the assumptions or con-straints imposed by the company.
When asked who his reports are circulated to Slee said that he assumed that his reports would be considered by all the directors, senior executives and possibly also APRA (in fact we have never before seen any of his reports). While he addresses his reports to the directors of HIH, he has had no contact with the board or directors of HIH (other than Williams, Cassidy and Fodera). He has received no requests for infor-mation, clarification or explanation from any of the directors.
2. Concerns Arising from our Review of Slee’s Actuarial Work
There were a number of matters raised during the course of our meeting with David Slee which are relevant to an assessment of the adequacy of HIH’s provisions across a number of portfolios, and in some cases, across all portfolios. These include the treat-ment of future claims handling costs, discounting, the use of prudential margins, the allowance for claims inflation, and the accuracy and flow of provisioning information.
2. On the contrary, in his June 1998 report Slee states: “I understand that this figure is to be booked in the balance sheet, and it represents [a] liability which has [a] 50% probability of being adequate.”

HIH Case Study on Prov�s�on�ng (Round 2)
33
Future claimS hanDling coStS
Both AASB 1023 and PS 300 are clear in their requirement that appropriate allowance be made for future claims handling costs (FCHC) in the estimate of a general insurer’s OCL. Since the allowance is intended to reflect the claims handling costs which the insurer expects to incur, there is a reasonable presumption that the allowance should be determined by reference to the insurer’s actual claims handling costs.
In his 31 December 1996 report, Slee provided for FCHC at differing rates across the various Australian portfolios. The rates varied between 2 per cent and 7 per cent, giving an approximate weighted average of just over 4 per cent. But in each of his subse-quent reports, Slee provided for FCHC at the lower and fixed rate of 2 per cent of gross liabilities across HIH’s entire global portfolio of liabilities. His reports made it clear that he was instructed to provide for FCHC at this rate.
We asked Slee whether he was provided with any statistics or analysis which would have enabled him to assess the actual costs of claims handling. He said he was informed that none were available.
While there may be occasions where lower allowances may be appropriate our ex-perience is that a range of 4 per cent to 8 per cent of expected future gross payments is a reasonable “benchmark” allowance for FCHC for the Australian general insurance industry. Given the size of HIH, it seems to me unlikely that there could be any claims handling practices or other factors which would enable HIH to reduce its claims han-dling costs below the standard industry range.
DiScounting
The relevant professional standards in Australia (AASB 1023 and PS 300) provide for the discounting of a general insurer’s OCL using a market-determined risk-adjusted rate of return appropriate to the insurer. This allows a departure from the risk-free rate of return where the insurer’s assets can reliably be expected to give rise to higher rate of return.
The discount rates adopted by Slee, upon instructions from HIH, have been con-sistently higher than the yields available on Commonwealth Government bonds with a three year maturity (three years being roughly representative of the mean term of HIH’s OCL). At the same time, Slee has made no allowance for HIH’s exposure to the risk arising from the mismatch in the term of HIH’s assets and liabilities. Again, this was upon instructions from HIH. His reports do, of course, make these instructions clear.
A particular concern arises in relation to the discounting of HIH’s OCL as at 31 December 1997. Note 19 to HIH’s consolidated accounts for the year ending 31 De-cember 1997 referred to HIH’s OCP as at 31 December 1997 as discounted at a rate of 6.2 per cent over an “average weighted term to settlement” for the outstanding claims liabilities of 2.7 years.
Insurance Superv�s�on Core Curr�culum
3�
Slee mentioned that he had written to HIH in April 1998 disclaiming any respon-sibility for the contents of this note on the basis both that it contained a mathematical error, and that on the figures given to him it would be difficult to justify a discount rate of 6.2 per cent. He said that his calculations had been done on the basis of a rate of 6 per cent, which was the rate which management had agreed was the actual rate being earned on the company’s assets.
However Slee did not subsequently discuss the matter with anyone from manage-ment or the auditors. Nor did he refer to the matter in his report. His reason for not including the matter in his report was that he believed the problem lay in the peculiar manner in which HIH had derived the undiscounted figure, and that his only task was to test the net discounted provision. The difference in the OCP arising from the math-ematical error and the extra .2 per cent on the discount rate is around $62 million on a total OCP of around $1.5 billion.
pruDential marginS
In its 31 December 1997 accounts, and subsequently, HIH adopted a policy of not in-cluding a general prudential margin in its OCP. In line with this policy, Slee was in-structed not to include any prudential margin in his valuations as at 31 December 1997 and subsequently.
Slee argued that he has provided valuations which he was prepared to put forward as central estimates as at the various balance dates. At the same time he made it clear in each of his reports that his valuations were heavily underpinned by the instructions he had been given, and hence assumptions he had made. Slee warned in his reports of the need for, and desirability of, a prudential margin in the face of risks such as those involved with the choice of discount rate, the rate of FCHC and other risks.
It is unfortunate that the Insurance Act 1973 does not mandate a prudential margin in provisioning—this is an area that we are addressing in our current reform of the law. AASB1023 allows a prudential margin and PS300 generally encourages one. More im-portantly, the industry practice is to include a margin, especially for long-tailed busi-ness.
In my view, in the absence of a more detailed appreciation of the risks inherent in the various assumptions made by Slee and his valuations more generally, best practice suggests that the directors of HIH should have resolved to include a prudential margin within their OCP.
claimS inFlation
Both AASB 1023 and PS 300 require that the estimate of an insurer’s OCL include an appropriate allowance for claims inflation. This includes both economic (that is, price

HIH Case Study on Prov�s�on�ng (Round 2)
3�
or wage) inflation and superimposed inflation for inflation of claims settlements in par-ticular portfolios.
In his reports, Slee has not always distinguished between economic inflation on the one hand, and superimposed inflation on the other. This makes it difficult to determine from the face of those reports the extent to which allowance was made for superim-posed inflation in respect of the individual portfolios.
Slee’s combined inflation allowance for the HIH C&G Liability, FAI Corporate, and FAI Professional Liability portfolios in 1997 and 1998 was 4.0%. For HIH C&G Professional Indemnity it was 3.5% and for Australian Workers Compensation it was 8.0%. This was at a time when general price inflation (CPI) was in the order of 3.5%. Our own internal actuary thinks that, for these portfolios, somewhere between 4 and 5 percentage points should be added to CPI.
accuracy anD Flow oF proviSioning inFormation
Assessment of a general insurance company’s OCL is, even in ideal circumstances, an inexact science. It is a truism that the accuracy of the assessment of the OCL depends upon the adequacy and accuracy of the data upon which it is based. In my view, it ap-pears highly likely that inadequate controls and procedures exist within HIH to ensure that accurate and complete information and data are available and communicated to the appropriate people (and in particular, to Slee).
Senior Manager

Insurance Superv�s�on Core Curr�culum
3�
Appendix—Copy of David Slee’s HIH Actuarial Report for June 1999

HIH Case Study on Prov�s�on�ng (Round 2)
3�
Executive Summary
The calculated discounted reserves net of all reinsurance expressed in Australian dollars as at 30th June 1999 excluding any prudential margin are as follows:
I understand that this figure is to be booked in the balance sheet, and it represents a liability which has a 50% probability of being adequate.
This represents a 7.05% increase over the reserve at 31st December 1998, largely due to increases in personal injury claims in Australia and USA.
Included in the above figures is A$42,100,000 for USA contractor’s liability rein-sured inwards. This figure is based on legal advice that HIH may be able to avoid certain claims, and that the management of HIH is confident that a settlement can be made for this figure. Such a judgement is not a matter for actuarial analysis and managements’ estimate of the outcome has been accepted. The eventual outcome of this dispute will impact on the results, at the time a settlement is reached.
DiScount
The valuation methods have allowed for all liabilities including short tail to be dis-counted. The rate of discount used for all business has been 6%. The auditors have cer-
Professional Indemnity $346,513,000
General Liability $463,249,000
Workers Compensation $212,895,000
CTP $873,100,000
Marine (excl UK) $81,440,000
Disability $4,942,000
Australian Short Tail $172,000,000
UK $294,522,000
HIH America $126,600,000
Great States $66,700,000
Hawaii $13,700,000
Argentina $11,200,000
Hong Kong $28,400,000
New Zealand $30,070,000
CMG $25,700,000
Charman $30,535,000
AAMI $44,987,000
FAI inwards Re $50,000,000
Miscellaneous $41,744,000
GST AND Y2K $35,400,000
Stop loss on 1998 reserves ($255,014,000)
Total $2,698,683,000

Insurance Superv�s�on Core Curr�culum
3�
tified that assets exist to support the claim provision and are currently earning at least 6%. The company expects to be able to sustain that rate.
I note however that whilst the investments are earning the above rates, they do carry a mis-match risk for which no allowance has been made. The long-term sustain-ability of 6% per annum is a matter of judgement, with which is associated risk.
Future claimS hanDling coStS
Future claims handling costs are included in the figures, at 2% of the claim costs, on the grounds that a third party would bid no more than this amount in a competitive ten-dering process. Whilst this is an acceptable proposition, I add that if the company does not contain its costs to 2%, then the company runs an expense over-run risk.
riSk
Actuarial standards require me to point out the uncertainty in all these calculations. The following risks are an inherent feature of this valuation and give rise to considerable uncertainty when taken in the aggregate:
• Currency conversion risk• Excess superimposed inflation risk• Expense over-run risk• Fluctuation risk• Investment capital risk• Investment income sustainability risk• Judicial interpretation risk• Regulatory interference risk• Reinsurance default risk
Whilst none of these items may in fact manifest as an adverse situation, the prob-ability that a combination of events will provide an adverse situation is not insignifi-cant.
Stop loSS
The company has purchased a stop loss of $400,000,000 excess of loss over the 1998 total reserves. It appears that this will all be used and the present value is deducted from the liability.

HIH Case Study on Prov�s�on�ng (Round 2)
39
Solvency teSt
The suggested reserve for testing solvency would usually have a higher probability of adequacy than 50%.
In that the group has a wide spread of business, I would expect to see shareholders funds of at least $600,000,000 supporting this claim reserve.
Introduction
This report was commissioned by Mr. Terry Cassidy, Director of HIH INSURANCE LTD, (ACN 008 636 575) and is not intended for use by any party other than the direc-tors of that company. The report should be read in its entirety, so that out of context conclusions are not drawn.
The actuary responsible for the report is Mr. David Slee FIA FIAA as principal of David Slee Consulting Pty Ltd, a disinterested party.
No constraints were put upon the actuary, other than as set out in the terms of reference.
The report does not exceed, nor falls short of its stated purpose and complies with actuarial standards in accordance with the terms of reference.
The terms of reference clearly require me to consider solvency as a separate exer-cise from adequacy for balance sheet purposes.
The company determines its own value for balance sheet purposed according to its won understanding of the position, and the actuarial central estimate is regarded as a test of the company’s results. It is highly unlikely that both the company calculated reserve based on case estimates plus allowance for IBNR will be exactly the same as the actuarial value, and indeed some years it should be expected that the actuarial basis will give a higher figure and some years a lower figure than case estimates.
Only when there is a wide discrepancy between the two figures would it be reason-able to reject the company calculated figure, given the uncertainty of all these calcula-tions.
However for purposes of testing the solvency of the company, it is desirable to use a reserve which does contain an allowance for subjective risk, and this is usually referred to as a prudential margin on top of the central estimate.
Terms of Reference
The object of my investigation has been to test the book value of the provision for out-standing insurance claims including IBNR and FCHC as at 30th June 1999.
I have been asked to assume that:

Insurance Superv�s�on Core Curr�culum
�0
1. All reinsurance is fully recoverable. (I have been advised that only 0.4% of re-insurance is with BBB rated companies and the remainder is with A or better. 39.5% is with AAA companies, 4.9% with AA, 46.5% with A rated companies and 8.7% with Lloyds. There is no reinsurance with unrated companies.)
2. The liability for certain USA contractors business and the Charman account be taken at an amount which the company in conjunction with its auditors con-siders to be a reasonable settlement in contested court cases.
3. The rate of discount to be used be 6% per annum.4. The allowance for future claims handling costs be 2% of liabilities
I have also been instructed not to include any prudential margins in my test of the balance sheet value, but to include a reasonable prudential margin in my test of solvency.
Reliance
Of necessity I have had to rely on the Company for the following:
• Underwriters’ estimates of all claims in excess of $1,000,000.• Underwriters’ estimates of outstanding claims for all short tail business. (This
represents only 10% of the liability.)• All data which has been supplies to me. The company’s auditors have advised me
that data supplied to me, is in accordance with their working papers. The data has not been reproduced in this report, as it is voluminous and is available in the company’s records.
• A statement of the assets which support the discount rate to be used. Again the company’s auditors have advised that they have checked the validity of this figure.
Certain classes of business have not been valued by me, but I have inspected the report of the actuaries and have relied on their reports.
The classes of business valued by other actuaries were
• All UK business• Australian compulsory third party business (CTP)• American workers compensation business• Hong Kong workers compensation business
There are considerable time constraints when valuing an international portfolio of this nature and of necessity I have only been able to make suitable tests where data is

HIH Case Study on Prov�s�on�ng (Round 2)
��
available as at 30th June 1999 for part of the business. When no data is available at 30th June 1999 I have used such information as is available.
However I point out that all the significant areas have undergone independent ac-tuarial tests which are ongoing.
Basic Principles
For the purpose of testing the balance sheet amount booked, the reserve calculated by actuarial principles is to be an appropriate estimate of the present value now needed to be held by the company to pay for all future claims outgo in respect of all claims in-curred up to 30th June 1999.
The calculations will allow for claims which may not presently exist, but may have been incurred but not yet reported (generally referred to as IBNR claims).
The calculations include the future claims handling costs (FCHC) and are net of re-insurance recoveries.
Allowance is made for the time value of money by discounting the cast flows to arrive at the central estimate of the liability.
Long taiL business
The claim experience is analyzed in annual cohorts, according to the number of claims reported over time, and the amounts paid per open claim each year with adjustments for zero claims and claims in excess of $1,000,000. Models are then adopted for the pur-pose of calculating future cash flows.
Development factors are deduced for periods of time beyond 2 years, and are in general close to the 1998/9 experience adjusted for future inflation as judged to be per-sistently continuing.
The average cost of claim is then deduced, and projected forward for the newer years of account or years of accident as the case may be.
The reinsurance percentage is in the first instance deduced from the treaties and then modified to allow for co-insurance and any whole account reinsurance pur-chased.
The cash flow calculations assume that the past is a guide to the future and there-fore incorporate past claim deterioration. Of necessity allowances for future claim dete-rioration carries uncertainty risks.

Insurance Superv�s�on Core Curr�culum
�2
short taiL business
Short tail business can be highly volatile in nature and accordingly case estimates have been chosen, as advised by the company and then discounted.
aLL business
The provision for claims incurred does not include any allowance for unearned pre-mium which is a separate accounting exercise, and needs to be provided separately.
DiScount
Accounting and actuarial standards do not state exactly how the rate of discount should be determined, other than to suggest that the starting point should be the risk free rate of return on a matched portfolio. The standards permit adjustment to this, provided the investments appear to warrant such an adjustment. The rate used must however be sustainable.
In my actuarial report as at 31/12/97 I used, at the request of the company, an av-erage of 6%, which the company deemed to be the long-term sustainable rate.
I have again been requested to use 6% by the company in respect of Australian business which almost exactly accords with NSW Treasury zero coupon yields on a matched basis.
However it should be pointed out that notwithstanding the fact that the Company appears to be now earning 6%, the actual investments are not matched to the liabilities, and therefore the company takes both a capital investment risk and an income sustain-ability risk. Particularly, if interest rates move upwards and the equity market down-wards (as happened in 1994), there is a risk of capital inadequacy.
With a perfectly matched portfolio of risk free assets, one would expect the value of the assets to increase and offset the increase in liabilities. When there is a mismatch this does not always take place.
It is of course entirely for the company to determine its investment policy, but on technical grounds it is appropriate to point out that the company is vulnerable to loss in the event of the long-term rates of interest increasing.
Thus whilst the 6% income stream may be considered sustainable, (this being a requirement of actuarial and accounting standards), the company is running an invest-ment risk on its capital account.
Accordingly it is reasonable to use a discount rate of 6% only if the company is confident that the capital risk can be managed.
It therefore becomes a judgmental factor as to whether an allowance for mis-match should be made. I take the view that the probability of a capital loss arising is neither
HIH Case Study on Prov�s�on�ng (Round 2)
�3
certain nor impossible, and that it is in fact impossible to predict the situation precisely, having been given diametrically opposed predictions from different sources.
Given therefore that it seems equally likely that there will be loss or no loss, no al-lowance has been made for mismatch, in examining the balance sheet value.
However, in that a prudential margin has been used to examine the solvency of the company, the investment risks are deemed to be catered for in the prudential margin.
riSk
For the purpose of testing the balance sheet the actuarial calculations are not biased and as such the reserve quoted has a 50% chance of adequacy. The company accepts that this is the position it wishes to adopt.
Whilst large claim occurrences have been largely reinsured, it should be pointed out that it is not the incidence of large claims which are causing claims costs to rise, but rather it is the persistent increase in the average cost of claim, particularly in all personal injury classes.
Actuarial standards require that I point out the existence of uncertainty in the claims reserve, and that no specific provision has been made for adverse deviation in the balance sheet.
The following summarizes the items which give rise to uncertainty:
• Currency conversion risk• Excess superimposed inflation risk• Expense over-run risk• Fluctuation risk• Investment capital risk• Investment income sustainability risk• Judicial interpretation risk• Regulatory interference risk• Reinsurance default risk
Whilst none of these items may in fact manifest as an adverse situation, the prob-ability that a combination of events will provide an adverse situation is not insignifi-cant.
There is also always a risk that sudden and unexpected crises will occur that have not been provided for.
My terms of reference are to assume all reinsurance is recoverable. I have been made aware of the rating of reinsurers and the risk of reinsurance default, appears to be very low but should not be ignored.
A further risk exists in the Australian Tax Office Pre-ruling Consultative Docu-ment No 10. This proposes alteration to the way personal injury benefits are taxed and

Insurance Superv�s�on Core Curr�culum
��
could give rise to a material increase in claim costs. I have not, however, made any al-lowance for this as the ATO have not yet reached any conclusions.
Other matters which require attention include the future introduction of GST and any problems associated with Y2K.
The proposed GST regulations appear to penalize insurers in respect of claims which have incurred prior to the introduction of GST and are still outstanding after the introduction of GST in July 2000. The company has made extensive calculations of its li-ability in this respect, and I have accepted their undiscounted estimate of $39,000,000.
In respect of Y2K the company believes that it has no liability, but appreciates that there may be many claims which will involve legal costs to defend. The company has taken out reinsurance and its liability can reasonably be taken as its retention of $1,000,000.
I also point out that APRA generally expects to see a 10% prudential margin all liability type reserves. Given that approximately $900,000,000 of the reserves are in li-ability style business (including workers compensation), then APRA may consider the reserves to be inadequate by up to $90,000,000 prior to assessment of legal solvency.
APRA does not presently require restatement of the reserves to cover the desired prudential margin, but they may assess the solvency margin required as the legal amount plus their considered desirable prudential margin.
References for this can be found in addresses to the Institute of Actuaries general insurance conferences in 1995 and 1997 by senior officers of APRA (then the ISC).
I understand that it is the intention of the company not to use a prudential margin in its balance sheet, and agree that such a position is acceptable.
However given the APRA attitude a substantial prudential margin of 7.5% of the whole of the central estimate has been added for the purpose of testing solvency.
claimS incurreD but not reporteD (ibnr)
The calculations include the cost of claims incurred but not reported.The valuation basis general assumes that late reporting will happen in the future in
a similar manner to the past. The risk is that there will be a change to the pattern, but I have not found this to be a feature in the past.
currency
The calculations allow for conversion of currency at rates ruling on the valuation date as follows:
AU$1=NZ$1.237AU$1=US$0.6559

HIH Case Study on Prov�s�on�ng (Round 2)
��
AU$1=GBP 0.4164AU$1=HK$5.1
The Argentine Peso is ties one for one to the US$ and has been treated as US$.
Future claimS hanDling coStS (Fchc)
The calculations include the present value of the future cost of administering claims on the basis of a report commissioned in 1998 by an independent consultant with the fol-lowing terms of reference.
Ascertain a fair value of future claims handling costs as at 31 December 1997 in respect of the claims reserves of nominated portfolios of the HIH group. The review should take into account both reported and unreported claims as at 31 December 1997 and be based on the assumption that claims management would pass to a third party claims management provider under a competitive tendering process.
This led to the conclusion that approximately 2% of claims cost is required for future claims handling of incurred claims, when the entire portfolio is considered as a whole. Whilst some elements of the portfolio may, when taken alone, require more that 2%, the principle of averaging across the entire business has been adopted.
It should be pointed out that, if the costs of the company are not so contained, the company will incur an expense over-run.
elimination oF biaS in the valuation proceSS
During the past 18 months the trend in payout under personal injury claims as ob-served on a payment per open claim basis, has shown consistent increases which cannot be considered as fluctuations.
It is of course always difficult to discern a trend from a fluctuation at the early state, but even when a trend is observed, the question arises as to whether the trend is going to continue or level off.
It is possible to find reasons for all trends and to postulate that they will not con-tinue. If such an attitude were to be introduced, it would in my opinion, introduce bias to the result, in that it is my experience that this is a highly unlikely outcome.
This valuation has allowed for all changes observed up to the end of the first quarter of 1999 to be considered permanent rather than temporary fluctuations. Changes in the second quarter of 1999 have been treated partly as trend and partly fluctuation. As such I consider the basis to be unbiased.

Insurance Superv�s�on Core Curr�culum
��
The estimate of future claim increment rates is judgmental. In the sense that I have chosen rates which are not those recently observed, but are ones which I consider to be a fair estimation of the middle ground, it is my opinion that this element of the valua-tion basis is unbiased and represents the neutral position.
As mentioned earlier, there are risks involved with claim estimation, and whilst it is impractical to provide for all possible outcomes, insurance does involve both fluctua-tions and trends, which may require reserves to be strengthened. This is always a pos-sibility with an unbiased valuation based on what is considered to be neither optimistic nor pessimistic assumptions.
The discounting process which the company adopts does mean that prospective investment profit from the reserve held is minimal, but there is also the risk of loss. The valuation has in effect taken the neutral position expecting neither profit nor loss.
The end result is, I believe, a liability which has a 50% probability of adequacy.
General Liability Business
There are 3 active portfolios underwritten by FAI, CIC and HIH Casualty & General. All other portfolios are in run-off.
hih caSualty & general liability buSineSS
This portfolio consists of both bodily injury and material damage claims arising from underwriting all types of liability contracts other than workers compensation or profes-sional indemnity, written on a claims incurred basis. It also includes a substantial book of claims arising from reinsurance inwards of USA contractors liability, which is subject to litigation.
Reinsurance in this portfolio is a mixture of normal XOL treaty, facultative place-ments, sometimes up to 100%, and whole account cover for specified business in speci-fied years.
Data has been supplied for each year of accident showing the number of claims re-ported, stratified by expected ultimate claim size, and the amounts paid to date thereon. Also provided is the number of open claims by year of accident.
For the first time we have been supplied with data in 7 different classes of business, namely:
• Contract works• Councils• XOL workers compensation• General liability• Material damage

HIH Case Study on Prov�s�on�ng (Round 2)
��
• Product liability• Supplementary legal expenses
The claim portfolio of this business is highly skewed. About 90% of the reported claims are expected to be settled for less than $30,000, but it is also possible to have claims incurred in excess of $1,000,000. These large claims need to be considered over periods longer than a year for a meaningful model to be prepared, and are therefore excluded from the general modeling process.
The average claim size for each class of business and accident year was determined from an analysis of the historical development of the gross claim payments (excluding claims over $1,000,000), divided by the number of closed claim.
Fluctuations were smoothed by averaging over a number of accident years. Av-erage payments for the tails were estimated by reviewing the recent historical averages of tail payments and comparing these to the gross case estimated.
Large claims greater than $1,000,000 have been taken at case estimated values. The number of incurred but not reported large claims were estimated from prior years his-tory, at an average size equal to the average size of such reported claims.
The average size of IBNR claims less than $1,000,000 is assumed to be the same as that for reported claims.
The reinsurance retentions have been calculated using the latest average of his-torical payments within accident years and classes of business. The average cost of claim and the average paid retention for claims less than $1,000,000, excluding the XOL deals with Hanover Re are as follows:
Year of acc�dent Average gross cla�m s�ze Retent�on
1986 $21,028 81.7%
1987 $23,698 80.2%
1988 $17,633 80.0%
1989 $12,166 76.6%
1990 $12,557 65.5%
1991 $12,852 72.0%
1992 $14,701 78.2%
1993 $20,070 85.8%
1994 $21,662 91.1%
1995 $24,841 93.7%
1996 $21,949 98.0%
1997 $21,998 97.3%
1998 $22,882 94.5%
1999 $23,690 94.5%
To arrive at these averages I have taken the position that increases up to the end of the first quarter of 1999 are a permanent feature of the business, but have also assumed

Insurance Superv�s�on Core Curr�culum
��
some slowing down in the rate of inflation, and have incorporated a future rate of claim inflation of 4% per annum.
Future cLaims handLing costs
The undiscounted allowance for future claims handling costs is $7,538,000.
discounted LiabiLity
Using a constant rate of discount of 6%, the discounted net cash flow including future claims handling costs and excluding the US business is $239,700,000.
Further details of the valuation are shown in the appendix to this report.
the usa business
The dispute is being conducted in London, and I have accepted that the discounted set-tlement of all these outstanding claims is A$42,100,000, as endorsed by the Company, being their expectation of the likely result. This I have no way of checking, nor indeed is it a matter for actuarial valuation in that it is the negotiated result of a commercial dispute with reinsurers.
generaL comment on this portFoLio
I have been monitoring this portfolio for several years now and have had to make as-sumptions about many items as full data was not available. The data now available adds more certainty to the calculations of the claims incurred and the reinsurance thereon, but there still remains a degree of uncertainty with IBNR.
There is undoubtedly a very long IBNR tail in this type of insurance and our method of valuation assumes that the past reporting patterns will continue in the future. IBNR represents approximately 25% of the total liability.
I believe that this is an unbiased representation of the facts as I see them, but it cannot be denied that this figure could be either larger or smaller than we have calcu-lated. The uncertainty factor is very high.
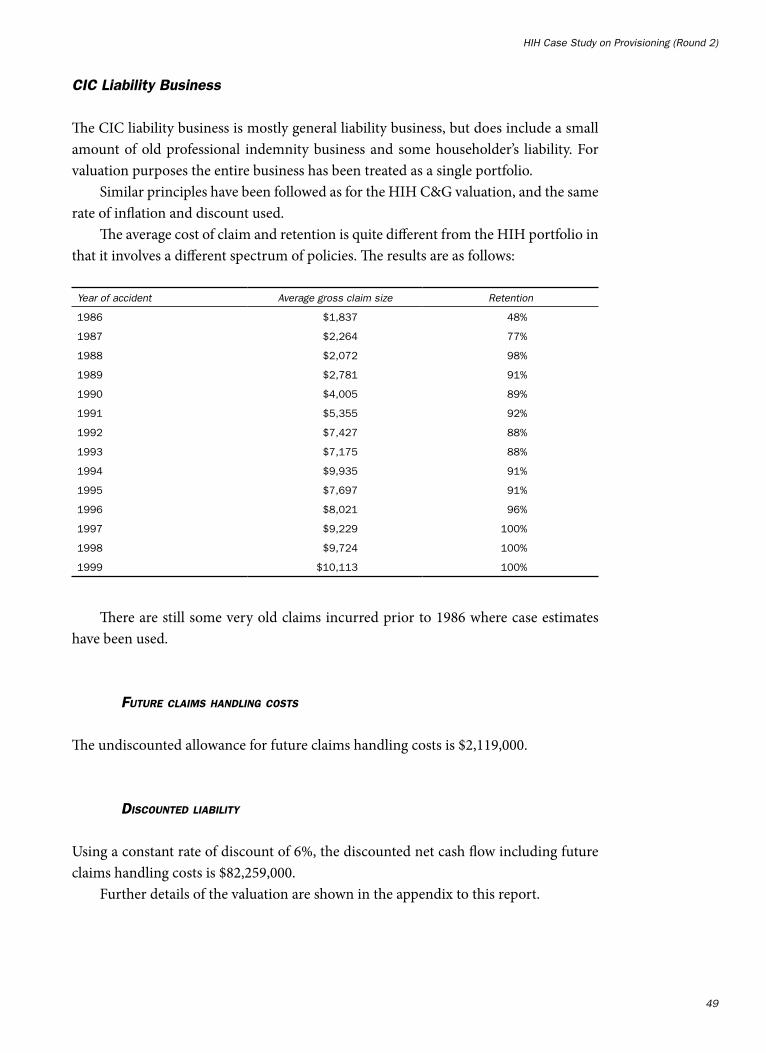
HIH Case Study on Prov�s�on�ng (Round 2)
�9
CIC Liability Business
The CIC liability business is mostly general liability business, but does include a small amount of old professional indemnity business and some householder’s liability. For valuation purposes the entire business has been treated as a single portfolio.
Similar principles have been followed as for the HIH C&G valuation, and the same rate of inflation and discount used.
The average cost of claim and retention is quite different from the HIH portfolio in that it involves a different spectrum of policies. The results are as follows:
Year of acc�dent Average gross cla�m s�ze Retent�on
1986 $1,837 48%
1987 $2,264 77%
1988 $2,072 98%
1989 $2,781 91%
1990 $4,005 89%
1991 $5,355 92%
1992 $7,427 88%
1993 $7,175 88%
1994 $9,935 91%
1995 $7,697 91%
1996 $8,021 96%
1997 $9,229 100%
1998 $9,724 100%
1999 $10,113 100%
There are still some very old claims incurred prior to 1986 where case estimates have been used.
Future cLaims handLing costs
The undiscounted allowance for future claims handling costs is $2,119,000.
discounted LiabiLity
Using a constant rate of discount of 6%, the discounted net cash flow including future claims handling costs is $82,259,000.
Further details of the valuation are shown in the appendix to this report.
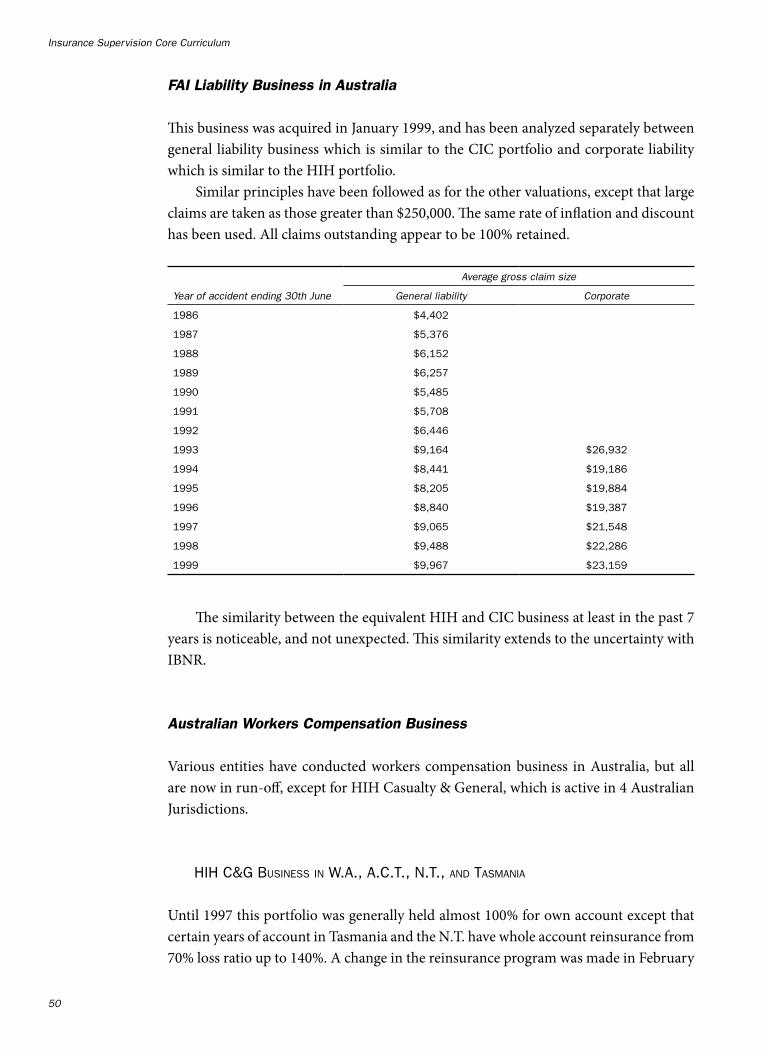
Insurance Superv�s�on Core Curr�culum
�0
FAI Liability Business in Australia
This business was acquired in January 1999, and has been analyzed separately between general liability business which is similar to the CIC portfolio and corporate liability which is similar to the HIH portfolio.
Similar principles have been followed as for the other valuations, except that large claims are taken as those greater than $250,000. The same rate of inflation and discount has been used. All claims outstanding appear to be 100% retained.
Year of acc�dent end�ng 30th June
Average gross cla�m s�ze
General l�ab�l�ty Corporate
1986 $4,402
1987 $5,376
1988 $6,152
1989 $6,257
1990 $5,485
1991 $5,708
1992 $6,446
1993 $9,164 $26,932
1994 $8,441 $19,186
1995 $8,205 $19,884
1996 $8,840 $19,387
1997 $9,065 $21,548
1998 $9,488 $22,286
1999 $9,967 $23,159
The similarity between the equivalent HIH and CIC business at least in the past 7 years is noticeable, and not unexpected. This similarity extends to the uncertainty with IBNR.
Australian Workers Compensation Business
Various entities have conducted workers compensation business in Australia, but all are now in run-off, except for HIH Casualty & General, which is active in 4 Australian Jurisdictions.
hih c&g buSineSS in w.a., a.c.t., n.t., anD taSmania
Until 1997 this portfolio was generally held almost 100% for own account except that certain years of account in Tasmania and the N.T. have whole account reinsurance from 70% loss ratio up to 140%. A change in the reinsurance program was made in February

HIH Case Study on Prov�s�on�ng (Round 2)
��
1998—backdated to the 1996 year of account. The 1996 year of account in WA and ACT and all of the 1997 and subsequent years of account have been quota shared 50%.
The date supplied has been the numbers of claims reported, number of claims open on the valuation date, and amounts paid by year of accident, and I have made a model for the future claims run-off pattern which indicates
• The claims reported each year,• The claims finalized each year, and• The payments made per open claim each year.
In the first instance I have modeled gross figures prior to reinsurance, and then de-ducted expected reinsurance recoveries. The basic method of construction of the model is the same as that for several years now, which has been seen to be very robust.
Future average claim inflation is an important factor in the calculation of workers compensation claim reserve, and does affect the payout pattern.
Observations are that whilst the rate of apparent inflation in any one jurisdiction varies from time to time, the general pattern of the entire portfolio can usefully be expressed as a percentage. This portfolio has experienced high rates of inflation in Tas-mania in the early nineties, in WA in the mid nineties and more recently in the ACT and NT. The overall long-term rate across the board has currently been set at 8%.
The valuation basis gives the following average cost of claim.
Year of acc�dent Average gross cla�m s�ze Retent�on
1990 $3,379 100%
1991 $4,378 100%
1992 $5,546 100%
1993 $6,198 100%
1994 $6,789 100%
1995 $7,999 100%
1996 $10,264 100%
1997 $9,703 58%
1998 $12,020 50%
1999 $12,492 50%
These figures exclude 3 large claims in the NT for which a special reserve of $4,500,000 is made.
Future cLaims handLing costs
The undiscounted allowance for future claims handling costs is $2,946,000.

Insurance Superv�s�on Core Curr�culum
�2
discounted LiabiLity
Using a constant rate of discount of 6%, the discounted net cash flow after deducting all reinsurance recoveries and including future claims handling costs is $69,931,000.
Further details of the valuation are shown in the appendix to this report.
hih u&i run oFF in victoria anD South auStralia
In Victoria and South Australia underwritten workers compensation ceased in 1985 and 1987 respectively, and the portfolios are being run off.
All of the years of account being run off were subject to coinsurance and the av-erage retention of the claims incurred is 67%.
The method of valuation has been to assume a run off pattern, consistent with very ole experience, and to adjust this pattern ear year according to the actual experience. Allowance is then made for IBNR, claim administration and the time value of money.
On the valuation date there were 1,047 claims outstanding, at an average cost of $6,024. Many of these claims are small hearing loss claims which accounts for the low average. The gross IBNR reserve was taken at $400,000.
Future cLaims handLing costs
The undiscounted allowance for future claims handling costs is $134,000.
discounted LiabiLity
Using a constant rate of discount of 6%, the discounted net cash flow after deducting all reinsurance recoveries and including future claims handling costs is $3,889,000.
cic run oFF in wa, taSmania anD act
The same principles as for HIH C&G were followed for the CIC workers compensation business in WA, Tasmania and ACT, but allowing for the fact that the portfolio is now in run-off.

HIH Case Study on Prov�s�on�ng (Round 2)
�3
The valuation basis gives the following average cost of claim.
Year of acc�dent Average gross cla�m s�ze Retent�on
1990 $2,719 100%
1991 $4,603 100%
1992 $4,434 60%
1993 $5,902 10%
1994 $4,781 100%
1995 $6,922 80%
1996 $7,827 100%
1997 $5,311 100%
The unusual reinsurance pattern reflects the low excess of loss insurance by CIC and is based on actual cast estimates.
Future cLaims handLing costs
The undiscounted allowance for future claims handling costs is $351,000.
discounted LiabiLity
Using a constant rate of discount of 6%, the discounted net cash flow after deducting all reinsurance recoveries and including future claims handling costs is $6,259,000.
cic run oFF in other areaS
The CIC run-off in NSW, SA and Victoria is now very small, and case estimates are as-sumed to apply. The liability for this has been taken as $3,291,000.
cic top up in nSw
The liability has been estimated at $4,000,000. Actuarial processes are not suitable for this type of business where claims are intermittent, and not even advised until after settlement.
The reserve has been based on last years estimate of $8,000,000, and the fact that considerably less has been paid out than that estimate expected.

Insurance Superv�s�on Core Curr�culum
��
Fai buSineSS in wa, act, nt anD taSmania
The FAI portfolio has now commenced run-off stage. The valuation process has been the same as has been used in HIH for many years, and this reveals the following average cost of claims.
Year of acc�dent commenc�ng � July Average gross cla�m s�ze Retent�on
1990 $3,260 100%
1991 $3,722 100%
1992 $4,964 100%
1993 $5,306 100%
1994 $5,676 100%
1995 $5,790 100%
1996 $6,009 100%
1997 $7,298 100%
1998 $8,869 100%
1999 $9,720 100%
The averages are noticeably lower than those for HIH reflecting the risk profile of the business written.
Future cLaims handLing costs
The undiscounted allowance for future claims handling costs is $2,765,000.
discounted LiabiLity
Using a constant rate of discount of 6%, the discounted net cash flow including future claims handling costs is $116,294,000.
Further details of the valuation are shown in the appendix to this report.
Fai run oFF in other areaS
The FAI run-off in NSW, SA and Victoria is now very small, and case estimates are as-sumed to apply. The liability for this has been taken as $9,231,000.
total workerS compenSation liability
The total claim reserve for workers compensation business in Australia is as follows.

HIH Case Study on Prov�s�on�ng (Round 2)
��
Portfol�o Und�scounted D�scounted
HIH 82,970,000 69,931,000
CIC 14,989,000 13,550,000
U&I 4,634,000 3,889,000
FAI 145,394,000 125,525,000
Total 247,987,000 212,895,000
Professional Indemnity Business Underwritten in Australia
hih c&g proFeSSional inDemnity buSineSS
This business is mostly Australian sourced business with approximately 12.5% under-written from overseas sources. For valuation purposes the business is treated as a single pool, except for the NSW Law Society which is considered as a separate pool on its own.
The policies are written on a claims made basis. The reinsurance treaties are effec-tively coinsurance treaties by non-indexed layer of the amount of indemnity.
Data provided has been on a year of account basis showing claims incurred, open claims (excluding claims which are considered to have zero value) and amounts paid. Also provided has been a schedule of claims expected to be in excess of $1,000,000.
In this portfolio there are a number of reported incidents which was registered as a claim, but where it is expected that the outcome will be no payment. These are referred to as zero claims, and for the purpose of analysis of the data are removed. That some of these zero claims may in fact become positive claims is allowed for as IBNR. It is noted that during 1997 the net number of new non-zero claims reported is negative for all the mature years of account, because a claim can be reclassified from non-zero to zero.
The only suitable method of analysis that lends itself to this data is to determine the net amount paid per open claim excluding all perceived zero claims and all claims with an estimate in excess of $1,000,000.
The model I have constructed uses a 3.5% future claim inflation rate, which is the same as that used at the last valuation.
The valuation shows quite a volatile average cost of claim which is influenced by general economic conditions and changes in the risk profile as follows:

Insurance Superv�s�on Core Curr�culum
��
Year of account commenc�ng � Apr�l Average gross cla�m s�ze Retent�on
1989 $124,563 80%
1990 $127,786 80%
1991 $100,711 80%
1992 $119,457 85%
1993 $76,931 85%
1994 $77,109 85%
1995 $64,076 85%
1996 $83,025 85%
1997 $47,378 85%
1998 $38,664 85%
1999 $38,664 85%
Claims in excess of $1,000,000 and the NSW Law Society are excluded from the model and allowed for separately.
For claims in excess of $1,000,000, I have added a gross provision of $74,217,000 with a net value of 34,041,000, based on case estimates.
Whilst there can be large divergence between actual and expected on a gross basis, the net reserve should be more accurate, given the fixed non-indexed retention.
For the 1999 year of account where nothing has been paid, I projected the average cost of claim and estimated the actual number of claims according to business written and time on risk, in order to arrive at the reserve for that year.
Future cLaims handLing costs
The undiscounted allowance for future claims handling costs is $3,539,000.
discounted LiabiLity
Using a constant rate of discount of 6%, the discounted net cash flow after deducting all reinsurance recoveries and including future claims handling costs is $184,451,000.
Further details of the valuation are shown in the appendix to this report.
nSw law Society
This is a new contract, which commenced on 1st July 1998. It has been underwritten on the basis of earlier actuarial valuations, which I have seen, but the policy terms have a substantial excess and do not cover the entire society’s risk.
At this stage it is only possible to assess the likely outcome based on prior reports and then adjust for the risk profile, since there is no other data.

HIH Case Study on Prov�s�on�ng (Round 2)
��
Accordingly I have allowed for $34,700,000 claims before discount. The discounted value is $26,366,000.
Fai proFeSSional inDemnity buSineSS
The FAI portfolio, which has been closed, was analyzed using a payment per claim final-ized method which produced the following:
Year of acc�dent commenc�ng � July Average gross cla�m s�ze Retent�on
1989 $76,415 100%
1990 $62,513 100%
1991 $65,081 100%
1992 $52,708 100%
1993 $51,979 100%
1994 $59,649 100%
1995 $49,337 100%
1996 $56,062 100%
1997 $55,638 100%
1998 $58,730 100%
Claims greater than $1,000,000, and the Medical Defence Union were excluded from the model, and the resulting liability was $77,892,000.
Claims greater than $1,000,000 were taken at net case estimates of $25,574,000 plus IBNR of $11,000,000.
meDical DeFence union
The liability was assessed using earlier actuarial reports with an allowance for stop loss cover. The net liability was taken at $7,670,000.
Future cLaims handLing costs
The undiscounted allowance for future claims handling costs is $4,956,000.
other Fai buSineSS
FAI have written some business overseas and the only information we received were actuarial reports by Pricewaterhouse as at 31st December 1998.

Insurance Superv�s�on Core Curr�culum
��
In that these portfolios are in run-off the liability as at 31st December was ad-opted.
total proFeSSional inDemnity liability
The total claim reserve for professional indemnity business excluding New Zealand and UK is
Portfol�o Und�scounted D�scounted
HIH 249,254,000 210,817,000
FAI Australia 143,884,000 121,696,000
FAI overseas 16,552,000 14,000,000
Total 409,690,000 346,513,000
Marine (Excluding UK)
hih marine written in auStralia
This business consists of marine business written in Australia plus run-off of American business written prior to 1 January 1999. I have developed a model from the Australian data which is more extensive and have used this model for the entire portfolio, given that this is very much an international business being underwritten through Australian supervision, and is best viewed in the aggregate.
The retention limits are lower than for other classes of business being generally US$250,000, and I have made my analysis on a net basis. The resulting average claim size is as follows:
Year of acc�dent commenc�ng � January Average net cla�m s�ze Retent�on
1992 $14,695 95%
1993 $14,862 95%
1994 $19,386 95%
1995 $20,169 95%
1996 $10,812 95%
1997 $14,472 95%
1998 $21,397 95%
1999 $21,825 95%

HIH Case Study on Prov�s�on�ng (Round 2)
�9
Future cLaims handLing costs
The undiscounted allowance for future claims handling costs is $1,511,000.
discounted LiabiLity
Using a constant rate of discount of 6%, the discounted net cash flow after deducting all reinsurance recoveries and including future claims handling costs is $48,496,000. Further details are shown in the appendix.
hih marine written in new ZealanD
This business was formerly written out of Australia and has been transferred to New Zealand administration from 1st January 1999.
Prior valuations of New Zealand business were made in conjunction with the Aus-tralian business, but this procedure has now been altered except that the same model has been used.
discounted LiabiLity
Using a constant rate of discount of 6%, the discounted net cash flow after deducting all reinsurance recoveries and including future claims handling costs is A$5,844,000.
Fai marine
No data was available for this valuation and net case estimates were accepted. That the HIH valuation produced results close to case estimates justified this assumption. The total net discounted liability was taken as $27,100,000.

Insurance Superv�s�on Core Curr�culum
�0
total marine liability (excluDing uk)
The total claim reserve for professional indemnity business excluding UK is
Portfol�o Und�scounted D�scounted
HIH Australia 53,082,000 48,496,000
HIH New Zealand 6,397,000 5,844,000
FAI 29,662,000 27,100,000
Total 89,141,000 81,440,000
Other Liability
Short tail lineS
There is considerably greater possibility for major fluctuation in short tail lines, but this “a priori” uncertainty is relieved by comparatively fast reporting and assessment of claims “a posteriori”.
For the purpose of this valuation underwriters case estimates have been used with their allowance for IBNR, which is in any event comparatively small.
The underwriters’ estimates have then been adjusted for future claims handling costs, at a rate of 2% of the liability, and then discounted at a rate of 6% for an average holding time of the liability of three quarters of a year. Whilst domestic lines get settled quite quickly, it is often the case that larger commercial claims take considerably longer time up to 5 years to settle.
The total short tail business liability was as follows:
Australia $213,744,000
Hong Kong $19,000,000
New Zealand $5,010,000
gSt anD y2k
Much of the problems relating to the introduction of GST relate to short tail business, but there is also liability relating to workers compensation and general liability. In this respect the Company has made in depth investigations and I have accepted that their calculations are reasonable.
In addition for Y2K problems XOL reinsurance in excess of $1,000,000 has been purchased.
The discounted reserve included in the liability has been taken at $35,400,000.

HIH Case Study on Prov�s�on�ng (Round 2)
��
cmg
No data has been provided for this company since December 1998. I am aware that the business in this company has been run down pending surrender of the licence. Accord-ingly an estimate of the liability was made from the previous valuation at $30,000,000 prior to discount, and $25,700,000 after discount.
aami
Liability of $44,987,000 as advised by AAMI has been accepted.
Fai reinSurance inwarDS
Data regarding the treaties written has been supplied together with a valuation made as at December 1998. Reinsurance inwards is always difficult to value and market knowl-edge plays an important part. I made suitable enquiries regarding potential claims where that was possible and given the prior valuation consider that the company’s estimate of liability of $50,000,000 to be fair.
charman
There is a dispute regarding reinsurance of the Charman account in London. A reserve of $30,535,000 has been made according to management’s expectation of the outcome.
hih c&g Salary continuance buSineSS
The data supplied has been the numbers of claims reported, number of claims open and amounts paid in form 11 format for calendar years from 1988. This data has been con-verted into a claim payment model, which gives the following average cost of claim:

Insurance Superv�s�on Core Curr�culum
�2
Year of acc�dent end�ng 3�st December Average gross cla�m s�ze Retent�on
1990 $32,276 45%
1991 $21,916 45%
1992 $26,786 45%
1993 $33,116 45%
1994 $28,569 45%
1995 $24,883 45%
1996 $23,972 45%
1997 $31,069 45%
1998 $30,141 45%
1999 $31,346 45%
Future cLaims handLing costs
The undiscounted allowance for future claims handling costs is $237,000.
discounted LiabiLity
Using a constant rate of discount of 6%, the discounted net cash flow including future claims handling costs is $4,942,000.
Further details of the valuation are shown in the appendix to this report.
uk buSineSS
The UK business consists of partial interests in 4 Lloyds syndicates through Cotesworth, and independent marine and non-marine portfolios.
The methods used by UK actuaries are not the same as generally used and consid-ered acceptable in Australia, in that they heavily rely on the use of estimated ultimate loss ratios.
I have had extensive discussions with actuaries in London, and agree that the fig-ures they have provided are acceptable, as follows.
total uk liability
The total claim reserve for business converted to AU$ is

HIH Case Study on Prov�s�on�ng (Round 2)
�3
Portfol�o Und�scounted D�scounted
Non marine 224,395,000 187,998,000
Marine 80,230,000 73,299,000
Cotesworth 37,550,000 33,225,000
Total 342,175,000 294,552,000
Stop loSS
The company has purchased worldwide stop loss of $400,000,000 excess of loss over the 1998 total reserves for claims incurred up to the end of 1998 including the FAI portfo-lios. It appears that this will all be used.
The present value is deducted from the liability, and at 6% discount is calculated at $255,014,000.
Conclusion
The grand total reserve for claims incurred having 50% probability of adequacy as at 30th June 1999 for the group is
Prior to discount $3,043,252,000 After discount $2,698,683,000
Excluding the stop loss, this represents an average discount factor of 85.7% which at 6% per annum implies an average weighted term of 2.63 years.
This represents 7.05% increase over the reserve as at 31st December 1998.For the purpose of assessing the solvency of the company it is deemed prudent
to include a prudential margin over and above the central estimate of the liability for claims incurred. The extent of any prudential margin is a matter for judgement, and I point out that each Australian Company is assessed individually by APRA according to its regulations; they may make adjustments to the valuations as they see fit.
I consider that for the group as a whole, 7.5% prudential margin should be ad-equate to cover the risks discussed earlier in this report, although it must never be as-sumed that the existence of a prudential margin will give 100% certainty; it does not, but it does give considerable comfort relative to the risks that do exist.
The prudential margin does not obviate the necessity for the legal solvency margin, and indeed it is the combination of the prudential margin and the solvency margin that is the acid test of the real strength of the company.
Given that the claim reserve has been increasing regularly, and that the Company must demonstrate that at all times it maintains a prudent solvency margin, I would ex-

Insurance Superv�s�on Core Curr�culum
��
pect to see shareholders funds of at least $600,000,000 to support this discounted claim reserve.
D. J. SLEE FIA FIAA 1st December 1999

HIH Case Study on Prov�s�on�ng (Round 2)
��
Attachment 5
“Public and Products Liability—Experience, Expectations, Expensive?”
This extract is from a paper entitled “Public and Products Liability—Experience, Ex-pectations, Expensive?” by Tim Andrews, Estelle Pearson & David Whittle which was presented to Institute of Actuaries of Australia Eleventh General Insurance Seminar, November 1997.
Section 9 — Summary and Conclusions
The key findings in this paper in the sequence shown are:
• Declared profits for public and products liability business have been extremely good over the last five years.
• Market sentiment appears somewhat ambivalent with at least some insurers be-coming concerned about premium rate levels. Liability business is still being priced very competitively.
• An analysis of ISA accident year data indicates loss ratios may have increased from around 70% five years ago to 120% (or more) currently. ISC data do not show the same deterioration.
• Whilst the measurement of superimposed inflation is problematic, we believe overall claim costs may be rising by as much as 5% per annum in real terms.
• ISA data indicates little change in average premium over the last five years. This conflicts with ISC data that show a significant increase in 1994. We believe the ISA trend, which is consistent with anecdotal evidence from insurers of rate changes to be the more likely.
• Having regard to the experience of CTP, it is plausible that the favorable liability results reported in 1994 to 1996 reflect the release of profits from the run-off of earlier years, and the underlying experience is actually much worse than de-clared.
• Target loss ratios (undiscounted) of between 75% and 80% are required to achieve a reasonable return on equity for this class.
There are troubled times ahead for public and products liability. We predict big losses for some insurers in the next few years as a result of recent pressures on pre-miums and the inexorable rise in claim costs. On an accident year basis, a loss ratio of, say, 120% for 1996 compares with a target of 75% to 80%. Premiums may need to increase by as much as 50% to return this class to acceptable profitability.

Insurance Superv�s�on Core Curr�culum
��
Attachment 6
“Lack of Industry Profitability and Other Stories”
This extract is from a paper entitled “Lack of Industry Profitability and Other Stories” by Peter McCarthy and Geoff Trahair which was presented to the Institute of Actuaries of Australia Twelfth General Insurance Seminar, November 1999.
Abstract
This paper is an update of McCarthy et al (1997) and McCarthy (1992). In it we reveal that the insurance industry may be substantially under-reserved in public liability. We discuss the problems of managing commercial and casualty classes using the “Insur-ance Control Cycle” paradigm and conclude that the industry should seriously consider applying the NSW Workers’ Compensation Rating Bureau model to other commercial classes.
Our aim is to be controversial, to promote discussion. The views expressed are our personal views and not those of our respective employers.
Section 1 — The Stories and Summary
the StorieS
From the outset we wish to state our aim is to be controversial, to promote discussion. The views expressed are our personal views and not those of our respective employers.
The title of this paper gives readers an insight into our personal views of industry profitability. In the year to December 1998 the industry reported its highest ever un-derwriting loss, nearly 40% higher than any underwriting result during the last 20 years and its third worst return on capital during that time. In 1998 the underwriting loss as a percentage of net earned premium does not look so bad, being less than the average over the last 20 years. However such a simplistic assessment distorts the picture. During the 1970s, 1980s and the early 1990s high interest rates meant high underwriting losses could be tolerated.
Using the profit results of insurers for June 1999 as an indication, we expect the un-derwriting results and profitability for 1999 to be substantially worse than that reported for the year to December 1998.
Earlier this year one of the authors had a conversation with a CEO of a major Aus-tralian insurer. One of the topics touched upon was the financial health of the insurance industry. The author commented that the industry was going through a hard time. The quick retort from the CEO was that the industry was on its knees!

HIH Case Study on Prov�s�on�ng (Round 2)
��
This true story paints a simple picture of the financial state of the insurance in-dustry. However we do not view it so simply. From our perspective there are a number of insurers doing well. Personal lines insurers, including CTP, seem to be doing reason-ably well, with a very small number doing exceptionally well. Those insurers with a majority of commercial business are having a very tough time and some are probably truly on their knees as the CEO commented.
This paper is an update of McCarthy et al (1997) which in turn was an update of McCarthy (1992). We review the profitability of the industry and focus particularly on the casualty (long tail) classes. We also look at the reasons why commercial classes are performing so poorly.
From our work on this paper and our own experience we conclude with two simple observations:
• to paraphrase Warren Buffet’s Chairman’s Letter in Berkshire Hathaway’s 1995 annual report, where he talks about GEICO Corporation, “To under-reserve is to under-price.”; and
• the general standard of the management of commercial products in Australia seems to be poor.
Unfortunately many executives of insurance companies fool themselves into a false sense of profitability by trying to pressure actuaries to reduce their outstanding claims liabilities. All this does is perpetuate the under pricing of products.
Some broad measures used in this paper suggest that public liability may be under-reserved by $500 m to $1,000 m at December 1998 or 25% to 50% of outstanding claims reserves at that date. Many insurers have found during the last few years that they have been under-reserved in workers compensation and it is possible that professional in-demnity may also be under-reserved, but it is difficult to estimate the extent. We hope we are wrong on public liability because the implications for insurers writing this class are frightening.
From our experience in commercial classes many insurers perform poorly at each stage of the insurance control cycle. They start with poorly trained and low-skilled staff using inadequate or non-existent pricing models combined with poor underwriting controls. They continue with poor claims management, lax data collection and sketchy monitoring. This leads to superficial or no analysis of portfolio performance.
Some examples we have come across of the management, underwriting and pricing of commercial products attempted to defy gravity.
We are not even going to hazard a comment about the inwards reinsurance market in Australia.
We conclude the introduction with another story. A few weeks ago one of the au-thors was discussing the 1997 paper with an American actuary from a very large inter-national insurer. After reviewing the paper and discussing the financial results of the industry over the last two years, the overseas actuary posed the question:

Insurance Superv�s�on Core Curr�culum
��
“Why was it so obvious to you two years ago and not others, that the industry was going to fall on hard times?”
The author’s reply was simple:
“Logically when premium rates drop by 30% to 40% there can only be one outcome—huge losses. If other senior executives in the industry did not expect the current results then it is a reflection of their management.”
The 1998 Ord Minnett/Deloitte Touche Tohmatsu General Insurance and Reinsur-ance Survey points out the illogical views expressed by insurers. What is amazing to us in reviewing the survey results is the boundless optimism that seems to pervade the in-dustry. In almost all of the commercial classes reviewed insurers consistently projected decreasing loss ratios, despite reductions in premium rates in some classes over 1994 to 1998 of 30% to 40%. This point was not lost on the authors of the survey.
The subtitle of the 1998 survey could not have been more appropriate “Not on the rocks but close”.
It appears that the industry does not take much notice of papers presented at con-ferences. For example those by Trowbridge Consulting over the last two years clearly showed that public liability premiums were grossly inadequate. This would suggest the industry is going to have a period of poor profitability.
In the Australian marketplace the strong insurers are getting stronger whilst the weak insurers are getting weaker, ultimately needing assistance from very strong over-seas parents or hoping to become takeover targets.
Data anD approach incluDing limitationS oF analySiS
As in the previous paper we:
• only consider private direct insurers in Australia (i.e. exclude reinsurers); • include all related body corporate assets; and • use Australian Prudential Regulation Authority (APRA) data published in “Se-
lected Statistics of the General Insurance Industry” at each 30 June from 1978 to 1998.
In addition, we have included APRA data as at December 1998. For convenience we refer to this data as the 1999 year. The data reported as at December 1998 duplicates data reported as at June 1998 for those insurers whose balance dates fall in the period 1 January to 30 June.
HIH Case Study on Prov�s�on�ng (Round 2)
�9
The recent APRA statistics have been changed. The number of insurance classes has been reduced and it is now not possible to monitor some of the smaller classes such as travel, trade credit, extended warranty, sickness and accident. Others have been combined such as ISR and fire, product and public liability and the three marine and aviation classes.
We note that the Form 11 runoff claims experience for casualty classes is no longer published. This is a pity as it has limited the extent of analysis that can be updated in this paper.
Other changes in APRA data from June 1998 occur in the areas of:
• only gross unearned premiums are now published by class; • third party recoveries are not published; and • claim payments by class are not published.
Consequently the allocation of benchmark capital and investment income by class is less accurate than in the past, as is the calculation of the return on shareholders’ funds. However, the impact on the observations and trends are not material. It is not the absolute values that are important but rather the trends and relative values over time.
We have excluded a captive insurer from 1978 to 1991 that had about $800 m in capital in 1991. It wrote a negligible amount of business.
It should be noted that APRA data is not strictly on a June year basis but rather a mix of insurers’ results for the balance sheet dates ending July to June or probably an average year ending December each year. For example, the APRA data for June 1998 are the results on average for the year ended December 1997.
We have adopted the approach set out in McCarthy (1992) of:
• setting benchmark capital levels by product; • allocating investment income and capital gains by product; and • measuring profits before tax.
There are some changes to the detail of the previous approach but they do not alter the results or our observations in any material way. A summary of the approach is set out in the Appendix and further details are provided in McCarthy (1992).
Solvency, capital and shareholders’ funds are used interchangeably in the paper, as are the terms casualty and long tail, and products and classes.
winnerS anD loSerS
Over the 1990s to December 1998 the average return on capital for the industry has been about 9% p.a. before tax. This reduces to about 7% p.a. if 1997 is excluded because

Insurance Superv�s�on Core Curr�culum
�0
it was a record year of investment return. The return for the year to December 1998 was poor at only 2.9%, the third lowest in the last 20 years.
As stated in the previous papers, the industry still relies very heavily upon the in-vestment return on excess capital for its profitability.
Overall, shareholders in the general insurance industry have been losers with a pre-tax rate of return not much more than the return from fixed interest securities. Given the risk involved, shareholders would have been better off investing in govern-ment bonds.
The clear losers over the last few years are those insurers who have under-reserved their outstanding claims liabilities and consequently under priced their premium rates. Other clear losers are those insurers who have focused on commercial classes and grown that part of their business.
Overall the profitability of casualty classes has been poor since 1994 with the ex-ception of 1997 when investment returns were very high. On average the return on cap-ital for long tail classes has been negative since 1994. Short tail classes have performed well since 1994 with an adequate return on capital but a significant reduction in profits occurred in 1999.
The profitability of long and short tail classes in the 1990s is the reverse of the 1980s when short tail classes were very unprofitable and casualty classes were very profitable.
The worst performing classes over the last few years have been:
• public liability (a clear “winner”); • workers compensation (a close second); and • professional indemnity.
It is notable that all are casualty classes. The best performing products during the last few years have been:
• marine; • other products; • householders (a very close third); and • fire and ISR (but now performing poorly).
Other losers include those insurers that have a greater share of NSW business, es-pecially in commercial classes—particularly public liability. CTP has been an average, but adequate performer, while both commercial and domestic motor have had border-line profitability.
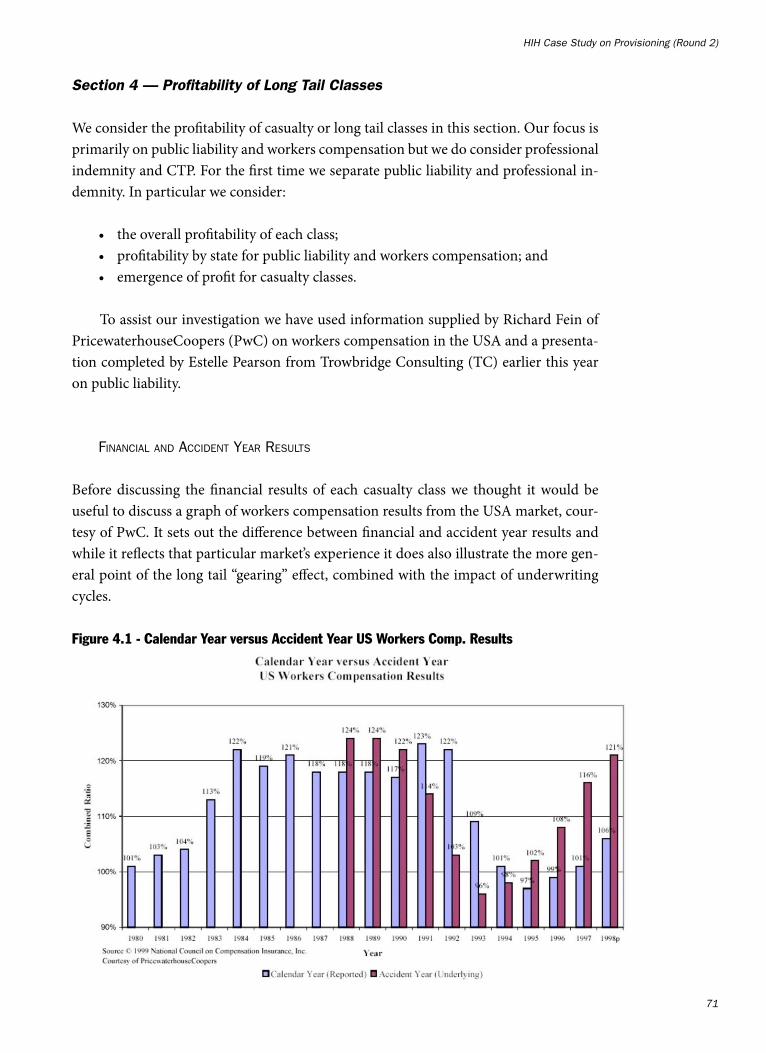
HIH Case Study on Prov�s�on�ng (Round 2)
��
Section 4 — Profitability of Long Tail Classes
We consider the profitability of casualty or long tail classes in this section. Our focus is primarily on public liability and workers compensation but we do consider professional indemnity and CTP. For the first time we separate public liability and professional in-demnity. In particular we consider:
• the overall profitability of each class; • profitability by state for public liability and workers compensation; and • emergence of profit for casualty classes.
To assist our investigation we have used information supplied by Richard Fein of PricewaterhouseCoopers (PwC) on workers compensation in the USA and a presenta-tion completed by Estelle Pearson from Trowbridge Consulting (TC) earlier this year on public liability.
Financial anD acciDent year reSultS
Before discussing the financial results of each casualty class we thought it would be useful to discuss a graph of workers compensation results from the USA market, cour-tesy of PwC. It sets out the difference between financial and accident year results and while it reflects that particular market’s experience it does also illustrate the more gen-eral point of the long tail “gearing” effect, combined with the impact of underwriting cycles.
Figure 4.1 - Calendar Year versus Accident Year US Workers Comp. Results

Insurance Superv�s�on Core Curr�culum
�2
Reported results clearly lag accident year results:
• between 1988 and 1990 accident year loss ratios averaged 123% while reported results were 114%;
• then between 1991 and 1994 reported loss ratios considerably exceeded acci-dent year results being 114% and 103% respectively, and in one year they were 20% different; and
• between 1995 and 1998 they reversed again with reported loss ratios being about 101% and accident year results 112%.
The trends of both the financial and accident year results were the same in each period:
• stable between 1988 and 1990; • decreasing during 1991 to 1994; and • increasing between 1995 and 1998.
The reasons why the cycle occurs are complex but include:
• deteriorating claims experience takes some time for actuaries to recognise and even longer for management to be convinced that it has deteriorated;
• build up and decline in any prudential margins delays accident year results being reflected in reported results;
• conservatism or otherwise in the actuarial assumptions delays accident year re-sults being reflected in reported results; and
• management not wanting to be honest and admit that results have deteriorated to the extent they have (this manifests itself in putting pressure on actuaries to reduce claims reserves and other financial mechanisms to defer the inevitable).
Other than the first explanation, it is our view that wishful thinking by manage-ment combined with the other reasons delays remedial action by management when accident year results deteriorate. Their experience with poor results often frightens them from taking full advantage of hard markets.
The insurance cycle is very much like the stock market—there is the same “herd” mentality. Herd insurers will attempt to maintain market share in a soft market by cut-ting price and lose market share in a hardening market as prices increase. However smarter insurers, like smarter investors, operate counter-cyclically, increasing market share when others are reducing it and reducing it when others are increasing it.
We believe the reasons for the lag in the reported results happens in Australia for casualty classes but that the effect may be more pronounced.

HIH Case Study on Prov�s�on�ng (Round 2)
�3
liability claSSeS (public liability anD proFeSSional inDemnity)
In McCarthy et al (1997) we commented on the very good profitability of liability classes over the 18 years to June 1996 with a return on shareholders’ funds usually in excess of 20% p.a., except for a period of about 3 years in the mid 1980s. The following graph shows there has been a dramatic change in the fortunes of the profitability of the liability classes.
Figure 4.2. Profitability of Public Liability and Professional Indemnity
The decline in profitability during 1998 and 1999 could be likened to falling off a cliff. During the 18 year period to 1996, the average return was 33% p.a. The return on shareholder funds in 1996 and 1997 was about 45% p.a.; in 1998 it declined to minus 11% and fell off the cliff in 1999 to minus 55%—a dramatic turnaround.
Loss ratios climbed from the average in the 18 years to 1996 of 74% to 86% in 1997, 98% in 1998 and 119% in 1999 and the combined ratios showed similar increases. The underwriting loss from the last 3 years was $840 m compared to a sum total of $445 m in the 18 years to 1996. That is, the last 3 years saw an almost tripling of the underwriting loss for the last 20 years. When the full 1999 results are available the last 3 years underwriting results, will in our view, exceed $840 m and may approach close to $1,000m.
The following two charts split the performance of the liability classes between public liability and professional indemnity from 1993 to 1999.

Insurance Superv�s�on Core Curr�culum
��
Figure 4.3. Profitability of Public Liability
Figure 4.4. Profitability of Professional Indemnity
HIH Case Study on Prov�s�on�ng (Round 2)
��
From Figure 4.3 it is very noticeable that the public liability loss ratio has been deteriorating each year since 1993 from around 65% to over 130% in 1999, effectively doubling over the 7 year period. Even the net expense ratio has shown a gradual upward trend each year, increasing from just under 29% in 1993 to slightly over 33% in 1999. The return on shareholders’ funds averaged 38% p.a. from 1993 to 1997 and fell off the edge in 1998 and 1999 to minus 20% and minus 75%. The last figure is in the top 5 worst returns for any product over the last 20 years.
Professional indemnity loss ratios, excluding 1996, have been very consistent aver-aging about 94% as can be seen from Figure 4.4. The low loss ratio in 1996 seems out of place. The return on shareholders’ funds has averaged about 11% p.a. over the 7 years and, excluding 1996 and 1997, was minus 8% p.a., hardly a startling return on invested capital.
public liability—Further inveStigation
The fall from grace of public liability is worth further examination. It is not possible for us to undertake a detailed investigation in this paper so instead we have referred to work undertaken by others in the following paragraphs.
Earlier this year Estelle Pearson from Trowbridge Consulting (TC) gave a presenta-tion on public liability with the data sourced from Insurance Statistics Australia (ISA). ISA data represents about 40% of the Australian market. Estelle’s paper sets out a graph showing TC’s estimated gross undiscounted accident year loss ratios from 1990 to 1998 (calendar years). We have attempted a rough comparison with APRA figures over the same period. The approach we have used is:
• we have set the APRA figures back one year as they represent figures over a twelve month rolling period (e.g. the 1999 figures have been allocated to 1998 for the comparison);
• the APRA figures are financial year figures and include discounting and pru-dential margins compared to TC’s accident year undiscounted figures with no prudential margins. On a raw basis they are probably a fair comparison as there is likely to have been little change in prudential margins and the undiscounted figures of TC should make appropriate allowance for the impact of unwinding the discount rate each year, which is included in the APRA results (note that the TC paper used 20% allowance for investment income in deriving target loss ratios); and
• we have used the gross loss ratios from APRA data.
The results are set out in Figure 4.5 below. We emphasize that the comparison is rough and readers should not take notice of the absolute figures in any one year but rather the overall difference between the two lines over the period of the comparison.

Insurance Superv�s�on Core Curr�culum
��
Figure 4.5. Comparison of APRA and Trowbridge Public Liability Gross Loss Ratios
The overwhelming observation is that the accident year loss ratios are substantially higher than the financial year loss ratios and only in the last year has the financial year loss ratio exceeded the accident year figure. TC’s estimated average loss ratio over the 5 accident years to 1998 is about 125% and the last 3 years have averaged about 135%, and we believe a similar result will emerge for 1999. TC’s loss ratios exceed APRA’s during the 7 years to 1998 by an average of 28% (i.e. TC 110% and APRA 82%) and by 33% in the 6 years to 1997.
What do these figures imply? Unless:
• APRA figures include the release of substantial profits from earlier accident years (possible in some of the earlier years of the comparison but unlikely in the later years);
• APRA figures include reductions in prudential margins (which we believe is unlikely);
• the ISA figures are not representative of the whole industry (again we believe this is unlikely);
• reinsurance arrangements are excellent (in which case they will be taking the “bath”); and
• the comparison is technically way off mark (which is unlikely);
then in our view the general insurance industry at December 1998 was very sub-stantially under-reserved for this class of business. Reserves could be understated by nearly two years’ net premium.

HIH Case Study on Prov�s�on�ng (Round 2)
��
Further broad analysis is possible from APRA data. A very rough indicator of the adequacy of outstanding claims reserves can be gained from the ratio of outstanding claims reserves to net written premium. The results are shown in the following graph for public liability.
Figure 4.6. Public Liability—Ratio of Outstanding Claims to Net Written Premiums
The main observation from the above graph is the stability of the ratio of claims reserves to premium having varied within a range of 2.30 to 2.92. Net written premium has also been stable during the last 5 years varying between $605 m and $660 m.
It is useful to visit some comments from the Ord Minnett / Deloitte Touche Tohm-atsu 1998 survey. Over the 4 years to 1998 the survey results state that premium rates for this class reduced by a cumulative 34% (page 7). From the above graph the ratio of claims reserves to net written premium fell from 2.70 to 2.30 between 1993 and 1997 and rose in 1998 and 1999 to levels experienced in 1993 and 1994. Simple logic suggests that unless claims experience has improved then with falling premium rates the ratio should have increased.
If insurers were adequately reserved in 1993 and 1994 and claims experience had NOT deteriorated from 1993 to 1999 then the fall in premium rates imply the ratio should have increased to between 3.75 and 4.00 or by a factor of between 30% to 40%. While a very rough measure, the above analysis adds support to our view that the in-dustry is substantially under-reserved.

Insurance Superv�s�on Core Curr�culum
��
The last measure implies the industry may be under-reserved by up to 0.80 times annual net written premium which is about $550 m or nearly 30% of outstanding claims reserves at December 1998.
The Ord Minnett report states that:
“… according to a number of insurers it was a difficult year with a significant increase in the frequency of some liability categories.”
In other words the claims experience has deteriorated. The TC paper also high-lights that there has been a substantial deterioration in the claims experience of public liability since 1994.
Deteriorating claims experience implies the under-reserving situation is even worse. The comparison between the APRA results and the TC view above suggests that the industry is even more than 0.80 times annual net written premium under-re-served.
Both approaches we have adopted indicate a similar level of under-reserving. It is conceivable that the industry could be under-reserved by up to $1,000 m, a very scary proposition and one which we hope is substantially incorrect.
What amazes us is that it has taken so long for insurers to be aware of the problems they are facing in this class. Despite papers by TC on liability during the last few years most insurers have taken no real action until this year to address the inadequacy of premium rates.
Whether or not we are right in suggesting the industry is under-reserved by as much as $1,000 m it is clear to us that the industry is substantially under-reserved. Even if it is only $500 m it should be enough to put a shiver through those insurers who write large amounts of this business. A figure of $1,000 m is 50% of claims reserves at December 1998 and it seems to us implausible for the industry to be under-reserved by such a large amount.
To say that public liability is in a crisis in Australia is an under statement. Premium rates need to increase very substantially. Our own experience on top of comments in the TC paper, suggest that moderate premium rate increases in the range of 20% to 40% are required for small business and in the order of 100% and more for larger corporate business.
For completeness we show the ratio of outstanding claims reserves to net written premium below for professional indemnity.

HIH Case Study on Prov�s�on�ng (Round 2)
�9
Figure 4.7. Professional Indemnity—Ratio of Outstanding Claims to Net Written Premiums
The above graph shows that net written premium for professional indemnity has increased substantially from about $200 m to $340 m in the last 7 years. It also shows the ratio of claims reserves to net written premium has reduced from around 2.6 to 2.4, ratios slightly below public liability. From our own experience we would have expected the ratio to be higher for professional indemnity than public liability. Again the 1998 Ord Minnett survey results show premium rates for professional indemnity have re-duced by 36% in the 4 years to 1998.
A straight calculation suggests that professional indemnity may be under-reserved by up to 75% but interpretation is more difficult due to:
• the substantial increase in premium income and probably exposure over the past 7 years;
• the more cyclical nature of professional indemnity’s claims experience than public liability; and
• the absence of studies on this class like that of TC for public liability.
Despite these reservations it seems highly likely that the industry is under-reserved but a ball park figure is difficult to estimate.
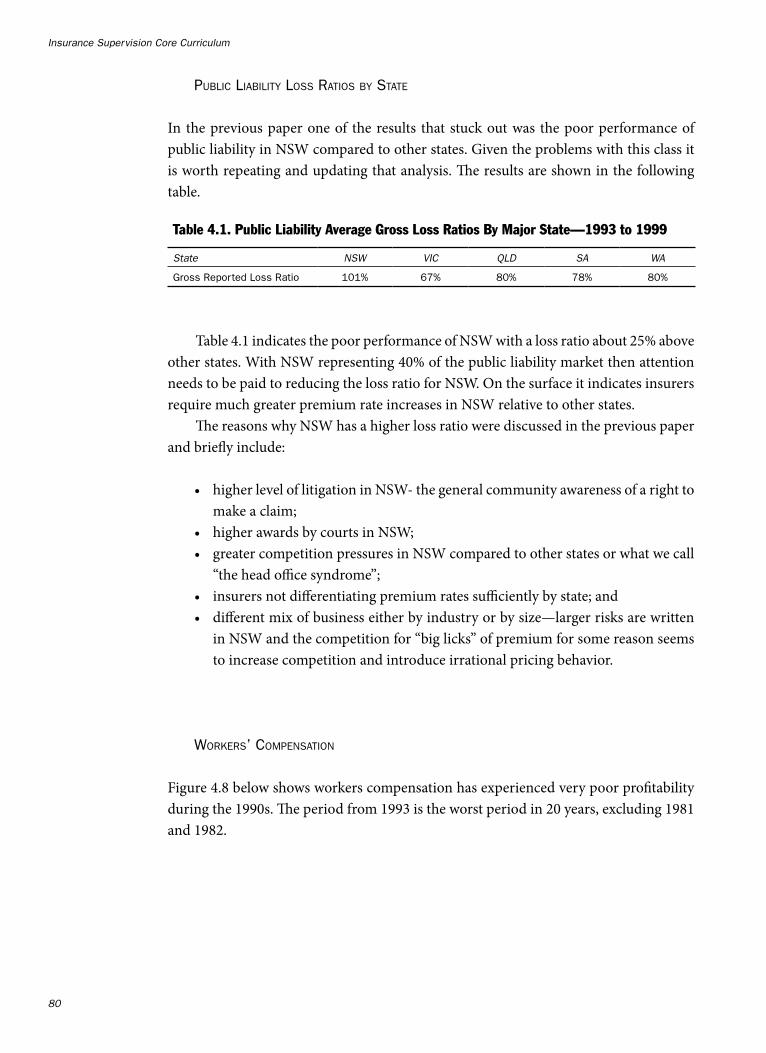
Insurance Superv�s�on Core Curr�culum
�0
public liability loSS ratioS by State
In the previous paper one of the results that stuck out was the poor performance of public liability in NSW compared to other states. Given the problems with this class it is worth repeating and updating that analysis. The results are shown in the following table.
Table 4.1 indicates the poor performance of NSW with a loss ratio about 25% above other states. With NSW representing 40% of the public liability market then attention needs to be paid to reducing the loss ratio for NSW. On the surface it indicates insurers require much greater premium rate increases in NSW relative to other states.
The reasons why NSW has a higher loss ratio were discussed in the previous paper and briefly include:
• higher level of litigation in NSW- the general community awareness of a right to make a claim;
• higher awards by courts in NSW; • greater competition pressures in NSW compared to other states or what we call
“the head office syndrome”; • insurers not differentiating premium rates sufficiently by state; and • different mix of business either by industry or by size—larger risks are written
in NSW and the competition for “big licks” of premium for some reason seems to increase competition and introduce irrational pricing behavior.
workerS’ compenSation
Figure 4.8 below shows workers compensation has experienced very poor profitability during the 1990s. The period from 1993 is the worst period in 20 years, excluding 1981 and 1982.
Table 4.1. Public Liability Average Gross Loss Ratios By Major State—1993 to 1999
State NSW VIC QLD SA WA
Gross Reported Loss Ratio 101% 67% 80% 78% 80%
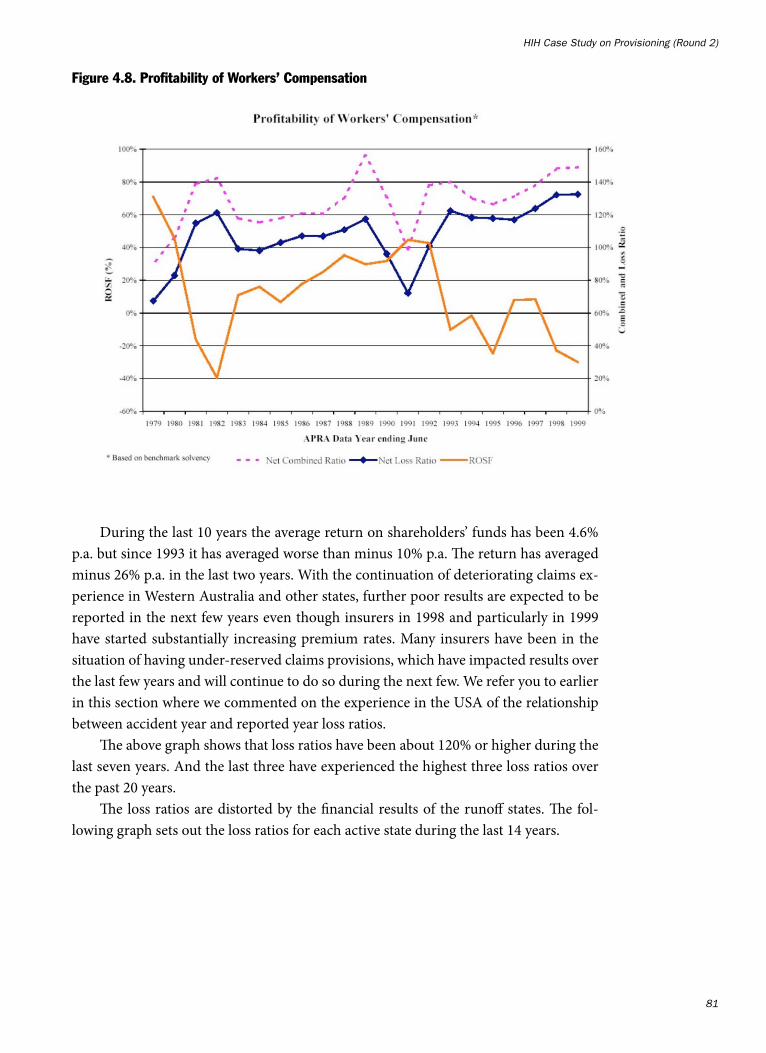
HIH Case Study on Prov�s�on�ng (Round 2)
��
Figure 4.8. Profitability of Workers’ Compensation
During the last 10 years the average return on shareholders’ funds has been 4.6% p.a. but since 1993 it has averaged worse than minus 10% p.a. The return has averaged minus 26% p.a. in the last two years. With the continuation of deteriorating claims ex-perience in Western Australia and other states, further poor results are expected to be reported in the next few years even though insurers in 1998 and particularly in 1999 have started substantially increasing premium rates. Many insurers have been in the situation of having under-reserved claims provisions, which have impacted results over the last few years and will continue to do so during the next few. We refer you to earlier in this section where we commented on the experience in the USA of the relationship between accident year and reported year loss ratios.
The above graph shows that loss ratios have been about 120% or higher during the last seven years. And the last three have experienced the highest three loss ratios over the past 20 years.
The loss ratios are distorted by the financial results of the runoff states. The fol-lowing graph sets out the loss ratios for each active state during the last 14 years.

Insurance Superv�s�on Core Curr�culum
�2
Figure 4.9. Workers Compensation Reported Loss Ratios by State
During the period shown in the graph, for Tasmania and ACT, insurers in just about every year would have lost money, except for one year in each state. In Tasmania the loss ratios during 1991 to 1998 averaged over 135%, a truly terrible result. The loss ratios in WA have been reasonable except for 1993 and the terrible results in the last three years. In the Northern Territory the results were quite profitable up to 1993 and since then have been very poor with loss ratios averaging nearly 120%.
It is clear from the above discussion that insurers have made, in relative terms, very large losses from workers compensation in the four active states during the 1990s. We can only look with intrigue towards the results that may emerge from privatization of NSW (if it does happen) and whether insurers have learnt any lessons from the poor results of the other states during the last 10 years. It would be a brave person who would suggest that insurers would be able to earn an acceptable return on capital from NSW workers compensation.
It is clear that insurers need to closely examine how they manage workers com-pensation, as they must change if they are to make an acceptable return on their invest-ment.
ctp
As reported in the last paper, CTP was the star performer of the industry from 1979 until 1994. Since the terrible results in NSW in 1995 and 1996 CTP has returned to profit with an average return on shareholders’ funds of 16% p.a. over the past three years

HIH Case Study on Prov�s�on�ng (Round 2)
�3
although the last two have only averaged 11% p.a. Hardly startling results, but reason-able. The graph below discloses the results.
Figure 4.10. Profitability of CTP
Section 6 — Conclusions and Recommendations
where to From here?
We have demonstrated poor profitability in casualty classes and some commercial classes and we have leveled serious accusations of under-reserving at the industry. The fact that some simple analysis can lead to such a startling conclusion should give us all cause for concern. With any luck, others will be able to demonstrate the error of our ways and “prove” that the industry is not in such a poor state as we suspect it might be, particularly in public liability. It raises questions about the roles that all sorts of experts play—actuaries, auditors, directors, managers, regulators, underwriters etc.
The point is that while reserving is important for profit declaration, it is even more important for future pricing. At financial year end, premium income is known, paid claims are known, investment income is known and directors and management will have some idea of the sort of profit and dividend they want to declare. The only thing left to adjust is the outstanding claims reserves. Actuaries became involved in general insurance because of this problem in declaring profits. We believe that it is time for the core actuarial focus to move on from reserving to pricing.

Insurance Superv�s�on Core Curr�culum
��
Even so, we still feel that there are substantial issues with regards the management of casualty and commercial classes that the industry faces. In this section we will out-line some alternatives that we believe can help the industry move forward on a sounder financial footing.
the antiDote to poor proFitability
In section 5 we talked about the implementation of the “Insurance Control Cycle”. We see this as the fundamental antidote to irrational pricing and underwriting. The key is to establish management by fact and this requires the establishment of data warehouse capabilities and investment in the systems and people with the necessary skills.
Ultimately our concern is that competition should be informed and management should be able to make decisions with their eyes open.
DiSSemination oF inFormation
One of the key problems for insurers is the lack of good industry information. We have already noted the reduction of statistics that APRA are now providing compared to several years ago. We also note, that several years ago there was a proposal to make data from the APRA forms publicly available (in a similar way as the Department of Trade and Industry does in the UK), nothing seems to have emerged yet. However, it now seems likely that something will come to light in the current review of solvency stan-dards, liability valuation standards and prudential supervisory requirements for general insurers that APRA have announced.
Even if more of this sort of information was available to actuaries, analysts and the like, it would still not be enough. This sort of information helps pose the questions, but it is not detailed enough to provide the answers.
Our experience in statutory classes, most recently with the problems that have emerged in WA workers compensation and the NSW Rating Bureau’s work in the bid to introduce private underwriting for workers compensation, lead us to believe that there is much to recommend the establishment of similar bureaus for all commercial classes.
It may be too much to suggest that such bodies would provide advisory premium rates for public liability and professional indemnity etc, but the collection and dissemi-nation of total market data is something that we feel is a worthwhile goal. We believe that the ISA database is a start, but it is of limited value for premium rating.
We restate our position that we are not advocating anti-competitiveness. We are advocating informed competition. We do not believe that the industry does itself any favors by espousing the illogical position of decreasing premium rates combined with improving loss ratios as the 1998 Ord Minnett survey indicates.

HIH Case Study on Prov�s�on�ng (Round 2)
��
A market is only as strong as its weakest link, as the example of NEM demon-strates—good quality information is the only defense against irrational pricing behavior. That is not to say that a competitor can’t enter a market and deliberately under-price to win market share. The point is that market participants need to make informed deci-sions about whether or not they want to follow. We believe that this is especially impor-tant in the casualty classes where, unless a long-term view is taken, financial disaster can be easily and quickly courted but only slowly recognized.
apra review
As mentioned above, the various APRA reviews are geared to building a better solvency framework. While this focuses primarily on valuation for liability estimation purposes, there is a proposal that APRA be empowered to require a Financial Status Report (FSR) from a general insurer that it considers to be “at risk”. On the face of it, the FSR seems in principle, to be very similar to a life insurance Financial Condition Report.
Notwithstanding the differences in life and general products and the different regu-latory regimes, the potential of this proposal is that it focuses management attention on the ongoing business and the need for appropriate reserving to be reflected in pricing.
Whether the proposal is ultimately accepted, or actuaries deemed to be the ap-propriate professionals to produce such reports, is largely irrelevant in our opinion. The importance is that it brings to the fore the need to maintain the discipline of the insur-ance control cycle.
In effect, introducing and maintaining the discipline of the insurance control cycle makes the need for a FSR redundant.


![HIH-4000 Series Humidity SensorsHIH-4000-004 Integrated circuit humidity sensor, 1,27 mm [0.050 in] lead pitch SIP, calibration and data printout HIH-4000-005 Equivalent to HIH-4000-001](https://static.documents.pub/doc/80x56/6109cbc1a9b5b535a6336a21/hih-4000-series-humidity-hih-4000-004-integrated-circuit-humidity-sensor-127-mm.jpg)


![Ch03 HIH [Street07]](https://static.documents.pub/doc/80x56/577ce50a1a28abf1038fb029/ch03-hih-street07.jpg)


