63
Roads ACT 11-Aug-2015 Hindmarsh Drive Intersection Upgrades Tuggeranong Parkway to Eggleston Crescent
| Date post: | 04-Aug-2016 |
| Category: |
Documents |
| Upload: | woden-valley-community-council |
| View: | 215 times |
| Download: | 2 times |

Roads ACT
11-Aug-2015
Hindmarsh Drive Intersection Upgrades
Tuggeranong Parkway to Eggleston Crescent

AECOM
Hindmarsh Drive Intersection Upgrades – Tuggeranong Parkway to Eggleston
Crescent
P:\CBR\60336615_Hindmarsh_Drive_Upgrade\8. Issued Docs\8.1 Reports\60336615_2.2 Hindmarsh Dr.docx Revision 4 – 11-Aug-2015 Prepared for – Roads ACT – ABN: 37 307 569 373
Hindmarsh Drive Intersection Upgrades
Tuggeranong Parkway to Eggleston Crescent
Client: Roads ACT
ABN: 37 307 569 373
Prepared by
AECOM Australia Pty Ltd
Level 2, 60 Marcus Clarke Street, Canberra ACT 2600, Australia
T +61 2 6201 3000 F +61 2 6201 3099 www.aecom.com
ABN 20 093 846 925
11-Aug-2015
Job No.: 6336615
AECOM in Australia and New Zealand is certified to the latest version of ISO9001, ISO14001, AS/NZS4801 and OHSAS18001.
© AECOM Australia Pty Ltd (AECOM). All rights reserved.
AECOM has prepared this document for the sole use of the Client and for a specific purpose, each as expressly stated in the document. No other
party should rely on this document without the prior written consent of AECOM. AECOM undertakes no duty, nor accepts any responsibility, to any
third party who may rely upon or use this document. This document has been prepared based on the Client’s description of its requirements and
AECOM’s experience, having regard to assumptions that AECOM can reasonably be expected to make in accordance with sound professional
principles. AECOM may also have relied upon information provided by the Client and other third parties to prepare this document, some of which
may not have been verified. Subject to the above conditions, this document may be transmitted, reproduced or disseminated only in its entirety.

AECOM
Hindmarsh Drive Intersection Upgrades – Tuggeranong Parkway to Eggleston
Crescent
P:\CBR\60336615_Hindmarsh_Drive_Upgrade\8. Issued Docs\8.1 Reports\60336615_2.2 Hindmarsh Dr.docx Revision 4 – 11-Aug-2015 Prepared for – Roads ACT – ABN: 37 307 569 373
Quality Information
Document Hindmarsh Drive Intersection Upgrades
Ref 6336615
Date 11-Aug-2015
Prepared by Neil Graham & Alek Aster-Stater
Reviewed by Neil Graham
Revision History
Revision Revision Date Details
Authorised
Name/Position Signature
1 18-Mar-2015 Draft Report Tom Brimson
Technical Director
2 12-May-2015 Draft Final Report Tom Brimson
Technical Director
3 26-Jun-2015 Amended Draft Final
Report
Tom Brimson
Technical Director
4 11-Aug-2015 Final Report Ralf Sieberer
Associate Director
AECOM
Hindmarsh Drive Intersection Upgrades – Tuggeranong Parkway to Eggleston
Crescent
P:\CBR\60336615_Hindmarsh_Drive_Upgrade\8. Issued Docs\8.1 Reports\60336615_2.2 Hindmarsh Dr.docx Revision 4 – 11-Aug-2015 Prepared for – Roads ACT – ABN: 37 307 569 373
Table of Contents
Executive Summary i 1.0 Introduction 1
1.1 Background 1 1.2 Key Objectives 1 1.3 Scope of Work 1
2.0 Study Area Characteristics 3 2.1 Road Hierarchy and Access 3
2.1.1 Background 3 2.1.2 Hindmarsh Drive 3 2.1.3 Tuggeranong Parkway 4 2.1.4 Eggleston Crescent 4 2.1.5 Launceston Street 4
2.2 Public Transport Services 4 2.3 Pedestrian and Bicycle Infrastructure 4 2.4 Other Activities & Services 5
3.0 Site Investigation 6 3.1 Hindmarsh Drive/Tuggeranong Parkway Eastern Ramp Intersection 6
3.1.1 Layout and Control 6 3.1.2 Field Observations 6 3.1.3 Traffic Volumes 7 3.1.4 Peak Hour Queues 8 3.1.5 Summary of Traffic Crashes 8
3.2 Hindmarsh Drive/Launceston Street Intersection 9 3.2.1 Layout and Control 9 3.2.2 Field Observations 9 3.2.3 Traffic Volumes 10 3.2.4 Peak Hour Queues 10 3.2.5 Summary of Traffic Crashes 10
3.3 Hindmarsh Drive/Eggleston Crescent Intersection 11 3.3.1 Layout and Control 11 3.3.2 Field Observations 11 3.3.3 Traffic Volumes 12 3.3.4 Peak Hour Queues 13 3.3.5 Summary of Traffic Crashes 13
4.0 Detailed Crash Analysis 15 4.1 Hindmarsh Drive/Tuggeranong Parkway Eastern Ramp Intersection 15
4.1.1 Crash Diagram 15 4.1.2 Crash Summary 16
4.2 Hindmarsh Drive/Launceston Street Intersection 16 4.2.1 Crash Diagram 16 4.2.2 Crash Summary 17
4.3 Hindmarsh Drive/Eggleston Crescent Intersection 17 4.3.1 Crash Diagram 17 4.3.2 Crash Summary 18
4.4 Crash Rates at Similar Ramp Intersections 18 5.0 Operational Analysis of Existing Conditions 21
5.1 Micro-simulation Model Data and Assumptions 21 5.1.1 Extent of model 21 5.1.2 Sources of data and assumptions 21 5.1.3 Network building 22 5.1.4 Temporal information 23
5.2 Base Case (Base Year) Calibration and Validation 23 5.2.1 Basis of calibration 23 5.2.2 Traffic volume calibration results 24 5.2.3 Queue length validation 24

AECOM
Hindmarsh Drive Intersection Upgrades – Tuggeranong Parkway to Eggleston
Crescent
P:\CBR\60336615_Hindmarsh_Drive_Upgrade\8. Issued Docs\8.1 Reports\60336615_2.2 Hindmarsh Dr.docx Revision 4 – 11-Aug-2015 Prepared for – Roads ACT – ABN: 37 307 569 373
5.2.4 Conclusion 24 5.3 Base Year Intersection Performance 25 5.4 Amount of travel 26
6.0 Treatment Options 27 6.1 Option 1 – Hindmarsh Drive / Tuggeranong Parkway Eastern Ramp Intersection 27
6.1.1 Option 1A 27 6.1.2 Option 1B 28 6.1.3 Option 1C 29
6.2 Option 2 – Hindmarsh Drive/Launceston Street Intersection 30 6.2.1 Option 2A 31
6.3 Option 3 –Hindmarsh Drive/Eggleston Crescent Intersection 32 6.3.1 Option 3A 32
7.0 Options Analysis 33 7.1 Short-listed Options 33 7.2 Expected Change in Network Performance 33
7.2.1 Intersection performance 33 7.2.2 Network performance 37 7.2.3 Expected Crash Reductions 38 7.2.4 Cost benefit appraisal 38
8.0 Impact on Bus Operations 42 9.0 Other Impacts 44 10.0 Staging of Works 45 11.0 Conclusions and Recommendations 46
Appendix A Crash Costs for the ACT A
Appendix B Paramics Model Calibration Data A
List of Tables
Table 1 Intersection performance analysis summary iii Table 2 Cost benefit appraisal results iv Table 3 Streets Being Studied 3 Table 4 Maximum Vehicular Queues per Lane – Hindmarsh Dr/ Tuggeranong Parkway Eastern
Ramp 8 Table 5 Summary of Crashes – Hindmarsh Dr/ Tuggeranong Parkway Eastern Ramp 8 Table 6 Maximum Vehicular Queues per Lane – Hindmarsh Dr/ Launceston St 10 Table 7 Summary of Crashes – Hindmarsh Dr/Launceston St 11 Table 8 Maximum Vehicular Queues per Lane – Hindmarsh Dr/ Eggleston Cres 13 Table 9 Summary of Crashes – Hindmarsh Dr/Eggleston Cres 14 Table 10 Major Crash Types – Hindmarsh Dr/Tuggeranong Parkway Eastern Ramp 16 Table 11 Major Crash Types – Hindmarsh Dr / Launceston St 17 Table 12 Major Crash Types – Hindmarsh Dr/Eggleston Cres 18 Table 13 Crash Statistics at Ramp Intersection Locations in ACT 19 Table 14 Crash Rates on Ramps in ACT 19 Table 15: SCATS Data 22 Table 16: Peak Hour Traffic Profiles 23 Table 17 2014 AM Intersection Delays and Level of Service by Approach – Average of 5 Seed
Runs 25 Table 18 2014 PM Intersection Delays and Level of Service by Approach – Average of 5 Seed
Runs 25 Table 19: Amount of peak hour travel in study area road network 26 Table 20 Estimated Percentage Reduction in crashes from Option 1A 28 Table 21 Estimated Percentage Reduction in crashes from Option 1B 29 Table 22 Estimated Percentage Reduction in crashes from Option 1C 29 Table 23 2031 AM Option 1A and 1B Intersection Delays and Level of Service by Approach 34 Table 24 2031 PM Option 1A and 1B Intersection Delays and Level of Service by Approach 34

AECOM
Hindmarsh Drive Intersection Upgrades – Tuggeranong Parkway to Eggleston
Crescent
P:\CBR\60336615_Hindmarsh_Drive_Upgrade\8. Issued Docs\8.1 Reports\60336615_2.2 Hindmarsh Dr.docx Revision 4 – 11-Aug-2015 Prepared for – Roads ACT – ABN: 37 307 569 373
Table 25 2031 AM Option 1C with 2A Intersection Delays and Level of Service by Approach 35 Table 26 2031 PM Option 1C with 2A Intersection Delays and Level of Service by Approach 36 Table 27 2031 AM Option 1C + 2A + 3A Intersection Delays and Level of Service by Approach 36 Table 28 2031 PM Option 1C + 2A + 3A Intersection Delays and Level of Service by Approach 37 Table 29 2031 Option 1C + 2A + 3A Delays and Level of Service - Staged or Full Pedestrian
Crossing 37 Table 30 Amount of peak hour travel in study area road network 38 Table 31 Summary of potential average crash reductions per annum 38 Table 32 Key CBA assumptions 39 Table 33 Incremental costs and benefits 40 Table 34 Sensitivity analyses for Option 1C 41 Table 35 2031 peak hour travel times for Dart and Scania buses 43 Table 36 Sensitivity analyses with potential savings in bus operations 43 Table 37 Crash Costs in the Australian Capital Territory 2 Table 38 Crash Cost by Severity in the Australian Capital Territory 2 Table 39 AM Peak hour turn flow calibration – Average of 5 Seed Runs a-1 Table 40 PM Peak hour turn flow calibration – Average of 5 Seed Runs a-2
List of Figures
Figure 1 ACT Road Hierarchy 3 Figure 2 ACTION Weekday Bus Service 4 Figure 3 Walking and Cycling Facilities 5 Figure 4 Hindmarsh Drive / Tuggeranong Pkwy Eastern Ramp Intersection 6 Figure 5 Peak Hour Counts at Hindmarsh Drive / Tuggeranong Pkwy Eastern Ramp Intersection 7 Figure 6 Peak Hour SCATS Counts at Hindmarsh Drive / Tuggeranong Pkwy Eastern Ramp
Intersection 8 Figure 7 Hindmarsh Drive / Launceston Street Intersection 9 Figure 8 Peak Hour Counts at Hindmarsh Drive / Launceston Street Intersection 10 Figure 9 Hindmarsh Drive / Eggleston Crescent Intersection 11 Figure 10 Peak Hour Counts at Hindmarsh Drive / Eggleston Crescent Intersection 13 Figure 11 Crash Diagram – Hindmarsh Dr/Tuggeranong Parkway Eastern Ramp 15 Figure 12 Crash Diagram – Hindmarsh Dr / Launceston St 16 Figure 13 Crash Diagram – Hindmarsh Dr/Eggleston Cres 17 Figure 14 Canberra Avenue Ramp Intersection with Monaro Highway 18 Figure 15 Belconnen Way Ramp Intersections with GDE 19 Figure 16: Extent of micro-simulation modelled road network 21 Figure 17: Zone Structure 22 Figure 18 Option 1A 27 Figure 19 Option 1B 28 Figure 20 Option 1C 30 Figure 21 Option 2A 31 Figure 22 Rerouting of bus routes 21 and 22 42

AECOM
Hindmarsh Drive Intersection Upgrades – Tuggeranong Parkway to Eggleston
Crescent
P:\CBR\60336615_Hindmarsh_Drive_Upgrade\8. Issued Docs\8.1 Reports\60336615_2.2 Hindmarsh Dr.docx Revision 4 – 11-Aug-2015 Prepared for – Roads ACT – ABN: 37 307 569 373
i
Executive Summary
Background
This investigation builds upon previous Black Spot Feasibility Studies by AECOM for the Hindmarsh Drive /
Launceston Street and Hindmarsh Drive / Eggleston Crescent intersections and extending this work to include the
Eastern Tuggeranong Parkway / Hindmarsh Drive ramp intersection. Traffic flows and peak congestion continues
to increase along Hindmarsh Drive as a result of the development of Molonglo, increasing delays and crash risks
for side-street traffic. This is further exacerbated by the three lanes of traffic in each direction, making it difficult for
vehicles to manoeuvre when crossing Hindmarsh Drive.
Delays and crash risks for traffic crossing Hindmarsh Drive between Launceston Street and Eggleston Crescent
has resulted in the rerouting of local bus routes 21 and 22. This has resulted in these buses using some local
streets in Chifley and Lyons and travelling longer distances than they would otherwise, as well as impacting the
general amenity of the local streets.
Site investigation
Site visits and video surveys in December 2014 provided important information for modelling and assessing the
subject section of Hindmarsh Drive. This included the collection of peak hour intersection turning movements and
queue lengths.
Key findings from these investigations were:
- Eastern Ramp intersection: A high volume of left-turning traffic from the ramp eastbound onto Hindmarsh
Drive in the AM peak (about 1,260 veh/h), with about 50% turning via the signals. The maximum queue
observed in the video survey was 140 m, which is much less than the length of the ramp (550 m) and is
likely to be typical of average weekday conditions. However, longer queues have been observed when there
is an incident or due to adverse weather or seasonal fluctuations. Queues occasionally stretch back towards
the freeway exit, affecting the deceleration of vehicles joining the queue on the ramp and potentially affecting
the operation of the freeway.
Many cars turning left from the slip lane were hesitant to turn into the kerbside lane when left turners were
turning via the nearby traffic signals. It follows that the signals are more efficient and safer in discharging the
left turn queues here.
- Launceston Street intersection: There is a low volume of right turners out of Launceston Street in the
morning peak (about 15 veh/h) and limited gaps across a relatively high speed three lanes of traffic. Queues
are relatively small here because of low volumes on Launceston Street, probably reflecting traffic taking
alternative routes via Devenport Street and Heysen Street.
- Eggleston Crescent intersection: There are relatively long queues here in the PM peak, especially for traffic
turning left out of Eggleston Crescent (98 m) and right in from Hindmarsh Drive West (63 m). There is a low
volume of right turners out here in peak periods (only 8 veh/h in the PM peak), probably reflecting traffic
taking alternative routes via local streets in Chifley to Melrose Drive.
Crash history
Recent crash data was obtained from Roads ACT for the five year period from January 2009 until December
2013. In summary, this showed:
- Eastern Ramp intersection: 213 crashes, 7 involving injury. 153 crashes occurred on the left-turn slip lane
and 35 crashes at other locations on the ramp (ie., 88% of all crashes at this intersection have occurred on
the ramp approach).
- Launceston Street intersection: 28 crashes, 2 involving injury. A high proportion of crashes involved traffic
turning right out of Launceston Street (50%), even though the volume of right turners is relatively low.
- Eggleston Crescent intersection: 37 crashes, 6 involving injury. The majority of crashes involved left turn
movements out of Eggleston Crescent (27% of total crashes) and opposing turn crashes involving right
turning traffic from Hindmarsh Drive into Eggleston Crescent (32% of total crashes).

AECOM
Hindmarsh Drive Intersection Upgrades – Tuggeranong Parkway to Eggleston
Crescent
P:\CBR\60336615_Hindmarsh_Drive_Upgrade\8. Issued Docs\8.1 Reports\60336615_2.2 Hindmarsh Dr.docx Revision 4 – 11-Aug-2015 Prepared for – Roads ACT – ABN: 37 307 569 373
ii
Options
A number of options were considered at each of the subject intersections, as follows:
- Eastern Ramp intersection: The options considered here involve closure or signalisation of the left-turn slip
lane and the creation of an additional signalised left-turn lane. They involve different lane arrangements on
approach to the signals. Three alternative lane arrangements were modelled.
- Launceston Street intersection:
Provision of traffic signals using the existing intersection configuration (Option 2A)
Signalise the intersection and create a fourth leg with McDonald Street
Provision of an acceleration lane for right turns from Launceston Street onto Hindmarsh Drive
Ban right turns out of Launceston Street and enable U-turns at Eggleston Crescent
Reducing Hindmarsh Drive to two lanes at Launceston Street and Eggleston Crescent
Of these options, only Option 2A was taken forward for more detailed analysis. The other options were
rejected based on traffic safety, capacity or amenity reasons.
- Eggleston Crescent intersection:
Provision of traffic signals using the existing intersection configuration (Option 3A)
Closure of median if McDonald Street is connected to Hindmarsh Drive
Provision of an acceleration lane for right turns from Eggleston Crescent onto Hindmarsh Drive
Reducing Hindmarsh Drive to two lanes at Launceston Street and Eggleston Crescent
Of these options, only Option 3A was taken forward for more detailed analysis. The other options were
rejected based on traffic safety, capacity or amenity reasons.
Traffic modelling
A Paramics micro-simulation traffic model was created as part of this project to assist in the assessment of road
improvement options. Observed counts were compared with modelled turning movements within the modelled
network. For both the AM and PM peak models, a total of 100% of the modelled links achieved a GEH 1 value
under 5.0 with all turns under a GEH value of 10, thereby satisfying the link flow calibration criteria.
A summary of the outcomes of the intersection level of service analysis from the Paramics modelling are given in
Table 1. Overall, all options show satisfactory intersection operation for intersections as a whole, with relatively
minor changes in delays. Option 1C was shown to be the preferred option at the Eastern Ramp; this incorporates
a separate lane and phasing for left and right turns from the ramp.
1 The GEH Statistic is a formula used in traffic modelling to compare two sets of traffic volumes (traffic volumes derived from the
simulation (for the "base year, base case" scenario) with the real-world traffic volumes). Using the GEH Statistic avoids errors
that occur when using simple percentages to compare two sets of volumes since traffic volumes vary over a wide range. The
use of GEH as an acceptance criterion for travel demand forecasting models is recognised in the UK Highways Agency's Design
Manual for Roads & Bridges (DMRB), Volume 12, Section 2, as well as other references.
With micro-simulation modelling of base case scenarios, a GEH of less than 5.0 is considered a good match between the
modelled and observed volumes. The GEH Statistic is calculated by the following formula:
ObservedModelled
ObservedModelledGEH
22
According to DMRB, 85% of the volumes in a traffic model should have a GEH less than 5.0. GEHs in the range of 5.0 to 10.0
may warrant further calibrating of the model. If the GEH is greater than 10.0, there is a high probability that there is a problem
with either the travel demand model or the data.

AECOM
Hindmarsh Drive Intersection Upgrades – Tuggeranong Parkway to Eggleston
Crescent
P:\CBR\60336615_Hindmarsh_Drive_Upgrade\8. Issued Docs\8.1 Reports\60336615_2.2 Hindmarsh Dr.docx Revision 4 – 11-Aug-2015 Prepared for – Roads ACT – ABN: 37 307 569 373
iii
Table 1 Intersection performance analysis summary
Option
AM Peak Hour PM Peak Hour
Eastern
Ramp
Launces-
ton Street
Eggleston
Crescent
Eastern
Ramp
Launces-
ton Street
Eggleston
Crescent
2014 Existing B (17.5 s) A (13.1 s) A (5.7 s) B (24.5 s) A (9.1 s) B (26.1 s)
2031 Do nothing B (16.8 s) A (12.4 s) A (6.6 s) B (25.1 s) A (13.3 s) D (47.8 s)
2031 Option 1A B (19.0 s) B (14.3 s) A (6.8 s) C (30.9 s) A (11.7 s) D (45.2 s)
2031 Option 1B B (17.5 s) A (12.2 s) A (6.7 s) C (30.0 s) A (9.2 s) D (43.7 s)
2031 Option 1C B (16.1s) A (11.2s) A (6.6s) B (24.7s) A (12.0s) D (46.5s)
2031 Option 1C + 2A B (17.1 s) C (28.7 s) A (7.5 s) B (26.6 s) D (43.3 s) D (50.9 s)
2031 Option 1C + 3A B (22.4s) A (11.7s) C (37.3s) B (24.1s) A (9.2s) E (67.5s)
2031 Option 1C + 2A + 3A B (22.4s) C (29.5s) D (43.9s) B (25.7s) C (34.1s) C (36.9s)
The highlights from a more detailed examination of the results of the modelling are:
- Eastern Ramp intersection: Option 1C was shown to be the preferred option at the Eastern Ramp. This
incorporates a separate lane and phasing for left and right turns from the ramp, thus enabling greater
flexibility of phasing in the PM peak.
- Launceston Street intersection: The signalisation of this intersection would result in increased delays to
Hindmarsh Drive traffic. Importantly, there would be a noticeable reduction in delays to right turners in the
AM peak, for the existing control at Launceston Street, due to more gaps with signalisation of the left turns at
the Eastern Ramp.
- Eggleston Crescent intersection: There would be increased delays to Hindmarsh Drive traffic with signals
here.
- The signalisation of the Ramp intersection will provide most benefits.
A further (PM peak) test was undertaken with provision for a full pedestrian crossing of Hindmarsh Drive at the
Eggleston Street intersection. The results of this test showed that the intersection would not be able to operate
satisfactorily with a full crossing, so a staged crossing would need to be adopted at any new signalised
intersections along the subject section of Hindmarsh Drive.
Potential crash reduction
Potential crash reduction and savings in crash costs are key considerations in the analysis of options. Highlights
from this analysis are:
- Eastern Ramp intersection (signalisation): A review of the crash history and site observations here and at
other similar ramp locations elsewhere suggests that signalisation is likely to cause a significant reduction in
rear end crashes at this site. At Hindmarsh Drive, the other signalised approaches show much less rear-end
crashes (93% of rear-end crashes are associated with the left turns on the ramp); the majority of rear-end
crashes on the ramp are due to uncertainties associated with vehicles turning left via the slip lane. Other
signalised ramp sites at GDE / Belconnen Way and Monaro Highway / Canberra Avenue also showed a low
incidence of crashes, implying a potential crash reduction of 98% at the Hindmarsh Drive Ramp. Hence, the
signalisation of the southbound left turns here is likely to lead to a substantial reduction in rear-end crashes
on the ramp; a reduction of 90% has been assumed.
- Launceston Street intersection (signalisation): The reduction in adjacent approach and opposing turn
crashes due to the potential implementation of traffic signals here is likely to be offset by an increase in rear-
end crashes on Hindmarsh Drive.
- Eggleston Crescent intersection (signalisation): The reduction in adjacent approach and opposing turn
crashes due to the potential implementation of traffic signals here is likely to be offset by an increase in rear-
end crashes on Hindmarsh Drive.

AECOM
Hindmarsh Drive Intersection Upgrades – Tuggeranong Parkway to Eggleston
Crescent
P:\CBR\60336615_Hindmarsh_Drive_Upgrade\8. Issued Docs\8.1 Reports\60336615_2.2 Hindmarsh Dr.docx Revision 4 – 11-Aug-2015 Prepared for – Roads ACT – ABN: 37 307 569 373
iv
Cost benefit appraisal
The results of the economic appraisal is summarised in Table 2. The overall outcome shows that Option 1C is
preferable to Option 1A or 1B at the Eastern Ramp intersection. The combination options tested showed that they
could generate a positive economic return, largely driven by crash savings, but also some savings in bus
operating costs by enabling rerouting of bus routes 21 and 22. Increased delays to Hindmarsh Drive traffic as a
result of new traffic signals offsets the potential crash savings.
Table 2 Cost benefit appraisal results
Option NPV ($ 000) NPVI BCR
1A 2,199 6.0 6.7
1B 4,437 11.4 11.9
1C 6,002 14.7 15.1
1C + 2A 4,861 7.0 7.7
1C +2A + 3A 3,819 3.9 4.8
Impact on bus operations
Delays and crash risks for traffic crossing Hindmarsh Drive between Launceston Street and Eggleston Crescent
has resulted in the rerouting of local bus routes 21 and 22. This has resulted in these buses using some local
streets in Chifley and Lyons (Plunkett Street, Maclaurin Crescent and Burnie Street) and travelling longer
distances than they would otherwise, as well as impacting the general amenity of the local streets.
The rerouting of local buses as a result of concerns with delays and crash risks crossing Hindmarsh Drive has
resulted in Route 21 buses travelling an additional 2.2 km and Route 22 buses 1.9 km. There are a total of 46
buses per weekday using routes 21 and 22.
The re-routing of these buses via Hindmarsh Drive could save about $300,000 per year in bus operating costs
and travel time savings in the short-term and greater savings over time. It would also reduce bus travel on local
streets and impacts on local amenity (especially noise). There may also be some additional benefits from
increased patronage due to reduced travel times and greater convenience for bus passengers.
Other impacts
The economic appraisal does not account for additional benefits due to a local redistribution of traffic that will
occur with new signals at Launceston Street and Eggleston Crescent. There is a range of other non-quantifiable
or difficult to quantify benefits, including increased bus patronage and revenue, reduced impacts on local
residential streets, increased accessibility for residents of Lyons and Chifley and greater commercial activity at
Weston Town Centre. These impacts are not insignificant in an economic and social sense.
Recommendations
It is recommended that all three sets of signal improvements should be constructed concurrently under one
contract, as this would provide most benefits and would avoid multiple disruptions to Hindmarsh Drive traffic. The
total cost of these works is about $1.2M. The cost of signalising the intersections of Launceston Street and
Eggleston Crescent is about $0.35M, and modifications to the Ramp intersection about $0.5M. It is recommended
that more detailed design work be undertaken to better refine these cost estimates and to prepare designs
suitable for early implementation of these works.
An economic appraisal of short-listed improvement options indicated that the signalisation of left turns at the
Eastern Ramp intersection is most strongly justified from an economic perspective. The preferred option at the
ramp intersection is illustrated in Figure 1.

AECOM
Hindmarsh Drive Intersection Upgrades – Tuggeranong Parkway to Eggleston
Crescent
P:\CBR\60336615_Hindmarsh_Drive_Upgrade\8. Issued Docs\8.1 Reports\60336615_2.2 Hindmarsh Dr.docx Revision 4 – 11-Aug-2015 Prepared for – Roads ACT – ABN: 37 307 569 373
v
Figure 1 Preferred Ramp Intersection Improvement Option
Option 1C4

AECOM
Hindmarsh Drive Intersection Upgrades – Tuggeranong Parkway to Eggleston
Crescent
P:\CBR\60336615_Hindmarsh_Drive_Upgrade\8. Issued Docs\8.1 Reports\60336615_2.2 Hindmarsh Dr.docx Revision 4 – 11-Aug-2015 Prepared for – Roads ACT – ABN: 37 307 569 373
1
1.0 Introduction
1.1 Background
This investigation includes updating and expanding upon the previous Black Spot Feasibility Studies prepared by
AECOM for the Hindmarsh Drive/Launceston Street and Hindmarsh Drive/Eggleston Crescent intersections and
extending this work to include the Tuggeranong Parkway/Hindmarsh Drive intersection off-ramp. The volume of
traffic and levels of congestion during peak periods has continued to increase along Hindmarsh Drive since the
previous reports were completed and this is further exacerbated by the three lanes of traffic in each direction
which makes it difficult for vehicles to manoeuvre when crossing at these locations. The Feasibility Study is to
address the current and projected use of the intersections up to the year 2031.
1.2 Key Objectives
The ACT Road Safety Strategy for 2011 – 2020 aims to meet a national goal of at least a 30% reduction in
fatalities and serious injuries by 2020. Providing safe roads is one component of an integrated approach to meet
this goal.
Providing a safe road environment for the Territory is a primary objective for this study. The study provides Roads
ACT with a range of cost effective and safe upgrade options in line with the project objectives which will allow for
informed recommendations to be made.
The aim of the project is to:
- Identify the contributory factors associated with crashes at the site
- Identify any features seen during site inspections, which may adversely contribute to crashes at this location
- Develop potential remedial measures
- Evaluate the effectiveness of these remedial measures
- Select and recommend the most appropriate measure(s)
- Increasing safety for all users at the three intersections
- Improving the level of service to an appropriate level as defined in Roads ACT Strategic Asset Management
Plan
- Enabling public transport services to safely re-route through two of these intersections (i.e. Launceston
Street and Eggleston Crescent) and to remove the current diversion through residential roads
- Providing safe pedestrian and cycle access through the intersections.
1.3 Scope of Work
The key elements of work for this study include:
- Data capture of traffic volumes, patterns and usage, and current crash data at the three intersections. This
includes the preparation/update of a collision diagram for each intersection and documentation of key
characteristics including geometry, surrounding land uses, traffic volumes, classification, speeds,
pedestrians, cyclists and public transport provision.
- Undertake an AM/PM peak traffic volume and video survey of the intersections, noting any obvious
deficiencies in the system.
- Updating the micro-simulation model from the previous Feasibility Studies for the expanded area and
document the impact that changes to the intersections will have on current and future traffic conditions up to
2031.

AECOM
Hindmarsh Drive Intersection Upgrades – Tuggeranong Parkway to Eggleston
Crescent
P:\CBR\60336615_Hindmarsh_Drive_Upgrade\8. Issued Docs\8.1 Reports\60336615_2.2 Hindmarsh Dr.docx Revision 4 – 11-Aug-2015 Prepared for – Roads ACT – ABN: 37 307 569 373
2
- Identify any constraints, services, utilities or issues associated with each intersection; including road
boundaries, heritage values, significant plants and animals, and any protected trees.
- Identify possible solutions to upgrade the intersections, with particular focus on improving safety and
capacity for all users for the subject section of Hindmarsh Drive.
- Identify approximate construction and management costs associated with each solution.
- Undertake an economic evaluation (Benefit/Cost Analysis) of the short-listed improvement strategies for the
subject section of Hindmarsh Drive based on Austroads procedures.
- Prepare a Feasibility Report outlining the key findings of the study. Initial drafts will be prepared for review by
Roads ACT, and will then be finalised by incorporating any comments from the draft report.
The work is undertaken in accordance with the current TAMS Design Standards, Australian Standards, the
Austroads Guides to Traffic Management and Road Safety, RTA Road Design Guide and other relevant
standards that represent best practice, new technologies, or innovation.

AECOM
Hindmarsh Drive Intersection Upgrades – Tuggeranong Parkway to Eggleston
Crescent
P:\CBR\60336615_Hindmarsh_Drive_Upgrade\8. Issued Docs\8.1 Reports\60336615_2.2 Hindmarsh Dr.docx Revision 4 – 11-Aug-2015 Prepared for – Roads ACT – ABN: 37 307 569 373
3
2.0 Study Area Characteristics
2.1 Road Hierarchy and Access
2.1.1 Background
A hierarchy of transport facilities is necessary for the safe and efficient movement of persons and goods through
the transport system. The current ACT Road Hierarchy2 describes the four types of roads – arterial roads, major
collector roads, minor collector roads and access streets.
The hierarchy of roads in the study area is shown in Figure 2. A summary of the classification and posted speed
limit for each street being studied is given in Table 3.
Figure 2 ACT Road Hierarchy
Source: Roads ACT 2011
Table 3 Streets Being Studied
Street Classification Speed limit
Hindmarsh Drive Arterial 80 km/h
Tuggeranong Parkway Arterial 100 km/h
Tuggeranong Parkway Ramp Arterial 80 km/h
Launceston Street Major Collector 60 km/h
Eggleston Crescent Major Collector 60 km/h
2.1.2 Hindmarsh Drive
Hindmarsh Drive is an arterial road running east-west across the southern suburbs of the ACT. It connects
Weston Creek to the Woden Valley, Narrabundah and Fyshwick. Hindmarsh Drive has a 6 lane divided
carriageway through the study area. The pavement width is about 11 m on each carriageway and the median
varies in width from about 5 m near Tuggeranong Parkway to 10 m just east of Eggleston Crescent.
2 Sources: ACT Roads Hierarchy, http://www.justice.act.gov.au/page/view/3063/title/act-road-hierarchy;
ACT Residential Development Subdivision Code, http://www.legislation.act.gov.au/ni/2008-27/copy/66235/pdf/2008-27.pdf

AECOM
Hindmarsh Drive Intersection Upgrades – Tuggeranong Parkway to Eggleston
Crescent
P:\CBR\60336615_Hindmarsh_Drive_Upgrade\8. Issued Docs\8.1 Reports\60336615_2.2 Hindmarsh Dr.docx Revision 4 – 11-Aug-2015 Prepared for – Roads ACT – ABN: 37 307 569 373
4
2.1.3 Tuggeranong Parkway
Tuggeranong Parkway is an arterial road running south-north across the ACT. It connects South Canberra to
North Canberra then continuing onto Caswell Drive, Parkes Way and William Hovell Drive. Tuggeranong Parkway
is a 4 lane divided carriage way. It is 2 lane, single direction at its off ramp to Hindmarsh Drive. The pavement
width on the ramp prior to the intersection with Hindmarsh Drive is about 8 m.
The southbound off-ramp widens from one lane to two lanes about 220m south of the start of the ramp. The
speed limit is reduces to 80 km/h on the ramp.
2.1.4 Eggleston Crescent
Eggleston Crescent is a major collector road in Chifley connecting Hindmarsh Drive to Melrose Drive south. It is a
two lane undivided road. Prior to its intersection with Hindmarsh Drive the pavement width is about 12 m.
2.1.5 Launceston Street
Launceston Street is a major collector road in Lyons connecting Hindmarsh Drive to Melrose Drive north. It is a
two lane undivided road. Prior to its intersection with Hindmarsh Drive the pavement width is about 10 m.
2.2 Public Transport Services
Many Action weekday bus services travel through the subject Hindmarsh Drive intersections on route to and from
the Woden Bus Interchange. Hindmarsh Drive carries routes 21, 22, 25, 26, 27, 60, 62, 160, 162 and Xpresso 749
(Figure 3). There are no bus stops located within the study area along Hindmarsh Drive. The nearest bus stops
are located on Launceston Street approximately 100 m north of Hindmarsh Drive and another on Eggleston
Crescent about 270 m south of Hindmarsh Drive.
Figure 3 ACTION Weekday Bus Service
Source: Roads Action Buses, August 2015 (http://www.action.act.gov.au/rider_Info/maps)
2.3 Pedestrian and Bicycle Infrastructure
On street cycle lanes and a shared use path are provided on Hindmarsh Drive. Footpaths are provided on both
Hindmarsh Drive, Launceston Street and Eggleston Crescent as shown in Figure 4.

AECOM
Hindmarsh Drive Intersection Upgrades – Tuggeranong Parkway to Eggleston
Crescent
P:\CBR\60336615_Hindmarsh_Drive_Upgrade\8. Issued Docs\8.1 Reports\60336615_2.2 Hindmarsh Dr.docx Revision 4 – 11-Aug-2015 Prepared for – Roads ACT – ABN: 37 307 569 373
5
Figure 4 Walking and Cycling Facilities
Legend: On road Cycle Lane, Shared Path, Foot path
Source: ACT Walking and Cycling Map 2011
2.4 Other Activities & Services
Chifley and Lyons each have a local shopping hub
- Chifley shops
- Lyons shops
Chifley and Lyons contain 4 education facilities:
- Lyons Early Childhood School – Ulverstone Street Campus
- Lyons Early Childhood School After School Care – WCS
- Lyons Early Childhood School
- Chifley Preschool
Chifley and Lyons have 5 churches:
- Immanuel Woden Valley Lutheran Church
- Lyons Church of Christ
- Canberra Aboriginal Church
- St Alban The Matyr
- United Pentecostal Church Calvary Chapel
Other community facilities in Chifley and Lyons:
- Lyons Oval
- United Nations High Commissioner for Refugees
- Oakey Hill Group Scout/Guide Hall

AECOM
Hindmarsh Drive Intersection Upgrades – Tuggeranong Parkway to Eggleston
Crescent
P:\CBR\60336615_Hindmarsh_Drive_Upgrade\8. Issued Docs\8.1 Reports\60336615_2.2 Hindmarsh Dr.docx Revision 4 – 11-Aug-2015 Prepared for – Roads ACT – ABN: 37 307 569 373
6
3.0 Site Investigation
3.1 Hindmarsh Drive/Tuggeranong Parkway Eastern Ramp Intersection
3.1.1 Layout and Control
The intersection of Tuggeranong Parkway Eastern Ramp and Hindmarsh drive is controlled with a traffic light and
a left turn slip lane giving Hindmarsh Drive east/west the priority. The traffic light allows traffic to flow right to
Hindmarsh Drive west, straight ahead back onto the Tuggeranong Parkway or left into the second lane heading
east on Hindmarsh Drive shown in Figure 5.
Figure 5 Hindmarsh Drive / Tuggeranong Pkwy Eastern Ramp Intersection
Source: ACTMAPi - ACT Government online interactive maps 2014
3.1.2 Field Observations
This site was inspected during the AM peak on Tuesday 3 February 2015. The primary observations from this
inspection were:
- About 50% of left-turners from the ramp turned via the slip lane and 50% via the traffic signals.
- Many cars turning left from the slip lane were hesitant to turn into the kerbside lane when left turners were
turning via the nearby traffic signals, even though only 0.5% of left turners using the traffic signals turned into
the kerbside lane. It follows that the signals are more efficient and safer in discharging the left turn queues
here.

AECOM
Hindmarsh Drive Intersection Upgrades – Tuggeranong Parkway to Eggleston
Crescent
P:\CBR\60336615_Hindmarsh_Drive_Upgrade\8. Issued Docs\8.1 Reports\60336615_2.2 Hindmarsh Dr.docx Revision 4 – 11-Aug-2015 Prepared for – Roads ACT – ABN: 37 307 569 373
7
- There were long queues on the ramp for a short period when traffic on Hindmarsh Drive banked back from
downstream intersections.
- Most (98%) of right turners from the ramp turned from the right only lane, rather than the shared turn lane,
largely because of the large volume of left-turners in the shared lane in the AM peak. In the PM, there is a
more even mix of lane utilisation by right turners from the ramp.
- The majority of eastbound through traffic on Hindmarsh Drive utilised the kerbside lane (38%) and a lesser
amount used the other two lanes (31% in each). This had a marginal effect on the ability of left turners to find
a gap in exiting the slip lane.
3.1.3 Traffic Volumes
Peak hour intersection turning counts were undertaken via video survey method here on Wednesday 10
December 2014. The results of the surveys at this intersection are summarised in Figure 6. It shows a high
volume of left turning traffic from the freeway ramp in the AM peak (1,264 veh/h), opposed by high volumes of
traffic on Hindmarsh Drive (about 800 veh/h/lane, or one vehicle every 4 or 5 seconds in each lane).
Figure 6 Peak Hour Counts at Hindmarsh Drive / Tuggeranong Pkwy Eastern Ramp Intersection
Source: BVY Traffic Survey, 10 December 2014
Roads ACT also provided SCATS count data for a typical weekday at this site for 11 recent months, excluding
September 2014. A plot of AM and PM peak hour flows over this period is given in Figure 7. It shows that counts
done in December at this site are fairly typical of flows throughout the year; ignoring the drops evident in January
and April. If anything, the PM peak flows can be a little higher at this time of year. It follows that it is reasonable to
adopt the results of the December 2014 video surveys for the assessment of improvement options.
Tuggeranong Pkwy Eastern Off Ramp
North
00
25280
23
6471264
Hin
dm
ars
h D
rive
0 0
0 0
25
74
11
32
34
5
97H
ind
mars
h D
riv
e
11
73
84
78
7
22
17
00
Tuggeranong Pkwy Off Ramp
0
0
0
0
0
0
0
0
AM Peak 8:00 AM-9:00 AM
PM Peak 5:00 PM-6:00 PM

AECOM
Hindmarsh Drive Intersection Upgrades – Tuggeranong Parkway to Eggleston
Crescent
P:\CBR\60336615_Hindmarsh_Drive_Upgrade\8. Issued Docs\8.1 Reports\60336615_2.2 Hindmarsh Dr.docx Revision 4 – 11-Aug-2015 Prepared for – Roads ACT – ABN: 37 307 569 373
8
Figure 7 Peak Hour SCATS Counts at Hindmarsh Drive / Tuggeranong Pkwy Eastern Ramp Intersection
Source: SCATS data, December 2013 to November 2014
3.1.4 Peak Hour Queues
The BVY Traffic survey also collected peak hour queue lengths on all approaches to this intersection. These are
summarised in Table 4 and were used in calibrating the micro-simulation model.
Table 4 Maximum Vehicular Queues per Lane – Hindmarsh Dr/ Tuggeranong Parkway Eastern Ramp
Approach AM PM
Hindmarsh Drive East 14 (98 m) 45 (315 m)
Tuggeranong Parkway Ramp 20 (140 m) 6 (42 m)
Hindmarsh Drive West 17 (119 m) 9 (63 m)
3.1.5 Summary of Traffic Crashes
Roads ACT records from January 2009 to December 2013 indicate that 213 crashes occurred at the intersection
of Hindmarsh Drive and the Tuggeranong Parkway East ramp. Of these crashes, 7 were injury crashes and the
rest were property damage only crashes as shown in Table 5.
Table 5 Summary of Crashes – Hindmarsh Dr/ Tuggeranong Parkway Eastern Ramp
Severity 2009 2010 2011 2012 2013 Total
Fatal 0 0 0 0 0 0
Admitted to Hospital 0 0 1 0 0 1
Received Medical Treatment 1 0 1 2 2 6
Property Damage Only 29 29 42 54 52 206
Total 30 29 44 56 54 213
0
500
1000
1500
2000
2500
3000
3500
Dec-13 Jan-14 Feb-14 Mar-14 Apr-14 May-14 Jun-14 Jul-14 Aug-14 Sep-14 Oct-14 Nov-14
Site 47 AM Site 47 PM

AECOM
Hindmarsh Drive Intersection Upgrades – Tuggeranong Parkway to Eggleston
Crescent
P:\CBR\60336615_Hindmarsh_Drive_Upgrade\8. Issued Docs\8.1 Reports\60336615_2.2 Hindmarsh Dr.docx Revision 4 – 11-Aug-2015 Prepared for – Roads ACT – ABN: 37 307 569 373
9
3.2 Hindmarsh Drive/Launceston Street Intersection
3.2.1 Layout and Control
The intersection of Hindmarsh Drive and Launceston Street is priority controlled with a Stop sign on Launceston
Street. Both right and left turns out of Launceston Street have dedicated lanes in Launceston Street, but not in
Hindmarsh Drive. Slip lanes are provided for left turns as shown in Figure 8.
Figure 8 Hindmarsh Drive / Launceston Street Intersection
Source: ACTMAPi - ACT Government online interactive maps 2014
3.2.2 Field Observations
A day time inspection was undertaken on Friday 3rd
June 2011 at 2:30pm. The following observations were noted:
- Sight distance is within Austroads guidelines at the intersection; however it seems that drivers turning right
out of Launceston Street have trouble selecting a safe gap, possibly due to the difficulty of judging the
movement of vehicles travelling at relatively high speeds in three lanes on Hindmarsh Drive.
- Right turn movements out of Launceston Street don’t have a dedicated acceleration lane on Hindmarsh
Drive; this may result in frustration and taking unsafe gaps particularly in peak hours.
- There are missing connecting footpaths on either side of Launceston Street.
- Pavement has deteriorated at Launceston Street particularly on the left turn lane into Hindmarsh Drive.
- The relatively straight alignment and pavement width of Hindmarsh Drive tends to invite a higher operational
speed than the posted 80 km/h.
AECOM
Hindmarsh Drive Intersection Upgrades – Tuggeranong Parkway to Eggleston
Crescent
P:\CBR\60336615_Hindmarsh_Drive_Upgrade\8. Issued Docs\8.1 Reports\60336615_2.2 Hindmarsh Dr.docx Revision 4 – 11-Aug-2015 Prepared for – Roads ACT – ABN: 37 307 569 373
10
3.2.3 Traffic Volumes
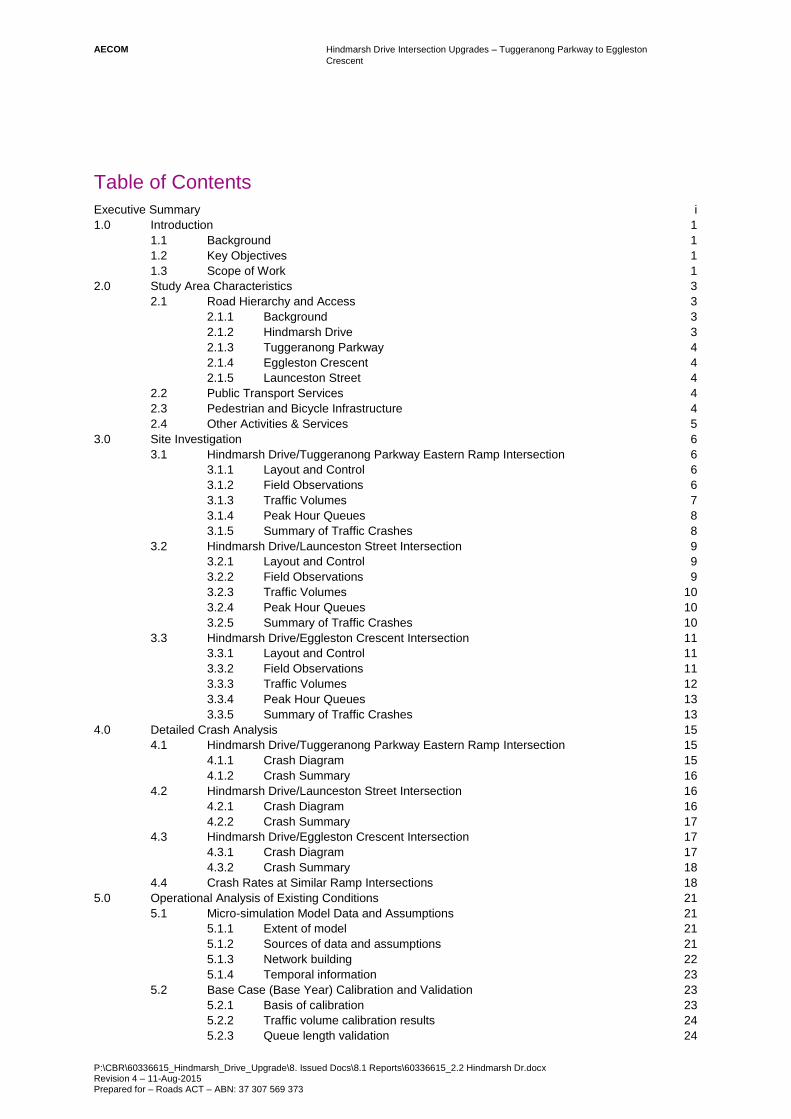
Peak hour intersection turning counts were undertaken via video survey method here on Wednesday 10
December 2014. The results of the surveys at this intersection are summarised in Figure 9. It shows relatively low
turning volumes out of Launceston Street, possibly reflecting the difficulties turning here in peak periods. The
volume of right turners increases in the PM peak, but queues remain manageable (see Section 3.2.4).
Figure 9 Peak Hour Counts at Hindmarsh Drive / Launceston Street Intersection
Source: BVY Traffic Survey, 10 December 2014
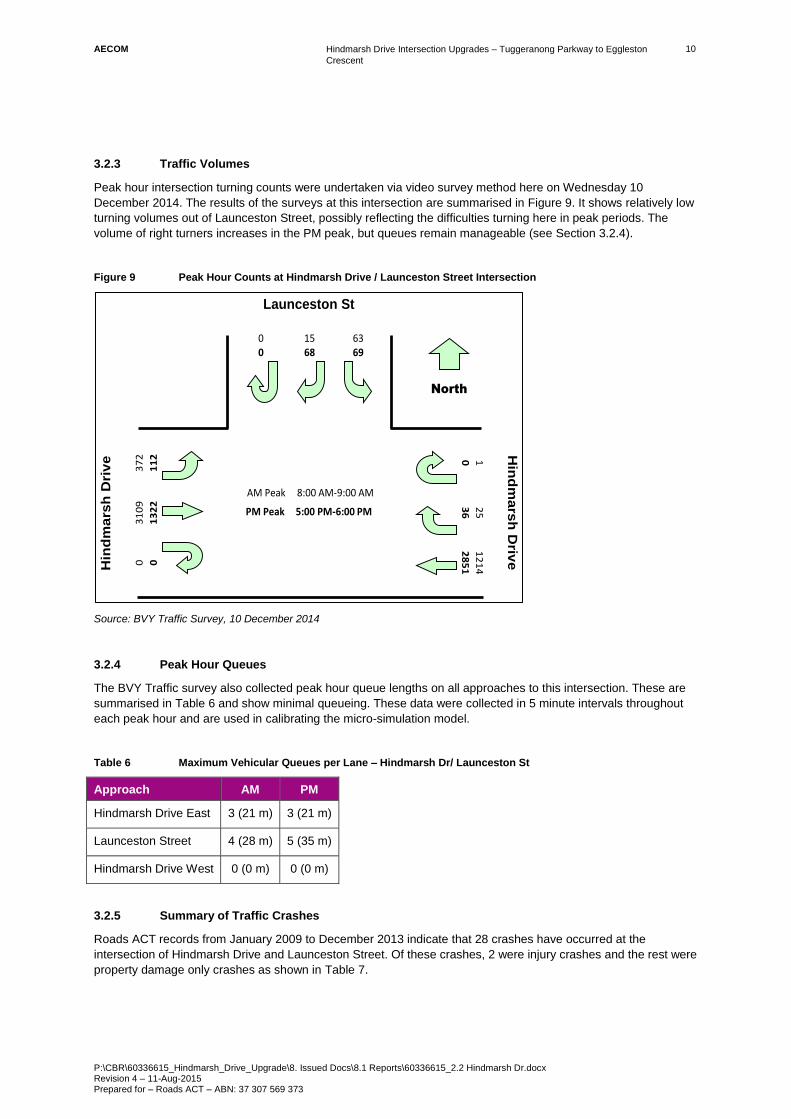
3.2.4 Peak Hour Queues
The BVY Traffic survey also collected peak hour queue lengths on all approaches to this intersection. These are
summarised in Table 6 and show minimal queueing. These data were collected in 5 minute intervals throughout
each peak hour and are used in calibrating the micro-simulation model.
Table 6 Maximum Vehicular Queues per Lane – Hindmarsh Dr/ Launceston St
Approach AM PM
Hindmarsh Drive East 3 (21 m) 3 (21 m)
Launceston Street 4 (28 m) 5 (35 m)
Hindmarsh Drive West 0 (0 m) 0 (0 m)
3.2.5 Summary of Traffic Crashes
Roads ACT records from January 2009 to December 2013 indicate that 28 crashes have occurred at the
intersection of Hindmarsh Drive and Launceston Street. Of these crashes, 2 were injury crashes and the rest were
property damage only crashes as shown in Table 7.
Launceston St
North
00
6815
6963
Hin
dm
ars
h D
rive
0 1
36
25
28
51
12
14H
ind
mars
h D
riv
e
00
13
22
31
09
11
2
37
2
AM Peak 8:00 AM-9:00 AM
PM Peak 5:00 PM-6:00 PM

AECOM
Hindmarsh Drive Intersection Upgrades – Tuggeranong Parkway to Eggleston
Crescent
P:\CBR\60336615_Hindmarsh_Drive_Upgrade\8. Issued Docs\8.1 Reports\60336615_2.2 Hindmarsh Dr.docx Revision 4 – 11-Aug-2015 Prepared for – Roads ACT – ABN: 37 307 569 373
11
Table 7 Summary of Crashes – Hindmarsh Dr/Launceston St
Severity 2009 2010 2011 2012 2013 Total
Fatal 0 0 0 0 0 0
Admitted to Hospital 0 0 0 0 0 0
Received Medical Treatment 1 1 0 0 0 2
Property Damage Only 4 6 6 6 4 26
Total 5 7 6 6 4 28
3.3 Hindmarsh Drive/Eggleston Crescent Intersection
3.3.1 Layout and Control
The intersection is a seagull arrangement controlled by a give way sign on Eggleston Crescent. Right turn
movements out of Eggleston Crescent have a dedicated lane on Eggleston Crescent but have no acceleration
lane on Hindmarsh Drive. Right turn movements out of Hindmarsh Drive have a turn lane on Hindmarsh Drive.
Slip lanes are provided for left turns as shown in Figure 10.
Figure 10 Hindmarsh Drive / Eggleston Crescent Intersection
Source: ACTMAPi - ACT Government online interactive maps 2014
3.3.2 Field Observations
A weekday site inspection was undertaken on Tuesday, 31 January 2012 at 4.00 pm. The following observations
were noted:
- The majority of turning movements at the intersection are right turn movements into Eggleston Crescent and
left turn movements out of Eggleston Crescent (in the PM)

AECOM
Hindmarsh Drive Intersection Upgrades – Tuggeranong Parkway to Eggleston
Crescent
P:\CBR\60336615_Hindmarsh_Drive_Upgrade\8. Issued Docs\8.1 Reports\60336615_2.2 Hindmarsh Dr.docx Revision 4 – 11-Aug-2015 Prepared for – Roads ACT – ABN: 37 307 569 373
12
- Many drivers turning right into Eggleston Crescent use Eggleston Crescent to connect to other Woden
Valley suburbs via Macfarland Crescent.
- The intersection warning sign (Give Way ahead) on Eggleston Crescent is hidden by a tree and should be
moved to in front of the tree; even though the intersection is clearly visible.
- Sight distance is adequate at the intersection (ie., within Austroads guidelines).
- A long queue on the left turn movement out of Eggleston Crescent was observed.
- There was little to no queuing on the right turn movement out of Eggleston Crescent.
- Drivers turning right into and out of Eggleston Crescent may misjudge the gap crossing three lanes in which
vehicles are travelling at 80 km/h or more.
- The sight lines of vehicles in the left turn lane out of Eggleston Crescent can be obscured by vehicles turning
right. This may result in hesitation and may be a factor in rear-end crashes.
The Give Way warning sign is obscured by a street tree The largest turning movements are left turns out and right
turns into Eggleston Crescent
A long queue develops in left turn bay out of Eggleston
Crescent
The right turn out of Eggleston Crescent is not very heavy
3.3.3 Traffic Volumes
Peak hour intersection turning counts were undertaken via video survey method here on Wednesday 10
December 2014. The results of the surveys at this intersection are summarised in Figure 9. It shows quite high left
turning volumes out of Eggleston Crescent, but low right turns. This may reflect the difficulty of turning right here
and may lead to increased traffic on local streets in Chisholm.

AECOM
Hindmarsh Drive Intersection Upgrades – Tuggeranong Parkway to Eggleston
Crescent
P:\CBR\60336615_Hindmarsh_Drive_Upgrade\8. Issued Docs\8.1 Reports\60336615_2.2 Hindmarsh Dr.docx Revision 4 – 11-Aug-2015 Prepared for – Roads ACT – ABN: 37 307 569 373
13
Figure 11 Peak Hour Counts at Hindmarsh Drive / Eggleston Crescent Intersection
Source: BVY Traffic Survey, 10 December 2014
3.3.4 Peak Hour Queues
The BVY Traffic survey also collected peak hour queue lengths on all approaches to this intersection. These are
summarised in Table 8 and show minimal queueing. These data were collected in 5 minute intervals throughout
each peak hour and are used in calibrating the micro-simulation model.
Table 8 Maximum Vehicular Queues per Lane – Hindmarsh Dr/ Eggleston Cres
Approach AM PM
Hindmarsh Drive East 0 (0 m) 0 (0 m)
Eggleston Crescent 7 (49 m) 14 (98 m)
Hindmarsh Drive West 7 (49 m) 9 (63 m)
3.3.5 Summary of Traffic Crashes
The recorded crashes were obtained from Roads ACT for the five year period from January 2009 until December
2013. These crashes were reviewed to identify any crash patterns and trends and also assist in the understanding
of the contributory causes of the crashes. Ambiguities and coding errors were discovered in some of the crash
data. These records were reinterpreted using engineering judgement and consideration of the crash patterns in
the intersection.
The records indicate that 37 crashes have occurred at the intersection of Hindmarsh Drive and Eggleston
Crescent. Of these crashes, 6 were injury crashes and the rest were property damage only crashes as shown in
Table 9.
North
Hin
dm
ars
h D
rive
0 02
72
21
03
25
63
8
Hin
dm
ars
h D
riv
e
051
45
17
21
24
62
99
6
Eggleston Cres
0
0
203
165
23
8
AM Peak 8:00 AM-9:00 AM
PM Peak 5:00 PM-6:00 PM

AECOM
Hindmarsh Drive Intersection Upgrades – Tuggeranong Parkway to Eggleston
Crescent
P:\CBR\60336615_Hindmarsh_Drive_Upgrade\8. Issued Docs\8.1 Reports\60336615_2.2 Hindmarsh Dr.docx Revision 4 – 11-Aug-2015 Prepared for – Roads ACT – ABN: 37 307 569 373
14
Table 9 Summary of Crashes – Hindmarsh Dr/Eggleston Cres
Severity 2009 2010 2011 2012 2013 Total
Fatal 0 0 0 0 0 0
Admitted to Hospital 0 0 0 0 0 0
Received Medical Treatment 1 1 0 1 3 6
Property Damage Only 4 7 6 7 7 31
Total 5 8 6 8 10 37

AECOM
Hindmarsh Drive Intersection Upgrades – Tuggeranong Parkway to Eggleston
Crescent
P:\CBR\60336615_Hindmarsh_Drive_Upgrade\8. Issued Docs\8.1 Reports\60336615_2.2 Hindmarsh Dr.docx Revision 4 – 11-Aug-2015 Prepared for – Roads ACT – ABN: 37 307 569 373
15
4.0 Detailed Crash Analysis
The recorded crashes were obtained from Roads ACT for the five year period from January 2009 until December
2013. These crashes were reviewed to identify any crash patterns and trends and also assist in the understanding
of the contributory causes of the crashes. Ambiguities and coding errors were discovered in some of the crash
data. These records were reinterpreted using engineering judgement and consideration of the crash patterns in
the intersection.
4.1 Hindmarsh Drive/Tuggeranong Parkway Eastern Ramp Intersection
4.1.1 Crash Diagram
An analysis of the crash diagram in Figure 12 reveals the following:
- 4 injury crashes involved rear end accidents and another two involved adjacent approach vehicles
- 153 crashes out of a total of 213 occurred on the left turn slip lane onto the east bound carriageway of
Hindmarsh Drive
- 7 crashes involved the eastbound right turn movement to the southern Tuggeranong Parkway ramp
Figure 12 Crash Diagram – Hindmarsh Dr/Tuggeranong Parkway Eastern Ramp
: Injury

AECOM
Hindmarsh Drive Intersection Upgrades – Tuggeranong Parkway to Eggleston
Crescent
P:\CBR\60336615_Hindmarsh_Drive_Upgrade\8. Issued Docs\8.1 Reports\60336615_2.2 Hindmarsh Dr.docx Revision 4 – 11-Aug-2015 Prepared for – Roads ACT – ABN: 37 307 569 373
16
4.1.2 Crash Summary
Table 10 summarises the different crash types according to DCA codes, using crash data obtained from Roads
ACT from January 2009 until December 2013. A very high percentage of crashes involved rear-end crashes
(92%).
Table 10 Major Crash Types – Hindmarsh Dr/Tuggeranong Parkway Eastern Ramp
Description and DCA Code Total Number
of Crashes
Adjacent Approach (101-109) 4
Opposing turns (202-206) 7
Rear-end (301-304) 195
Lane change (305-307) 4
Parallel lanes – turning (308,309) 1
Loss of control, L or R turns into object (703,704 1
Other (610) 1
Total 213
4.2 Hindmarsh Drive/Launceston Street Intersection
4.2.1 Crash Diagram
An analysis of the crash diagram in Figure 13 reveals the following:
- 2 injury crashes involved adjacent approach vehicles
- 12 crashes out of total 28 rear-end crashes
- The majority of crashes involved the right turn movements out of Launceston Street onto Hindmarsh Drive
heading west
Figure 13 Crash Diagram – Hindmarsh Dr / Launceston St
: Injury

AECOM
Hindmarsh Drive Intersection Upgrades – Tuggeranong Parkway to Eggleston
Crescent
P:\CBR\60336615_Hindmarsh_Drive_Upgrade\8. Issued Docs\8.1 Reports\60336615_2.2 Hindmarsh Dr.docx Revision 4 – 11-Aug-2015 Prepared for – Roads ACT – ABN: 37 307 569 373
17
4.2.2 Crash Summary
Table 11 summarises the different crash types according to DCA codes, using crash data obtained from Roads
ACT from January 2009 until December 2013. It shows that there was a high percentage of rear-end (43%) and
adjacent approach crashes (32%).
Table 11 Major Crash Types – Hindmarsh Dr / Launceston St
Description and DCA Code Total Number of
Crashes
Adjacent Approach (101-109) 9
Opposing turns (202-206) 2
Rear-end (301-304) 12
Lane change (305-307) 1
Parallel lanes – turning (308,309) 1
Loss of control, L or R turns (706,707) 1
Other (610,404) 2
Total 28
4.3 Hindmarsh Drive/Eggleston Crescent Intersection
4.3.1 Crash Diagram
An analysis of the crash diagram in Figure 14 reveals the following:
- 4 injury crashes involved rear end accidents westbound on Hindmarsh Drive
- 10 crashes (27% of total intersection crashes) involved left turn movements out of Eggleston Crescent,
resulting in one injury
- 12 crashes (32% of total intersection crashes) were opposing turn crashes involving right turning traffic from
Hindmarsh Drive into Eggleston Crescent
Figure 14 Crash Diagram – Hindmarsh Dr/Eggleston Cres
: Injury

AECOM
Hindmarsh Drive Intersection Upgrades – Tuggeranong Parkway to Eggleston
Crescent
P:\CBR\60336615_Hindmarsh_Drive_Upgrade\8. Issued Docs\8.1 Reports\60336615_2.2 Hindmarsh Dr.docx Revision 4 – 11-Aug-2015 Prepared for – Roads ACT – ABN: 37 307 569 373
18
4.3.2 Crash Summary
Table 12 summarises the different crash types according to DCA codes, using crash data obtained from Roads
ACT from January 2009 until December 2013. It shows that there was a high percentage of rear-end (43%) and
opposing turn crashes (32%).
Table 12 Major Crash Types – Hindmarsh Dr/Eggleston Cres
Description and DCA Code Total Number
of Crashes
Adjacent Approach (101-109) 8
Opposing turns (202-206) 12
Rear-end (301-304) 16
Loss of control, L or R turns (706,707) 1
Total 37
4.4 Crash Rates at Similar Ramp Intersections
To help determine the likely crash reduction from installing traffic signals at the ramp intersection with Hindmarsh
Drive an analysis of crash rates was undertaken at similar ramp intersections in Canberra. Two other locations
with relatively high ramp volumes and signal control were analysed:
- Canberra Avenue with Monaro Highway: northbound ramp only (see Figure 16)
- Belconnen Way with GDE: both northbound and southbound ramps (see Figure 17)
These ramp intersections are fully controlled by traffic signals.
Figure 15 Canberra Avenue Ramp Intersection with Monaro Highway

AECOM
Hindmarsh Drive Intersection Upgrades – Tuggeranong Parkway to Eggleston
Crescent
P:\CBR\60336615_Hindmarsh_Drive_Upgrade\8. Issued Docs\8.1 Reports\60336615_2.2 Hindmarsh Dr.docx Revision 4 – 11-Aug-2015 Prepared for – Roads ACT – ABN: 37 307 569 373
19
Figure 16 Belconnen Way Ramp Intersections with GDE
Recent crash and traffic flow data was provided by Roads ACT for these ramp intersections. The crash data is for
a 5 year period January 2010 until December 2014. The traffic flow data from SCATS was for the last week of
March 2015. A comparison of the number of recorded crashes and crash rates on each ramp analysed is
provided in Table 13 and Table 14.
Table 13 Crash Statistics at Ramp Intersection Locations in ACT
Ramp Intersection On Ramp Within
Intersection
Total
Hindmarsh Drive Southbound 187 (5) 4 (0) 191 (5)
Canberra Avenue Northbound 1 (0) 0 (0) 1 (0)
Belconnen Way Northbound 7 (0) 3 (1) 10 (1)
Belconnen Way Southbound 2 (0) 2 (0) 4 (0)
Note: 1. Crashes are for a recent 5 year period
2. Within intersection only includes crashes associated with ramp traffic, within intersection.
3. Crashes involving injury are shown in parentheses.
Table 14 Crash Rates on Ramps in ACT
Ramp Intersection Total Number
of Crashes (A)
Average Daily
Traffic Flow (B)
Crash Rate
A*1000/B
Hindmarsh Drive Southbound 187 8,969 20.85
Canberra Avenue Northbound 1 5,326 0.19
Belconnen Way Northbound 7 8,913 0.79
Belconnen Way Southbound 2 3,992 0.50
Average Canberra Av & Belconnen Way 3 6,077 0.55
Note: 1. Crashes are for a recent 5 year period
2. Only on-ramp crashes are included and the volume is the ramp flow.

AECOM
Hindmarsh Drive Intersection Upgrades – Tuggeranong Parkway to Eggleston
Crescent
P:\CBR\60336615_Hindmarsh_Drive_Upgrade\8. Issued Docs\8.1 Reports\60336615_2.2 Hindmarsh Dr.docx Revision 4 – 11-Aug-2015 Prepared for – Roads ACT – ABN: 37 307 569 373
20
The application of the average crash rate for the three other signalised ramps to the Hindmarsh Drive ramp
results in a predicted number of crashes of 5 crashes. This equates to a 97% savings in crash incidence. The
savings in crash costs is likely to be even higher, as the Hindmarsh Drive ramp had five injury crashes in contrast
to none at the other ramp locations.
Furthermore, a review of existing crash patterns at the Hindmarsh Drive ramp (Figure 12) suggests that signals
are likely to cause a significant reduction in crashes at this site. The other signalised approaches show much less
rear-end crashes (93% of rear-end crashes are associated with the left turns on the ramp) and it seems that the
majority of rear-end crashes on the ramp are due to uncertainties associated with vehicles turning left via the slip
lane. Hence, the signalisation of the southbound left turns here could lead to a 90% or more reduction in crashes.

AECOM
Hindmarsh Drive Intersection Upgrades – Tuggeranong Parkway to Eggleston
Crescent
P:\CBR\60336615_Hindmarsh_Drive_Upgrade\8. Issued Docs\8.1 Reports\60336615_2.2 Hindmarsh Dr.docx Revision 4 – 11-Aug-2015 Prepared for – Roads ACT – ABN: 37 307 569 373
21
5.0 Operational Analysis of Existing Conditions
A Paramics micro-simulation traffic model was created as part of this project to assist in the assessment of road
improvement options. This chapter provides an outline of the development and calibration of the model, together
with a summary of the results of performance of the road network and intersections in the study area.
5.1 Micro-simulation Model Data and Assumptions
5.1.1 Extent of model
The study area modelled in Paramics is illustrated in Figure 17. It includes the three intersections on Hindmarsh
Drive that are subject to assessment in this study, as well as some additional intersections to the west and south
of these intersections. Two intersections to the west were included because of their close proximity to the eastern
Tuggeranong Parkway ramp intersection and queueing interactions that occur between these intersections. The
network was also extended to the south to include the intersection of McDonald Street and Eggleston Crescent to
enable testing of a potential option to reopen the intersection of McDonald Street and Hindmarsh Drive to create a
4-leg signalised intersection here.
Figure 17: Extent of micro-simulation modelled road network
5.1.2 Sources of data and assumptions
Data used within the micro-simulation model includes:
- Intersection vehicle counts;
- Mid-block counts;
- SCATS data – signal timings, historical playback, and detector counts.
AECOM commissioned classified intersection turn count surveys at various locations within the study area.
Classified intersection turn counts were commissioned in Wednesday 10 December 2014 at the following
intersections:
- Tuggeranong Parkway Eastern Off Ramp and Hindmarsh Drive, Lyons
- Launceston Street and Hindmarsh Drive, Lyons; and
- Eggleston Crescent and Hindmarsh Drive, Lyons.
Surveys covered the AM peak period between 7:30 – 9:30 and the PM peak between 16:30 – 18:30.

AECOM
Hindmarsh Drive Intersection Upgrades – Tuggeranong Parkway to Eggleston
Crescent
P:\CBR\60336615_Hindmarsh_Drive_Upgrade\8. Issued Docs\8.1 Reports\60336615_2.2 Hindmarsh Dr.docx Revision 4 – 11-Aug-2015 Prepared for – Roads ACT – ABN: 37 307 569 373
22
SCATS information, provided by TAMS, for all of the signalised intersections in the study area, are summarised in
Table 15. For the SCATS Detector Counts, it was assumed that the distribution of vehicles was consistent with
the average day.
Table 15: SCATS Data
Name of Data Set Details Date Recorded (or Extracted)
.IDM Files Playback information – phase by phase – for a 24 hour
period
Wednesday, 19 November 2014
SCATS Detector
Counts
Summary of detector counts by detector number by 15
minute period.
Wednesday 19 November 2014
Source: AECOM, based on data provided by Roads ACT, 2014
5.1.3 Network building
Aerial photography, obtained from publicly available satellite imagery, was used to develop network geometry with
the following link and lane attributes:
- Number of lanes;
- Length of turning bays;
- Turn bans;
- Speed limits;
- Stop line locations; and
- Intersection blocking behaviour.
Where desktop data was unavailable, site visits were completed to confirm sections of the network geometry
The modelled road network and external zone structure for the base (year 2014) Hindmarsh Drive Paramics
model consists of 9 zones, as illustrated in Figure 18.
Figure 18: Zone Structure

AECOM
Hindmarsh Drive Intersection Upgrades – Tuggeranong Parkway to Eggleston
Crescent
P:\CBR\60336615_Hindmarsh_Drive_Upgrade\8. Issued Docs\8.1 Reports\60336615_2.2 Hindmarsh Dr.docx Revision 4 – 11-Aug-2015 Prepared for – Roads ACT – ABN: 37 307 569 373
23
For the development of the Paramics base model, the following assumptions were made:
- Lane choice rules were applied to calibrate the travel behaviour of traffic for the modelled peak hour;
- Where localised behaviour factors do not achieve observed throughput at signalised intersections, signal
timings at the intersections were adjusted to optimise the throughput;
- No vehicle travelled more than 10% faster than the signposted speed limit;
- 6.6% heavy vehicle proportion;
- No illegal turns were conducted;
- No pedestrian movements on road;
- Link parameters, lane choice, reaction and headway factors were adjusted to reflect capacity from site
observations and count data; and
- No vehicles were lost in accessing their destination.
5.1.4 Temporal information
Based on the surveyed traffic volumes, traffic profile, over the peak hour were applied for the AM and PM peak hours. In addition, a warm up and cool down of 30 minutes were applied to the models
Table 16: Peak Hour Traffic Profiles
Period
07:30 -
07:45
07:45 -
08:00
08:00 -
08:15
08:15 -
08:30
08:30 -
08:45
08:45 -
09:00
09:00 -
09:15
09:15 -
09:30
19% 22% 25% 25% 26% 24% 20% 17%
16:30 -
16:45
16:45 -
17:00
17:00 -
17:15
17:15 -
17:30
17:30 -
17:45
17:45 -
17:00
18:00 -
18:15
18:15 -
18:30
21% 22% 25% 25% 26% 24% 21% 16%
Source: AECOM, based on surveyed traffic data, 2014
5.2 Base Case (Base Year) Calibration and Validation
5.2.1 Basis of calibration
The microsimulation modelling of the area needs to accurately represent traffic behaviour in the existing scenario
so that informed decisions can be made about infrastructure provision for the design years. In particular, the base
year modelling should:
- Accurately reflect existing traffic volumes in the study area;
- Accurately portray distribution and assignment of vehicles in the study area;
- Accurately reflect typical queuing behaviour; and
- Be regarded as ‘fit-for-purpose’.
Modelled link volumes were compared to observed traffic counts. It was confirmed that over 85% of the
movements at the links were calibrated to below GEH 5.0 for the AM modelled hour.
The GEH Statistic is a formula used in traffic modelling to compare two sets of traffic volumes (traffic volumes
derived from the simulation (for the "base year, base case" scenario) with the real-world traffic volumes). Using
the GEH Statistic avoids errors that occur when using simple percentages to compare two sets of volumes since
traffic volumes vary over a wide range. The use of GEH as an acceptance criterion for travel demand forecasting
models is recognised in the UK Highways Agency's Design Manual for Roads & Bridges (DMRB), Volume 12,
Section 2, as well as other references.

AECOM
Hindmarsh Drive Intersection Upgrades – Tuggeranong Parkway to Eggleston
Crescent
P:\CBR\60336615_Hindmarsh_Drive_Upgrade\8. Issued Docs\8.1 Reports\60336615_2.2 Hindmarsh Dr.docx Revision 4 – 11-Aug-2015 Prepared for – Roads ACT – ABN: 37 307 569 373
24
With micro-simulation modelling of base case scenarios, a GEH of less than 5.0 is considered a good match
between the modelled and observed volumes. The GEH Statistic is calculated by the following formula:
ObservedModelled
ObservedModelledGEH
22
According to DMRB, 85% of the volumes in a traffic model should have a GEH less than 5.0. GEHs in the range
of 5.0 to 10.0 may warrant further calibrating of the model. If the GEH is greater than 10.0, there is a high
probability that there is a problem with either the travel demand model or the data.
5.2.2 Traffic volume calibration results
Observed counts were compared with modelled turning movements within the modelled network. For both the AM
and PM peak models, a total of 100% of the modelled links achieved a GEH value under 5.0 with all turns under a
GEH value of 10, thereby satisfying the link flow calibration criteria. This shows that the model is calibrated within
acceptable criteria. The results of the link comparisons are provided in Appendix B.
5.2.3 Queue length validation
The queue length measurements from the models were compared with observations from video surveys at a
number of key intersections:
- Hindmarsh Drive and Eastern Ramp intersection with Tuggeranong Parkway
- Hindmarsh Drive and Launceston Street
- Hindmarsh Drive and Eggleston Crescent
The model operations were found to be consistent with site observations.
5.2.4 Conclusion
The objective for calibration of the Hindmarsh Drive micro-simulation models were that the models should satisfy
the DMRB requirements regarding GEH. For the AM peak model, the simulation has satisfied these criteria. The
base models:
- Have turn volume GEH results where none exceed a GEH of 5.0;
- Accurately portray queuing behaviour; and
- Have been verified by internal review.
As such, this model is considered fit for purpose for assessing infrastructure requirements to inform the road
design.

AECOM
Hindmarsh Drive Intersection Upgrades – Tuggeranong Parkway to Eggleston
Crescent
P:\CBR\60336615_Hindmarsh_Drive_Upgrade\8. Issued Docs\8.1 Reports\60336615_2.2 Hindmarsh Dr.docx Revision 4 – 11-Aug-2015 Prepared for – Roads ACT – ABN: 37 307 569 373
25
5.3 Base Year Intersection Performance
For benchmarking and comparison to future network performance, the performance of key intersections within the
model are summarised in Table 17 and Table 18.
Table 17 2014 AM Intersection Delays and Level of Service by Approach – Average of 5 Seed Runs
Hindmarsh Drive Intersection
Approach Level of Service (Delay)
8:00- 9:00
Tuggeranong Parkway
(Eastern Ramp)
Hindmarsh Drive EB A (8.0s)
B (17.5s) Eastern Ramp SB B (27.2s)
Hindmarsh Dr WB B (26.4s)
Launceston Street
Hindmarsh Drive EB A (2.8s)
A (13.1s) Launceston Street SB D (45.1s)
Hindmarsh Dr WB C (39.6s)
Eggleston Crescent
Hindmarsh Drive EB A (6.8s)
A (5.7s) Eggleston Crescent NB A (3.1s)
Hindmarsh Dr WB A (3.1s)
Table 18 2014 PM Intersection Delays and Level of Service by Approach – Average of 5 Seed Runs
Hindmarsh Drive Intersection
Approach Level of Service (Delay)
17:00- 18:00
Tuggeranong Parkway
(Eastern Ramp)
Hindmarsh Drive EB B (27.3s)
B (24.5s) Eastern Ramp SB D (46.5s)
Hindmarsh Dr WB B (17.7s)
Launceston Street
Hindmarsh Drive EB A (2.0s)
A (9.1s) Launceston Street SB C (39.4s)
Hindmarsh Dr WB A (11.4s)
Eggleston Crescent
Hindmarsh Drive EB F (73.6)
– right turns B (26.1s)
Eggleston Crescent NB B (16.8s)
Hindmarsh Dr WB A (3.5s)

AECOM
Hindmarsh Drive Intersection Upgrades – Tuggeranong Parkway to Eggleston
Crescent
P:\CBR\60336615_Hindmarsh_Drive_Upgrade\8. Issued Docs\8.1 Reports\60336615_2.2 Hindmarsh Dr.docx Revision 4 – 11-Aug-2015 Prepared for – Roads ACT – ABN: 37 307 569 373
26
5.4 Amount of travel
The average speed and amount of travel in a road network is an indicator of overall network efficiency. Table 19
provides these statistics for the 2014 model.
Table 19: Amount of peak hour travel in study area road network
Peak
Hour Travel Indicator 2014
AM Vehicle Kilometres Travelled (VKT) 12318
Vehicle Hours Travelled (VHT) 257.4
Ave speed (km/h) 50.4
PM Vehicle Kilometres Travelled (VKT) 11276
Vehicle Hours Travelled (VHT) 220.6
Ave speed (km/h) 52.8
AM & PM Ave speed (km/h) 51.6

AECOM
Hindmarsh Drive Intersection Upgrades – Tuggeranong Parkway to Eggleston
Crescent
P:\CBR\60336615_Hindmarsh_Drive_Upgrade\8. Issued Docs\8.1 Reports\60336615_2.2 Hindmarsh Dr.docx Revision 4 – 11-Aug-2015 Prepared for – Roads ACT – ABN: 37 307 569 373
27
6.0 Treatment Options
As a result of previous Blackspot studies over the past 5 years, remedial measures have been carried out by
Roads ACT to improve the subject section of Hindmarsh Drive. Despite these remedial measures an overall road
improvement strategy is required to approximately accommodate traffic flow along Hindmarsh Drive to 2031 and
beyond.
Within each intersection improvement options are outlined below. However a combination of these options across
all three intersections is used to assess the most effective network strategy for the subject section of Hindmarsh
Drive, in Chapter 7.
6.1 Option 1 – Hindmarsh Drive / Tuggeranong Parkway Eastern Ramp
Intersection
The options considered here involve closure of the left-turn slip lane and the creation of an additional signalised
left-turn lane. Options 1A and 1B involve different lane arrangements on approach to the signals.
6.1.1 Option 1A
This treatment closes the south to eastbound left turn slip lane onto Hindmarsh Drive and implements a new short
left turn lane on the western side of the island. This will mean all movements (right turn, straight ahead and left
turn) from the Tuggeranong Parkway Eastern ramp will be controlled by the signals. The proposed treatment is
shown in Figure 19. The red lines indicate changes to existing kerbs and line-marking.
Figure 19 Option 1A
Option 1A

AECOM
Hindmarsh Drive Intersection Upgrades – Tuggeranong Parkway to Eggleston
Crescent
P:\CBR\60336615_Hindmarsh_Drive_Upgrade\8. Issued Docs\8.1 Reports\60336615_2.2 Hindmarsh Dr.docx Revision 4 – 11-Aug-2015 Prepared for – Roads ACT – ABN: 37 307 569 373
28
6.1.1.1 Cost
The estimate of probable cost to install this treatment is $450,000 excluding GST. This includes a 40%
continguency, 15% preliminaries and 15% Design & Management Fee. No detailed design or assessment of the
existing hardware or underground services has been undertaken.
6.1.1.2 Potential Crash Reduction
The RTA Accident Reduction Guide (RTA 2004, Part 1, Table C1 Page 70) indicates that on average new traffic
signals can increase rear end crashes by 40%. However, a review of crashes at other similar signalised ramp
intersections indicated that signalisation of the ramp will greatly reduce crashes at the Hindmarsh Drive ramp. It is
expected that this new lane arrangement will have greatest impact on rear-end crashes. A summary of the
expected crash reductions on the ramp approach is shown in Table 20.
Table 20 Estimated Percentage Reduction in crashes from Option 1A
Target Crash Assumed Crash Reduction Reference
Rear-end crash (crash codes 301-304) 90% Section 4.4
Lane change crash (crash codes 305 – 307) 60% Section 4.4
6.1.2 Option 1B
In Option 1B again the left turn slip lane is closed off. A new left turn lane will be located on the western side of
the current island and this lane will be continuous. The middle lane (left turn, right turn and straight through) will
also be continuous. A new right turn lane will be created. Again all movements (right turn, straight ahead and left
turn) from the Tuggeranong Parkway Eastern ramp will be controlled by signals. The proposed treatment is shown
in Figure 20. The red lines indicate changes to existing kerbs and line-marking; the pink area shows a new island.
Figure 20 Option 1B
Option 1B

AECOM
Hindmarsh Drive Intersection Upgrades – Tuggeranong Parkway to Eggleston
Crescent
P:\CBR\60336615_Hindmarsh_Drive_Upgrade\8. Issued Docs\8.1 Reports\60336615_2.2 Hindmarsh Dr.docx Revision 4 – 11-Aug-2015 Prepared for – Roads ACT – ABN: 37 307 569 373
29
6.1.2.1 Cost
The estimate of probable cost to install this treatment is $475,000 excluding GST. This includes a 40%
continguency, 15% preliminaries and 15% Design & Management Fee. No detailed design or assessment of the
existing hardware or underground services has been undertaken.
6.1.2.2 Potential Crash Reduction
The proposed treatment is expected to have a similar impact on crash reduction as Option 1A. This option will
involve less lane changing for the major (left-turn) movement, so there would be a greater reduction in lane
change crashes. This could also result in less rear-end crashes, as shown in Table 21.
Table 21 Estimated Percentage Reduction in crashes from Option 1B
Target Crash
Assumed
Crash
Reduction
Reference
Rear-end crash (crash codes 301-304) 90% Section 4.4
Lane change crash (crash codes 305 – 307) 80% Section 4.4
6.1.3 Option 1C
In Option 1C again the left turn slip lane is closed off. A new left turn lane will be located on the western side of
the current island and this lane will be continuous with the existing near-side lane on the ramp. The far-side lane
(left turn, right turn and straight through) will also be continuous. A new right turn lane will be created. Again all
movements (right turn, straight ahead and left turn) from the Tuggeranong Parkway Eastern ramp will be
controlled by signals.
Four alternatives for the proposed treatment are shown in Figure 21. It shows a varying number of right turn lanes
– either one or two. It also shows different alignments for the left and right turn lanes. Option 1C4 would have the
least impact on existing kerblines, whilst providing some increased right turn capacity compared with Option 1C3.
Option 1C2 provides better definition of right turn lanes, avoiding a long narrow length at the commencement of
the right turn lane.
The preferred option will depend on the outcome of the traffic modelling, as well as relative safety and costs.
6.1.3.1 Cost
The costs will vary for the alternative 1C options. The estimate of probable cost to install this treatment varies
from $400,000 excluding GST for Option 1C4 to $750,000 excluding GST for Option 1C2; Options 1C1 and 1C3
would be of the order of $500,000. This includes a 40% continguency, 15% preliminaries and 15% Design &
Management Fee. The red lines indicate changes to existing kerbs and line-marking; the pink area shows a new
island. No detailed design or assessment of the existing hardware or underground services has been undertaken.
6.1.3.2 Potential Crash Reduction
The proposed treatment is expected to have a similar impact on crash reduction as Option 1A. This option will
involve less lane changing for the major (left-turn) movement, so there would be a greater reduction in lane
change crashes. This could also result in less rear-end crashes, as shown in Table 22.
Table 22 Estimated Percentage Reduction in crashes from Option 1C
Target Crash
Assumed
Crash
Reduction
Reference
Rear-end crash (crash codes 301-304) 90% Section 4.4
Lane change crash (crash codes 305 – 307) 80% Section 4.4
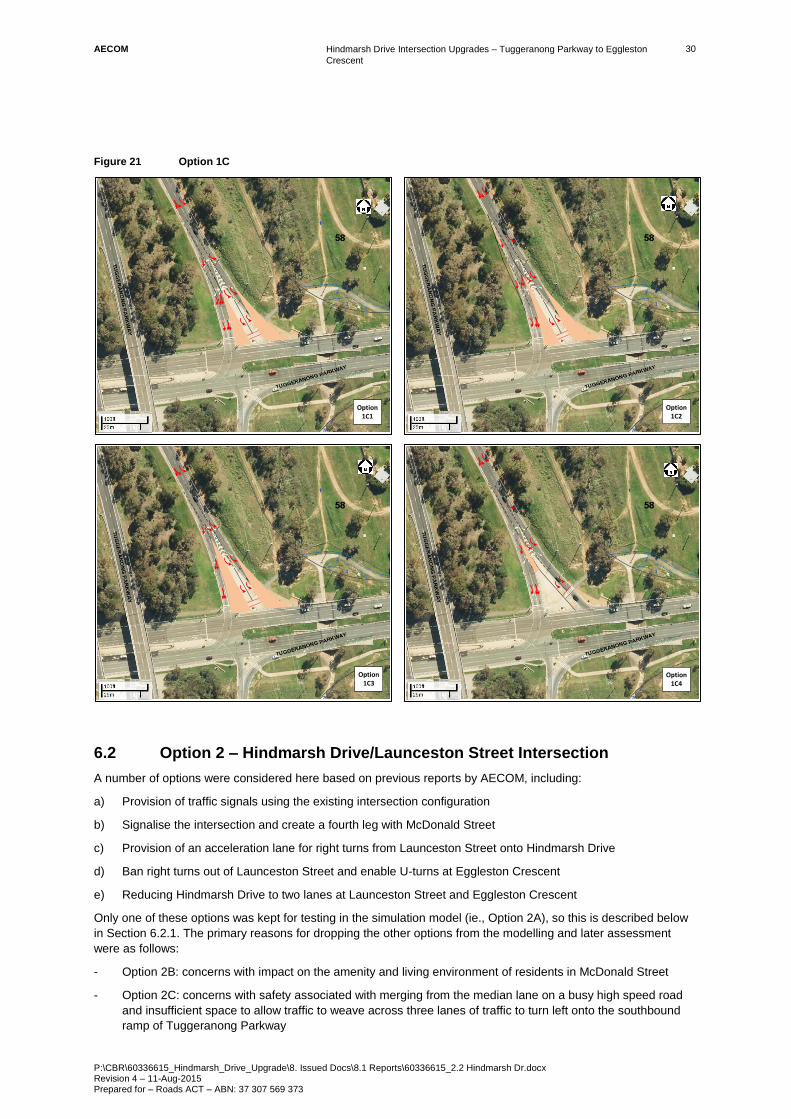
AECOM
Hindmarsh Drive Intersection Upgrades – Tuggeranong Parkway to Eggleston
Crescent
P:\CBR\60336615_Hindmarsh_Drive_Upgrade\8. Issued Docs\8.1 Reports\60336615_2.2 Hindmarsh Dr.docx Revision 4 – 11-Aug-2015 Prepared for – Roads ACT – ABN: 37 307 569 373
30
Figure 21 Option 1C
6.2 Option 2 – Hindmarsh Drive/Launceston Street Intersection
A number of options were considered here based on previous reports by AECOM, including:
a) Provision of traffic signals using the existing intersection configuration
b) Signalise the intersection and create a fourth leg with McDonald Street
c) Provision of an acceleration lane for right turns from Launceston Street onto Hindmarsh Drive
d) Ban right turns out of Launceston Street and enable U-turns at Eggleston Crescent
e) Reducing Hindmarsh Drive to two lanes at Launceston Street and Eggleston Crescent
Only one of these options was kept for testing in the simulation model (ie., Option 2A), so this is described below
in Section 6.2.1. The primary reasons for dropping the other options from the modelling and later assessment
were as follows:
- Option 2B: concerns with impact on the amenity and living environment of residents in McDonald Street
- Option 2C: concerns with safety associated with merging from the median lane on a busy high speed road
and insufficient space to allow traffic to weave across three lanes of traffic to turn left onto the southbound
ramp of Tuggeranong Parkway
Option 1C1
Option 1C2
Option 1C3
Option 1C4

AECOM
Hindmarsh Drive Intersection Upgrades – Tuggeranong Parkway to Eggleston
Crescent
P:\CBR\60336615_Hindmarsh_Drive_Upgrade\8. Issued Docs\8.1 Reports\60336615_2.2 Hindmarsh Dr.docx Revision 4 – 11-Aug-2015 Prepared for – Roads ACT – ABN: 37 307 569 373
31
- Option 2D: will increase conflicts at Eggleston Crescent, where there are already significant problems for
right turners
- Option 2E: will create increase crash risks and congestion on Hindmarsh Drive and there is inadequate
traffic from Launceston Street or Eggleston Crescent to justify these traffic having their own lanes for
entering Hindmarsh Drive
6.2.1 Option 2A
Option 2A involves signalising the Hindmarsh Drive / Launceston Street intersection using it’s current
configuration. All approaches would be signalised and pedestrian facilities provided on the eastern and northern
legs. The proposed treatment is illustrated in Figure 22.
Figure 22 Option 2A
6.2.1.1 Cost
The estimate of probable cost to install this treatment is $350,000 excluding GST. This includes a 40%
continguency, 15% preliminaries and 15% Design & Management Fee. No detailed design or assessment of the
existing hardware and underground services has been undertaken.
6.2.1.2 Potential Crash Reduction
This proposed treatment (Option 2A) is expected to have the following impact on crash frequency:
- The signalisation of the intersection should reduce adjacent approach crashes (crash codes 101-109) by
70%, and opposing turn crashes (codes 202-206) by 45% 3
- It could also cause a 40% increase in rear-end crashes 4
- The provision of signalised pedestrian crossing facilities should also improve pedestrian safety
3 Austroads Guide to Road Safety Part B: Treatment of Crash Locations. Table 9.5
4 RTA Accident Reduction Guide (RTA 2004, Part 1, Table C1 Page 70)

AECOM
Hindmarsh Drive Intersection Upgrades – Tuggeranong Parkway to Eggleston
Crescent
P:\CBR\60336615_Hindmarsh_Drive_Upgrade\8. Issued Docs\8.1 Reports\60336615_2.2 Hindmarsh Dr.docx Revision 4 – 11-Aug-2015 Prepared for – Roads ACT – ABN: 37 307 569 373
32
6.3 Option 3 –Hindmarsh Drive/Eggleston Crescent Intersection
A number of options were considered here based on previous reports by AECOM, including:
a) Provision of traffic signals using the existing intersection configuration
b) Closure of median if McDonald Street is connected to Hindmarsh Drive (ie., Option 2B for Launceston Street
intersection)
c) Provision of an acceleration lane for right turns from Eggleston Crescent onto Hindmarsh Drive
d) Reducing Hindmarsh Drive to two lanes at Launceston Street and Eggleston Crescent
Only one of these options was kept for testing in the simulation model (ie., Option 3A), so this is described below
in Section 6.3.1. The primary reasons for dropping the other options from the modelling and later assessment
were as follows:
- Option 3B: concerns with impact on the amenity and living environment of residents in McDonald Street
- Option 3C: concerns with safety associated with merging from the median lane on a busy high speed road
and insufficient space to allow traffic to weave across three lanes of traffic to turn left onto Melrose Drive
- Option 3D: will create increase crash risks and congestion on Hindmarsh Drive and there is inadequate
traffic from Launceston Street or Eggleston Crescent to justify these traffic having their own lanes for
entering Hindmarsh Drive
6.3.1 Option 3A
Option 2A involves signalising the Hindmarsh Drive / Eggleston Crescent intersection using it’s current
configuration. All approaches would be signalised and pedestrian facilities provided on the eastern and northern
legs.
6.3.1.1 Cost
The estimate of probable cost to install this treatment is $350,000 excluding GST. This includes a 40%
continguency, 15% preliminaries and 15% Design & Management Fee. No detailed design or assessment of the
existing hardware or underground services has been undertaken.
6.3.1.2 Potential Crash Reduction
This proposed treatment (Option 3A) is expected to have the following impact on crash frequency:
- The signalisation of the intersection should reduce adjacent approach crashes (crash codes 101-109) by
70%, and opposing turn crashes (codes 202-206) by 45% 5
- It could also cause a 40% increase in rear-end crashes 6
- The provision of signalised pedestrian crossing facilities should also improve pedestrian safety
Mast arms at approaches to traffic signals on a multi-lane arterial road such as Hindmarsh Drive will reduce rear-
end crashes; moreso, for roads orientated east-west.
5 Austroads Guide to Road Safety Part B: Treatment of Crash Locations. Table 9.5
6 RTA Accident Reduction Guide (RTA 2004, Part 1, Table C1 Page 70)
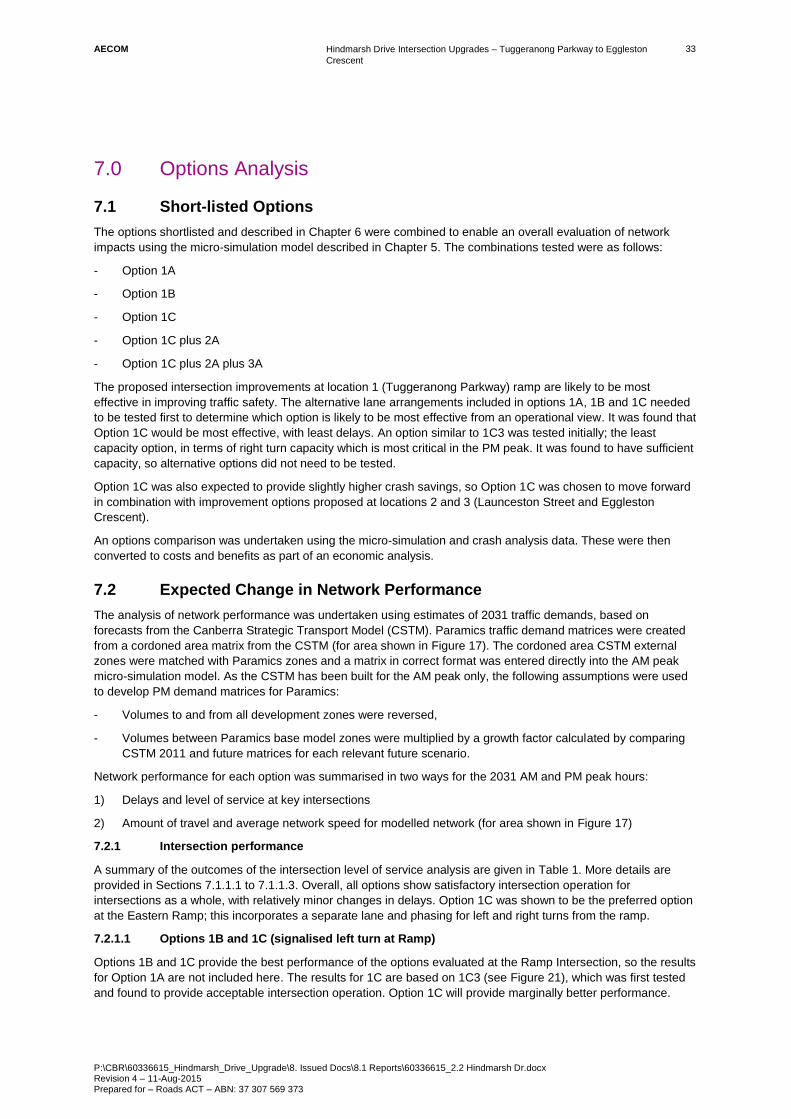
AECOM
Hindmarsh Drive Intersection Upgrades – Tuggeranong Parkway to Eggleston
Crescent
P:\CBR\60336615_Hindmarsh_Drive_Upgrade\8. Issued Docs\8.1 Reports\60336615_2.2 Hindmarsh Dr.docx Revision 4 – 11-Aug-2015 Prepared for – Roads ACT – ABN: 37 307 569 373
33
7.0 Options Analysis
7.1 Short-listed Options
The options shortlisted and described in Chapter 6 were combined to enable an overall evaluation of network
impacts using the micro-simulation model described in Chapter 5. The combinations tested were as follows:
- Option 1A
- Option 1B
- Option 1C
- Option 1C plus 2A
- Option 1C plus 2A plus 3A
The proposed intersection improvements at location 1 (Tuggeranong Parkway) ramp are likely to be most
effective in improving traffic safety. The alternative lane arrangements included in options 1A, 1B and 1C needed
to be tested first to determine which option is likely to be most effective from an operational view. It was found that
Option 1C would be most effective, with least delays. An option similar to 1C3 was tested initially; the least
capacity option, in terms of right turn capacity which is most critical in the PM peak. It was found to have sufficient
capacity, so alternative options did not need to be tested.
Option 1C was also expected to provide slightly higher crash savings, so Option 1C was chosen to move forward
in combination with improvement options proposed at locations 2 and 3 (Launceston Street and Eggleston
Crescent).
An options comparison was undertaken using the micro-simulation and crash analysis data. These were then
converted to costs and benefits as part of an economic analysis.
7.2 Expected Change in Network Performance
The analysis of network performance was undertaken using estimates of 2031 traffic demands, based on
forecasts from the Canberra Strategic Transport Model (CSTM). Paramics traffic demand matrices were created
from a cordoned area matrix from the CSTM (for area shown in Figure 17). The cordoned area CSTM external
zones were matched with Paramics zones and a matrix in correct format was entered directly into the AM peak
micro-simulation model. As the CSTM has been built for the AM peak only, the following assumptions were used
to develop PM demand matrices for Paramics:
- Volumes to and from all development zones were reversed,
- Volumes between Paramics base model zones were multiplied by a growth factor calculated by comparing
CSTM 2011 and future matrices for each relevant future scenario.
Network performance for each option was summarised in two ways for the 2031 AM and PM peak hours:
1) Delays and level of service at key intersections
2) Amount of travel and average network speed for modelled network (for area shown in Figure 17)
7.2.1 Intersection performance
A summary of the outcomes of the intersection level of service analysis are given in Table 1. More details are
provided in Sections 7.1.1.1 to 7.1.1.3. Overall, all options show satisfactory intersection operation for
intersections as a whole, with relatively minor changes in delays. Option 1C was shown to be the preferred option
at the Eastern Ramp; this incorporates a separate lane and phasing for left and right turns from the ramp.
7.2.1.1 Options 1B and 1C (signalised left turn at Ramp)
Options 1B and 1C provide the best performance of the options evaluated at the Ramp Intersection, so the results
for Option 1A are not included here. The results for 1C are based on 1C3 (see Figure 21), which was first tested
and found to provide acceptable intersection operation. Option 1C will provide marginally better performance.

AECOM
Hindmarsh Drive Intersection Upgrades – Tuggeranong Parkway to Eggleston
Crescent
P:\CBR\60336615_Hindmarsh_Drive_Upgrade\8. Issued Docs\8.1 Reports\60336615_2.2 Hindmarsh Dr.docx Revision 4 – 11-Aug-2015 Prepared for – Roads ACT – ABN: 37 307 569 373
34
These options relate to improvements at the Eastern ramp intersection – both involve signalisation of the left turn.
Table 23 and Table 24 provide a summary of the peak hour delay and level of service analysis at each of the
studied intersections, for the AM and PM peak hours respectively.
Table 23 2031 AM Option 1B and 1C Intersection Delays and Level of Service by Approach
Hindmarsh Drive Intersection
Approach
2031 Do Nothing 2031 Option 1B 2031 Option 1C
Level of Service (Delay)
8:00- 9:00
Tuggeranong
Parkway
(Eastern
Ramp)
Hindmarsh Drive EB B (9.7s)
B
(16.8s)
A (8.3s)
B
(17.5s)
A (8.6s)
B
(16.1s) Eastern Ramp SB B (21.6s) B (25.4s) B (18.5s)
Hindmarsh Dr WB B (27.7s) B (27.5s) B (27.9s)
Launceston
Street
Hindmarsh Drive EB A (1.6s)
A
(12.4s)
A (1.4s)
A
(12.2s)
A (2.8s)
A
(11.2s) Launceston Street SB C (34.8s) C (30.1s) C (31.4s)
Hindmarsh Dr WB C (39.2s) C (39.4s) C (31.7s)
Eggleston
Crescent
Hindmarsh Drive EB A (8.0s)
A
(6.6s)
A (8.2s)
A
(6.7s)
A (8.0s)
A
(6.6s)
Eggleston Crescent
NB A (4.2s) A (3.2s) A (3.8s)
Hindmarsh Dr WB A (3.1s) A (3.1s) A (3.1s)
Note: average of 5 seed runs
Table 24 2031 PM Option 1B and 1C Intersection Delays and Level of Service by Approach
Hindmarsh Drive Intersection
Approach
2031 Do Nothing 2031 Option 1B 2031 Option 1C
Level of Service (Delay)
17:00- 18:00
Tuggeranong
Parkway
(Eastern
Ramp)
Hindmarsh Drive EB C (31.2s)
B
(25.1s)
C (28.3s)
C
(30.0s)
C (28.9s)
B
(24.7s) Eastern Ramp SB D (54.0s) F (75.2s) D (42.0s)
Hindmarsh Dr WB B (19.3s) B (19.2s) B (19.0s)
Launceston
Street
Hindmarsh Drive EB B (15.2s)
A
(13.3s)
A (2.9s)
A
(9.2s)
A (10.9s)
A
(12.0s) Launceston Street SB B (18.3s) A (16.0s) A (12.5s)
Hindmarsh Dr WB A (12.3s) A (12.0s) A (12.5s)
Eggleston
Crescent
Hindmarsh Drive EB F (144s)
D
(47.8s)
F (131s)
D
(43.7s)
F (137s)
D
(46.5s)
Eggleston Crescent
NB D (54.6s) C (38.7s) D (55.3s)
Hindmarsh Dr WB A (3.6s) A (3.7s) A (3.7s)
Note: Average of 5 seed runs

AECOM
Hindmarsh Drive Intersection Upgrades – Tuggeranong Parkway to Eggleston
Crescent
P:\CBR\60336615_Hindmarsh_Drive_Upgrade\8. Issued Docs\8.1 Reports\60336615_2.2 Hindmarsh Dr.docx Revision 4 – 11-Aug-2015 Prepared for – Roads ACT – ABN: 37 307 569 373
35
An examination of the results of the analysis highlights the following:
- Overall: Option 1C provides a better outcome than 1B (and 1A), in terms of less delays for all movements in
both peaks, so this is the preferred option moving forward to subsequent analyses with combinations of
improvements at Launceston Street and Eggleston Crescent.
- Tuggeranong Parkway (Eastern ramp): With the proposed improvements, the eastern ramp will operate
satisfactorily in both peaks; the queues will be manageable, with significant spare capacity on Hindmarsh
Drive. There would be less delays and queues in Option 1C.
- Launceston Street: There would be a noticeable reduction in delays to right turners in the AM peak, due to
more gaps with the signalisation of the left turns at the Eastern Ramp.
- Eggleston Crescent: There would be minor improvements in delays for turning traffic.
7.2.1.2 Options 1C and 2A (signalised left-turn at Ramp and signalise Launceston)
This combination option involves improvements at the Eastern Ramp and Launceston Street intersections – both
involve signalisation. Table 25 and Table 26 provide a comparison of the peak hour delay and level of service
analysis results for Option 1C (1C3) with and without signals at Launceston Street.
An examination of the results of the analysis highlights the following:
- Overall: This shows increased delays at all intersections in both the AM peak and PM peaks.
- Tuggeranong Parkway (Eastern ramp): The signalisation of Launceston Street shows some
improvements in the operation of the Ramp approach in the PM peak, but generally some deterioration in
other movements.
- Launceston Street: With signalisation of this intersection, there would be increased in delays in both the
AM and PM peaks, particularly on Hindmarsh Drive.
- Eggleston Crescent: Little change in AM peak operations, but increased delays in the PM peak.
Table 25 2031 AM Option 1C with 2A Intersection Delays and Level of Service by Approach
Hindmarsh Drive Intersection
Approach
2031 Option 1C 2031 Option 1C+2A
Level of Service (Delay)
8:00- 9:00
Tuggeranong
Parkway
(Eastern
Ramp)
Hindmarsh Drive EB A (8.6s)
B
(16.1s)
A (11.6s)
B
(17.1s) Eastern Ramp SB B (18.5s) B (19.3s)
Hindmarsh Dr WB B (27.9s) B (25.2s)
Launceston
Street
Hindmarsh Drive EB A (2.8s) A
(11.2s)
B (17.4s) C
(28.7s) Launceston Street SB C (31.4s) D (49.7s)
Hindmarsh Dr WB C (31.7s) E (57.0s)
Eggleston
Crescent
Hindmarsh Drive EB A (8.0s)
A
(6.6s)
A (9.4s)
A
(7.5s) Eggleston Crescent NB A (3.8s) A (3.4s)
Hindmarsh Dr WB A (3.1s) A (3.0s)
Note: Average of 5 seed runs

AECOM
Hindmarsh Drive Intersection Upgrades – Tuggeranong Parkway to Eggleston
Crescent
P:\CBR\60336615_Hindmarsh_Drive_Upgrade\8. Issued Docs\8.1 Reports\60336615_2.2 Hindmarsh Dr.docx Revision 4 – 11-Aug-2015 Prepared for – Roads ACT – ABN: 37 307 569 373
36
Table 26 2031 PM Option 1C with 2A Intersection Delays and Level of Service by Approach
Hindmarsh Drive Intersection
Approach
2031 Option 1C 2031 Option 1C+2A
Level of Service (Delay)
17:00- 18:00
Tuggeranong
Parkway
(Eastern
Ramp)
Hindmarsh Drive EB C (28.9s)
B
(24.7s)
C (29.1s)
B
(26.6s) Eastern Ramp SB D (42.0s) B (22.0s)
Hindmarsh Dr WB B (19.0s) C (41.8s)
Launceston
Street
Hindmarsh Drive EB A (10.9s) A
(12.0s)
B (26.8s) D
(43.3s) Launceston Street SB A (12.5s) D (47.5s)
Hindmarsh Dr WB A (12.5s) D (50.9s)
Eggleston
Crescent
Hindmarsh Drive EB F (137s)
D
(46.5s)
F (149s)
D
(50.9s) Eggleston Crescent NB D (55.3s) F (72.6s)
Hindmarsh Dr WB A (3.7s) A (3.7s)
7.2.1.3 Options 1C, 2A and 3A (signalise all intersections)
This combination option involves signalisation of all three subject intersections, with staged pedestrian crossings
of Hindmarsh Drive. Table 27 and Table 28 provide a comparison of the peak hour delay and level of service
analysis results for Option 1C (1C3) with and without signals at Launceston Street and Eggleston Crescent.
An examination of the results of the analysis highlights the following:
- Overall: This generally shows an increase in delays as a result of signalising Eggleston Crescent, other than
the PM peak.
- Tuggeranong Parkway (Eastern ramp): There would be increased delays here in both peak periods as a
result of signalising Eggleston Crescent.
- Launceston Street: There would be increased delays here in both peak periods as a result of signalising
Eggleston Crescent.
- Eggleston Crescent: There would be some reduction in PM peak delays here, largely due to improved
management of right turn queues on the eastbound Hindmarsh Drive carriageway.
Table 27 2031 AM Option 1C + 2A + 3A Intersection Delays and Level of Service by Approach
Hindmarsh Drive Intersection
Approach
2031 Option 1C 2031 Option 1C+2A+3A
Level of Service (Delay)
8:00- 9:00
Tuggeranong
Parkway
(Eastern
Ramp)
Hindmarsh Drive EB A (8.6s)
B
(16.1s)
A (13.4s)
B
(22.4s) Eastern Ramp SB B (18.5s) B (18.9s)
Hindmarsh Dr WB B (27.9s) D (42.4s)
Launceston
Street
Hindmarsh Drive EB A (2.8s)
A
(11.2s)
B (17.4s)
C
(29.5s) Launceston Street SB C (31.4s) D (49.7s)
Hindmarsh Dr WB C (31.7s) E (60.2s)
Eggleston
Crescent
Hindmarsh Drive EB A (8.0s)
A
(6.6s)
D (54.9s)
D
(43.9s) Eggleston Crescent NB A (3.8s) D (47.6s)
Hindmarsh Dr WB A (3.1s) A (10.5s)

AECOM
Hindmarsh Drive Intersection Upgrades – Tuggeranong Parkway to Eggleston
Crescent
P:\CBR\60336615_Hindmarsh_Drive_Upgrade\8. Issued Docs\8.1 Reports\60336615_2.2 Hindmarsh Dr.docx Revision 4 – 11-Aug-2015 Prepared for – Roads ACT – ABN: 37 307 569 373
37
Table 28 2031 PM Option 1C + 2A + 3A Intersection Delays and Level of Service by Approach
Hindmarsh Drive Intersection
Approach
2031 Option 1C 2031 Option 1C+2A+3A
Level of Service (Delay)
17:00- 18:00
Tuggeranong
Parkway
(Eastern
Ramp)
Hindmarsh Drive EB C (28.9s)
B
(24.7s)
C (28.7s)
B
(25.7s) Eastern Ramp SB D (42.0s) D (42.6s)
Hindmarsh Dr WB B (19.0s) C (28.7s)
Launceston
Street
Hindmarsh Drive EB A (10.9s)
A
(12.0s)
A (13.0s)
C
(34.1s) Launceston Street SB A (12.5s) D (47.5s)
Hindmarsh Dr WB A (12.5s) D (43.7s)
Eggleston
Crescent
Hindmarsh Drive EB F (137s)
D
(46.5s)
D (49.6s)
C
(36.9s) Eggleston Crescent NB D (55.3s) E (65.0s)
Hindmarsh Dr WB A (3.7s) D (49.6s)
A further (PM peak) test was undertaken with provision for a full pedestrian crossing of Hindmarsh Drive at the
Eggleston Street intersection. The results of this test are summarised in Table 29. This shows that the intersection
of Eggleston Crescent would not be able to operate satisfactorily with a full crossing.
Table 29 2031 Option 1C + 2A + 3A Delays and Level of Service - Staged or Full Pedestrian Crossing
Hindmarsh Drive Intersection
Approach
2031 Option 1C+2A+3A
Level of Service (Delay)
Staged Pedestrian Crossings
Full Pedestrian Crossing at Eggleston
Tuggeranong
Parkway
(Eastern Ramp)
Hindmarsh Drive EB C (28.7s)
B
(25.7s)
C (29.0s)
B
(24.1) Eastern Ramp SB D (42.6s) C (41.4s)
Hindmarsh Dr WB C (28.7s) B (17.8s)
Launceston
Street
Hindmarsh Drive EB A (13.0s)
C
(34.1s)
A (12.7s)
C
(33.4) Launceston Street SB D (47.5s) D (47.4s)
Hindmarsh Dr WB D (43.7s) D (43.4s)
Eggleston
Crescent
Hindmarsh Drive EB D (49.6s)
C
(36.9s)
D (53.4s)
F
(107.3)
Eggleston Crescent
NB E (65.0s) E (62.9s)
Hindmarsh Dr WB D (49.6s) F (138s)
Note: average of 5 seed runs
7.2.2 Network performance
Table 30 provides an overall comparison of each of the options that were tested, in terms of the amount of travel
and average speed in the modelled network. It shows that Option 1C (signalisation of left-turn at Eastern Ramp)
would provide the best outcome in terms of these performance measures, closely followed by do nothing. It shows
that the signalisation of Launceston Street and Eggleston Crescent will result in increased delays, so signals here
would need to be justified by potential crash reductions.

AECOM
Hindmarsh Drive Intersection Upgrades – Tuggeranong Parkway to Eggleston
Crescent
P:\CBR\60336615_Hindmarsh_Drive_Upgrade\8. Issued Docs\8.1 Reports\60336615_2.2 Hindmarsh Dr.docx Revision 4 – 11-Aug-2015 Prepared for – Roads ACT – ABN: 37 307 569 373
38
Table 30 Amount of peak hour travel in study area road network
Peak
Hour Travel Indicator
2031
Do
Nothing
2031
Option
1A
2031
Option
1B
2031
Option
1C
2031
Option
1C +
2A
2031
Option
1C+2A+3A
AM Vehicle Kilometres Travelled
(VKT) 13115 13128 13132 13,120 13114 13113
Vehicle Hours Travelled (VHT) 265.5 266.0 257.4 255.8 278.0 297.0
Ave speed (km/h) 52.2 52.0 52.9 53.0 49.3 46.3
PM Vehicle Kilometres Travelled
(VKT) 12138 12154 12165 12192 12174 12191
Vehicle Hours Travelled (VHT) 279.5 302.5 291.0 278.2 320.0 321.0
Ave speed (km/h) 48.8 46.0 47.3 48.3 45.6 46.7
AM & PM Ave speed (km/h) 50.5 49.0 50.1 50.7 47.5 46.5
Note: Modelling results for Option 1C are based on 1C3.
7.2.3 Expected Crash Reductions
The potential annual crash reductions for each intersection option are detailed in Chapter 6 and summarised in
Table 31. Only crashes of the particular type identified and on the correct approach to be affected by the option
were considered targeted crashes for reduction. This shows that signals at the Eastern ramp are likely to be
highly effective at reducing crashes here, but not at the Launceston Street and Eggleston Crescent intersections.
Table 31 Summary of potential average crash reductions per annum
Crash Type Eastern Ramp Launceston Street
(Option 2A)
Eggleston Crescent
(Option 3A) Option 1A Option 1B/1C
Rear-end 30.6
(90% of 170/5)
30.6
(90% of 170/5)
-0.6
(-40% of 8/5)
-1.0
(-40% of 12/5)
Lane change 0.5
(60% of 4/5)
0.6
(80% of 4/5)
- -
Adjacent approach 0.2
(90% of 1/5)
0.2
(90% of 1/5)
0.8
(70% of 6/5)
0.8
(70% of 6/5)
Opposing turn - - 0.2
(45% of 2/5)
0.9
(45% of 10/5)
Totals 31.3 31.4 0.4 0.7
Note: A negative reduction indicates an increase in these crashes.
7.2.4 Cost benefit appraisal
The CBA undertaken for this study follows guidelines set out by Australian Transport Council’s National
Guidelines for Transport System Management (2006), the ACT Cost Benefit Analysis Assumption Guide (2009)
as well as assumptions sourced from the NSW Roads and Traffic Authority (RTA) Economic Analysis Manual
(1999)7.
7 Whilst the main section of the RTA Economic Analysis Manual Version 2 was published in 1999, the Appendix in which
assumptions parameters are referenced in CBAs has undergone numerous revisions and updates since then. The latest revised Appendix B was published on 24
th December 2009 – which has been the source of assumptions employed in this CBA.

AECOM
Hindmarsh Drive Intersection Upgrades – Tuggeranong Parkway to Eggleston
Crescent
P:\CBR\60336615_Hindmarsh_Drive_Upgrade\8. Issued Docs\8.1 Reports\60336615_2.2 Hindmarsh Dr.docx Revision 4 – 11-Aug-2015 Prepared for – Roads ACT – ABN: 37 307 569 373
39
The evaluation was conducted on the following design options against the base case do-nothing scenario:
- Option 1A: This treatment closes the south to eastbound left turn slip lane onto Hindmarsh Drive and
implements a new short left turn lane on the western side of the island (see Figure 19)
- Option 1B: Again the left turn slip lane is closed off. A new left turn lane will be located on the western side
of the current island and this lane will be continuous. The middle lane (left turn, right turn and straight
through) will also be continuous. A new right turn lane will be created (see Figure 20).
- Option 1C: A new second left turn lane will be located on the western side of the current island and this lane
will be continuous. The far-side lane (left turn, right turn and straight through) will also be continuous. A new
right turn lane will be created (see Figure 21).
- Option 2A: Involves signalising the Hindmarsh Drive / Launceston Street intersection using it’s current
configuration (see Figure 22).
- Option 3A: involves signalising the Hindmarsh Drive / Eggleston Crescent intersection using it’s current
configuration.
7.2.4.1 Assumptions
Key assumptions used in the CBA are summarised in Table 32. Note that no allowance has been made for
environmental externalities nor impacts on buses, as these will be minor in the overall evaluation of the options
considered in this report. Note that the data from the Paramics modelling summarised in Table 30 was used to
estimate changes in travel for each individual options.
Table 32 Key CBA assumptions
Assumption Value
General parameters
Price year 2014
Real discount rate 7%
Evaluation period 20 years
Benefit realisation start date and duration 1st January 2017, 19 years
Timing
Construction start date and duration 1st January 2016; 1year
Road maintenance start date 1st January 2017
Traffic parameters
Peak hour traffic volume annual expansion factor 2,450
Mean vehicle occupancy – car/bus 1.2 / 20
Cumulative annual growth rate (CAGR) of traffic volume 0.5%
Value of time $ 14.20 / person hour
Vehicle operating costs (car - bus) $ 0.31-6.5 / km
Construction costs
Option 1A $ 450,000
Option 1B $ 475,000
Option 1C $ 500,000
Option 2A $ 350,000
Option 3A $ 350,000
Construction cost contingency 40%

AECOM
Hindmarsh Drive Intersection Upgrades – Tuggeranong Parkway to Eggleston
Crescent
P:\CBR\60336615_Hindmarsh_Drive_Upgrade\8. Issued Docs\8.1 Reports\60336615_2.2 Hindmarsh Dr.docx Revision 4 – 11-Aug-2015 Prepared for – Roads ACT – ABN: 37 307 569 373
40
Assumption Value
Maintenance costs
Maintenance cost related to maintenance of concrete and
asphalt
10% of capital cost over 20 years
Crash reductions
Refer Section 7.1.4 Refer Appendix A for crash costs
Source AECOM
7.2.4.2 Results
The results of the economic appraisal is summarised in Table 2 and Table 33. Note that this appraisal only
includes quantifiable benefits and does not account for additional benefits due to a local redistribution of traffic
that will occur with new signals at Launceston Street and Eggleston Crescent. A discussion of other non-
quantitative impacts is included in Chapter 9.
Table 33 Incremental costs and benefits
Item Option 1A
($000)
Option 1B
($000)
Option 1C
($000)
Option
1C+2A ($000)
Option
1C+2A+3A
($000)
Capital cost 367 388 408 694 980
Maintenance Cost 18 18 18 28 38
Total Cost 385 406 299
Journey time savings (2,659) (385) 1,245 (3,111) (4,197)
Vehicle operating cost
savings (86) (131) (175) 2,850 2,802
Accident cost savings 5,329 5,359 5,359 5,844 6,232
NPV ($000) 2,199 4,437 6,002 4,861 3,819
BCR 6.7 11.9 15.1 7.7 4.8
Note: Based on 7% discount rate
The overall outcome shows that Option 1C is preferable to Option 1A or 1B at the Eastern Ramp intersection. All
options other than 1B and 1C show relatively high travel time costs, adversely affecting the potential economic
outcome.
The combination options tested showed that they could generate a positive economic return, largely driven by
crash savings, but also some savings in bus operating costs by enabling rerouting of routes 21 and 22. Increased
delays to Hindmarsh Drive traffic as a result of new traffic signals offsets the potential crash savings.

AECOM
Hindmarsh Drive Intersection Upgrades – Tuggeranong Parkway to Eggleston
Crescent
P:\CBR\60336615_Hindmarsh_Drive_Upgrade\8. Issued Docs\8.1 Reports\60336615_2.2 Hindmarsh Dr.docx Revision 4 – 11-Aug-2015 Prepared for – Roads ACT – ABN: 37 307 569 373
41
Sensitivity tests for Options 1C with alternative discount rates, construction costs and accident cost savings
shows that the proposed works are strongly justified over a range of assumptions, as shown in Table 34.
Table 34 Sensitivity analyses for Option 1C
Case Option 1C
BCR
Base case 15.1
Discount rate 4% 19.2
Discount rate 10% 12.2
Construction cost up (+20%) 12.7
Construction cost down (-30%) 21.2
Crash savings down (-20%) 12.6
Crash savings down (-100%) 8.8
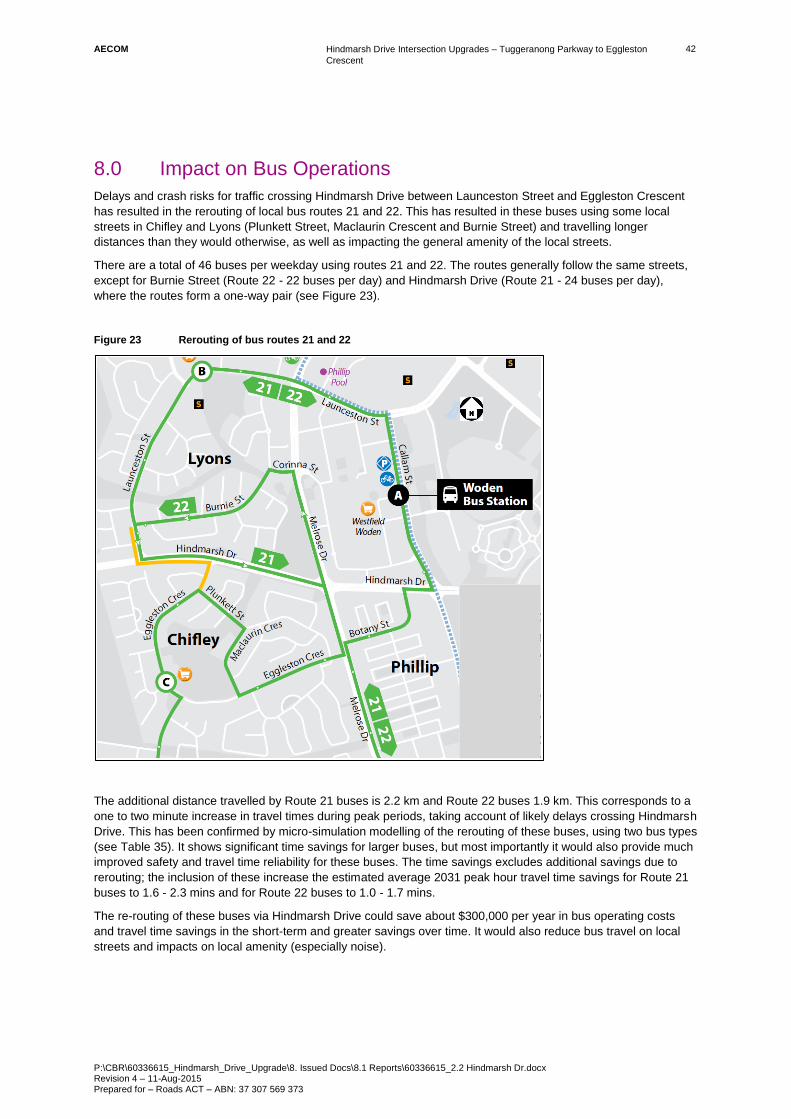
AECOM
Hindmarsh Drive Intersection Upgrades – Tuggeranong Parkway to Eggleston
Crescent
P:\CBR\60336615_Hindmarsh_Drive_Upgrade\8. Issued Docs\8.1 Reports\60336615_2.2 Hindmarsh Dr.docx Revision 4 – 11-Aug-2015 Prepared for – Roads ACT – ABN: 37 307 569 373
42
8.0 Impact on Bus Operations
Delays and crash risks for traffic crossing Hindmarsh Drive between Launceston Street and Eggleston Crescent
has resulted in the rerouting of local bus routes 21 and 22. This has resulted in these buses using some local
streets in Chifley and Lyons (Plunkett Street, Maclaurin Crescent and Burnie Street) and travelling longer
distances than they would otherwise, as well as impacting the general amenity of the local streets.
There are a total of 46 buses per weekday using routes 21 and 22. The routes generally follow the same streets,
except for Burnie Street (Route 22 - 22 buses per day) and Hindmarsh Drive (Route 21 - 24 buses per day),
where the routes form a one-way pair (see Figure 23).
Figure 23 Rerouting of bus routes 21 and 22
The additional distance travelled by Route 21 buses is 2.2 km and Route 22 buses 1.9 km. This corresponds to a
one to two minute increase in travel times during peak periods, taking account of likely delays crossing Hindmarsh
Drive. This has been confirmed by micro-simulation modelling of the rerouting of these buses, using two bus types
(see Table 35). It shows significant time savings for larger buses, but most importantly it would also provide much
improved safety and travel time reliability for these buses. The time savings excludes additional savings due to
rerouting; the inclusion of these increase the estimated average 2031 peak hour travel time savings for Route 21
buses to 1.6 - 2.3 mins and for Route 22 buses to 1.0 - 1.7 mins.
The re-routing of these buses via Hindmarsh Drive could save about $300,000 per year in bus operating costs
and travel time savings in the short-term and greater savings over time. It would also reduce bus travel on local
streets and impacts on local amenity (especially noise).

AECOM
Hindmarsh Drive Intersection Upgrades – Tuggeranong Parkway to Eggleston
Crescent
P:\CBR\60336615_Hindmarsh_Drive_Upgrade\8. Issued Docs\8.1 Reports\60336615_2.2 Hindmarsh Dr.docx Revision 4 – 11-Aug-2015 Prepared for – Roads ACT – ABN: 37 307 569 373
43
Table 35 2031 peak hour travel times for Dart and Scania buses
Movement Peak Hour Dart Mins Scania Mins
No Signals Signals No Signals Signals
Burnie Street to Plunkett
Street (Route 21)
AM 1.83 3.00 2.83 3.08
PM 3.32 2.05 3.60 1.85
Average 2.57 2.53 (+0.04) 3.22 2.47 (+0.75)
Plunkett Street to Burnie
Street (Route 22)
AM 1.62 1.68 3.13 1.88
PM 1.80 2.37 2.65 3.15
Average 1.71 2.03 (-0.32) 2.89 2.52 (+0.37)
Note: 1. Travel time is measured on the orange route in Figure 23, using the results of three simulation runs
2. Overall time savings shown in parentheses
3. This excludes additional distance and time savings due to the rerouting of routes 21 and 22, estimated to be 1.5 mins
A test of the economics of the combination options with and without rerouting of buses shows a significant
improvement in the benefit provided by traffic signals at Launceston Street and Eggleston Crescent (see
Table 36). The signals cannot be justified alone and rely on significant benefits at the Ramp intersection and
benefits due to reducing operating costs from rerouting local buses. There may also be some additional benefits
from increased patronage due to reduced travel times and greater convenience for bus passengers.
Table 36 Sensitivity analyses with potential savings in bus operations
Item Option 1C+2A ($000) Option 1C+2A+3A ($000)
No bus
savings
With bus
savings
No bus
savings
With bus
savings
Capital cost 694 694 980 980
Maintenance Cost 28 28 38 38
Total Cost
Journey time savings (3,757) (3,111) (4,843) (4,197)
Vehicle operating cost
savings (104) 2,850 (152) 2,802
Accident cost savings 5,844 5,844 6,232 6,232
NPV ($000) 1,261 4,861 219 3,819
BCR 2.8 7.7 1.2 4.8
Note: Based on 7% discount rate

AECOM
Hindmarsh Drive Intersection Upgrades – Tuggeranong Parkway to Eggleston
Crescent
P:\CBR\60336615_Hindmarsh_Drive_Upgrade\8. Issued Docs\8.1 Reports\60336615_2.2 Hindmarsh Dr.docx Revision 4 – 11-Aug-2015 Prepared for – Roads ACT – ABN: 37 307 569 373
44
9.0 Other Impacts
The economic appraisal included in Chapter 7 only includes quantifiable benefits and does not account for
additional benefits due to a local redistribution of traffic that will occur with new signals at Launceston Street and
Eggleston Crescent. There is a range of other non-quantifiable or difficult to quantify benefits, as follows:
- Increased bus patronage and revenue due to reduced travel times and greater time reliability
- Remove buses travelling along narrow residential streets, reducing noise and safety impacts
- Reduced local street travel and costs by car travellers avoiding delays turning right at Hindmarsh Drive,
which is particularly impactful on Lyons residents wanting to travel to Weston
- Increased accessibility for residents of Lyons and Chifley
- Increased commercial and community activity at Weston Group Centre due to better access to/from Lyons
and Chifley
These impacts are not insignificant in an economic and social sense.
AECOM
Hindmarsh Drive Intersection Upgrades – Tuggeranong Parkway to Eggleston
Crescent
P:\CBR\60336615_Hindmarsh_Drive_Upgrade\8. Issued Docs\8.1 Reports\60336615_2.2 Hindmarsh Dr.docx Revision 4 – 11-Aug-2015 Prepared for – Roads ACT – ABN: 37 307 569 373
45
10.0 Staging of Works
Preferably, all three sets of signal improvements should be undertaken concurrently under one contract, as this
would provide most benefits and would avoid multiple disruptions to Hindmarsh Drive traffic. The total cost of
these works is about $1.2M. The cost of signalising the intersections of Launceston Street and Eggleston
Crescent is about $0.35M, and modifications to the Ramp intersection about $0.5M. It is recommended that more
detailed design work be undertaken to better refine these cost estimates and to prepare designs suitable for early
implementation of these works.
The installation of traffic signals at the Launceston Street and Eggleston Crescent intersections will have most
benefits to the local community, many of which are difficult to quantify, so these should have priority if the works
are to be staged. Another consideration is the works at the ramp would result in increased delays and crash risks
at the Launceston Street intersection if it was not signalised at the same time or before the changes at the ramp
intersection.
Delays and queues at Eggleston Crescent are more problematic than at Launceston Street, so this needs to be
addressed as soon as practical. These problems will grow as Weston, Molonglo and Woden Town Centre grow.
They need to be addressed sooner rather than later.

AECOM
Hindmarsh Drive Intersection Upgrades – Tuggeranong Parkway to Eggleston
Crescent
P:\CBR\60336615_Hindmarsh_Drive_Upgrade\8. Issued Docs\8.1 Reports\60336615_2.2 Hindmarsh Dr.docx Revision 4 – 11-Aug-2015 Prepared for – Roads ACT – ABN: 37 307 569 373
46
11.0 Conclusions and Recommendations
An economic appraisal of short-listed improvement options indicated that the signalisation of left turns at the
Eastern Ramp intersection is strongly justified from an economic sense, particularly in relation to crash savings. A
number of alternative layouts were tested here and an option that incorporates a separate lane and phasing for
left and right turns from the ramp is preferable. This would provide the best performance of all options tested,
enabling greater flexibility of phasing, especially in the PM peak.
New traffic signals at the Launceston Street and Eggleston Crescent intersections would assist bus movements
and will enable buses serving Lyons and Chifley to travel more directly between Lyons and Chifley. The re-routing
of these buses via Hindmarsh Drive could save about $300,000 per year in bus operating costs and travel time
savings in the short-term and greater savings over time. It would also reduce bus travel on local streets and
impacts on local amenity (especially noise).
The economic appraisal does not account for additional benefits due to a local redistribution of traffic that will
occur with new signals at Launceston Street and Eggleston Crescent. There is a range of other non-quantifiable
or difficult to quantify benefits, including increased bus patronage and revenue, reduced impacts on local
residential streets, increased accessibility for residents of Lyons and Chifley and greater commercial activity at
Weston Town Centre. These impacts are not insignificant in an economic and social sense.
It is recommended that all three sets of signal improvements should be constructed concurrently under one
contract, as this would provide most benefits and would avoid multiple disruptions to Hindmarsh Drive traffic. The
total cost of these works is about $1.2M. The cost of signalising the intersections of Launceston Street and
Eggleston Crescent is about $0.35M, and modifications to the Ramp intersection about $0.5M. It is recommended
that more detailed design work be undertaken to better refine these cost estimates and to prepare designs
suitable for early implementation of these works.
An economic appraisal of short-listed improvement options indicated that the signalisation of left turns at the
Eastern Ramp intersection is most strongly justified from an economic perspective. The preferred option at the
ramp intersection is illustrated below.
Option 1C4

AECOM
Hindmarsh Drive Intersection Upgrades – Tuggeranong Parkway to Eggleston
Crescent
P:\CBR\60336615_Hindmarsh_Drive_Upgrade\8. Issued Docs\8.1 Reports\60336615_2.2 Hindmarsh Dr.docx Revision 4 – 11-Aug-2015 Prepared for – Roads ACT – ABN: 37 307 569 373
A
Appendix A
Crash Costs for the ACT
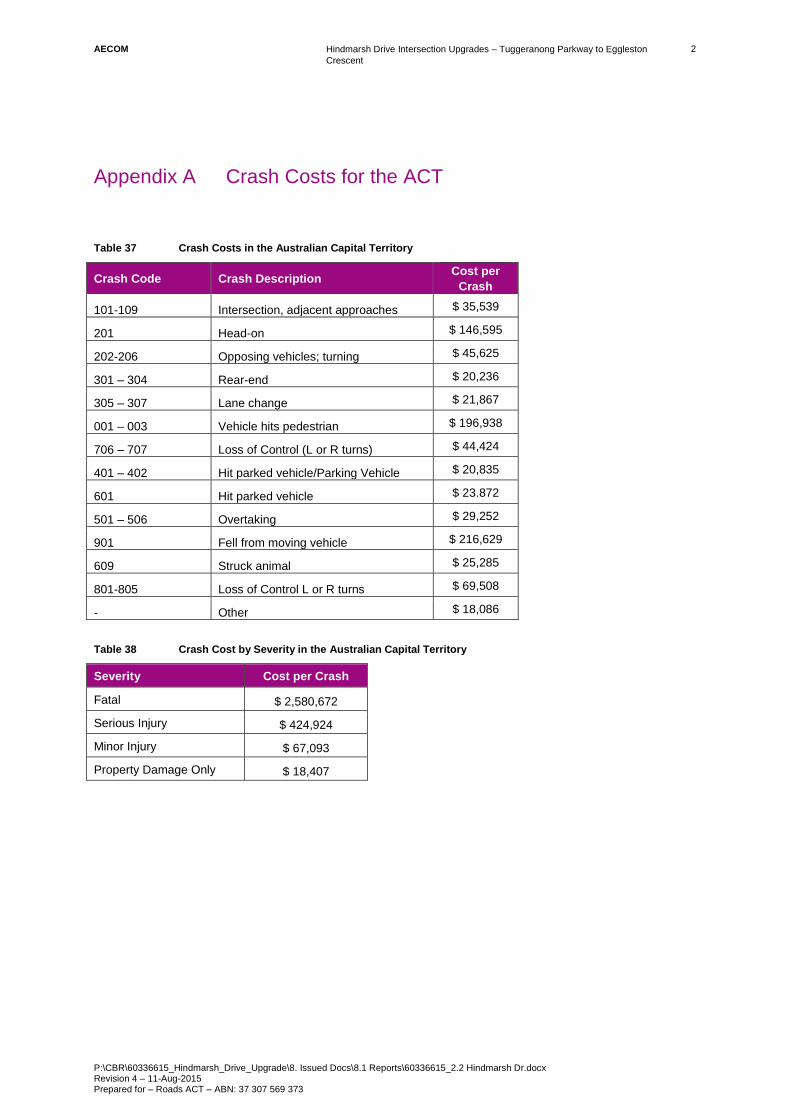
AECOM
Hindmarsh Drive Intersection Upgrades – Tuggeranong Parkway to Eggleston
Crescent
P:\CBR\60336615_Hindmarsh_Drive_Upgrade\8. Issued Docs\8.1 Reports\60336615_2.2 Hindmarsh Dr.docx Revision 4 – 11-Aug-2015 Prepared for – Roads ACT – ABN: 37 307 569 373
2
Appendix A Crash Costs for the ACT
Table 37 Crash Costs in the Australian Capital Territory
Crash Code Crash Description Cost per
Crash
101-109 Intersection, adjacent approaches $ 35,539
201 Head-on $ 146,595
202-206 Opposing vehicles; turning $ 45,625
301 – 304 Rear-end $ 20,236
305 – 307 Lane change $ 21,867
001 – 003 Vehicle hits pedestrian $ 196,938
706 – 707 Loss of Control (L or R turns) $ 44,424
401 – 402 Hit parked vehicle/Parking Vehicle $ 20,835
601 Hit parked vehicle $ 23.872
501 – 506 Overtaking $ 29,252
901 Fell from moving vehicle $ 216,629
609 Struck animal $ 25,285
801-805 Loss of Control L or R turns $ 69,508
- Other $ 18,086
Table 38 Crash Cost by Severity in the Australian Capital Territory
Severity Cost per Crash
Fatal $ 2,580,672
Serious Injury $ 424,924
Minor Injury $ 67,093
Property Damage Only $ 18,407

AECOM
Hindmarsh Drive Intersection Upgrades – Tuggeranong Parkway to Eggleston
Crescent
P:\CBR\60336615_Hindmarsh_Drive_Upgrade\8. Issued Docs\8.1 Reports\60336615_2.2 Hindmarsh Dr.docx Revision 4 – 11-Aug-2015 Prepared for – Roads ACT – ABN: 37 307 569 373
3
This page has been left blank intentionally.

AECOM
Hindmarsh Drive Intersection Upgrades – Tuggeranong Parkway to Eggleston
Crescent
P:\CBR\60336615_Hindmarsh_Drive_Upgrade\8. Issued Docs\8.1 Reports\60336615_2.2 Hindmarsh Dr.docx Revision 4 – 11-Aug-2015 Prepared for – Roads ACT – ABN: 37 307 569 373
Appendix B
Paramics Model Calibration Data
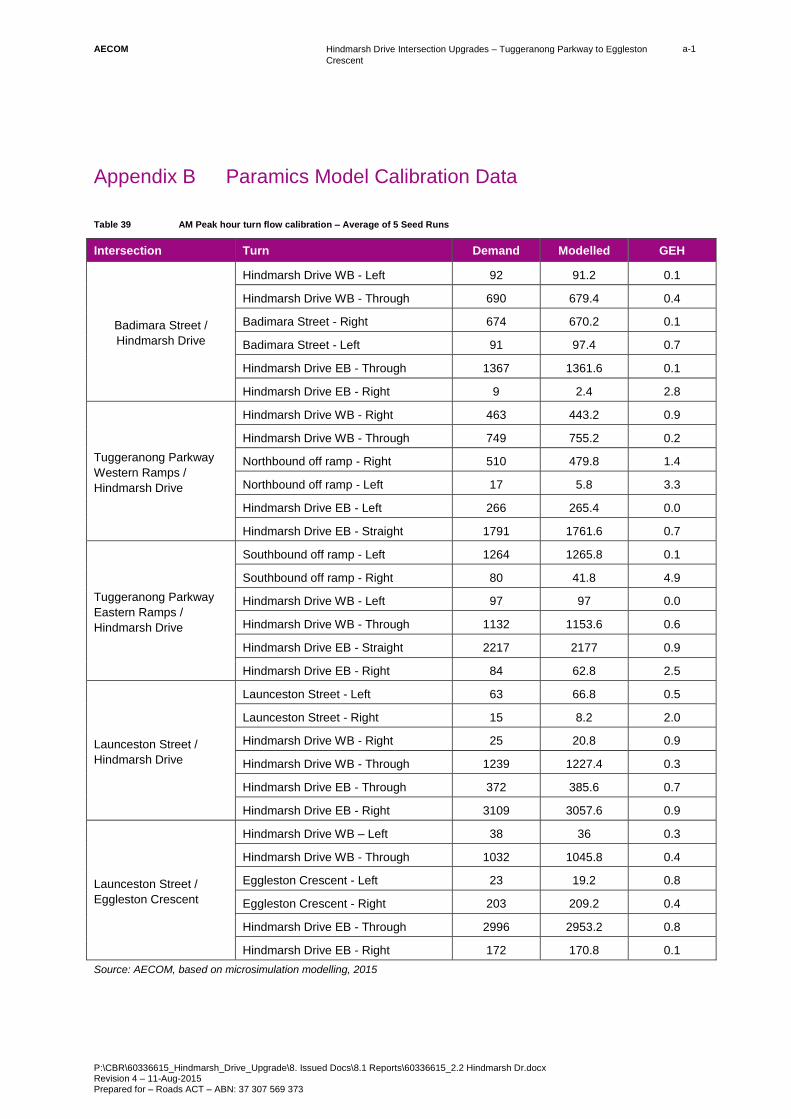
AECOM
Hindmarsh Drive Intersection Upgrades – Tuggeranong Parkway to Eggleston
Crescent
P:\CBR\60336615_Hindmarsh_Drive_Upgrade\8. Issued Docs\8.1 Reports\60336615_2.2 Hindmarsh Dr.docx Revision 4 – 11-Aug-2015 Prepared for – Roads ACT – ABN: 37 307 569 373
a-1
Appendix B Paramics Model Calibration Data
Table 39 AM Peak hour turn flow calibration – Average of 5 Seed Runs
Intersection Turn Demand Modelled GEH
Badimara Street /
Hindmarsh Drive
Hindmarsh Drive WB - Left 92 91.2 0.1
Hindmarsh Drive WB - Through 690 679.4 0.4
Badimara Street - Right 674 670.2 0.1
Badimara Street - Left 91 97.4 0.7
Hindmarsh Drive EB - Through 1367 1361.6 0.1
Hindmarsh Drive EB - Right 9 2.4 2.8
Tuggeranong Parkway
Western Ramps /
Hindmarsh Drive
Hindmarsh Drive WB - Right 463 443.2 0.9
Hindmarsh Drive WB - Through 749 755.2 0.2
Northbound off ramp - Right 510 479.8 1.4
Northbound off ramp - Left 17 5.8 3.3
Hindmarsh Drive EB - Left 266 265.4 0.0
Hindmarsh Drive EB - Straight 1791 1761.6 0.7
Tuggeranong Parkway
Eastern Ramps /
Hindmarsh Drive
Southbound off ramp - Left 1264 1265.8 0.1
Southbound off ramp - Right 80 41.8 4.9
Hindmarsh Drive WB - Left 97 97 0.0
Hindmarsh Drive WB - Through 1132 1153.6 0.6
Hindmarsh Drive EB - Straight 2217 2177 0.9
Hindmarsh Drive EB - Right 84 62.8 2.5
Launceston Street /
Hindmarsh Drive
Launceston Street - Left 63 66.8 0.5
Launceston Street - Right 15 8.2 2.0
Hindmarsh Drive WB - Right 25 20.8 0.9
Hindmarsh Drive WB - Through 1239 1227.4 0.3
Hindmarsh Drive EB - Through 372 385.6 0.7
Hindmarsh Drive EB - Right 3109 3057.6 0.9
Launceston Street /
Eggleston Crescent
Hindmarsh Drive WB – Left 38 36 0.3
Hindmarsh Drive WB - Through 1032 1045.8 0.4
Eggleston Crescent - Left 23 19.2 0.8
Eggleston Crescent - Right 203 209.2 0.4
Hindmarsh Drive EB - Through 2996 2953.2 0.8
Hindmarsh Drive EB - Right 172 170.8 0.1
Source: AECOM, based on microsimulation modelling, 2015

AECOM
Hindmarsh Drive Intersection Upgrades – Tuggeranong Parkway to Eggleston
Crescent
P:\CBR\60336615_Hindmarsh_Drive_Upgrade\8. Issued Docs\8.1 Reports\60336615_2.2 Hindmarsh Dr.docx Revision 4 – 11-Aug-2015 Prepared for – Roads ACT – ABN: 37 307 569 373
a-2
Table 40 PM Peak hour turn flow calibration – Average of 5 Seed Runs
Intersection Turn Demand Modelled GEH
Badimara Street /
Hindmarsh Drive
Hindmarsh Drive WB - Left 439 429.8 0.4
Hindmarsh Drive WB - Through 1274 1261.4 0.4
Badimara Street - Right 200 202.6 0.2
Badimara Street - Left 24 7.8 4.1
Hindmarsh Drive EB - Through 629 622 0.3
Hindmarsh Drive EB - Right 5 0 3.2
Tuggeranong Parkway
Western Ramps /
Hindmarsh Drive
Hindmarsh Drive WB - Right 1129 1019 3.4
Hindmarsh Drive WB - Through 1697 1692.6 0.1
Northbound off ramp - Right 130 124.2 0.5
Northbound off ramp - Left 15 4 3.6
Hindmarsh Drive EB - Left 99 103.4 0.4
Hindmarsh Drive EB - Straight 730 730.4 0.0
Tuggeranong Parkway
Eastern Ramps /
Hindmarsh Drive
Southbound off ramp - Left 647 635 0.5
Southbound off ramp - Right 252 252 2.0
Hindmarsh Drive WB - Left 345 342.8 0.0
Hindmarsh Drive WB - Through 2574 2560 0.3
Hindmarsh Drive EB - Straight 787 793.6 0.2
Hindmarsh Drive EB - Right 73 60 1.6
Launceston Street /
Hindmarsh Drive
Launceston Street - Left 69 59.8 1.1
Launceston Street - Right 68 55.6 1.6
Hindmarsh Drive WB - Right 36 28.8 1.3
Hindmarsh Drive WB - Through 2851 2850 0.0
Hindmarsh Drive EB - Through 112 120 0.7
Hindmarsh Drive EB - Right 1322 1302.2 0.5
Launceston Street /
Eggleston Crescent
Hindmarsh Drive WB – Left 56 61 0.7
Hindmarsh Drive WB - Through 2722 270.2 0.0
Eggleston Crescent - Left 8 0 4.0
Eggleston Crescent - Right 165 167.8 0.2
Hindmarsh Drive EB - Through 1246 1216 0.9
Hindmarsh Drive EB - Right 145 141.2 0.3
Source: AECOM, based on microsimulation modelling, 2015


![Adaptive Estimation of Firing Patterns of Hindmarsh-Rose ......series data. Hindmarsh-Rose model (HR model) (Belykh[1,2005]) Dynamics of Hindmarsh-Rose model •It is known that the](https://static.documents.pub/doc/80x56/5ffaeaeeb3130926e0079101/adaptive-estimation-of-firing-patterns-of-hindmarsh-rose-series-data-hindmarsh-rose.jpg)


