Hippocampal MRI and other structural biomarkers: experimental approach to epileptogenesis
MRI represents one of the methods of choice for the study of experimental models of epilepsy. Indeed, it is a repeatable, noninvasive method that can be applied in animal models of epilepsy at critical steps of the process of epileptogenesis. Moreover, a significant advantage of MRI is the ability to extract different levels of contrast with reasonable anatomical and physiological resolution. The first imaging studies on experi-mental models of epilepsy and epilepto genesis using T
1- and T
2-weighted imaging started in
the early 1990s. While there are many possible contrast levels and techniques, the most com-monly used are T
1-weighted imaging (T
1WI),
T2-weighted imaging (T
2WI) and diffusion-
weighted imaging (DWI). The latter technique showed improved contrast for edematous tis-sue compared with T
1WI and T
2WI. Other
approaches have been developed more recently and use diffusion tensor imaging (DTI) and tractography to follow the trajectory of fiber tracts and hence the plasticity leading to the reconstruction of circuits during the epilepto-genic process. In vivo nuclear magnetic reso-nance spectroscopy (MRS) has been less com-monly used. The imaging techniques listed above allow characterization of the cellular, energetic and metabolic derangement, together with brain injury associated with seizures and their consequences.
A large number of studies using imaging tech-niques have been undertaken in animal models of temporal lobe epilepsy resulting from an ini-tial insult such as status epilepticus (SE) induced by kainate, pilocarpine or soman, by traumatic brain injury (TBI) or by febrile seizures. In these models, the initial event (SE, trauma or febrile seizures) is, as in a number of human cases of temporal lobe epilepsy, followed by a period of latency characterized by plasticity phenomena that lead to the formation of a hyperexcitable circuit underlying the occurrence of sponta-neous seizures during the chronic phase [1–4]. The plasticity phenomena occurring during the latency phase include mainly acute and delayed neuronal loss, inflammation, neurogenesis, axo-nal and dendritic plasticity, molecular reorga-nization, neurogenesis and gliosis [5]. All these processes ultimately lead to the development of an epileptic condition and represent the process of epileptogenesis that is defined as the develop-ment and extension of tissue capable of generat-ing spontaneous seizures [6]. Although intensive research is being undertaken to try to identify the critical factors involved in epileptogenesis as well as to prevent the process of epileptogen-esis, at the moment no specific mechanism has been identified as representing the key pathway underlying the transformation of normal into epileptic tissue. The main hope at this point
The present review is devoted to application of MRI techniques to the epileptic brain and the search for potential biomarkers of epileptogenicity and/or epileptogenesis in rodents that could be translated to the clinic. Diffusion-weighted imaging reveals very early changes in water movements. T2-weighted hypersignal indicates edema or gliosis within brain regions and is most often used along with histological assessment of neuronal loss. 31P magnetic resonance spectroscopy measures the energy reserve of the tissue while 1H spectroscopy assesses neuronal loss and mitochondrial dysfunction. 13C spectroscopy analyzes, separately, neuronal and astrocytic metabolism and interactions between the two cell types. Finally, diffusion tensor imaging and tractography have been applied to the study of plasticity and show a good coherence with circuit changes assessed by Timm staining. The potential of these techniques as reliable biomarkers of epileptogenesis is still disputed. At the moment, one study has provided a reliable temporal evolution of the T2 signal, predicting epileptogenesis in 100% of the cases, and further imaging approaches based on the techniques described here are still needed to identify potential early imaging biomarkers of epileptogenicity and/or epileptogenesis.
KEYWORDS: biomarker n epilepsy n epileptogenesis n magnetic resonance spectroscopy n metabolism n MRI n neuronal loss n plasticity
Astrid NehligINSERM U 666, Faculty of Medicine, 11 rue Humann, 67085 Strasbourg Cedex, France Tel.: +33 368 853 243 Fax: +33 368 853 256 [email protected]
Biomarkers Med. (2011) 5(5)586 future science group
Review Nehlig
is to identify a biomarker of epileptogenicity or epileptogenesis, as defined in the article by Engel in this issue of Biomarkers in Medicine, on the basis of animal studies [1]. This would then allow intervention immediately after the acute insult, before the plastic processes underlying epileptogenesis start, to prevent epilepsy, or to treat at critical steps of the process to decrease the deleterious consequences of the acute insult.
This will focus on the imaging studies performed during the various phases of the epilepto genic process, including the acute, latent and chronic period. In all these models attempts have been made to characterize the early events occurring during the initial insult, and these have tried to follow up the process of understanding whether it would be possible to predict epileptogenicity and/or epileptogenesis in animals presenting certain types of changes shortly after the onset of the initial insult. In this article, we will review the knowledge accumu-lated by means of nuclear magnetic resonance techniques (imaging and spectroscopy) in ani-mal models of temporal lobe epilepsy. We will discriminate between the markers that reflect seizure activity and its consequences, and those that could be considered potential reliable bio-markers of epileptogenicity and/or epileptogen-esis. This article will only briefly address the technical points related to the different imag-ing and spectroscopy methods that have been used, and the reader is invited to refer to more technical reviews for detailed information on the methods.
Early events in relation to the initial insult: use of DWI, T1WI & T2WIThe early events characterizing the seizing brain have been mapped using T
2WI, DWI and more
rarely T1WI.
n Diffusion-weighted imagingThe use of DWI allows the recording of very early changes, usually before they can be detected by conventional T
1WI or T
2WI. It
is a noninvasive method of choice for detect-ing acute lesions caused by epilepsy and SE [7]. In DWI, contrast is modulated by molecular water diffusion. The quantitative measure of DWI is the computed apparent diffusion coef-ficient (ADC) value. A change in ADC implies that water diffusion is altered as a result of biophysical changes.
Most DWI studies of epilepsy found a reduc-tion in ADC early after seizure induction, often with a return to control values within
approximately 1–7 days after the insult. This is the case for soman- [8,9], pilocarpine- [7,10,11], lithium-pilocarpine- [12], kainate- [13–15], and bicuculline-induced SE [16]. A more recent study reported even earlier ADC changes in the pilo-carpine SE model. The seizure-induced ADC decrease appears to be preceded by a significant increase starting at 3 min after SE onset and lasting for 10 min. ADC values then decrease and follow a time course similar to the one described in earlier studies. The authors also found a good correlation between the maximal ADC decrease and late neuronal loss in the six structures studied (i.e., parietal, temporal and piriform cortex, hippocampus, amygdala and thalamus) [17]. Altogether, the time course of ADC changes varies with the model studied but, although seizure models are variable, an amazing consensus reported that ADC values decreased early after onset of epileptiform activ-ity. Many studies were limited to 1–7 days after seizure activity, when most acute DWI changes resolved to control levels [7,14,15]. In many of these studies, correlative histology was per-formed and revealed seizure-induced neuronal loss. However, none of these studies were able to correlate the early ADC changes with the epileptic outcome, and hence at this point the assessment of water diffusion changes at early time points after seizure onset cannot be used as a reliable biomarker for epileptogenesis.
n T1-weighted imagingT
1-weighted imaging is the proton relaxation
when 63% of the magnetic resonance (MR) signal is restored. The efficiency of energy transport between proton spins and brain tis-sue determines T
1 relaxation time. Other factors
that can influence T1 are molecular motion such
as temperature and the structure and physical state of the tissue: T
1 is higher in solids and
pure liquids. In addition, as MR imagers move to higher field strength, T
1 values of tissues
become longer.There have been only a few studies that
investigated T1-related changes after seizures
or epilepsy. Brain volumetric studies of kai-nic acid-induced epileptiform activity utilized T
1WI and T
2WI to obtain high-resolution
volumetric MR images [18]. They showed a reduction in hippocampal volumes, with a concurrent increase in ventricular volumes. Another more common use for T
1WI is to use
T1 shortening contrast agents, such as gado-
linium complexes. Intravenously administered chelated organic gadolinium complexes are
www.futuremedicine.com 587future science group
Hippocampal MRI & other structural biomarkers: experimental approach to epileptogenesis Review
used as MRI contrast agents because of their paramagnetic properties. The gadolinium ion is quite toxic to mammals. However, che-lated gadolinium compounds are far less toxic because they carry gadolinium through the kidneys and out of the body before the free ion can be released into tissue. The use of this type of agent allows the assessment of blood–brain barrier (BBB) breakdown after an insult. For example, at 2 h after lithium-pilocarpine SE onset, contrast enhancement was visible in the thalamus, which resolved by 6 h after SE onset. This indicated that for a very short time period there was some leakage of the BBB following SE [19]. This imaging method can give relevant information on the early and later events result-ing from SE, but it is of limited interest as a potential biomarker for epileptogenesis.
n T2-weighted imagingT
2-weighted imaging reflects the time when
37% of the proton signal has fully relaxed. The interaction of proton spins determines the T
2
relaxation rate. Solids and large molecules have short T
2 relaxation times while small molecules
like water have long T2 relaxation times. Finally,
the presence of macromolecules in solution can also shorten T
2, but T
2 relaxation does not
depend on magnetic field strength.
T2 imaging studiesT
2-weighted imaging has been used extensively
in the study of epilepsy, often in conjunction with other imaging modalities such as DWI and assessment of neuronal loss. Many of the studies used T
2WI for ventricular [18] and lesion
volumes [19], edema formation [6,20], altered T2
signal [19–21] and quantitative T2 maps [10,21].
Quantitative T2 maps made in the pilocarpine
model at 12 h after the arrest of a 4 h episode of SE showed that increases in T
2 relaxation times
were highest in the hippocampus (200%), while the signal increased by 42–125% in various lay-ers of cingulate cortex and by 22% in the amyg-dala. These increases correlated with edema formation at this time point [10]. Altogether, it appears that altered T
2 signal intensities, and
their regional occurrence and duration, largely depend on the model, severity of seizures, region of interest, and time course of MR investigation. In addition, not all studies found an increase in T
2WI signal intensity. A few studies reported
decreased T2WI signal early after the onset of
severe seizures. This was the case in one study at 3–12 h after soman-induced SE in the rat [8] and in a second one at 3–5 h after SE onset in the
lithium-pilocarpine model [12]. The reasons for the discrepancy in early T
2 data within a given
model are not clear.Finally, the interpretation of T
2 increase a few
days after SE as a marker of irreversible cell death has been challenged in some models [22,23]. A study combining three imaging modalities in a model of SE induced by electrical stimulation of the amygdala showed increased T
1 and T
2 in the
primary focal area, the amygdala and connected regions such as the piriform cortex within 2 days after the insult. These early acute signal changes went almost completely back to baseline levels within 9 days and had a low predictive value for the subsequent severity of epilepsy and neuronal loss [23]. In experimental febrile seizures induced in postnatal day 11 rats, T
2 values increased in
the dorsal hippocampus, piriform cortex and amygdala but were not accompanied by neu-ronal injury or death [22]. Furthermore, in the rat amygdala kindling model T
2 increased in
the hippocampus although this model is asso-ciated with only minimal neuronal loss and tissue destruction [24]. These studies show that although signal changes occur after all insults leading to acute seizures, the interpretation of the MRI changes has to be carried out with great caution. Additionally, it is obvious that, conversely to the observations in stroke mod-els, a significant increase in T
2 early after the
insult cannot be considered to be a marker of irreversible neuronal or tissue damage [25]. The reasons for the discrepancies in the data from the different epilepsy models are unclear.
Time course of T2 signal changes: the adult & developing brainTwo representative studies performed a follow-up of the temporal evolution of T
2 relaxation
after pilocarpine or lithium-pilocarpine SE in adult rats. Increased T
2 values were observed in
piriform and entorhinal cortex, amygdala and thalamus as early as 2–3 h after SE onset and per-sisted for up to 7 days after pilocarpine-induced SE [7] and for 48–72 h after lithium-pilocar-pine-induced SE [19]. In the latter study, the T
2
signal reappeared at the onset of spontaneous seizures and progressively increased, reflecting ongoing gliosis and possibly further neuronal loss due to recurrent seizures [19]. Histological evaluation in both studies confirmed that the T
2 value elevation was likely due to edema for-
mation reflecting rapid neuronal loss and glial reactivity. Interestingly, in the study by Roch et al., the hippocampal T
2 signal increase was
delayed compared with the signal in temporal
Biomarkers Med. (2011) 5(5)588 future science group
Review Nehlig
cortices and started to be visible and measur-able only at about 2–3 days after the insult [19]. This hippo campal signal never disappeared, but rather increased over time, reflecting both edema and gliosis leading ultimately to hippo-campal sclerosis (Figure 1) [15]. In a similar fash-ion, in the study by Wall et al., a rapid decrease in ADC values was reported to occur within 3 h after SE onset in the piriform cortex that then slowly resolved to control values at 7 days, while the hippocampus was not as acutely affected and showed a slower increase in ADC values over the 7-day time course [7]. Thus, appar-ently in the pilocarpine models, the reactivity of the parahippocampal cortices precedes that of the hippocampus, and this differential time course of the signal is paralleled by a similarly different time course of neuronal loss. Indeed, Roch et al. showed that in the structures with an early increase in the T
2 signal (i.e., piriform
and entorhinal cortex and, to a more moderate
extent, amygdala and thalamus), neuronal loss was almost complete by 24 h after the initial SE [19]. The early increase in T
2 signal recorded
in these structures most likely reflects exten-sive and rapid necrosis [26–28] going on in these structures, which lose a very large part of their neuronal population in the first 24 h following the onset of the insult, as previously reported (Figure 1) [19,29]. On the contrary, in cornu ammo-nis (CA)-1 and more predominantly in CA3, neuronal loss was progressive and reached its final extent only at a point ranging from several days up to 1–2 weeks after the insult, consistent with the delay in the increase of the T
2 signal
(Figure 1) [19,29]. The reasons underlying these dif-ferent time courses and the specific vulnerability of parahippocampal cortices in this model have not yet been clarified.
However, the major limitation for finding a biomarker predictive of epilepsy in most models using adult animals subjected to an
HippCA1
CA3 Hilus
Hipp
EntPir
Pir Ent MRIMRI
Control
24 h
14 days
Epilepsy9 weeks
Layer II
LayerIII/IV
Layer IILayer III/IV
Figure 1. Temporal evolution of the T2‑weighted imaging and histology at the level of the hippocampus, piriform cortex and entorhinal cortex at 24 h (acute phase), 14 days (latent phase) and 9 weeks (chronic phase) after lithium‑pilocarpine status epilepticus induced in adult rats. Note the early T2 signal increase recorded in the cortices while there is no signal increase by 24 h in the hippocampus. The hippocampal signal appears between 48 and 72 h after status epilepticus onset and is clearly visible at 14 days post-status epilepticus during the latency phase, while the cortical signal has disappeared at that time point. During the chronic phase, at 9 weeks post-status epilepticus, the signal has intensified in the hippocampus while it has reappeared in the cortices. The early signals are rather indicative of tissue edema while the later ones indicate gliosis. In parallel with the MRI changes, the histology shows that by 24 h, the cortical (both piriform and entorhinal) tissue is already very much damaged and disorganized while the hippocampus remains preserved, with the exception of the hilus of the dentate gyrus. By 14 days, disorganization and damage has aggravated in the cortices and neuronal loss becomes visible in the hippocampus, mainly at the level of CA1. By 9 weeks damage has worsened in all regions and the hippocampus is dramatically shrinking, as can be seen in this extreme example. CA: Cornu ammonis; Ent: Entorhinal cortex; Hipp: Hippocampus; Pir: Piriform cortex.
www.futuremedicine.com 589future science group
Hippocampal MRI & other structural biomarkers: experimental approach to epileptogenesis Review
insult that will lead to temporal lobe epilepsy is that the insult is most often severe and, sub-sequently, all rats will develop epilepsy. This renders the search for an effective biomarker quite difficult. Moreover, the types of mod-els used differ, as detailed previously, and the duration of chemically- or electrically-induced SE is not uniform across the different stud-ies. Recently a model of temporal lobe epilepsy induced by TBI was developed in which only a percentage of the adult animals subjected to trauma develop epilepsy after a quite long latency, 7 weeks to 12 months [30]. After mod-erate TBI induced by lateral fluid-percussion, MRI signals (T
2 and a third of the trace of
the diffusion tensor [average diffusivity]) were quantified between 3 h and 11 months after TBI. Average diffusivity correlated with the total number of spikes, the total number of epileptiform discharges and the latency to the first spike as well as the severity of mossy fiber sprouting [31]. In the same model, this group reported that T
2 acquired 3 days postinjury
correlated with histologic lesion volume and neuro-motor performance. Imaging changes also successfully differentiated animals with mild compared with severe TBI, showing that quantitative T
2 relaxation time of the lesioned
region early after TBI can serve as an indicator of the severity of post-traumatic cortical dam-age and neuro-motor impairment [32]. Thus, the MRI changes recorded in this model by quantitative DWI can serve as:
� A tool to facilitate prediction of increased seizure susceptibility;
� A clinical marker for the identification of individuals with elevated risk of post-traumatic epilepsy.
However, at this point, they do not allow prediction of the process of epileptogenesis and the occurrence of epilepsy, and appear as a marker for comorbidity rather than as a predictor of epileptogenesis.
The clearest demonstration of a possible imaging biomarker of epileptogenesis was obtained in the lithium-pilocarpine model of epilepsy applied to immature rats. In this model, the induction of SE in adult animals leads to epilepsy in 100% of the rats. Conversely, in animals younger than 17–18 days at the time of the initial insult, only a subset of animals devel-ops recurrent seizures which are of the limbic type, mostly consisting of sharp waves recorded only in the hippocampus and accompanied by freezing or automatisms like chewing, licking,
or orienting reaction [33]. Spontaneous recur-rent seizures of the motor generalized convul-sive type (stage 3–5 of the Racine scale, con-sisting of clonic movements of the forepaws, hindpaws and falling) appear in rats subjected to SE after 18 days [33,34]. In rats subjected to lithium-pilocarpine SE at 21 days, between 37 and 73% of the rats develop spontaneous con-vulsive seizures [34–36]. We took advantage of the differential outcome of SE at that age and the fact that the noninvasive nature of struc-tural T
2WI allowed the long-term follow-up of
the animals to try to correlate early events and the development of epilepsy in a subset of rats. Early T
2WI signal appeared not to be homoge-
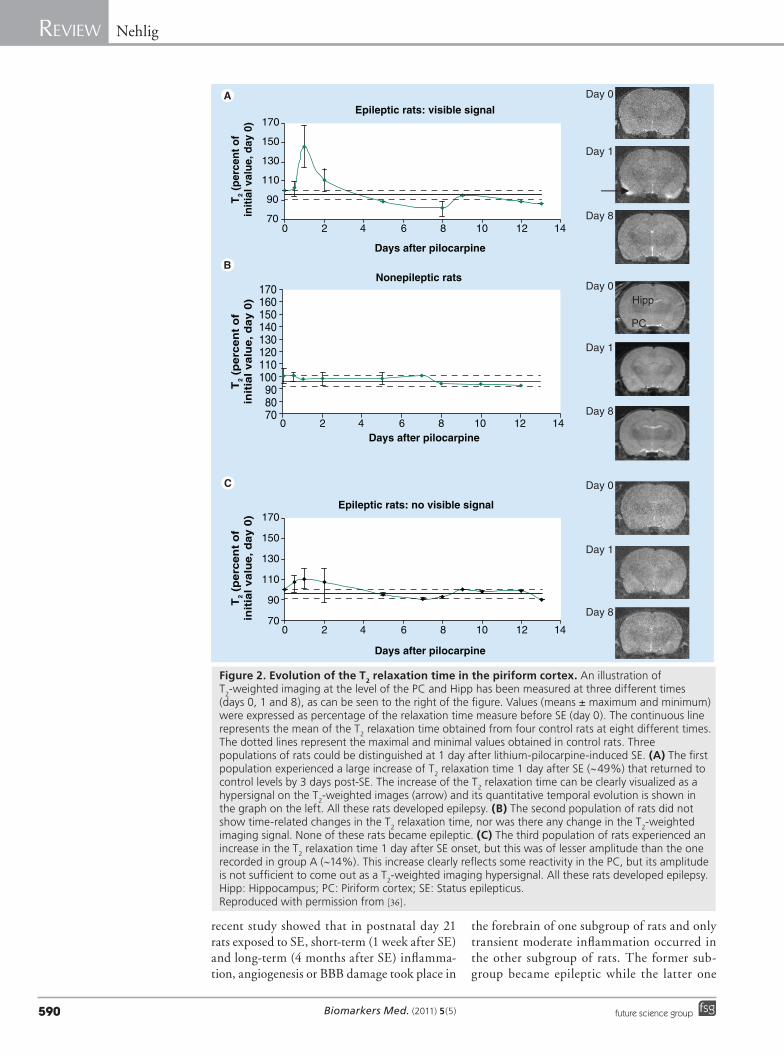
neous in this age group and the study allowed the distinguishing of two different imaging patterns by visual examination (Figure 2). A first subgroup of rats showed early reactivity and T
2 signal increase by 24 h after SE onset
in the parahippocampal cortices, although not as intense as in adult animals, but nevertheless clearly visible. This signal lasted, as in adult animals, for about 48 days. All these rats went on to develop epilepsy. In a second subgroup of rats there was no visible signal, but the epileptic outcome within this group was not homoge-neous. Some rats did not develop spontane-ous seizures while other ones did develop sei-zures [36]. This lack of homogeneous outcome raises the problem of hidden cortical damage that may be too subtle to be detected by solely visual examination on current T
2WI MRI
scans. A numeric treatment of digital images by texture ana lysis combined with discrimina-tive analyses based on pixel pattern anomalies selected different texture parameters derived from a co-occurrence matrix that character-ized structural abnormalities relevant to the hyperintense signal [37]. It then appeared that rats with no visible cortical T
2 signal by 24 h
that later developed spontaneous epileptic sei-zures showed transiently increased signals in the piriform and entorhinal cortices that could be quantified by texture ana lysis, while those that did not become epileptic experienced no signal change and remained identical to control animals not subjected to SE (Figure 2). Therefore, in this post-SE model of epilepsy, the early signal changes in the cortices reli-ably predict, by 24 h after the insult, the onset of epilepsy and represent a valid biomarker of both epileptogenicity and epileptogenesis [36]. Among the events that could be partly respon-sible for the early changes, inflammation, BBB opening and angiogenesis appear to occur. A
Biomarkers Med. (2011) 5(5)590 future science group
Review Nehlig
recent study showed that in postnatal day 21 rats exposed to SE, short-term (1 week after SE) and long-term (4 months after SE) inflamma-tion, angiogenesis or BBB damage took place in
the forebrain of one subgroup of rats and only transient moderate inflammation occurred in the other subgroup of rats. The former sub-group became epileptic while the latter one
70
90
110
130
150
170
Days after pilocarpine
Epileptic rats: no visible signal
Day 0
Day 1
Day 8
700 2 4 6 8 10 12 14
0 2 4 6 8 10 12 14
0 2 4 6 8 10 12 14
90
110
130
150
170
Days after pilocarpineT
2 (p
erce
nt
of
init
ial v
alu
e, d
ay 0
)
Epileptic rats: visible signal
Day 0
Day 1
Day 8
708090
100110120130140150160170
T2
(perc
en
t o
fin
itia
l valu
e, d
ay 0
)T
2 (p
erc
en
t o
fin
itia
l valu
e, d
ay 0
)
Nonepileptic rats
PC
HippDay 0
Day 1
Day 8
Days after pilocarpine
Figure 2. Evolution of the T2 relaxation time in the piriform cortex. An illustration of T2-weighted imaging at the level of the PC and Hipp has been measured at three different times (days 0, 1 and 8), as can be seen to the right of the figure. Values (means ± maximum and minimum) were expressed as percentage of the relaxation time measure before SE (day 0). The continuous line represents the mean of the T2 relaxation time obtained from four control rats at eight different times. The dotted lines represent the maximal and minimal values obtained in control rats. Three populations of rats could be distinguished at 1 day after lithium-pilocarpine-induced SE. (A) The first population experienced a large increase of T2 relaxation time 1 day after SE (~49%) that returned to control levels by 3 days post-SE. The increase of the T2 relaxation time can be clearly visualized as a hypersignal on the T2-weighted images (arrow) and its quantitative temporal evolution is shown in the graph on the left. All these rats developed epilepsy. (B) The second population of rats did not show time-related changes in the T2 relaxation time, nor was there any change in the T2-weighted imaging signal. None of these rats became epileptic. (C) The third population of rats experienced an increase in the T2 relaxation time 1 day after SE onset, but this was of lesser amplitude than the one recorded in group A (~14%). This increase clearly reflects some reactivity in the PC, but its amplitude is not sufficient to come out as a T2-weighted imaging hypersignal. All these rats developed epilepsy.Hipp: Hippocampus; PC: Piriform cortex; SE: Status epilepticus. Reproduced with permission from [36].
www.futuremedicine.com 591future science group
Hippocampal MRI & other structural biomarkers: experimental approach to epileptogenesis Review
did not [38]. Nevertheless, the reason for the heterogeneous outcome of the early insult is not yet understood. Whether it is a matura-tion- or connectivity-related consequence needs to be clarified.
Furthermore, neuroprotection studies per-formed in our group on the lithium-pilocar-pine model have shown that the protection of Ammon’s horn did not influence the epilep-tic outcome, while the sole protection of the parahippocampal cortices delayed epileptogen-esis [39]. The protection of a large part of the epileptic circuit by a carisbamate treatment, including the cortices, hippocampus, amygdala and thalamus, had significant disease-modi-fying properties, delaying or even preventing the occurrence of spontaneous motor seizures in subgroups of animals. In the latter group, this neuroprotection strategy transformed the usual temporal seizures occurring in this post-SE model into absence-like seizures responding to treatment [40]. It must be noted that, in the group with absence-like epilepsy, the extended neuroprotection was obtained by a drug treat-ment that was initiated at 1 h after SE onset. This means that a pharmacological treatment can be delayed as much as 1 h after SE onset in the lithium-pilocarpine model and still protect the particularly vulnerable cortical, thalamic and amygdalar regions. These data also indi-cate that the most interesting period to study in order to identify potential biomarkers using brain imaging is probably not the very early period (within minutes after SE onset) that has mainly been explored by means of DWI. It seems most appropriate to instead consider events that occur during the first hours after the onset of the insult to identify the regional signals that could become early biomarkers of epileptogenicity and/or epileptogenesis. Unfortunately, the study by François et al. did not explore the imaging signal changes in the group of animals treated with carisbamate that developed absence-like epilepsy instead of tem-poral lobe epilepsy [40]. This approach appears necessary to add one more piece of evidence to the possible use of T
2WI in the prediction
of epileptogenicity, epileptogenesis and hence temporal lobe epilepsy in adult animals, which is missing at this point. However, the mecha-nism of action of carisbamate used in the latter study is mostly unknown and hence does not give information on the specific pathways that could or should be targeted rapidly after the onset of the initial insult in order to modify its outcome or to decrease comorbidity.
Later events in relation to epileptogenesisOther imaging techniques have been devel-oped and used as biomarkers of epilepsy. Most of them concern the outcome of the plasticity phenomena that occur during epileptogenesis and hence cannot be used as biomarkers or surrogate markers of epileptogenesis. We will briefly review them.
n Magnetic resonance spectroscopyAlong with morphological and tissue altera-tion measurements by structural MRI, chemi-cal constituents of tissue are detectable with MRS [41]. MRS allows the noninvasive ana lysis of the biochemical status of the brain and other organs in situ. MRS uses the physical proper-ties of some atoms whose nuclei, when placed in a magnetic field, will orient themselves either parallel or antiparallel to the field. Subsequent excitation with a radiofrequency pulse at the resonance frequency of these nuclei drives them to higher energy states. Each nucleus has a resonance frequency related to its local mag-netic environment and hence each molecule can be distinguished on the MRS spectrum after a mathematical treatment. The nuclei most often explored are 31P, 1H, 13C and 23Na. The problem with the use of MRS in rodents is related to the size of the brain, which does not allow the exploration of very discrete zones of the brain and often encompasses more than one single region or nucleus.
31P was mostly used as a direct measure of energy stores via phosphocreatine, ATP and inorganic phosphate. The high energy require-ment of SE was already demonstrated in 1983 in a MRS study on a rabbit model of bicuculline-induced SE. Phosphocreatine, the energy store, declines while inorganic phosphate concurrently increases over the duration of long-lasting sei-zures, reflecting the high energy requirement of sustained seizure activity [42].
Using 1H spectroscopy, several studies showed that during SE, the ratio N-acetylaspartate:creat-ine (NAA:Cr) – N-acetylaspartate is a neuronal marker considered to reflect neuronal activity and possibly neuronal loss – is reduced in the rat hippocampus [43,44] and piriform cortex [45] from 24 h to at least 7 days after the insult induced by systemic kainate [43,46] or pilocar-pine [47]; NAA:Cr reductions may even persist longer following local intracerebral injections of kainic acid [48,49]. It was hypothesized that the NAA:Cr ratio changes would reflect metabolic impairment during epileptogenesis rather than
Biomarkers Med. (2011) 5(5)592 future science group
Review Nehlig
neuronal loss [47]. Kainate administration is also associated with an increase in hippocampal lac-tate that occurs within 3 h after seizure induc-tion [50] and persists for 7–9 days after systemic or intrahippocampal injection of kainate [43,44,49]. Finally, hippocampal glutamate concentration measured by 1H MRS 3 days and 1 month after kainate SE is decreased, favoring the hypothesis of SE-induced loss of hippocampal glutamater-gic neurons [46]. So far, while MRS appears use-ful to detect metabolic dysfunction in epilepsy models, no measurement was performed before 1 day post-SE and the changes detected do not appear to represent reliable early predictors or biomarkers for epileptogenesis that could be useful in developing strategies to prevent the occurrence of epilepsy.
The changes in the MRS signal of creatine and choline are not specific indicators of neuro-nal loss and do not appear to be accurate local-ization markers of the epileptogenic focus. A significant increase of the choline signal in the hippocampus was considered to reflect mossy fiber sprouting [50]. More recently, 1H MRS was used to examine changes that occur in the rat lithium-pilocarpine model of SE [12]. As expected, a significant reduction in the NAA:Cr and N-acetylaspartate:choline ratios after SE was observed, but no changes were detected in the signals of creatine and choline during the early (<24 h of SE) period.
13C MRS is an excellent tool for analyzing specific neuronal and astrocytic metabolism as well as interactions between both cell types [51]. Because astrocytes and neurons express dif-ferent enzymes and transporters, it is possible to differentiate metabolic events taking place in astrocytes and neurons, respectively, after the administration of 13C-enriched substrates. Acetate and glucose are both precursors for acetyl coenzyme A, which enters the tricarbox-ylic acid cycle. Acetate is selectively taken up by astrocytes, while acetyl coenzyme A derived from glucose is metabolized more in the neu-ronal than in the astrocytic tricarboxylic acid cycle [52]. 13C-enriched glucose and acetate can be used separately but, by simultaneous injec-tion of both 13C-enriched substrates and MRS ana lysis of brain extracts, information about neuronal and astrocytic metabolism as well as the interactions between both compartments can be obtained in the same animal [53]. 13C is a naturally occurring, nonradioactive form of the carbon atom, and the enrichment of vari-ous molecules with this atom allows for a better and sensitive detection. At the moment, most
of the data have been obtained in rodents by performing ex vivo measurements. However, the technique has already been used in the human epileptic brain after infusion of 13C-labeled sub-strates, and it is worth looking at some of the data obtained in animals since they could give some indications for future research in human epilepsy and epileptogenesis [54]. Moreover, this technique can be coupled to 1H MRS, allowing for the measurement of metabolite concentra-tions together with biosynthetic rates obtained by 13C MRS.
A study performed at 24 h after kainate-induced SE reported that the turnover of amino acids was increased predominantly in astrocytes whereas glutamatergic neurons had returned to a normal level of turnover [55]. During the latent phase, at 14 days after SE, the biosynthesis of glu-tamate, glutamine and GABA from 13C-glucose was decreased in all areas. The GABA concen-tration was decreased specifically in the hippo-campal formation, concurrently with the trans-fer of the precursor of GABA, labeled glutamine, from astrocytes to neurons. These data reflect the critical role of astrocytes in the epileptogenic process, and show that 1H and 13C MRS could represent useful tools to explore further struc-tures of interest [56]. During the chronic phase of the kainate model, the amount and 13C labeling of glutamate were reduced in the hippocampal formation and entorhinal cortex of epileptic rats. Additionally, mitochondrial dysfunction assessed by decreased percentage of 13C enrich-ment in [4-13C]-glutamate from 13C-glucose was detected in surviving glutamatergic neurons in the hippocampal formation. These dysfunc-tions, together with the decreased concentration of NAA, also indicate neuronal loss [57]. During the chronic phase of the lithium-pilocarpine model, labeling of glutamate, GABA, aspartate and alanine from 13C-glucose were decreased in parietal, entorhinal, and piriform cortices, hip-pocampus, amygdala and cerebellum, possibly reflecting neuronal loss, as in the kainate model. No changes were detected in glial–neuronal interactions in the hippocampal formation, while in parietal cortex the flow of glutamate to astrocytes was decreased, indicating a disturbed glutamate–glutamine cycle [58].
Altogether, it appears that this type of approach is probably ideal for the study of very early changes during the SE-induced acute phase when excitoxicity, neuronal death and this type of acute processes go on. Indeed, it would be difficult to discriminate what is truly caused by metabolic changes necessary for the brain
www.futuremedicine.com 593future science group
Hippocampal MRI & other structural biomarkers: experimental approach to epileptogenesis Review
to adapt to ongoing seizure activity and what reflects cell swelling, mitochondrial failure and necrosis leading to neuronal loss. On the other hand, these techniques might be extremely useful for the study of epileptogenesis, since it appears that the latent phase could rather be characterized by astrocytic dysfunction, pos-sibly buffering the metabolic changes due to neuronal loss and recovery of the neurons from the insult. Later on, during the chronic phase, astrocytes seem to have normalized their func-tion and apparently only the remaining neuron population is somewhat dysfunctional.
n DTI & tractography The use of DTI allowed the assessment that water diffusion is not homogeneous throughout the brain. Water diffuses more rapidly when the direction is aligned with the internal structure and more slowly when its movement is perpen-dicular to the internal structure. The images of biological tissues weighted with the local microstructural characteristics of water diffusion can show connections between brain regions. Because of their complex architecture, the dif-ferent hippocampal subregions have lower frac-tional anisotropy (FA) than uniform fibers such as the corpus callosum. Tractography is an exten-sion of DTI that allows the generation of virtual 3D white matter maps on the basis of the direc-tional information obtained in each 3D voxel. These maps are based on similarities between the diffusion properties of neighboring voxels in terms of shape and orientation. Thereafter, mathematical algorithms allow the generation of white matter tracts. However, tractography does not trace fibers as injected tracers would do; it rather shows the path of least resistance to water diffusion. At this point, tractography is the only technique available for tracing white matter pathways in the living brain. Finally, dif-fusion anisotropy measures such as FA can be computed from diffusion tensor images [59,60].
Diffusion tensor imaging-derived color fiber orientation maps and tractography were used to visualize most components of the trisynaptic intrahippocampal pathway (e.g., orientations in stratum lacunosum-moleculare were domi-nated by perforant and Schaffer fibers) and allowed assessment of connectivity in the nor-mal rat hippocampus [61]. In epilepsy research, these techniques will typically be used to study SE-induced plasticity and hence are usually applied weeks to months after the initial insult. As such they can only be used as late biomarkers of epileptogenesis and plasticity. As an example,
the induction of SE by kainic acid or pilocar-pine significantly increased FA in the dentate gyrus several months after the insult. FA changes correlated with axonal plasticity of myelinated and nonmyelinated neuronal fibers, as verified by histological staining [62]. Likewise, after self-sustaining SE, changes in diffusivity and anisotropy were observed in vivo in the contra-lateral parahippocampal gyrus and bilaterally in fimbria. This bilateral increase in anisotropy in the dentate gyrus corresponded to mossy fiber sprouting determined by Timm staining ex vivo. These specific long-term DTI signal changes were observed at 2 months after SE only in rats that developed spontaneous limbic seizures [63].
n Manganese enhanced MRIA novel MRI technique, manganese enhanced MRI (MEMRI), is able to visualize activity in the brain, trace neuronal specific connections and enhance the brain cytoarchitecture after a systemic dose. MEMRI is proving useful as a new molecular imaging method to visualize functional neural circuits and anatomy as well as function in the brain in vivo. To achieve the successful use of MEMRI it appears necessary to deliver Mn2+ to the site of interest at an appropri-ate dose and in a time-efficient manner. A major problem in the use of Mn2+ as a contrast agent is its toxicity. The lowest possible doses have to be used [64–66]. The paramagnetic properties of Mn2+ can serve as a contrast agent in MRI. Mn2+ shortens T
1 relaxation times and results
in signal enhancement in T1-weighted images.
Since free Mn2+ ions are Ca2+ analogs, they are able to bind to similar sites and behave as Ca2+ in neurons. They are transported in both an anterograde and retrograde manner by axons and cross synapses. When voltage-gated Ca2+ chan-nels open upon depolarization, Mn2+ can enter the cells, and MEMRI can provide information about neural activity. Systemically administered Mn2+ does not need a BBB breakdown to enter the brain. With an intact BBB, Mn2+ has been shown to enter various brain regions with a spe-cific region-related temporal evolution of the sig-nal, and both the dose and the time after Mn2+ can be adjusted to optimize brain contrast in a region-specific manner [67].
MEMRI was used to detect sprouting and axonal reorganization in the epileptic brain. A few studies were performed but the results are discordant. One study found a signal enhance-ment at 2 months post-SE and no change at earlier time points, and considered this signal change as reflecting axonal sprouting [68]. In
Biomarkers Med. (2011) 5(5)594 future science group
Review Nehlig
another study, Mn2+ was injected directly into the entorhinal cortex of rats subjected to kai-nate SE 2 weeks earlier. The MEMRI signal was enhanced in the dentate gyrus and CA3 at 3–5 days after manganese injection, showing that Mn2+ is transported via the perforant path-way to the granule cell dendritic domain, and from there to the mossy fibers. In 3D reconstruc-tions, the MEMRI signal revealed the extent of mossy fiber sprouting in the dentate gyrus and CA3, which correlated with Timm staining performed ex vivo [69]. On the contrary, a third study that was performed at various time points after SE mostly found decreased MEMRI signals at early time points (1 and 14 days post-SE) and a recovery by 11 weeks with an increase limited to the entorhinal cortex and lateral amygdala. This increase would reflect the establishment of the epileptic circuit and sprouting of CA3–entorhinal fibers during the late phase of epilep-togenesis [70]. Thus, changes in MEMRI signal reflect activity-dependent plasticity in vivo and may serve as a late imaging marker of plasticity and epileptogenesis. Thus, currently, this tech-nique needs to be further applied at early time points, to better understand the early seizure-induced changes in plasticity.
ConclusionIn conclusion, the research has already devel-oped a large panel of techniques and has taken great advantage of various imaging techniques to study the consequences of seizures on anatomi-cal and water content changes, BBB opening, energy stores, metabolic activity and plasticity related to circuit reconstruction. Most of these techniques characterize the seizure-induced changes at various levels quite well but they can only rarely be used as biomarkers for epi-leptogenesis. At this point, only one study using T
2WI was able to show that the occurrence of
epilepsy can be predicted as soon as 24 h after the initial insult. The remaining problem is the short duration of signal increase (about 48 h) which renders its use difficult to translate to the clinic. For this purpose, it would be bet-ter to identify an imaging biomarker as reliable as T
2WI, but which lasted for approximately a
week. Further studies will be necessary to iden-tify other imaging markers that would allow the prediction of epileptogenesis.
Future perspectiveIn this article, we presented the tools of imag-ing that can be used to explore seizure- and epilepsy-induced changes within the animal
brain. This review was not intended to be exhaustive, but tried to recollect most of the available data in the field. Significant progress has already been made in the use of these tech-niques for the study of the brain during and/or after seizure activity. They have proven to be useful in determining water movements, metabolism and plasticity within affected brain tissue. Up to now, they have been mostly used to map changes due to seizure activity within the brain, but the majority of studies did not try to relate these changes to the plastic processes characterizing epileptogenesis and/or to the epi-leptic fate of the animals. This was done in a limited number of studies, mainly because most research groups use models in which the initial insult leads to epilepsy in 100% of cases. An attempt was made in a model of TBI in which not all animals become epileptic, but early sig-nal changes could not be related to the epileptic outcome. This was only successfully achieved in one post-SE epilepsy model using immature rats with a heterogeneous epileptic outcome. In that study, the early changes in T
2WI sig-
nal in temporal cortices could reliably predict epilepsy and could be used as a biomarker of epileptogenicity and epileptogenesis. In the future, progress should be made in using less aggressive epilepsy models that better mimic the human pathology and allow for the identi-fication of other biomarkers of epileptogenicity and epileptogenesis. In this respect, as often as possible, EEG recording should be associ-ated with imaging to better delineate some of the changes occurring in particularly sensitive regions. Circuit plasticity should also be studied in greater detail to better characterize when it starts and which exact pathways and processes are involved. In this way, it might be possible to stop the progression of circuit alterations and at least reduce the frequency and duration of sei-zures and modify the comorbidity of the disease by better preserving cognitive abilities.
Financial & competing interests disclosureThe author has received basic research support from Johnson & Johnson Pharmaceutical Research and Development, Marion Merrel Dow, Astra Charnwood, Parke Davis and Valeant Pharmaceuticals. She has served as a paid consult-ant to Johnson & Johnson. The author has no other relevant affiliations or financial involvement with any organization or entity with a financial interest in or financial conflict with the subject matter or materials discussed in the manuscript apart from those disclosed.
No writing assistance was utilized in the production of this manuscript.
www.futuremedicine.com 595future science group
Hippocampal MRI & other structural biomarkers: experimental approach to epileptogenesis Review
Executive summary
MRI techniques represent methods of choice for the study of epileptogenesis � They are not invasive and hence allow repetitive measurements and the study of the temporal evolution of a plastic phenomenon like epileptogenesis. � They possess a quite good spatial definition, allowing the study of discrete brain regions evolving differently during the process. � They give information on various processes such as edema, gliosis, neuronal death, blood–brain barrier opening, metabolism and circuit plasticity and reconstruction.
Diffusion-weighted imaging technique � This technique allows recording of the Brownian motion of water at very early time points, much earlier than conventional T1- or T2-weighted imaging. � It represents a method of choice for detecting acute lesions caused by seizures. � The signal increases early, within minutes after seizure onset, and signal changes correlate with neuronal loss.
T1-weighted imaging technique � This technique is commonly used; it mostly allows the assessment of the volume of different brain structures. � When associated with contrast agents, like chelated gadolinium complexes, T1-weighted imaging can be used to test the integrity of the blood–brain barrier, which has been shown to transiently open in the first hours following the onset of sustained seizure activity.
T2-weighted imaging technique � This technique has been repeatedly used in the study of seizure-induced edema, gliosis and neuronal loss. � A few studies performed a follow-up of T2 signal changes in the adult brain subjected to sustained seizures, reporting regional signal changes starting at different time points of the epileptogenic process, consistent with the rate of neuronal loss in the different brain structures. � One study using immature rats with a variable epileptic fate reported a concordance between the appearance of an early signal in the temporal cortical regions and the development of temporal lobe epilepsy, showing that in this particular model, the T2-weighted imaging signal could be used as a reliable biomarker to predict epileptogenesis.
Nuclear magnetic resonance spectroscopy � This technique allows assessing the energy reserve, mitochondrial dysfunction and neuronal loss in a discrete area of the living brain, as well as neuronal and glial metabolism, coupled with the interactions between both compartments. � Not surprisingly, the use of 31P showed that the energy requirement of sustained seizures is high. � 1H spectroscopy most often measures N-acetylaspartate, a marker of mitochondrial function and possibly neuronal loss, along with
other molecules such as lactate. N-acetylaspartate levels usually decrease, indicating disturbed neuronal activity. � 13C spectroscopy has been able to define the structures and types of metabolic changes occurring during the late acute, latent and
chronic phase. Different effects of seizures on metabolism concerning either neurons or astrocytes have been delineated but lack homogeneity and need further exploration.
Diffusion tensor imaging & tractography � These techniques are most often used to detect late changes occurring in brain plasticity that lead to circuit reorganization. � Signal changes have been correlated with the reconstruction seen ex vivo like mossy fiber sprouting.
Conclusion � Efforts should be made in designing less severe models with heterogeneous epileptic outcome to allow for a more detailed exploration of changes related to epileptogenesis. � Techniques associating EEG recording and imaging in critical areas should be developed and used more often. � Efforts should be made at understanding circuit plasticity and how this process can be slowed down or stopped in order to possibly reduce the severity of the disease and preserve cognitive abilities.
BibliographyPapers of special note have been highlighted as:n of interest
1 Engel J Jr. Introduction to temporal lobe epilepsy. Epilepsy Res. 26(1), 141–150 (1996).
2 Jensen FE, Baram TZ. Developmental seizures induced by common early-life insults: short- and long-term effects on seizure susceptibility. Ment. Retard. Dev. Disabil. Res. Rev. 6(4), 253–257 (2000).
3 Leite JP, Garcia-Cairasco N, Cavalheiro EA. New insights from the use of pilocarpine and kainate models. Epilepsy Res. 50(1–2), 93–103 (2002).
4 Kharatishvili I, Pitkänen A. Posttraumatic epilepsy. Curr. Opin. Neurol. 23(2), 183–188 (2010).
5 Pitkänen A, Sutula TP. Is epilepsy a progressive disorder? Prospects for new therapeutic approaches in temporal-lobe epilepsy. Lancet Neurol. 1(3), 173–181 (2002).
6 Pitkänen A. Therapeutic approaches to epileptogenesis – hope on the horizon. Epilepsia 51(Suppl. 3), 2–17 (2010).
n Gives all basic definitions related to epileptogenesis and disease modification, and can be used as a guideline.
7 Wall CJ, Kendall EJ, Obenaus A. Rapid alterations in diffusion-weighted images with anatomic correlates in a rodent model of status epilepticus. AJNR Am. J. Neuroradiol. 21(10), 1841–1852 (2000).
Biomarkers Med. (2011) 5(5)596 future science group
Review Nehlig
8 Bhagat YA, Obenaus A, Hamilton MG, Kendall EJ. Magnetic resonance imaging predicts neuropathology from soman-mediated seizures in the rodent. Neuroreport 12(7), 1481–1487 (2001).
9 Bhagat YA, Obenaus A, Hamilton MG, Mikler J, Kendall EJ. Neuroprotection from soman-induced seizures in the rodent: evaluation with diffusion- and T
2-weighted
magnetic resonance imaging. Neurotoxicology 26(6), 1001–13 (2005).
10 Fabene PF, Marzola P, Sbarbati A, Bentivoglio M. Magnetic resonance imaging of changes elicited by status epilepticus in the rat brain: diffusion-weighted and T
2-weighted
images, regional blood volume maps, and direct correlation with tissue and cell damage. Neuroimage 18(2), 375–389 (2003).
11 Eidt S, Kendall EJ, Obenaus A. Neuronal and glial cell populations in the piriform cortex distinguished by using an approximation of q-space imaging after status epilepticus. AJNR Am. J. Neuroradiol. 25(7), 1225–1233 (2004).
12 van Eijsden P, Notenboom RG, Wu O et al. In vivo 1H magnetic resonance spectroscopy, T
2-weighted and diffusion-weighted MRI
during lithium-pilocarpine-induced status epilepticus in the rat. Brain Res. 1030(1), 11–18 (2004).
13 Righini A, Pierpaoli C, Alger JR, Di Chiro G. Brain parenchyma apparent diffusion coefficient alterations associated with experimental complex partial status epilepticus. Magn. Reson. Imaging 12(6), 865–871 (1994).
14 Nakasu Y, Nakasu S, Morikawa S, Uemura S, Inubushi T, Handa J. Diffusion-weighted MR in experimental sustained seizures elicited with kainic acid. AJNR Am. J. Neuroradiol. 16(6), 1185–1192 (1995).
15 Wang Y, Majors A, Najm I et al. Postictal alteration of sodium content and apparent diffusion coefficient in epileptic rat brain induced by kainic acid. Epilepsia 37(10), 1000–1006 (1996).
16 Zhong J, Petroff OA, Prichard JW, Gore JC. Changes in water diffusion and relaxation properties of rat cerebrum during status epilepticus. Magn. Reson. Med. 30(2), 241–246 (1993).
17 Engelhorn T, Hufnagel A, Weise J, Baehr M, Doerfler A. Monitoring of acute generalized status epilepticus using multilocal diffusion MR imaging: early prediction of regional neuronal damage. AJNR Am. J. Neuroradiol. 28(2), 321–327 (2007).
18 Wolf OT, Dyakin V, Patel A et al. Volumetric structural magnetic resonance imaging (MRI) of the rat hippocampus following kainic acid (KA) treatment. Brain Res. 934(2), 87–96 (2002).
19 Roch C, Leroy C, Nehlig A, Namer IJ. Magnetic resonance imaging in the study of the lithium-pilocarpine model of temporal lobe epilepsy in adult rats. Epilepsia 43(4), 325–335 (2002).
n First paper showing the temporal and spatial follow-up of the T
2-weighted signals after
status epilepticus in the adult rat.
20 Bouilleret V, Nehlig A, Marescaux C, Namer IJ. Magnetic resonance imaging follow-up of progressive hippocampal changes in a mouse model of mesial temporal lobe epilepsy. Epilepsia 41(6), 642–650 (2000).
21 Pirttilä TR, Pitkänen A, Tuunanen J, Kauppinen RA. Ex vivo MR microimaging of neuronal damage after kainate-induced status epilepticus in rat: correlation with quantitative histology. Magn. Reson. Med. 46(5), 946–954 (2001).
22 Dubé C, Yu H, Nalcioglu O, Baram TZ. Serial MRI after experimental febrile seizures: altered T
2 signal without neuronal death. Ann.
Neurol. 56(5), 709–714 (2004).
23 Nairismägi J, Gröhn OH, Kettunen MI, Nissinen J, Kauppinen RA, Pitkänen A. Progression of brain damage after status epilepticus and its association with epileptogenesis: a quantitative MRI study in a rat model of temporal lobe epilepsy. Epilepsia 45(9), 1024–1034 (2004).
24 Jupp B, Williams JP, Tesiram YA, Vosmansky M, O’Brien TJ. Hippocampal T
2
signal change during amygdala kindling epileptogenesis. Epilepsia 47(1), 41–46 (2006).
25 Welch KM, Windham J, Knight RA et al. A model to predict the histopathology of human stroke using diffusion and T
2-weighted
magnetic resonance imaging. Stroke 26(11), 1983–1989 (1995).
26 Fujikawa DG, Shinmei SS, Cai B. Lithium-pilocarpine-induced status epilepticus produces necrotic neurons with internucleosomal DNA fragmentation in adult rats. Eur. J. Neurosci. 11(5), 1605–1614 (1999).
27 Fujikawa DG, Shinmei SS, Cai B. Kainic acid-induced seizures produce necrotic, not apoptotic, neurons with internucleosomal DNA cleavage: implications for programmed cell death mechanisms. Neuroscience 98(1), 41–53 (2000).
28 Fujikawa DG, Zhao S, Ke X, Shinmei SS, Allen SG. Mild as well as severe insults produce necrotic, not apoptotic, cells: evidence from 60-min seizures. Neurosci. Lett. 469(3), 333–337 (2010).
29 André V, Marescaux C, Nehlig A, Fritschy JM. Alterations of hippocampal GABAergic system contribute to development of spontaneous recurrent seizures in the rat lithium-pilocarpine model of temporal lobe epilepsy. Hippocampus 11(4), 452–468 (2001).
30 Kharatishvili I, Nissinen JP, McIntosh TK, Pitkänen A. A model of posttraumatic epilepsy induced by lateral fluid-percussion brain injury in rats. Neuroscience 140(2), 685–697 (2006).
31 Kharatishvili I, Immonen R, Gröhn O, Pitkänen A. Quantitative diffusion MRI of hippocampus as a surrogate marker for post-traumatic epileptogenesis. Brain 130(Pt 12), 3155–3168 (2007).
32 Kharatishvili I, Sierra A, Immonen RJ, Gröhn OH, Pitkänen A. Quantitative T
2
mapping as a potential marker for the initial assessment of the severity of damage after traumatic brain injury in rat. Exp. Neurol. 217(1), 154–164 (2009).
33 Kubová H, Mares P, Suchomelová L, Brozek G, Druga R, Pitkänen A. Status epilepticus in immature rats leads to behavioural and cognitive impairment and epileptogenesis. Eur. J. Neurosci. 19(12), 3255–3265 (2004).
34 Sankar R, Shin DH, Liu H, Mazarati A, Pereira de Vasconcelos A, Wasterlain CG. Patterns of status epilepticus-induced neuronal injury during development and long-term consequences. J. Neurosci. 18(20), 8382–8393 (1998).
35 Dubé C, Boyet S, Marescaux C, Nehlig A. Relationship between neuronal loss and interictal glucose metabolism during the chronic phase of the lithium-pilocarpine model of epilepsy in the immature and adult rat. Exp. Neurol. 167(2), 227–241 (2001).
36 Roch C, Leroy C, Nehlig A, Namer IJ. Predictive value of cortical injury for the development of temporal lobe epilepsy in 21-day-old rats: an MRI approach using the lithium-pilocarpine model. Epilepsia 43(10), 1129–1136 (2002).
n Original paper on imaging of early T
2-weighted signal increases in immature
rats subjected to status epilepticus allowing the discrimination of epileptogenicity and prediction of epilepsy on the base of objective measurements.
37 Yu O, Roch C, Namer IJ, Chambron J, Mauss Y. Detection of late epilepsy by the texture ana lysis of MR brain images in the lithium-pilocarpine rat model. Magn. Reson. Imaging 20(10), 771–775 (2002).
38 Marcon J, Gagliardi B, Balosso S et al. Age-dependent vascular changes induced by status epilepticus in rat forebrain: implications for epileptogenesis. Neurobiol. Dis. 34(1), 121–132 (2009).
39 André V, Dubé C, François J et al. Pathogenesis and pharmacology of epilepsy in the lithium-pilocarpine model. Epilepsia 48(Suppl. 5), 41–47 (2007).
www.futuremedicine.com 597future science group
Hippocampal MRI & other structural biomarkers: experimental approach to epileptogenesis Review
597www.futuremedicine.com
40 François J, Germé K, Ferrandon A, Koning E, Nehlig A. Carisbamate has powerful disease-modifying effects in the lithium-pilocarpine model of temporal lobe epilepsy. Neuropharmacology 61(1–2), 313–328 (2011).
41 Hiremath GK, Najm IM. Magnetic resonance spectroscopy in animal models of epilepsy. Epilepsia 48(Suppl. 4), 47–55 (2007).
42 Prichard JW, Alger JR, Behar KL, Petroff OA, Shulman RG. Cerebral metabolic studies in vivo by 31P NMR. Proc. Natl Acad. Sci. USA 80(9), 2748–2751 (1983).
43 Najm IM, Wang Y, Hong SC, Lüders HO, Ng TC, Comair YG. Temporal changes in proton MRS metabolites after kainic acid-induced seizures in rat brain. Epilepsia 38(1), 87–94 (1997).
44 Najm IM, Wang Y, Shedid D, Lüders HO, Ng TC, Comair YG. MRS metabolic markers of seizures and seizure-induced neuronal damage. Epilepsia 39(3), 244–250 (1998).
45 Ebisu T, Rooney WD, Graham SH, Mancuso A, Weiner MW, Maudsley AA. MR spectroscopic imaging and diffusion-weighted MRI for early detection of kainite induced status epilepticus in the rat. Magn. Reson. Med. 36(6), 821–828 (1996).
46 Zahr NM, Crawford EL, Hsu O et al. In vivo glutamate decline associated with kainic acid-induced status epilepticus. Brain Res. 1300, 65–78 (2009).
47 Gomes WA, Lado FA, de Lanerolle NC, Takahashi K, Pan C, Hetherington HP. Spectroscopic imaging of the pilocarpine model of human epilepsy suggests that early NAA reduction predicts epilepsy. Magn. Reson. Med. 58(2), 230–235 (2007).
48 Tokumitsu T, Mancuso A, Weinstein PR, Weiner MW, Naruse S, Maudsley AA. Metabolic and pathological effects of temporal lobe epilepsy in rat brain detected by proton spectroscopy and imaging. Brain Res. 744(1), 57–67 (1997).
49 Luna-Medina R, Cortes-Canteli M, Sanchez-Galiano S et al. NP031112, a thiadiazolidinone compound, prevents inflammation and neurodegeneration under excitotoxic conditions: potential therapeutic role in brain disorders. J. Neurosci. 27(21), 5766–5776 (2007).
50 Meric P, Barrere B, Peres M et al. Effects of kainate-induced seizures on cerebral metabolism: a combined 1H and 31P NMR study in rat. Brain Res. 638(1–2), 53–60 (1994).
51 Sonnewald U, Kondziella D. Neuronal glial interaction in different neurological diseases studied by ex vivo 13C NMR spectroscopy. NMR Biomed. 16(6–7), 424–429 (2003).
n Up-to-date paper on the basic principles of 13C nuclear magnetic resonance spectroscopy for the study of metabolism in neurons and astrocytes.
52 Qu H, Haberg A, Haraldseth O, Unsgard G, Sonnewald U. 13C MR spectroscopy study of lactate as substrate for rat brain. Dev. Neurosci. 22(5–6), 429–436 (2000).
53 Taylor A, McLean M, Morris P, Bachelard H. Approaches to studies on neuronal/glial relationships by 13C-MRS ana lysis. Dev. Neurosci. 18(5–6), 434–442 (1996).
54 Pan JW, Williamson A, Cavus I et al. Neurometabolism in human epilepsy. Epilepsia 49(Suppl. 3), 31–41 (2008).
55 Qu H, Eloqayli H, Müller B, Aasly J, Sonnewald U. Glial–neuronal interactions following kainate injection in rats. Neurochem. Int. 42(1), 101–106 (2003).
56 Alvestad S, Hammer J, Qu H, Håberg A, Ottersen OP, Sonnewald U. Reduced astrocytic contribution to the turnover of glutamate, glutamine, and GABA characterizes the latent phase in the kainate model of temporal lobe epilepsy. J. Cereb. Blood Flow Metab. 31(8), 1675–1686 (2011).
57 Alvestad S, Hammer J, Eyjolfsson E, Qu H, Ottersen OP, Sonnewald U. Limbic structures show altered glial–neuronal metabolism in the chronic phase of kainate induced epilepsy. Neurochem. Res. 33(2), 257–266 (2008).
58 Melø TM, Nehlig A, Sonnewald U. Metabolism is normal in astrocytes in chronically epileptic rats: a 13C NMR study of neuronal–glial interactions in a model of temporal lobe epilepsy. J. Cereb. Blood Flow Metab. 25(10), 1254–1264 (2005).
59 Mori S, van Zijl PC. Fiber tracking: principles and strategies – a technical review. NMR Biomed. 15(7–8), 468–480 (2002).
60 Yogarajah M, Duncan JS. Diffusion-based magnetic resonance imaging and tractography in epilepsy. Epilepsia 49(2), 189–200 (2008).
61 Shepherd TM, Ozarslan E, King MA, Mareci TH, Blackband SJ. Structural insights from high-resolution diffusion tensor imaging and tractography of the isolated rat hippocampus. Neuroimage 32(4), 1499–1509 (2006).
62 Laitinen T, Sierra A, Pitkänen A, Gröhn O. Diffusion tensor MRI of axonal plasticity in the rat hippocampus. Neuroimage 51(2), 521–530 (2010).
63 Parekh MB, Carney PR, Sepulveda H, Norman W, King M, Mareci TH. Early MR diffusion and relaxation changes in the parahippocampal gyrus precede the onset of spontaneous seizures in an animal model of chronic limbic epilepsy. Exp. Neurol. 224(1), 258–270 (2010).
64 Silva AC, Lee JH, Aoki I, Koretsky AP. Manganese-enhanced magnetic resonance imaging (MEMRI): methodological and practical considerations. NMR Biomed. 17, 532–543 (2004).
65 Watanabe T, Natt O, Boretius S, Frahm J, Michaelis T. In vivo 3D MRI staining of mouse brain after subcutaneous application of MnCl
2.
Magn. Reson. Med. 48, 852–859 (2002).
66 Watanabe T, Frahm J, Michaelis T. Functional mapping of neural pathways in rodent brain in vivo using manganese-enhanced three dimensional magnetic resonance imaging. NMR Biomed. 17, 554–568 (2004).
67 Lee JH, Silva AC, Merkle H, Koretsky AP. Manganese enhanced magnetic resonance imaging of mouse brain after systemic administration of MnCl
2: dose-dependent and
temporal evolution of T1 contrast. Magn. Reson.
Med. 53, 640–648 (2005).
68 Immonen RJ, Kharatishvili I, Sierra A, Einula C, Pitkänen A, Gröhn OH. Manganese enhanced MRI detects mossy fiber sprouting rather than neurodegeneration, gliosis or seizure-activity in the epileptic rat hippocampus. Neuroimage 40(4), 1718–1730 (2008).
69 Nairismagi J, Pitkänen A, Narkilahti S, Huttunen J, Kauppinen RA, Gröhn OH. Manganese-enhanced magnetic resonance imaging of mossy fiber plasticity in vivo. Neuroimage 30(1), 130–135 (2006).
70 Alvestad S, Goa PE, Qu H et al. In vivo mapping of temporospatial changes in manganese enhancement in rat brain during epileptogenesis. Neuroimage 38(1), 57–66 (2007).