May 13, 2016 Population Biologist Brent Johnson, [email protected]AZA Animal Program Leader & Regional Studbook Keeper John Davis, [email protected]AZA Wild Pig, Peccary, Hippo TAG Chair Martin Ramirez, [email protected]AZA Wild Pig, Peccary, Hippo TAG Vice-Chair Jeff Holland, [email protected]River Hippopotamus (Hippopotamus amphibius) AZA Animal Program Population Viability Analysis Report
Transcript
May 13, 2016
Population Biologist Brent Johnson, [email protected] AZA Animal Program Leader & Regional Studbook Keeper John Davis, [email protected] AZA Wild Pig, Peccary, Hippo TAG Chair Martin Ramirez, [email protected] AZA Wild Pig, Peccary, Hippo TAG Vice-Chair Jeff Holland, [email protected]
River Hippopotamus (Hippopotamus amphibius)
AZA Animal Program Population Viability
Analysis Report
2016 Population Viability Analyses for AZA River Hippopotamus Animal Program 1
POPULATION VIABILITY ANALYSIS (PVA) APPROACH ....................................................................................3
POPULATION HISTORY AND CURRENT STATUS .............................................................................................4
MODEL SCENARIOS ........................................................................................................................................7
POPULATION VIABILITY UNDER CURRENT MANAGEMENT ...........................................................................8
ALTERNATE MODEL SCENARIOS ....................................................................................................................9
LITERATURE CITED ........................................................................................................................................15
2016 Population Viability Analyses for AZA River Hippopotamus Animal Program 2
EXECUTIVE SUMMARY Population Viability Analyses (PVA) are being conducted by Lincoln Park Zoo and Population Management Center researchers through
funding from the Institute of Museum and Library Services (IMLS). The project team uses ZooRisk 3.80 (Earnhardt et al. 2008), a PVA
modeling software, to examine what would happen to AZA populations if current conditions remain the same (the baseline scenario), and
then assess the impact of changes in reproductive rates, space availability, imports/exports, and other potential management actions
(alternate scenarios). Model scenarios for this population were developed with members of the Association of Zoos and Aquarium (AZA)
Wild Pig, Peccary, and Hippo Taxon Advisory Group (TAG) in 2015 and 2016.
POPULATION HISTORY/CURRENT STATUS River hippos (Hippopotamus amphibius) have been consistently held in North American zoos since 1883. Through a combination of zoo
births and importation from other populations, the managed North American population (at AZA and one closely participating non-AZA
institution) grew to a peak of 114 individuals in 1975. Over the past decade, the population had several years of purposefully low breeding
to accommodate reduced institutional interest, and averaged 0.9 births per year. The population currently includes 80 individuals, which
retain 94.9% of founding gene diversity and have low inbreeding (average inbreeding coefficient [F] of 0.018). Genetic values are based on
a pedigree knownness of 61.9%.
PROGRAM CHALLENGES Many currently participating institutions have space for only two adult river hippos. Consequently, many institutions choose to hold two
adult females given the challenges associated with holding a potential breeding pair. Because of this practice, managers often have
difficulty in placing adult male river hippos, which must be held singly, in spite of the female bias in the current potentially breeding
population (1.9 females per male). Additionally, breeding is constrained by the limited number of breeding pairs that are formed. Ideally,
more institutions would be able to hold larger breeding groups that could better accommodate the population’s current sex ratio.
PVA RESULTS Model results indicate that, under its average breeding rate from the past 10 years (~1 birth/year), the river hippopotamus population
would decline over the next century. However, maintaining consistently higher breeding is predicted to allow the river hippopotamus
population to stabilize over the next 100 years. If river hippos consistently produce 3 to 4 births/year (corresponding to a 13% probability
of breeding for each female), the population could remain near its current size with the known-pedigree portion of the population retaining
89.7% gene diversity and inbreeding (F = 0.093) above that of offspring produced by mating between first cousins (F = 0.063) in 100 years.
Additionally, pedigree knownness for the population is predicted to increase from 61.9% to 71.9% in 100 years due to prioritization of
known-pedigree individuals for breeding. Without careful genetic management, the population could potentially maintain similar gene
diversity (87.8%) and inbreeding (F = 0.102) over the next 100 years, but pedigree knownness may not increase above 61.9%. Alternatively,
excluding all 20 individuals with 0% known pedigrees from breeding could help knownness increase to 81.6% over the next 100 years.
However, doing so would cause the population to decline to 63 individuals during the next three decades unless breeding can be further
increased among the remaining potentially breeding population. If the program can recruit new facilities capable of holding larger breeding
groups, with two females per male rather than one, a greater number of females would have potential breeding opportunities. As a result,
the population could grow to fill 90 spaces by producing 4 to 5 births/year under the same female probability of breeding required
otherwise (p[B] = 13%). With routine importation, the river hippopotamus population could remain demographically stable and potentially
maintain more than 90% gene diversity among known-pedigree individuals over the next 100 years. Conversely, routine exportation
without any imports and an average of 3 to 4 births/year (p[B] = 13%) would cause the population to decline during the next century.
MANAGEMENT ACTIONS Given the current challenges for the river hippopotamus population, PVA results indicate that the following changes in management should
be considered in an effort to improve this population’s sustainability. Note that the PVA allows us to compare between hypothetical
changes, but cannot evaluate whether achieving these changes is feasible, practical, or desirable given the program’s constraints.
To remain demographically stable, increase breeding: If breeding can be increased from an average of ~1 birth per year to 3 to 4
births each year, the river hippopotamus population could remain near its current size and maintain nearly 90% gene diversity
among known-pedigree individuals over the next century. This breeding rate would be difficult to achieve unless facilities capable
of housing breeding groups and bachelor groups are constructed. Program managers recommend that new breeding facilities be
capable of holding at least two adult females per adult male and allow for separation of adult males from females and their
offspring. If the river hippo population produces fewer than 3 to 4 births per year, it could be expected to decline during the next
100 years.
2016 Population Viability Analyses for AZA River Hippopotamus Animal Program 3
FULL REPORT
POPULATION VIABILITY ANALYSIS (PVA) APPROACH
A Population Viability Analysis (PVA) is a model that projects the likely future status of a population. PVAs are used to
evaluate long-term demographic and genetic sustainability and extinction risk, identify key factors impacting a population’s
dynamics, and compare alternative management strategies.
This PVA utilizes ZooRisk, a computer software package that models the future dynamics of a cooperatively-bred population
using that population’s age and sex structure, mortality and reproductive rates, and genetic structure (Earnhardt et al., 2008).
ZooRisk is individual-based, meaning it tracks every animal (current and future) in the population over time. It also includes
stochasticity, the randomness in mortality, fecundity, and birth sex ratios among individuals, which is especially important for
small populations. Because of this stochasticity, we run each model many times, allowing us to determine the range of
potential outcomes a population could experience under a given set of conditions.
The most powerful use of PVAs is to compare a baseline scenario, reflecting the population’s likely future trajectory if no
management changes are made, to alternate scenarios reflecting potential management changes. For zoo and aquarium
populations, these alternate scenarios typically involve varying breeding rates (probability of breeding), potential space for
the population, importation or exportation rates, mortality rates, or genetic management strategies. These comparisons can
help evaluate the relative costs and benefits of possible management actions. Because the future can be uncertain and
difficult to predict, model results are most appropriately used to compare between scenarios (e.g. relative to each other)
rather than as absolute predictions of what will happen.
Full documentation on ZooRisk can be found in the software’s manual (Faust et al., 2008); complete details on the modeling
approach for this PVA, including data sources, parameter values, and model setup, can be found in Appendix A.
2016 Population Viability Analyses for AZA River Hippopotamus Animal Program 4
POPULATION HISTORY AND CURRENT STATUS
Data presented in this section pertain to a starting population of river hippos housed among 31 AZA institutions (holding 79
individuals) and one non-AZA partner institutions (holding one individual) in North America. Information about the status of
river hippos strictly within AZA can be found in Appendix B.
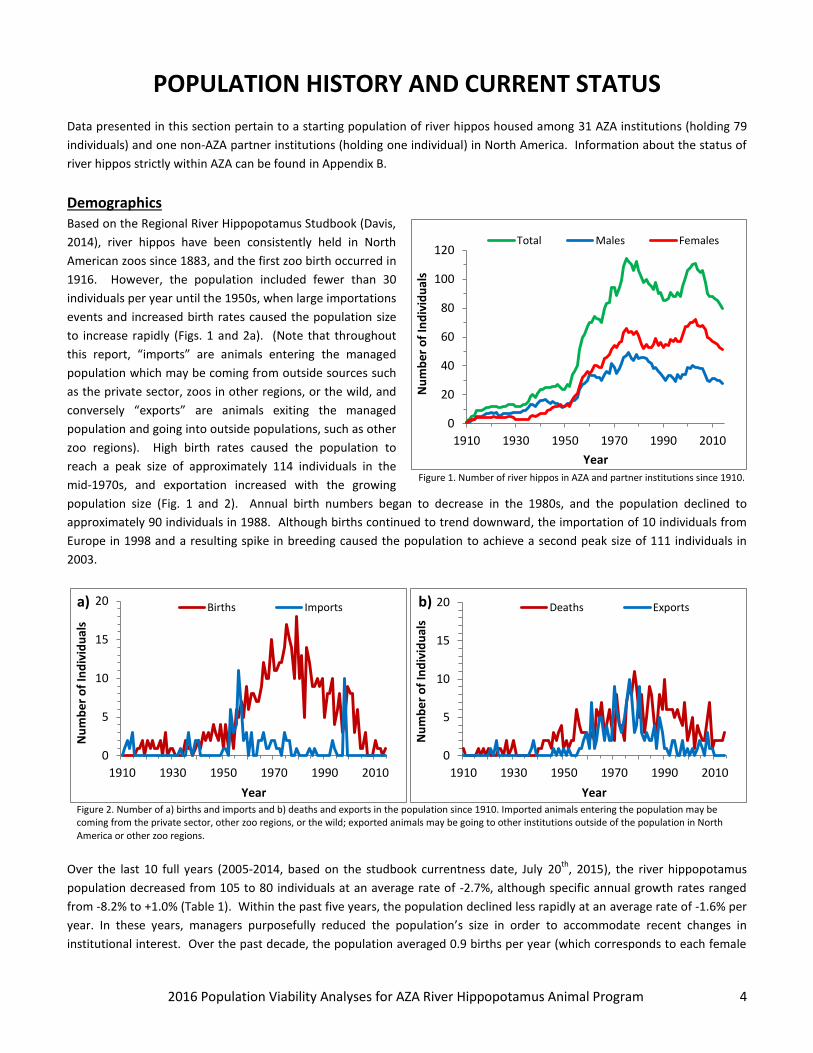
Demographics Based on the Regional River Hippopotamus Studbook (Davis,
2014), river hippos have been consistently held in North
American zoos since 1883, and the first zoo birth occurred in
1916. However, the population included fewer than 30
individuals per year until the 1950s, when large importations
events and increased birth rates caused the population size
to increase rapidly (Figs. 1 and 2a). (Note that throughout
this report, “imports” are animals entering the managed
population which may be coming from outside sources such
as the private sector, zoos in other regions, or the wild, and
conversely “exports” are animals exiting the managed
population and going into outside populations, such as other
zoo regions). High birth rates caused the population to
reach a peak size of approximately 114 individuals in the
mid-1970s, and exportation increased with the growing
population size (Fig. 1 and 2). Annual birth numbers began to decrease in the 1980s, and the population declined to
approximately 90 individuals in 1988. Although births continued to trend downward, the importation of 10 individuals from
Europe in 1998 and a resulting spike in breeding caused the population to achieve a second peak size of 111 individuals in
2003.
Over the last 10 full years (2005-2014, based on the studbook currentness date, July 20th
, 2015), the river hippopotamus
population decreased from 105 to 80 individuals at an average rate of -2.7%, although specific annual growth rates ranged
from -8.2% to +1.0% (Table 1). Within the past five years, the population declined less rapidly at an average rate of -1.6% per
year. In these years, managers purposefully reduced the population’s size in order to accommodate recent changes in
institutional interest. Over the past decade, the population averaged 0.9 births per year (which corresponds to each female
0
5
10
15
20
1910 1930 1950 1970 1990 2010
Nu
mb
er
of
Ind
ivid
ual
s
Year
Births Imports
0
5
10
15
20
1910 1930 1950 1970 1990 2010
Nu
mb
er
of
Ind
ivid
ual
s
Year
Deaths Exportsa) b)
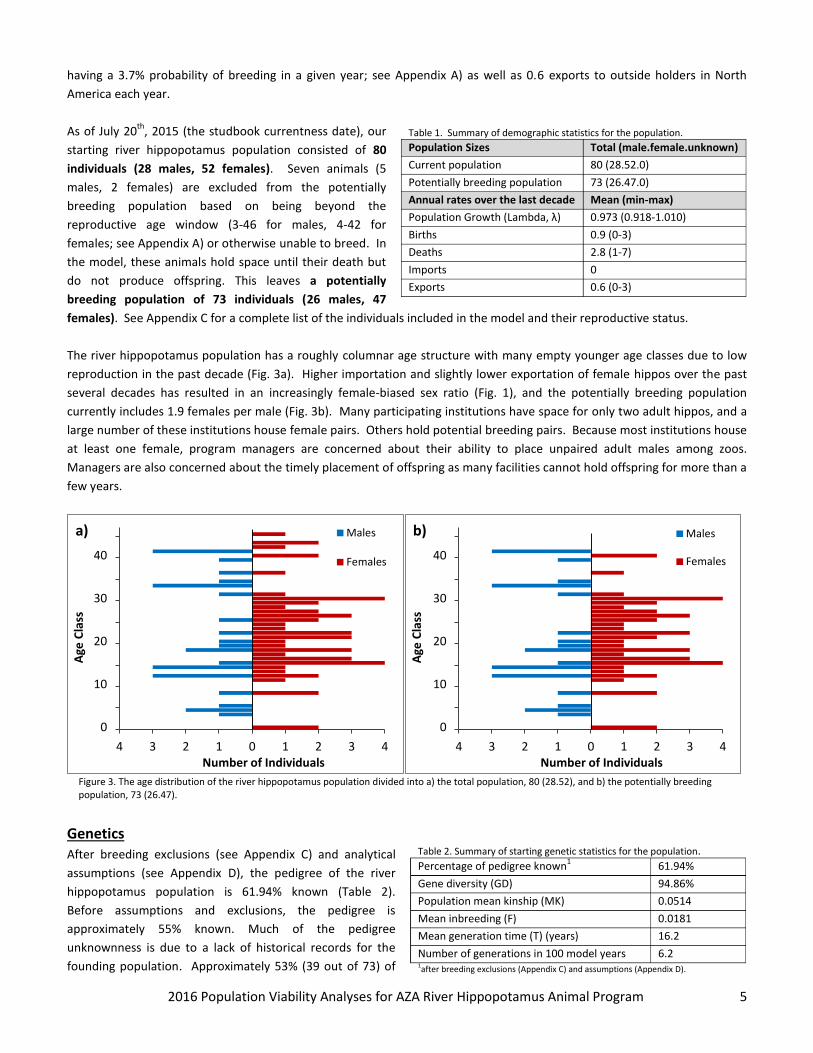
Figure 2. Number of a) births and imports and b) deaths and exports in the population since 1910. Imported animals entering the population may be coming from the private sector, other zoo regions, or the wild; exported animals may be going to other institutions outside of the population in North America or other zoo regions.
0
20
40
60
80
100
120
1910 1930 1950 1970 1990 2010
Nu
mb
er
of
Ind
ivid
ual
s
Year
Total Males Females
Figure 1. Number of river hippos in AZA and partner institutions since 1910.
2016 Population Viability Analyses for AZA River Hippopotamus Animal Program 5
Table 1. Summary of demographic statistics for the population.
Population Sizes Total (male.female.unknown)
Current population 80 (28.52.0)
Potentially breeding population 73 (26.47.0)
Annual rates over the last decade Mean (min-max)
Population Growth (Lambda, λ) 0.973 (0.918-1.010)
Births 0.9 (0-3)
Deaths 2.8 (1-7)
Imports 0
Exports 0.6 (0-3)
having a 3.7% probability of breeding in a given year; see Appendix A) as well as 0.6 exports to outside holders in North
America each year.
As of July 20th
, 2015 (the studbook currentness date), our
starting river hippopotamus population consisted of 80
males, 2 females) are excluded from the potentially
breeding population based on being beyond the
reproductive age window (3-46 for males, 4-42 for
females; see Appendix A) or otherwise unable to breed. In
the model, these animals hold space until their death but
do not produce offspring. This leaves a potentially
breeding population of 73 individuals (26 males, 47
females). See Appendix C for a complete list of the individuals included in the model and their reproductive status.
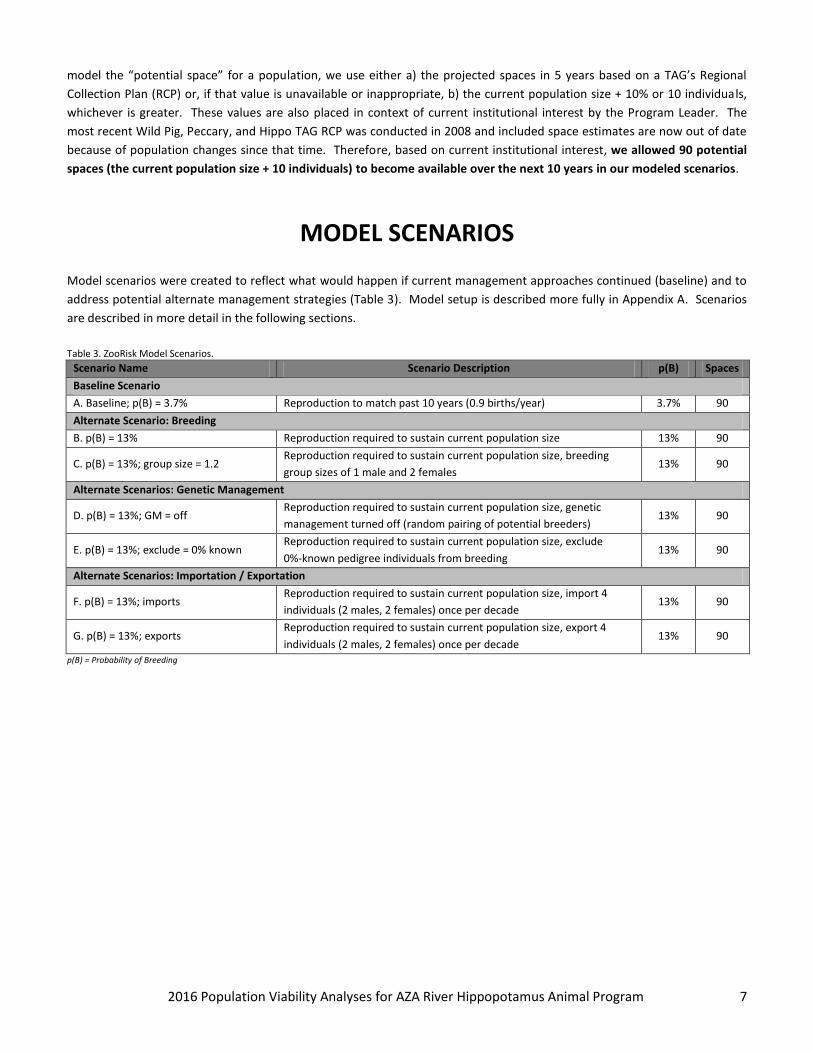
The river hippopotamus population has a roughly columnar age structure with many empty younger age classes due to low
reproduction in the past decade (Fig. 3a). Higher importation and slightly lower exportation of female hippos over the past
several decades has resulted in an increasingly female-biased sex ratio (Fig. 1), and the potentially breeding population
currently includes 1.9 females per male (Fig. 3b). Many participating institutions have space for only two adult hippos, and a
large number of these institutions house female pairs. Others hold potential breeding pairs. Because most institutions house
at least one female, program managers are concerned about their ability to place unpaired adult males among zoos.
Managers are also concerned about the timely placement of offspring as many facilities cannot hold offspring for more than a
few years.
Genetics After breeding exclusions (see Appendix C) and analytical
assumptions (see Appendix D), the pedigree of the river
hippopotamus population is 61.94% known (Table 2).
Before assumptions and exclusions, the pedigree is
approximately 55% known. Much of the pedigree
unknownness is due to a lack of historical records for the
founding population. Approximately 53% (39 out of 73) of
4 3 2 1 0 1 2 3 4
0
10
20
30
40
Number of Individuals
Age
Cla
ss
Males
Females
4 3 2 1 0 1 2 3 4
0
10
20
30
40
Number of Individuals
Age
Cla
ss
Males
Females
Figure 3. The age distribution of the river hippopotamus population divided into a) the total population, 80 (28.52), and b) the potentially breeding population, 73 (26.47).
a) b)
Table 2. Summary of starting genetic statistics for the population. Percentage of pedigree known
1 61.94%
Gene diversity (GD) 94.86%
Population mean kinship (MK) 0.0514
Mean inbreeding (F) 0.0181
Mean generation time (T) (years) 16.2
Number of generations in 100 model years 6.2 1after breeding exclusions (Appendix C) and assumptions (Appendix D).
2016 Population Viability Analyses for AZA River Hippopotamus Animal Program 6
individuals in the current potentially breeding population have some amount of pedigree unknownness. Because reported
genetic metrics are only representative of the known portion of the population, they may not accurately reflect actual gene
diversity or inbreeding of the entire population. Consequently, actual inbreeding or gene diversity may be higher or lower
than the reported values and should only be considered as reliable as the percent of the pedigree known. The known
portion of the managed population is descended from 33 founders and no additional potential founders remain. Current
gene diversity of the known-pedigree individuals is estimated to be 94.86%. As gene diversity falls, reproduction may
become increasingly compromised by lower birth weights, greater neonatal mortality, and other negative factors.
The known-pedigree population is currently estimated to have a mean inbreeding level of 0.0181 (a mean inbreeding
coefficient of 0.0625 is equivalent to mating between first cousins with no prior inbreeding). One of the largest genetic
threats to small populations is the potential for inbreeding depression, in which breeding between close relatives results in
reductions in fecundity or litter size, increases in infant mortality, and other detrimental effects (DeRose and Roff, 1999;
Koeninger Ryan, et al., 2002; Ballou and Foose, 1996; Reed and Frankham, 2003). Given the high amount of pedigree
unknownness for the river hippopotamus population, it is not appropriate to test for possible effects of inbreeding on infant
mortality. Although we cannot determine if inbreeding is impacting the population at this time, inbreeding may be currently
affecting the population or may become a threat in the future and should therefore be avoided (as prescribed by the SSP’s
population advisor) as much as possible. Because modeling inbreeding depression adds an additional layer of complexity to
interpretation of results, we do not include a “standard” inbreeding depression effect in the PVA models. There are several
strategies that can delay the effects or lower the probability of inbreeding depression including pairing based on mean
kinship and importing and breeding unrelated individuals (Ballou and Lacy, 1995). Genetic management was incorporated
into our model setup unless otherwise specified. Because inbreeding depression is not included in our modeled scenarios,
readers should consider that model results may be optimistic if inbreeding depression begins to impact the population.
Management and Challenges The river hippopotamus population is currently designated as a Yellow Species Survival Plan® (SSP). The starting population
in our PVA is housed among 31 AZA institutions and one non-AZA partner institution, Louisiana Purchase Gardens & Zoo.
Among these 32 institutions, five hold potential breeding groups with three or more adult hippos, and seven hold potential
breeding pairs. Thirteen institutions hold only one or two adult females, six hold only one or two adult males, and one holds
a breeding-age male with a post-reproductive female. The majority of current institutions do not have space to hold more
than two adult hippos. Because male and female river hippos tend to breed readily when housed together, additional space
is usually required to separate the pair for extended periods of time and limit breeding. Consequently, many institutions
choose to hold two adult females instead of a potential breeding pair. Because of this practice, managers often have
difficulty in placing adult male river hippos, which must be held singly, in spite of the population’s female-biased sex ratio.
Additionally, breeding is constrained by the limited number of breeding pairs that are formed. Ideally, more institutions
would be able to hold larger breeding groups that better accommodate the sex bias of 1.9 females per male in the potentially
breeding population and facilitate higher breeding rates.
River hippos are currently listed as Vulnerable in the wild by the IUCN (Lewison and Oliver, 2008) and as a CITES Appendix II
species (limited trade; UNEP-WCMC, 2015). Managed populations are held by zoos in Australia and Europe, and unmanaged
populations are held in Africa, Asia, and South America (ZIMS-ISIS, 2014). River hippos also exist at institutions outside of the
managed population in North America, including several zoos in Mexico. Despite these potential sources of imports, the AZA
River Hippopotamus Animal Program did not import within the past decade, and it has no formal plan to import animals at
this time. However, the program could potentially attempt to exchange individuals with European or Mexican institutions to
increase gene diversity in the future. Although a couple participating institutions have exported hippos within the past
decade and may continue to based on their individual needs, the program does not have formal plans to continue
exportation in the future.
ZooRisk can include a space limitation on population growth, reducing breeding as the population approaches the potential
space limit. This mimics the way a population manager would recommend fewer pairs when at capacity. To accurately
2016 Population Viability Analyses for AZA River Hippopotamus Animal Program 7
model the “potential space” for a population, we use either a) the projected spaces in 5 years based on a TAG’s Regional
Collection Plan (RCP) or, if that value is unavailable or inappropriate, b) the current population size + 10% or 10 individuals,
whichever is greater. These values are also placed in context of current institutional interest by the Program Leader. The
most recent Wild Pig, Peccary, and Hippo TAG RCP was conducted in 2008 and included space estimates are now out of date
because of population changes since that time. Therefore, based on current institutional interest, we allowed 90 potential
spaces (the current population size + 10 individuals) to become available over the next 10 years in our modeled scenarios.
MODEL SCENARIOS
Model scenarios were created to reflect what would happen if current management approaches continued (baseline) and to
address potential alternate management strategies (Table 3). Model setup is described more fully in Appendix A. Scenarios
are described in more detail in the following sections.
Table 3. ZooRisk Model Scenarios.
Scenario Name Scenario Description p(B) Spaces
Baseline Scenario
A. Baseline; p(B) = 3.7% Reproduction to match past 10 years (0.9 births/year) 3.7% 90
Alternate Scenario: Breeding
B. p(B) = 13% Reproduction required to sustain current population size 13% 90
C. p(B) = 13%; group size = 1.2 Reproduction required to sustain current population size, breeding
group sizes of 1 male and 2 females 13% 90
Alternate Scenarios: Genetic Management
D. p(B) = 13%; GM = off Reproduction required to sustain current population size, genetic
management turned off (random pairing of potential breeders) 13% 90
E. p(B) = 13%; exclude = 0% known Reproduction required to sustain current population size, exclude
0%-known pedigree individuals from breeding 13% 90
Alternate Scenarios: Importation / Exportation
F. p(B) = 13%; imports Reproduction required to sustain current population size, import 4
individuals (2 males, 2 females) once per decade 13% 90
G. p(B) = 13%; exports Reproduction required to sustain current population size, export 4
individuals (2 males, 2 females) once per decade 13% 90
p(B) = Probability of Breeding
2016 Population Viability Analyses for AZA River Hippopotamus Animal Program 8
POPULATION VIABILITY UNDER CURRENT MANAGEMENT BASELINE MODEL PVA RESULTS
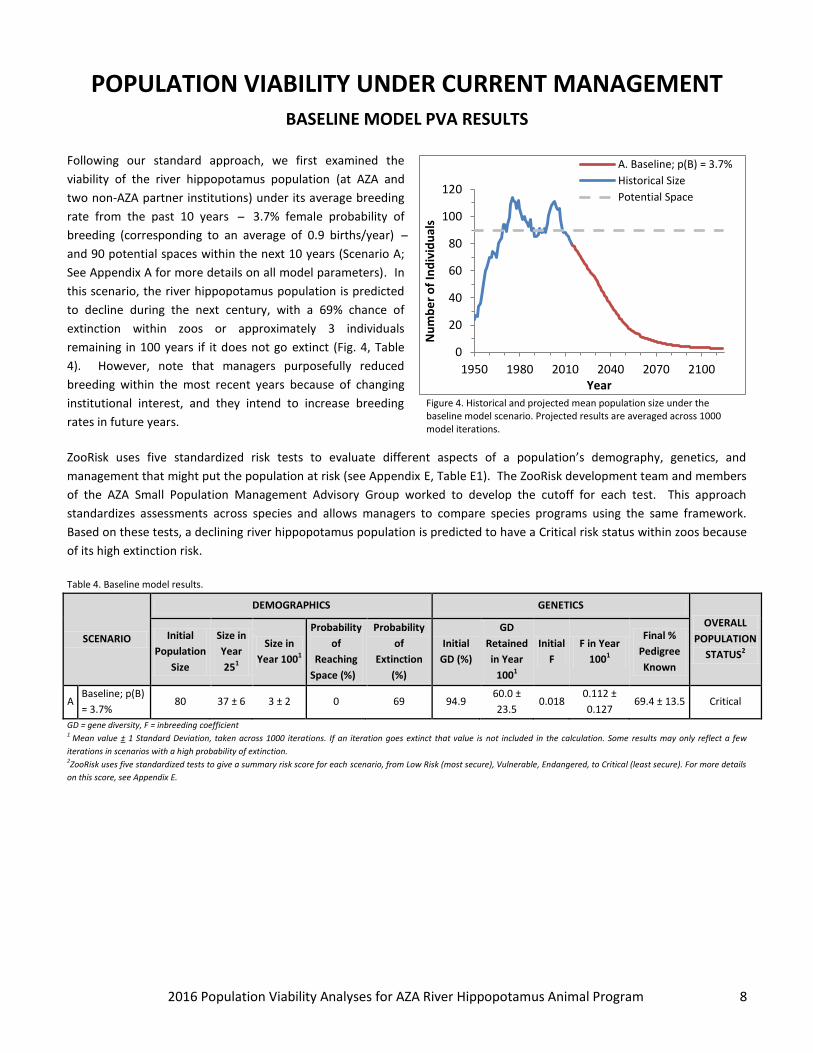
Following our standard approach, we first examined the
viability of the river hippopotamus population (at AZA and
two non-AZA partner institutions) under its average breeding
rate from the past 10 years 3.7% female probability of
breeding (corresponding to an average of 0.9 births/year)
and 90 potential spaces within the next 10 years (Scenario A;
See Appendix A for more details on all model parameters). In
this scenario, the river hippopotamus population is predicted
to decline during the next century, with a 69% chance of
extinction within zoos or approximately 3 individuals
remaining in 100 years if it does not go extinct (Fig. 4, Table
4). However, note that managers purposefully reduced
breeding within the most recent years because of changing
institutional interest, and they intend to increase breeding
rates in future years.
ZooRisk uses five standardized risk tests to evaluate different aspects of a population’s demography, genetics, and
management that might put the population at risk (see Appendix E, Table E1). The ZooRisk development team and members
of the AZA Small Population Management Advisory Group worked to develop the cutoff for each test. This approach
standardizes assessments across species and allows managers to compare species programs using the same framework.
Based on these tests, a declining river hippopotamus population is predicted to have a Critical risk status within zoos because
of its high extinction risk.
Table 4. Baseline model results.
SCENARIO
DEMOGRAPHICS GENETICS
OVERALL
POPULATION
STATUS2
Initial
Population
Size
Size in
Year
251
Size in
Year 1001
Probability
of
Reaching
Space (%)
Probability
of
Extinction
(%)
Initial
GD (%)
GD
Retained
in Year
1001
Initial
F
F in Year
1001
Final %
Pedigree
Known
A Baseline; p(B)
= 3.7% 80 37 ± 6 3 ± 2 0 69 94.9
60.0 ±
23.5 0.018
0.112 ±
0.127 69.4 ± 13.5 Critical
GD = gene diversity, F = inbreeding coefficient 1 Mean value ± 1 Standard Deviation, taken across 1000 iterations. If an iteration goes extinct that value is not included in the calculation. Some results may only reflect a few
iterations in scenarios with a high probability of extinction. 2ZooRisk uses five standardized tests to give a summary risk score for each scenario, from Low Risk (most secure), Vulnerable, Endangered, to Critical (least secure). For more details
on this score, see Appendix E.
0
20
40
60
80
100
120
1950 1980 2010 2040 2070 2100
Nu
mb
er
of
Ind
ivid
ual
s
Year
A. Baseline; p(B) = 3.7%
Historical Size
Potential Space
Figure 4. Historical and projected mean population size under the baseline model scenario. Projected results are averaged across 1000 model iterations.
2016 Population Viability Analyses for AZA River Hippopotamus Animal Program 9
ALTERNATE MODEL SCENARIOS
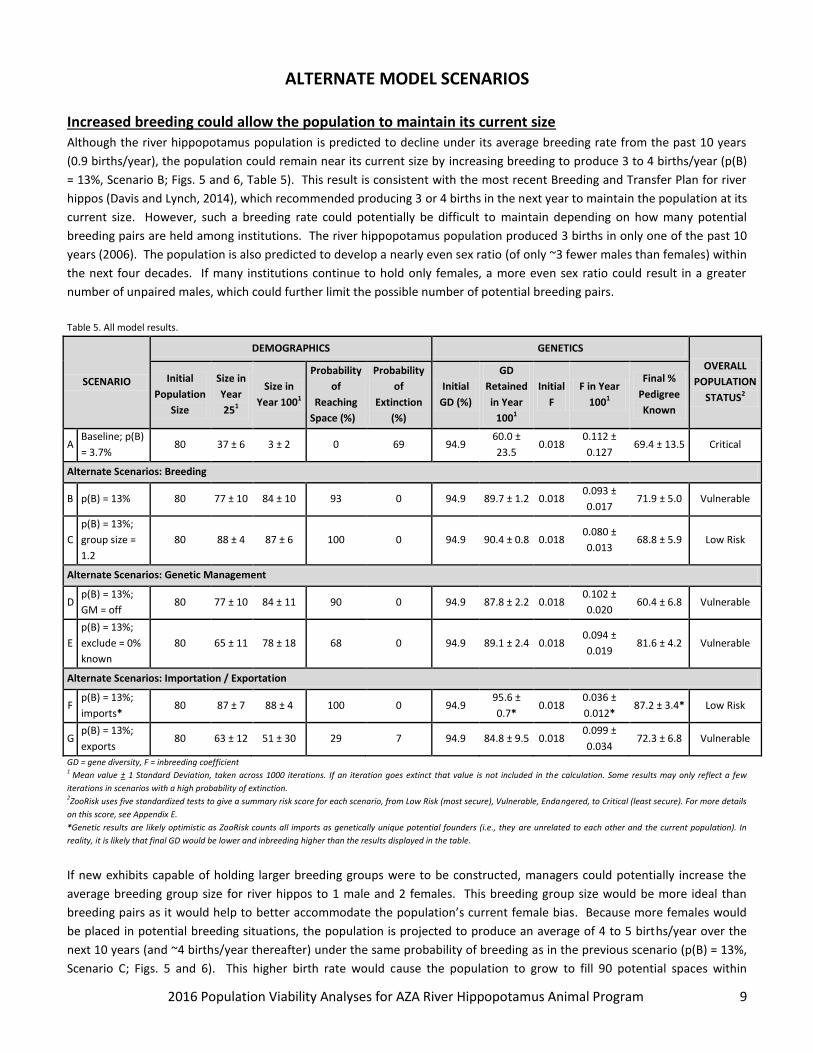
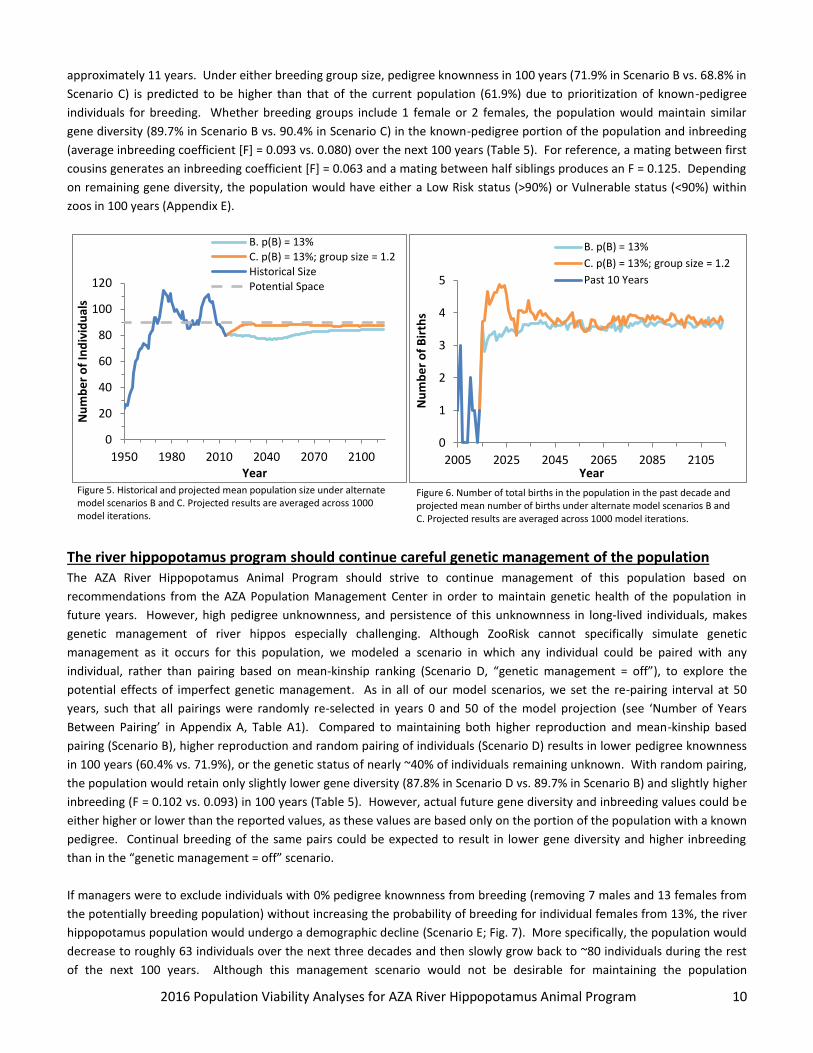
Increased breeding could allow the population to maintain its current size Although the river hippopotamus population is predicted to decline under its average breeding rate from the past 10 years
(0.9 births/year), the population could remain near its current size by increasing breeding to produce 3 to 4 births/year (p(B)
= 13%, Scenario B; Figs. 5 and 6, Table 5). This result is consistent with the most recent Breeding and Transfer Plan for river
hippos (Davis and Lynch, 2014), which recommended producing 3 or 4 births in the next year to maintain the population at its
current size. However, such a breeding rate could potentially be difficult to maintain depending on how many potential
breeding pairs are held among institutions. The river hippopotamus population produced 3 births in only one of the past 10
years (2006). The population is also predicted to develop a nearly even sex ratio (of only ~3 fewer males than females) within
the next four decades. If many institutions continue to hold only females, a more even sex ratio could result in a greater
number of unpaired males, which could further limit the possible number of potential breeding pairs.
GD = gene diversity, F = inbreeding coefficient 1 Mean value ± 1 Standard Deviation, taken across 1000 iterations. If an iteration goes extinct that value is not included in the calculation. Some results may only reflect a few
iterations in scenarios with a high probability of extinction. 2ZooRisk uses five standardized tests to give a summary risk score for each scenario, from Low Risk (most secure), Vulnerable, Endangered, to Critical (least secure). For more details
on this score, see Appendix E.
*Genetic results are likely optimistic as ZooRisk counts all imports as genetically unique potential founders (i.e., they are unrelated to each other and the current population). In
reality, it is likely that final GD would be lower and inbreeding higher than the results displayed in the table.
If new exhibits capable of holding larger breeding groups were to be constructed, managers could potentially increase the
average breeding group size for river hippos to 1 male and 2 females. This breeding group size would be more ideal than
breeding pairs as it would help to better accommodate the population’s current female bias. Because more females would
be placed in potential breeding situations, the population is projected to produce an average of 4 to 5 births/year over the
next 10 years (and ~4 births/year thereafter) under the same probability of breeding as in the previous scenario (p(B) = 13%,
Scenario C; Figs. 5 and 6). This higher birth rate would cause the population to grow to fill 90 potential spaces within
2016 Population Viability Analyses for AZA River Hippopotamus Animal Program 10
approximately 11 years. Under either breeding group size, pedigree knownness in 100 years (71.9% in Scenario B vs. 68.8% in
Scenario C) is predicted to be higher than that of the current population (61.9%) due to prioritization of known-pedigree
individuals for breeding. Whether breeding groups include 1 female or 2 females, the population would maintain similar
gene diversity (89.7% in Scenario B vs. 90.4% in Scenario C) in the known-pedigree portion of the population and inbreeding
(average inbreeding coefficient [F] = 0.093 vs. 0.080) over the next 100 years (Table 5). For reference, a mating between first
cousins generates an inbreeding coefficient [F] = 0.063 and a mating between half siblings produces an F = 0.125. Depending
on remaining gene diversity, the population would have either a Low Risk status (>90%) or Vulnerable status (<90%) within
zoos in 100 years (Appendix E).
The river hippopotamus program should continue careful genetic management of the population The AZA River Hippopotamus Animal Program should strive to continue management of this population based on
recommendations from the AZA Population Management Center in order to maintain genetic health of the population in
future years. However, high pedigree unknownness, and persistence of this unknownness in long-lived individuals, makes
genetic management of river hippos especially challenging. Although ZooRisk cannot specifically simulate genetic
management as it occurs for this population, we modeled a scenario in which any individual could be paired with any
individual, rather than pairing based on mean-kinship ranking (Scenario D, “genetic management = off”), to explore the
potential effects of imperfect genetic management. As in all of our model scenarios, we set the re-pairing interval at 50
years, such that all pairings were randomly re-selected in years 0 and 50 of the model projection (see ‘Number of Years
Between Pairing’ in Appendix A, Table A1). Compared to maintaining both higher reproduction and mean-kinship based
pairing (Scenario B), higher reproduction and random pairing of individuals (Scenario D) results in lower pedigree knownness
in 100 years (60.4% vs. 71.9%), or the genetic status of nearly ~40% of individuals remaining unknown. With random pairing,
the population would retain only slightly lower gene diversity (87.8% in Scenario D vs. 89.7% in Scenario B) and slightly higher
inbreeding (F = 0.102 vs. 0.093) in 100 years (Table 5). However, actual future gene diversity and inbreeding values could be
either higher or lower than the reported values, as these values are based only on the portion of the population with a known
pedigree. Continual breeding of the same pairs could be expected to result in lower gene diversity and higher inbreeding
than in the “genetic management = off” scenario.
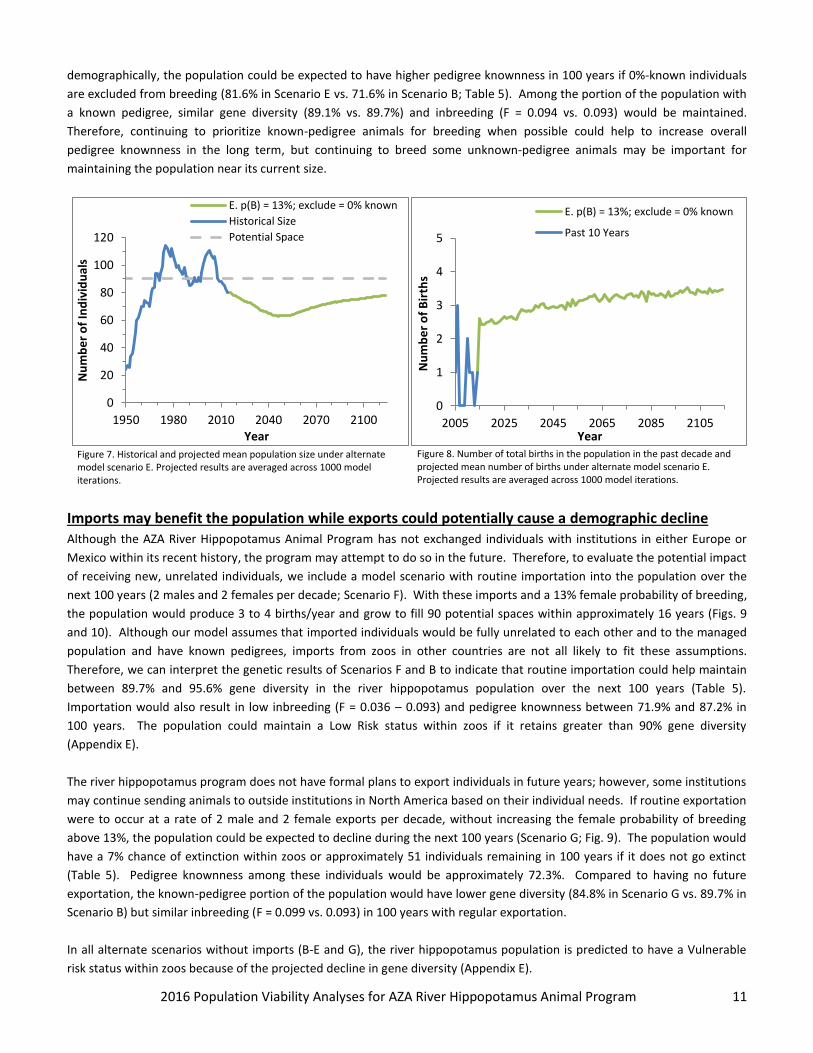
If managers were to exclude individuals with 0% pedigree knownness from breeding (removing 7 males and 13 females from
the potentially breeding population) without increasing the probability of breeding for individual females from 13%, the river
hippopotamus population would undergo a demographic decline (Scenario E; Fig. 7). More specifically, the population would
decrease to roughly 63 individuals over the next three decades and then slowly grow back to ~80 individuals during the rest
of the next 100 years. Although this management scenario would not be desirable for maintaining the population
0
20
40
60
80
100
120
1950 1980 2010 2040 2070 2100
Nu
mb
er
of
Ind
ivid
ual
s
Year
B. p(B) = 13%C. p(B) = 13%; group size = 1.2Historical SizePotential Space
Figure 5. Historical and projected mean population size under alternate model scenarios B and C. Projected results are averaged across 1000 model iterations.
0
1
2
3
4
5
2005 2025 2045 2065 2085 2105
Nu
mb
er
of
Bir
ths
Year
B. p(B) = 13%
C. p(B) = 13%; group size = 1.2
Past 10 Years
Figure 6. Number of total births in the population in the past decade and projected mean number of births under alternate model scenarios B and C. Projected results are averaged across 1000 model iterations.
2016 Population Viability Analyses for AZA River Hippopotamus Animal Program 11
demographically, the population could be expected to have higher pedigree knownness in 100 years if 0%-known individuals
are excluded from breeding (81.6% in Scenario E vs. 71.6% in Scenario B; Table 5). Among the portion of the population with
a known pedigree, similar gene diversity (89.1% vs. 89.7%) and inbreeding (F = 0.094 vs. 0.093) would be maintained.
Therefore, continuing to prioritize known-pedigree animals for breeding when possible could help to increase overall
pedigree knownness in the long term, but continuing to breed some unknown-pedigree animals may be important for
maintaining the population near its current size.
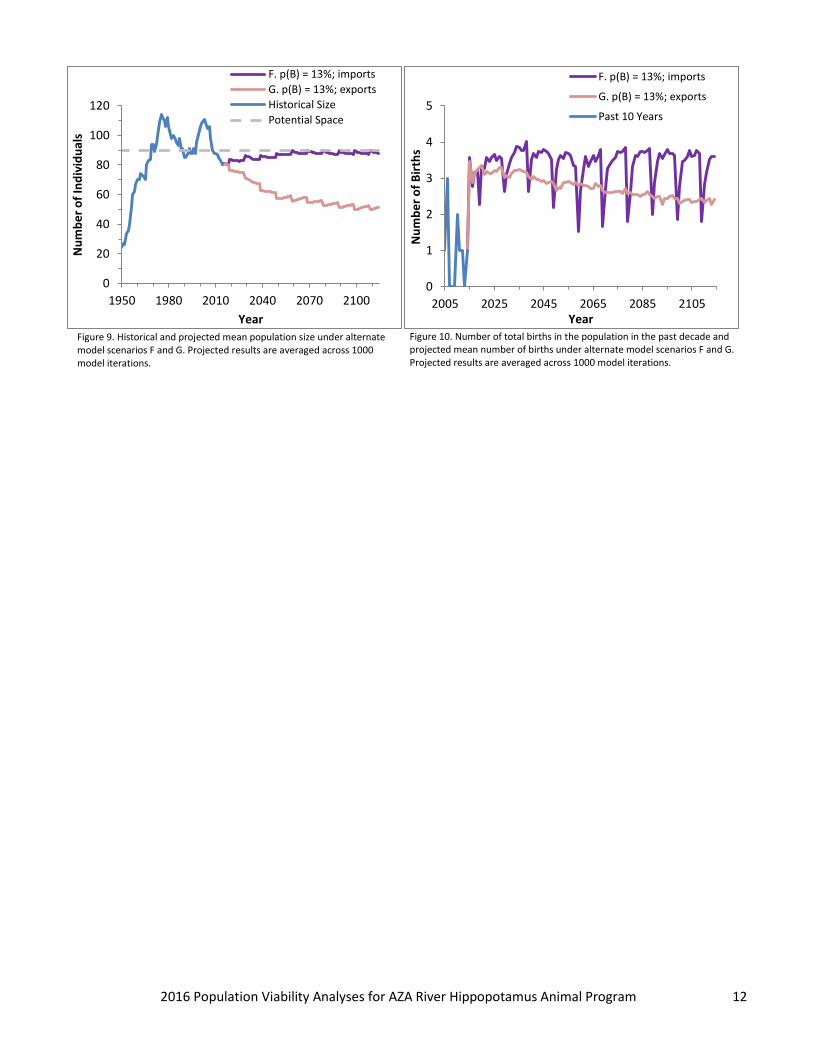
Imports may benefit the population while exports could potentially cause a demographic decline
Although the AZA River Hippopotamus Animal Program has not exchanged individuals with institutions in either Europe or
Mexico within its recent history, the program may attempt to do so in the future. Therefore, to evaluate the potential impact
of receiving new, unrelated individuals, we include a model scenario with routine importation into the population over the
next 100 years (2 males and 2 females per decade; Scenario F). With these imports and a 13% female probability of breeding,
the population would produce 3 to 4 births/year and grow to fill 90 potential spaces within approximately 16 years (Figs. 9
and 10). Although our model assumes that imported individuals would be fully unrelated to each other and to the managed
population and have known pedigrees, imports from zoos in other countries are not all likely to fit these assumptions.
Therefore, we can interpret the genetic results of Scenarios F and B to indicate that routine importation could help maintain
between 89.7% and 95.6% gene diversity in the river hippopotamus population over the next 100 years (Table 5).
Importation would also result in low inbreeding (F = 0.036 – 0.093) and pedigree knownness between 71.9% and 87.2% in
100 years. The population could maintain a Low Risk status within zoos if it retains greater than 90% gene diversity
(Appendix E).
The river hippopotamus program does not have formal plans to export individuals in future years; however, some institutions
may continue sending animals to outside institutions in North America based on their individual needs. If routine exportation
were to occur at a rate of 2 male and 2 female exports per decade, without increasing the female probability of breeding
above 13%, the population could be expected to decline during the next 100 years (Scenario G; Fig. 9). The population would
have a 7% chance of extinction within zoos or approximately 51 individuals remaining in 100 years if it does not go extinct
(Table 5). Pedigree knownness among these individuals would be approximately 72.3%. Compared to having no future
exportation, the known-pedigree portion of the population would have lower gene diversity (84.8% in Scenario G vs. 89.7% in
Scenario B) but similar inbreeding (F = 0.099 vs. 0.093) in 100 years with regular exportation.
In all alternate scenarios without imports (B-E and G), the river hippopotamus population is predicted to have a Vulnerable
risk status within zoos because of the projected decline in gene diversity (Appendix E).
0
20
40
60
80
100
120
1950 1980 2010 2040 2070 2100
Nu
mb
er
of
Ind
ivid
ual
s
Year
E. p(B) = 13%; exclude = 0% known
Historical Size
Potential Space
Figure 7. Historical and projected mean population size under alternate model scenario E. Projected results are averaged across 1000 model iterations.
0
1
2
3
4
5
2005 2025 2045 2065 2085 2105N
um
be
r o
f B
irth
s Year
E. p(B) = 13%; exclude = 0% known
Past 10 Years
Figure 8. Number of total births in the population in the past decade and projected mean number of births under alternate model scenario E. Projected results are averaged across 1000 model iterations.
2016 Population Viability Analyses for AZA River Hippopotamus Animal Program 12
0
20
40
60
80
100
120
1950 1980 2010 2040 2070 2100
Nu
mb
er
of
Ind
ivid
ual
s
Year
F. p(B) = 13%; imports
G. p(B) = 13%; exports
Historical Size
Potential Space
Figure 9. Historical and projected mean population size under alternate model scenarios F and G. Projected results are averaged across 1000 model iterations.
0
1
2
3
4
5
2005 2025 2045 2065 2085 2105
Nu
mb
er
of
Bir
ths
Year
F. p(B) = 13%; imports
G. p(B) = 13%; exports
Past 10 Years
Figure 10. Number of total births in the population in the past decade and projected mean number of births under alternate model scenarios F and G. Projected results are averaged across 1000 model iterations.
2016 Population Viability Analyses for AZA River Hippopotamus Animal Program 13
MANAGEMENT ACTIONS Given the current challenges for the river hippopotamus population, PVA results indicate that the following changes in
management should be considered in an effort to improve this population’s sustainability. Note that the PVA allows us to
compare between hypothetical changes, but cannot evaluate whether achieving these changes is feasible, practical, or
desirable given the program’s constraints.
To remain demographically stable, increase breeding: If breeding can be increased from an average of ~1 birth per
year to 3 to 4 births each year, the river hippopotamus population could remain near its current size and maintain
nearly 90% gene diversity among known-pedigree individuals over the next century. This breeding rate would be
difficult to achieve unless facilities capable of housing breeding groups and bachelor groups are constructed.
Program managers recommend that new breeding facilities be capable of holding at least two adult females per
adult male and allow for separation of adult males from females and their offspring. If the river hippo population
produces fewer than 3 to 4 births per year, it could be expected to decline during the next 100 years.
CONCLUSIONS This model is a scientifically-sound comprehensive tool to be used by population managers for assessing future directions for
the animal program. This PVA report is provided to the AZA community and others to integrate into management of the
important species within our care. The PVA model results are intended to provide the necessary data to make science-based
decisions.
Our model results illustrate that under recent management practices, the river hippopotamus population could be expected
to decline during the next century. Increasing breeding to consistently produce 3 to 4 births per year, however, could help
the population remain near its current size. This breeding rate will likely be difficult to achieve given current exhibit spaces.
Therefore, the program recommends that more institutions commit to designing facilities capable of managing breeding
groups with at least two adult females per adult male. These facilities should allow for separation of adult males from
females and their offspring, and be able to hold calves for up to three years. More facilities may also be needed to hold
bachelor males as the population develops a less female-biased sex ratio in future years. Continuing to incorporate
unknown-pedigree individuals into the breeding population may help to achieve an increased breeding rate, but would
perpetuate uncertainty in future genetic metrics. Because of the difficulty in moving and introducing river hippos to different
institutions, precise genetic management of this population is unlikely, but managers should continue to follow breeding
recommendations as they are issued by the program in Breeding and Transfer Plans. Increasing breeding to 3 to 4 births per
year could potentially allow the population to retain nearly 90% gene diversity among known-pedigree individuals for 100
years, but importing unrelated individuals from outside institutions could help managers to more easily fill potential spaces
and possibly retain higher gene diversity over the next century. Conversely, exporting individuals without imports or further
increased breeding could be expected to result in a population decline. The AZA River Hippopotamus Animal Program should
consider implementing the recommended management actions in order to keep the population on the path towards long-
term sustainability within AZA and partner institutions.
2016 Population Viability Analyses for AZA River Hippopotamus Animal Program 14
ACKNOWLEDGEMENTS A meeting was conducted on August 13
th, 2015 to discuss the river hippopotamus population and was attended by the
following:
Brent Johnson, Population Biologist , Lincoln Park Zoo, [email protected]
Kayla Melton, Research Assistant, Lincoln Park Zoo, [email protected]
John Davis, AZA River Hippopotamus Animal Program SSP Coordinator and Studbook Keeper, Riverbanks Zoo & Garden, [email protected]
Katelyn Mucha, AZA Population Advisor, Lincoln Park Zoo, [email protected] Martin Ramirez, Wild Pig, Peccary, Hippo TAG Chair, Woodland Park Zoo, [email protected]
Jeff Holland, Wild Pig, Peccary, Hippo TAG Vice Chair, Los Angeles Zoo and Botanical Gardens, [email protected]
This report was also reviewed by:
Candice Dorsey, Vice-President of Animal Programs, Association of Zoos and Aquariums, [email protected]
Kayla Melton, Research Assistant, Lincoln Park Zoo, [email protected]
John Davis, AZA River Hippopotamus Animal Program SSP Coordinator and Studbook Keeper, Riverbanks Zoo & Garden, [email protected]
Colleen Lynch, AZA Population Advisor, Riverbanks Zoo and Garden, [email protected]
Martin Ramirez, Wild Pig, Peccary, Hippo TAG Chair, Woodland Park Zoo, [email protected]
Jeff Holland, Wild Pig, Peccary, Hippo TAG Vice Chair, Los Angeles Zoo and Botanical Gardens, [email protected]
Lisa Faust, Vice President of Conservation and Science, Lincoln Park Zoo, [email protected] If you have any questions about the report, please contact Lisa Faust at [email protected] Analyses in this report utilized the North American Regional River Hippopotamus (Hippopotamus amphibius) Studbook current to 20 July 2015 (Davis, 2015) and was performed using Poplink 2.4 and ZooRisk 3.8. Funding provided by Institute of Museum and Library Services (IMLS) LG-25-11-018 and MG-30-13-0065-13 to the Association of Zoos and Aquariums. Cover photo: courtesy of Richard W. Rokes (Davis and Lynch, 2014). Citation: Johnson, B., Davis, J., Ramirez, M., and Holland, J. 2015. River Hippopotamus (Hippopotamus amphibius) AZA Animal Program
Population Viability Analysis Report. Lincoln Park Zoo, Chicago, IL.
The contents of this report including opinions and interpretation of results are based on discussions between the project team
and do not necessarily reflect the opinion or position of Lincoln Park Zoo, Association of Zoos and Aquariums, and other
collaborating institutions. The population model and results are based on the project team’s best understanding of the
current biology and management of this population. They should not be regarded as absolute predictions of the population’s
future, as many factors may impact its future status.
2016 Population Viability Analyses for AZA River Hippopotamus Animal Program 15
LITERATURE CITED Association of Zoos and Aquariums. Zoological Information Management System – International Species Information System,
Version 1.7 Updated: 27 Jan. 2014. Accessed: 10 Aug. 2015. <https://zims.isis.org>
AZA Wild Pig, Peccary, and Hippo Taxon Advisory Group (TAG). 2008. Wild Pig, Peccary, and Hippo Taxon Advisory Group
Regional Collection Plan (RCP) – 2nd
Edition.
Ballou, J. D. and R. C. Lacy. 1995. Identifying genetically important individuals for management of genetic variation in pedigreed populations. Pages 76-111 in J. D. Ballou, M. Gilpin, and T. J. Foose, eds. Population Management for Survival and Recovery: Analytical Methods and Strategies in Small Population Conservation. Columbia University Press, New York. Ballou, J. D. and T. J. Foose. 1996. Demographic and genetic management of captive populations. Pages 263-283 in S. Lumpkin, ed. Wild Mammals in Captivity. University of Chicago Press, Chicago. Davis, J. 2015. River Hippopotamus (Hippopotamus amphibius) AZA Studbook. Riverbanks Zoo and Garden. Davis, J. and Lynch, C. 2014. River Hippopotamus (Hippopotamus amphibius) AZA Species Survival Plan® Yellow Program
Population Analysis and Breeding & Transfer Plan. Riverbanks Zoo and Garden, Columbia, SC.
DeRose, M. A. and D. A. Roff. 1999. A comparison of inbreeding depression in life-history and morphological traits in animals. Evolution 53: 1288-1292. Earnhardt, J. M., Bergstrom, Y. M., Lin, A., Faust, L. J., Schloss, C. A., and S. D. Thompson. 2008. ZooRisk: A Risk Assessment Tool. Version 3.8. Lincoln Park Zoo. Chicago, IL. Faust, L.J., Earnhardt, J. M., Schloss, C. A., and Y. M. Bergstrom. 2008. ZooRisk: A Risk Assessment Tool. Version 3.8 User’s Manual. Lincoln Park Zoo. Chicago, IL. Koeninger Ryan, K., Lacy, R. C., and S. W. Margulis. 2002. Impacts of kinship and inbreeding on components of fitness. Pages 82- 96 in V.W. Holt. Reproduction and Integrated Conservation Science. Cambridge University Press. Cambridge, U.K. Lewison, R. and W. Oliver. 2008. Hippopotamus amphibius. The IUCN Red List of Threatened Species, Version 2015.2. Accessed: 10 Aug. 2015. <www.iucnredlist.org> Reed, D. H. and R. Frankham. 2003. Correlation between fitness and genetic diversity. Conservation Biology 17: 230-237. UNEP-WCMC (Comps.). 2015. The Checklist of CITES Species Website. CITES Secretariat, Geneva, Switzerland. Accessed 10
AUg. 2015. < http://checklist.cites.org>
2016 Population Viability Analyses for AZA River Hippopotamus Animal Program 16
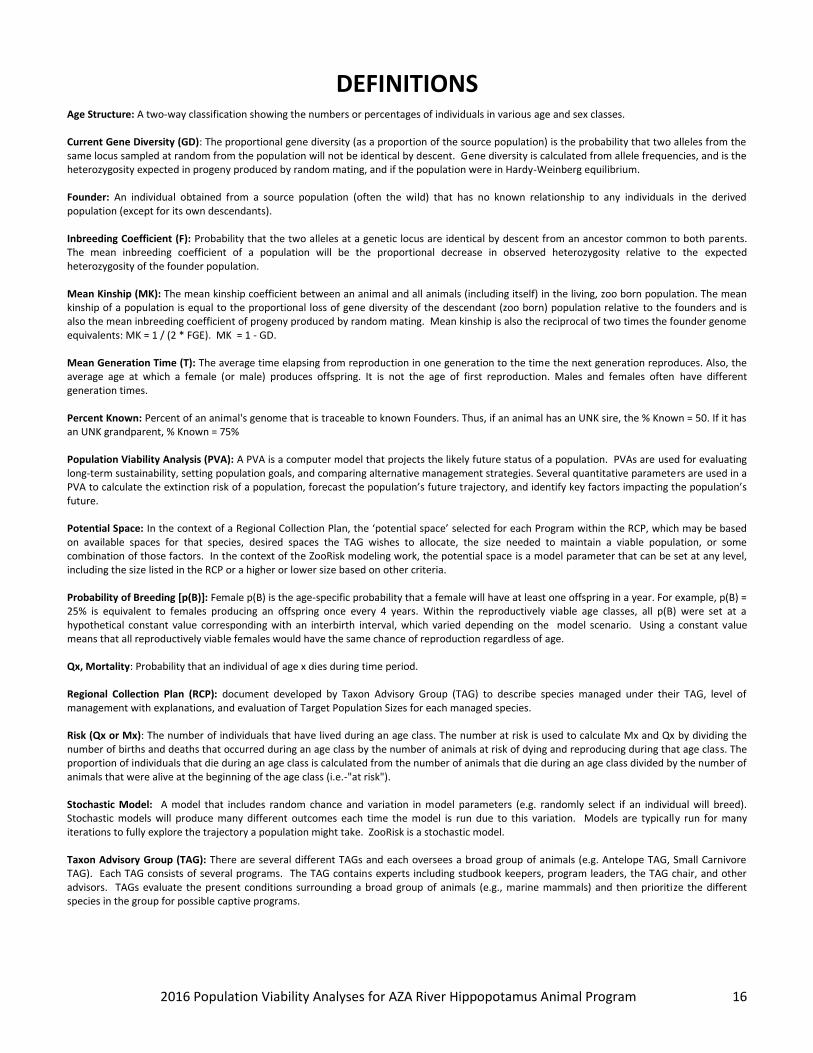
DEFINITIONS Age Structure: A two-way classification showing the numbers or percentages of individuals in various age and sex classes. Current Gene Diversity (GD): The proportional gene diversity (as a proportion of the source population) is the probability that two alleles from the same locus sampled at random from the population will not be identical by descent. Gene diversity is calculated from allele frequencies, and is the heterozygosity expected in progeny produced by random mating, and if the population were in Hardy-Weinberg equilibrium. Founder: An individual obtained from a source population (often the wild) that has no known relationship to any individuals in the derived population (except for its own descendants). Inbreeding Coefficient (F): Probability that the two alleles at a genetic locus are identical by descent from an ancestor common to both parents. The mean inbreeding coefficient of a population will be the proportional decrease in observed heterozygosity relative to the expected heterozygosity of the founder population. Mean Kinship (MK): The mean kinship coefficient between an animal and all animals (including itself) in the living, zoo born population. The mean kinship of a population is equal to the proportional loss of gene diversity of the descendant (zoo born) population relative to the founders and is also the mean inbreeding coefficient of progeny produced by random mating. Mean kinship is also the reciprocal of two times the founder genome equivalents: MK = 1 / (2 * FGE). MK = 1 - GD. Mean Generation Time (T): The average time elapsing from reproduction in one generation to the time the next generation reproduces. Also, the average age at which a female (or male) produces offspring. It is not the age of first reproduction. Males and females often have different generation times. Percent Known: Percent of an animal's genome that is traceable to known Founders. Thus, if an animal has an UNK sire, the % Known = 50. If it has an UNK grandparent, % Known = 75% Population Viability Analysis (PVA): A PVA is a computer model that projects the likely future status of a population. PVAs are used for evaluating long-term sustainability, setting population goals, and comparing alternative management strategies. Several quantitative parameters are used in a PVA to calculate the extinction risk of a population, forecast the population’s future trajectory, and identify key factors impacting the population’s future. Potential Space: In the context of a Regional Collection Plan, the ‘potential space’ selected for each Program within the RCP, which may be based on available spaces for that species, desired spaces the TAG wishes to allocate, the size needed to maintain a viable population, or some combination of those factors. In the context of the ZooRisk modeling work, the potential space is a model parameter that can be set at any level, including the size listed in the RCP or a higher or lower size based on other criteria. Probability of Breeding [p(B)]: Female p(B) is the age-specific probability that a female will have at least one offspring in a year. For example, p(B) = 25% is equivalent to females producing an offspring once every 4 years. Within the reproductively viable age classes, all p(B) were set at a hypothetical constant value corresponding with an interbirth interval, which varied depending on the model scenario. Using a constant value means that all reproductively viable females would have the same chance of reproduction regardless of age. Qx, Mortality: Probability that an individual of age x dies during time period. Regional Collection Plan (RCP): document developed by Taxon Advisory Group (TAG) to describe species managed under their TAG, level of management with explanations, and evaluation of Target Population Sizes for each managed species. Risk (Qx or Mx): The number of individuals that have lived during an age class. The number at risk is used to calculate Mx and Qx by dividing the number of births and deaths that occurred during an age class by the number of animals at risk of dying and reproducing during that age class. The proportion of individuals that die during an age class is calculated from the number of animals that die during an age class divided by the number of animals that were alive at the beginning of the age class (i.e.-"at risk"). Stochastic Model: A model that includes random chance and variation in model parameters (e.g. randomly select if an individual will breed). Stochastic models will produce many different outcomes each time the model is run due to this variation. Models are typically run for many iterations to fully explore the trajectory a population might take. ZooRisk is a stochastic model. Taxon Advisory Group (TAG): There are several different TAGs and each oversees a broad group of animals (e.g. Antelope TAG, Small Carnivore TAG). Each TAG consists of several programs. The TAG contains experts including studbook keepers, program leaders, the TAG chair, and other advisors. TAGs evaluate the present conditions surrounding a broad group of animals (e.g., marine mammals) and then prioritize the different species in the group for possible captive programs.
2016 Population Viability Analyses for AZA River Hippopotamus Animal Program 17
APPENDICES
APPENDIX A. MODEL SETUP AND METHODS Analyses in this report were performed using PopLink 2.4, ZooRisk 3.8, and R statistical package. Complete documentation on
ZooRisk’s modeling approach and setup can be found in the software manual (Faust et al., 2008). These tables document the
basic file information (Table A1), key model variables, give some context for how ZooRisk utilizes them in the model and how
the PVA modeling team applies them, give values used in model scenarios, and describe data sources (Table A2). Additionally,
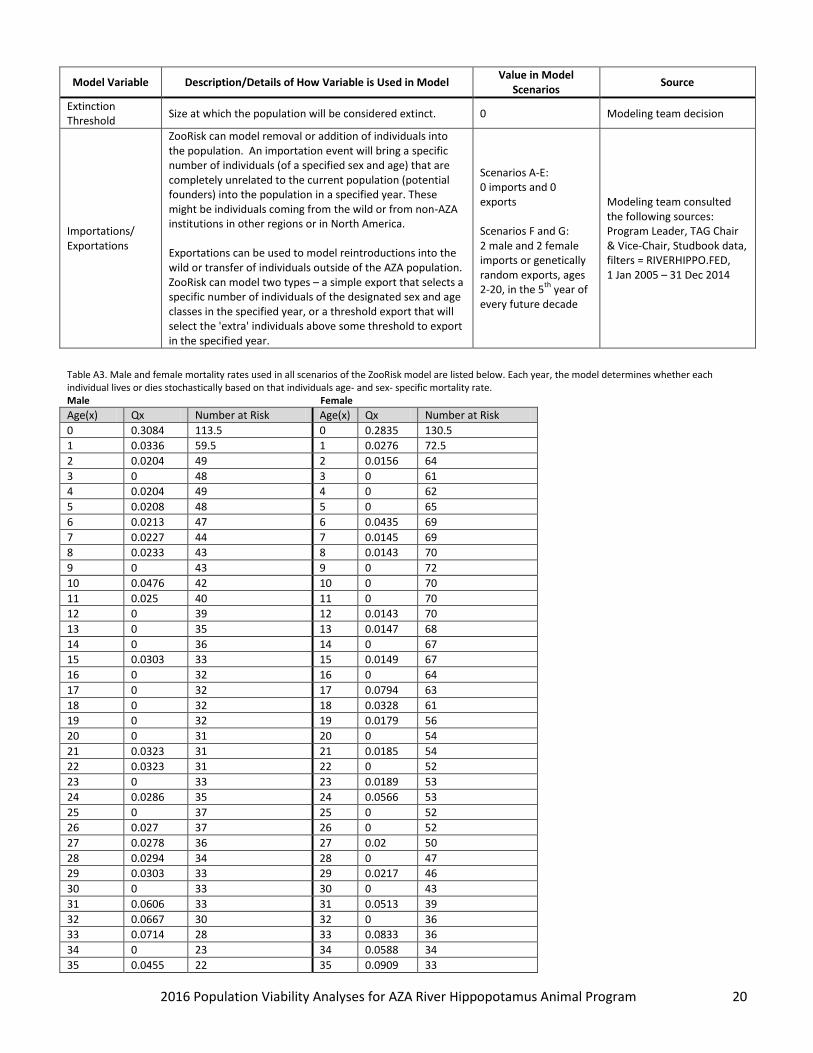
age and sex specific mortality rates are documented in table A3.
For clarity, most figures in this report show the mean population size across multiple iterations. Model results such as mean
population sizes, levels of gene diversity (GD), and inbreeding (F) are averaged across 1000 model iterations; if some model
iterations go extinct, these values are only averaged over extant, surviving iterations. Where relevant, results are reported
on medium-term (25 year), and long-term (100 year) time frames. Results such as the probability of reaching the potential
space or extinction are based on the percentage of iterations that hit that target at least once over the 100 years. Where
applicable, ± 1 standard deviation is included; large values represent wider variability in model results.
Table A1. Information regarding studbook utilization in PopLink 2.4 and ZooRisk 3.8.
File Information
Studbook Currentness Date 20 July 2015
Studbook Name hippo2014_20Jul15 + OverlayforPVA
Studbook Keeper John Davis
ZooRisk Project Name RiverHippo_2015
Table A2. Variable used in ZooRisk 3.8 scenarios, including a description of each variable, the value, and the source.
Demographic Settings
Model Variable Description/Details of How Variable is Used in Model Value in Model
Scenarios Source
Living Population
ZooRisk uses a starting population to initiate each model scenario, incorporating data on each individual’s pedigree, age, sex, and reproductive status. Any animals unable to breed due to age, medical issues, or sterilizations can be designated as non-reproductive in the model, which removes them from the potentially breeding population. The model assumes that any new animals (either births or imports) are potentially reproductively viable; this may be an optimistic assumption.
See included individuals in Appendix C
Studbook data; animals in AZA + MONROE + TORONTO (FED file: RIVERHIPPO.FED) as of 21 Jul 2015
Male and Female Age-Specific Mortality Rates (Qx)
Probability that an individual of age x dies during time period. Each year, the model stochastically determines whether each individual lives or dies based on that individual’s age- and sex-specific Qx.
See Table A3. No modifications were made from extracted Qx values.
Mortality rate for infants 0-1 used in the model (as described above). Infant mortality is a vital rate that is sensitive to changes in husbandry and also may be a life stage that is vulnerable to inbreeding depression.
The maximum age individuals are allowed to live to in the model (if they haven’t died before that age). The model values were based on males = SB #99 and 124 and female = #83, all of which are deceased.
Male = 59 Female = 61
Modeling team consulted the following sources: Studbook data, Program Leader, TAG Chair and Vice-Chair
Reproductive Age Classes
Age classes in which females or males could potentially be paired for breeding in the model
Male = 3 – 46 Female = 4 – 42
Modeling team consulted the following sources: Studbook data, Program Leader, TAG Chair and Vice-Chair
2016 Population Viability Analyses for AZA River Hippopotamus Animal Program 18
Model Variable Description/Details of How Variable is Used in Model Value in Model
Scenarios Source
Annual Number of Offspring
When a female within the model is selected to reproduce in a given model year, ZooRisk uses these frequencies to stochastically determine the number of offspring she produces. Note that this distribution will be different than a litter size distribution if a species can have multiple clutches/litters within a year.
The model stochastically assigns a sex for any offspring created in the model. We extract historic studbook data and test for bias towards males or females in the sex ratio using a χ2 test. This evaluates whether the population is significantly different than 50% males, 50% females. For this population, the extracted birth sex ratio was not significantly biased. The extracted value was 0.4587 (χ
P(B) is the age-specific probability that a female will have at least one offspring in a year. For example, p(B) = 0.25 is equivalent to females producing an offspring on average once every 4 years, or 25% of reproductively available females breeding in any given year. Historical studbook data include many females who never had access to a male and were non-reproductive for management rather than biological reasons. It is difficult to use extracted p(B) data to determine what a population could do if all individuals were in breeding situations or the population was truly trying to increase reproduction. Because of this, model scenarios use simplified hypothetical levels of p(B) to evaluate the impact of changes in reproduction. To set the baseline p(B), we extracted the average number of births/year over the past decade from the studbook and identified a p(B) level in the model that would produce, on average, an equivalent number of projected births over the first 10 model years. Alternate scenarios used higher or lower p(B) levels. In the model, all p(B) were set at the same value within all female reproductive age classes. Using a constant value means that all reproductively viable females would have the same chance of reproduction regardless of age. This population produced 0.9 births/year on average over the past decade, which was used to calibrate the baseline p(B).
Baseline Scenarios A: 0.037 Scenarios B - G: 0.013
Studbook data, filters = RIVERHIPPO.FED, 1 Jan 2005 – 31 Dec 2014
Genetic Settings
Genetic Management
ZooRisk can model a randomly breeding population or genetic management by mean kinship pairings and other genetic criteria, mimicking the way that AZA populations are managed to maintain gene diversity (GD) (Ballou & Lacy, 1995). This allows ZooRisk to more accurately project the amount of gene diversity retained through genetic management.
GM by mean kinship = ON (Scenario D: GM =OFF)
Modeling team decision
2016 Population Viability Analyses for AZA River Hippopotamus Animal Program 19
Model Variable Description/Details of How Variable is Used in Model Value in Model
Scenarios Source
Inbreeding Depression
Inbreeding depression can be challenging to incorporate into PVA models because of uncertainty about which populations and life history traits will be affected, and at what inbreeding level they will become affected. Due to this uncertainty and since modeling inbreeding depression adds an additional layer of complexity to interpretation of results we have not included a “standard” inbreeding depression effect in the PVA models. The PVA includes management by mean kinship and measurements of final mean inbreeding levels to help users understand the potential future levels of inbreeding even with careful management. Readers should consider that model results may be optimistic if this species would be susceptible to inbreeding depression now or in the future.
OFF Modeling team decision
Breeding group ratio
ZooRisk can simulate breeding groups of 1 male: multiple females. If a population has few reproductive-aged animals and/or very few breeding age males, this can impact demographic results by limiting the number of pairs/groups that can be formed. It can also impact genetic results, as it influences how pairings by mean kinship are made (see manual for more details).
1 male: 1 female
Modeling team consulted the following sources: Program Leader, TAG Chair and Vice-Chair
Number of Years Between Pairing
ZooRisk reshuffles the pairings with this frequency; a breeding group is left together for this number of years unless an individual group member dies, in which case another individual is shuffled in. A group is left together even if they may no longer be optimally paired by MK because of subsequent births.
50
Modeling team decision Modeling team consulted the following sources: Program Leader, TAG Chair and Vice-Chair
Other Model Settings
Potential Space
ZooRisk has the option of including a space limitation on population growth. This limitation reduces breeding in the model population as it approaches the space limit, mimicking zoo management. For example, a Program Leader may begin to recommend fewer breeding pairs if available spaces for a population become limited.
To determine an appropriate space limitation for the models, the PVA team, in consultation with the AZA Wildlife Conservation and Management Committee (WCMC), developed the approach of using the number of projected spaces in 5 years based on a Taxon Advisory Group’s (TAG) Regional Collection Plan (RCP). If that number is unavailable or unsuitable (i.e. if the population is already close to or larger than that space), the team will use the current population size + 10% or 10 individuals, whichever is greater. In some instances when more information is available, i.e. a more recent survey by the Species Coordinator, we will use this value.
The most recent Wild Pig, Peccary, and Hippo RCP (2008) is out of date because of population changes since that time. We allowed for 90 potential spaces (the current population size + 10 individuals) in the modeled baseline scenario.
90
Modeling team consulted the following sources: 2008 Wild Pig, Peccary, and Hippo TAG RCP, Program Leader, TAG Chair and Vice-Chair
Approach to space limit
The model can allow the population to grow/decline immediately to its space limit (if birth rates will allow it), but it is more likely that increases/decreases in space will occur gradually as new institutions join or leave a program.
Approach space limit gradually over 10 years
Modeling team consulted the following sources: Program Leader, TAG Chair and Vice-Chair
Number of Years How far into the future the model projects. 100 Modeling team decision
Number of Iterations
Since stochastic models have inherent variation, each model run (or iteration) will produce a slightly different population trajectory, and the model is run many times to reflect the full potential variation a population could experience.
1000 Modeling team decision
2016 Population Viability Analyses for AZA River Hippopotamus Animal Program 20
Model Variable Description/Details of How Variable is Used in Model Value in Model
Scenarios Source
Extinction Threshold
Size at which the population will be considered extinct. 0 Modeling team decision
Importations/ Exportations
ZooRisk can model removal or addition of individuals into the population. An importation event will bring a specific number of individuals (of a specified sex and age) that are completely unrelated to the current population (potential founders) into the population in a specified year. These might be individuals coming from the wild or from non-AZA institutions in other regions or in North America. Exportations can be used to model reintroductions into the wild or transfer of individuals outside of the AZA population. ZooRisk can model two types – a simple export that selects a specific number of individuals of the designated sex and age classes in the specified year, or a threshold export that will select the 'extra' individuals above some threshold to export in the specified year.
Scenarios A-E: 0 imports and 0 exports Scenarios F and G: 2 male and 2 female imports or genetically random exports, ages 2-20, in the 5
th year of
every future decade
Modeling team consulted the following sources: Program Leader, TAG Chair & Vice-Chair, Studbook data, filters = RIVERHIPPO.FED, 1 Jan 2005 – 31 Dec 2014
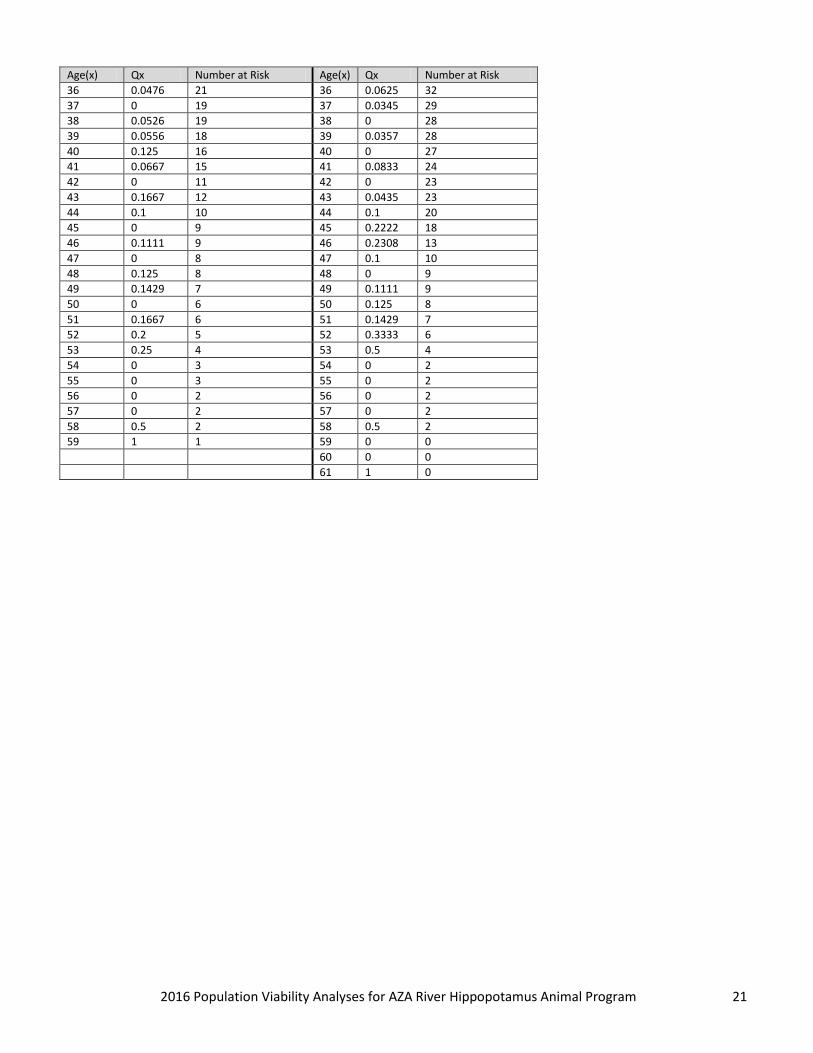
Table A3. Male and female mortality rates used in all scenarios of the ZooRisk model are listed below. Each year, the model determines whether each individual lives or dies stochastically based on that individuals age- and sex- specific mortality rate. Male Female
Age(x) Qx Number at Risk Age(x) Qx Number at Risk
0 0.3084 113.5 0 0.2835 130.5
1 0.0336 59.5 1 0.0276 72.5
2 0.0204 49 2 0.0156 64
3 0 48 3 0 61
4 0.0204 49 4 0 62
5 0.0208 48 5 0 65
6 0.0213 47 6 0.0435 69
7 0.0227 44 7 0.0145 69
8 0.0233 43 8 0.0143 70
9 0 43 9 0 72
10 0.0476 42 10 0 70
11 0.025 40 11 0 70
12 0 39 12 0.0143 70
13 0 35 13 0.0147 68
14 0 36 14 0 67
15 0.0303 33 15 0.0149 67
16 0 32 16 0 64
17 0 32 17 0.0794 63
18 0 32 18 0.0328 61
19 0 32 19 0.0179 56
20 0 31 20 0 54
21 0.0323 31 21 0.0185 54
22 0.0323 31 22 0 52
23 0 33 23 0.0189 53
24 0.0286 35 24 0.0566 53
25 0 37 25 0 52
26 0.027 37 26 0 52
27 0.0278 36 27 0.02 50
28 0.0294 34 28 0 47
29 0.0303 33 29 0.0217 46
30 0 33 30 0 43
31 0.0606 33 31 0.0513 39
32 0.0667 30 32 0 36
33 0.0714 28 33 0.0833 36
34 0 23 34 0.0588 34
35 0.0455 22 35 0.0909 33
2016 Population Viability Analyses for AZA River Hippopotamus Animal Program 21
Age(x) Qx Number at Risk Age(x) Qx Number at Risk
36 0.0476 21 36 0.0625 32
37 0 19 37 0.0345 29
38 0.0526 19 38 0 28
39 0.0556 18 39 0.0357 28
40 0.125 16 40 0 27
41 0.0667 15 41 0.0833 24
42 0 11 42 0 23
43 0.1667 12 43 0.0435 23
44 0.1 10 44 0.1 20
45 0 9 45 0.2222 18
46 0.1111 9 46 0.2308 13
47 0 8 47 0.1 10
48 0.125 8 48 0 9
49 0.1429 7 49 0.1111 9
50 0 6 50 0.125 8
51 0.1667 6 51 0.1429 7
52 0.2 5 52 0.3333 6
53 0.25 4 53 0.5 4
54 0 3 54 0 2
55 0 3 55 0 2
56 0 2 56 0 2
57 0 2 57 0 2
58 0.5 2 58 0.5 2
59 1 1 59 0 0
60 0 0
61 1 0
2016 Population Viability Analyses for AZA River Hippopotamus Animal Program 22
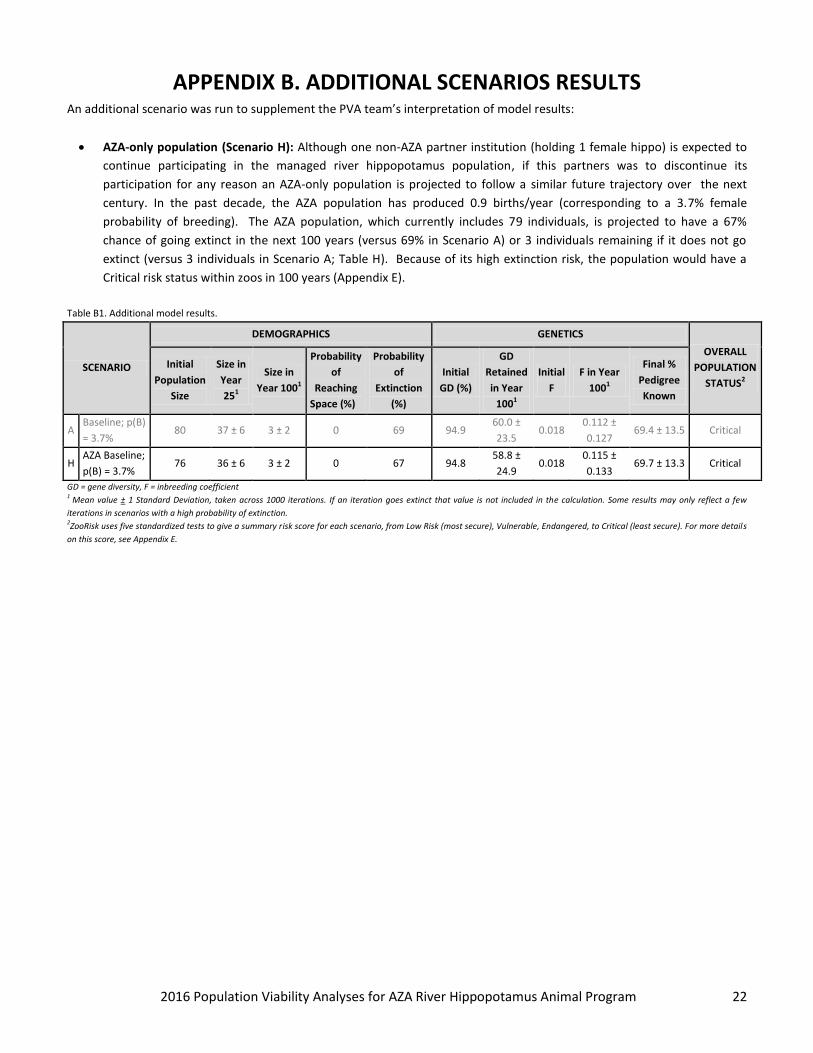
APPENDIX B. ADDITIONAL SCENARIOS RESULTS An additional scenario was run to supplement the PVA team’s interpretation of model results:
AZA-only population (Scenario H): Although one non-AZA partner institution (holding 1 female hippo) is expected to
continue participating in the managed river hippopotamus population, if this partners was to discontinue its
participation for any reason an AZA-only population is projected to follow a similar future trajectory over the next
century. In the past decade, the AZA population has produced 0.9 births/year (corresponding to a 3.7% female
probability of breeding). The AZA population, which currently includes 79 individuals, is projected to have a 67%
chance of going extinct in the next 100 years (versus 69% in Scenario A) or 3 individuals remaining if it does not go
extinct (versus 3 individuals in Scenario A; Table H). Because of its high extinction risk, the population would have a
Critical risk status within zoos in 100 years (Appendix E).
Table B1. Additional model results.
SCENARIO
DEMOGRAPHICS GENETICS
OVERALL
POPULATION
STATUS2
Initial
Population
Size
Size in
Year
251
Size in
Year 1001
Probability
of
Reaching
Space (%)
Probability
of
Extinction
(%)
Initial
GD (%)
GD
Retained
in Year
1001
Initial
F
F in Year
1001
Final %
Pedigree
Known
A Baseline; p(B)
= 3.7% 80 37 ± 6 3 ± 2 0 69 94.9
60.0 ±
23.5 0.018
0.112 ±
0.127 69.4 ± 13.5 Critical
H AZA Baseline;
p(B) = 3.7% 76 36 ± 6 3 ± 2 0 67 94.8
58.8 ±
24.9 0.018
0.115 ±
0.133 69.7 ± 13.3 Critical
GD = gene diversity, F = inbreeding coefficient 1 Mean value ± 1 Standard Deviation, taken across 1000 iterations. If an iteration goes extinct that value is not included in the calculation. Some results may only reflect a few
iterations in scenarios with a high probability of extinction. 2ZooRisk uses five standardized tests to give a summary risk score for each scenario, from Low Risk (most secure), Vulnerable, Endangered, to Critical (least secure). For more details
on this score, see Appendix E.
2016 Population Viability Analyses for AZA River Hippopotamus Animal Program 23
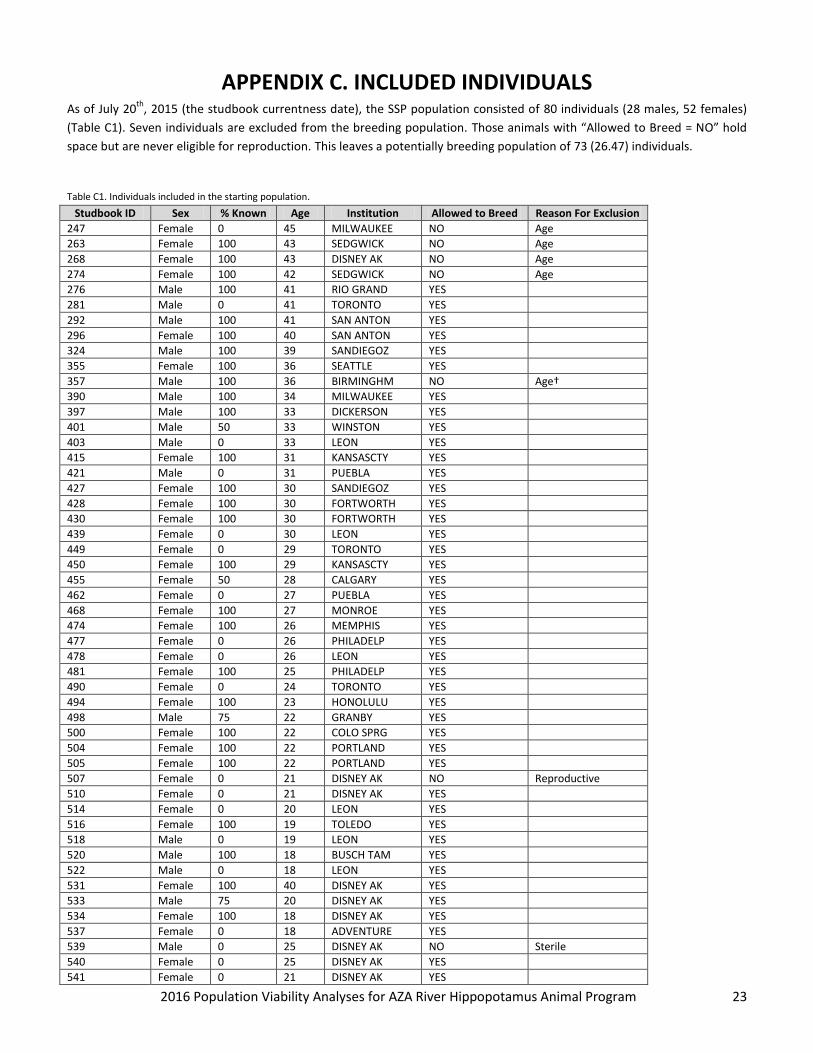
APPENDIX C. INCLUDED INDIVIDUALS As of July 20
th, 2015 (the studbook currentness date), the SSP population consisted of 80 individuals (28 males, 52 females)
(Table C1). Seven individuals are excluded from the breeding population. Those animals with “Allowed to Breed = NO” hold
space but are never eligible for reproduction. This leaves a potentially breeding population of 73 (26.47) individuals.
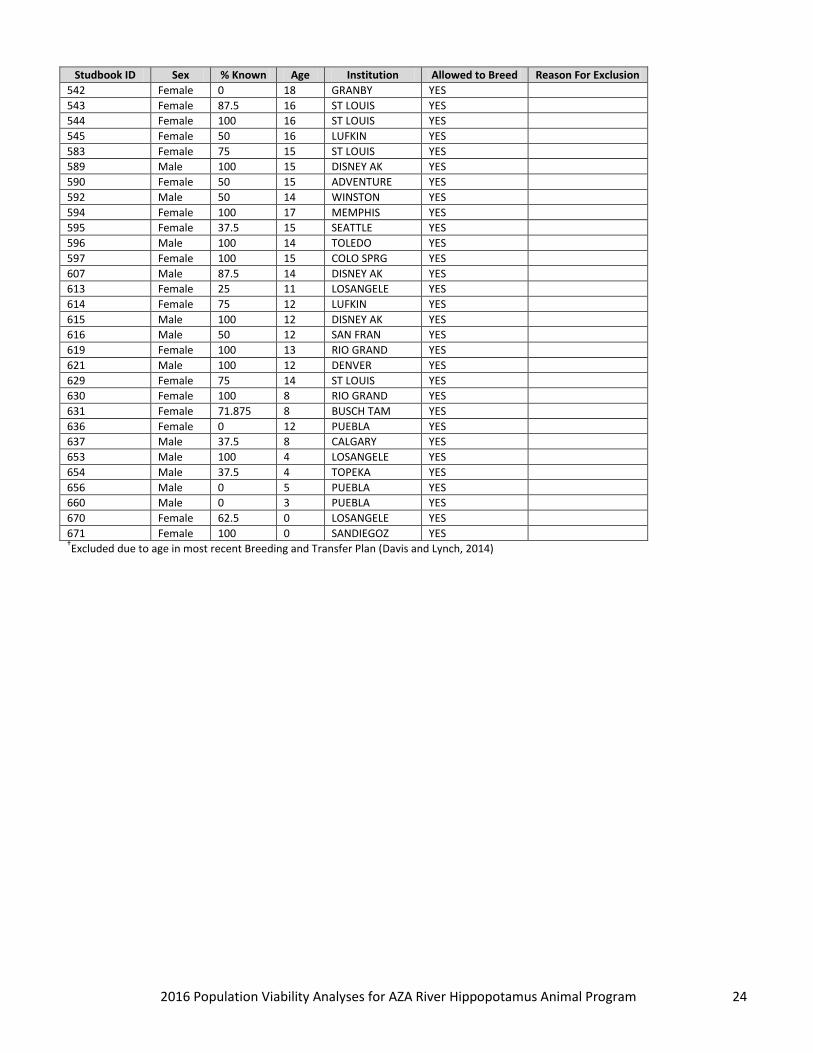
Table C1. Individuals included in the starting population.
Studbook ID Sex % Known Age Institution Allowed to Breed Reason For Exclusion
247 Female 0 45 MILWAUKEE NO Age
263 Female 100 43 SEDGWICK NO Age
268 Female 100 43 DISNEY AK NO Age
274 Female 100 42 SEDGWICK NO Age
276 Male 100 41 RIO GRAND YES
281 Male 0 41 TORONTO YES
292 Male 100 41 SAN ANTON YES
296 Female 100 40 SAN ANTON YES
324 Male 100 39 SANDIEGOZ YES
355 Female 100 36 SEATTLE YES
357 Male 100 36 BIRMINGHM NO Age†
390 Male 100 34 MILWAUKEE YES
397 Male 100 33 DICKERSON YES
401 Male 50 33 WINSTON YES
403 Male 0 33 LEON YES
415 Female 100 31 KANSASCTY YES
421 Male 0 31 PUEBLA YES
427 Female 100 30 SANDIEGOZ YES
428 Female 100 30 FORTWORTH YES
430 Female 100 30 FORTWORTH YES
439 Female 0 30 LEON YES
449 Female 0 29 TORONTO YES
450 Female 100 29 KANSASCTY YES
455 Female 50 28 CALGARY YES
462 Female 0 27 PUEBLA YES
468 Female 100 27 MONROE YES
474 Female 100 26 MEMPHIS YES
477 Female 0 26 PHILADELP YES
478 Female 0 26 LEON YES
481 Female 100 25 PHILADELP YES
490 Female 0 24 TORONTO YES
494 Female 100 23 HONOLULU YES
498 Male 75 22 GRANBY YES
500 Female 100 22 COLO SPRG YES
504 Female 100 22 PORTLAND YES
505 Female 100 22 PORTLAND YES
507 Female 0 21 DISNEY AK NO Reproductive
510 Female 0 21 DISNEY AK YES
514 Female 0 20 LEON YES
516 Female 100 19 TOLEDO YES
518 Male 0 19 LEON YES
520 Male 100 18 BUSCH TAM YES
522 Male 0 18 LEON YES
531 Female 100 40 DISNEY AK YES
533 Male 75 20 DISNEY AK YES
534 Female 100 18 DISNEY AK YES
537 Female 0 18 ADVENTURE YES
539 Male 0 25 DISNEY AK NO Sterile
540 Female 0 25 DISNEY AK YES
541 Female 0 21 DISNEY AK YES
2016 Population Viability Analyses for AZA River Hippopotamus Animal Program 24
Studbook ID Sex % Known Age Institution Allowed to Breed Reason For Exclusion
542 Female 0 18 GRANBY YES
543 Female 87.5 16 ST LOUIS YES
544 Female 100 16 ST LOUIS YES
545 Female 50 16 LUFKIN YES
583 Female 75 15 ST LOUIS YES
589 Male 100 15 DISNEY AK YES
590 Female 50 15 ADVENTURE YES
592 Male 50 14 WINSTON YES
594 Female 100 17 MEMPHIS YES
595 Female 37.5 15 SEATTLE YES
596 Male 100 14 TOLEDO YES
597 Female 100 15 COLO SPRG YES
607 Male 87.5 14 DISNEY AK YES
613 Female 25 11 LOSANGELE YES
614 Female 75 12 LUFKIN YES
615 Male 100 12 DISNEY AK YES
616 Male 50 12 SAN FRAN YES
619 Female 100 13 RIO GRAND YES
621 Male 100 12 DENVER YES
629 Female 75 14 ST LOUIS YES
630 Female 100 8 RIO GRAND YES
631 Female 71.875 8 BUSCH TAM YES
636 Female 0 12 PUEBLA YES
637 Male 37.5 8 CALGARY YES
653 Male 100 4 LOSANGELE YES
654 Male 37.5 4 TOPEKA YES
656 Male 0 5 PUEBLA YES
660 Male 0 3 PUEBLA YES
670 Female 62.5 0 LOSANGELE YES
671 Female 100 0 SANDIEGOZ YES †Excluded due to age in most recent Breeding and Transfer Plan (Davis and Lynch, 2014)
2016 Population Viability Analyses for AZA River Hippopotamus Animal Program 25
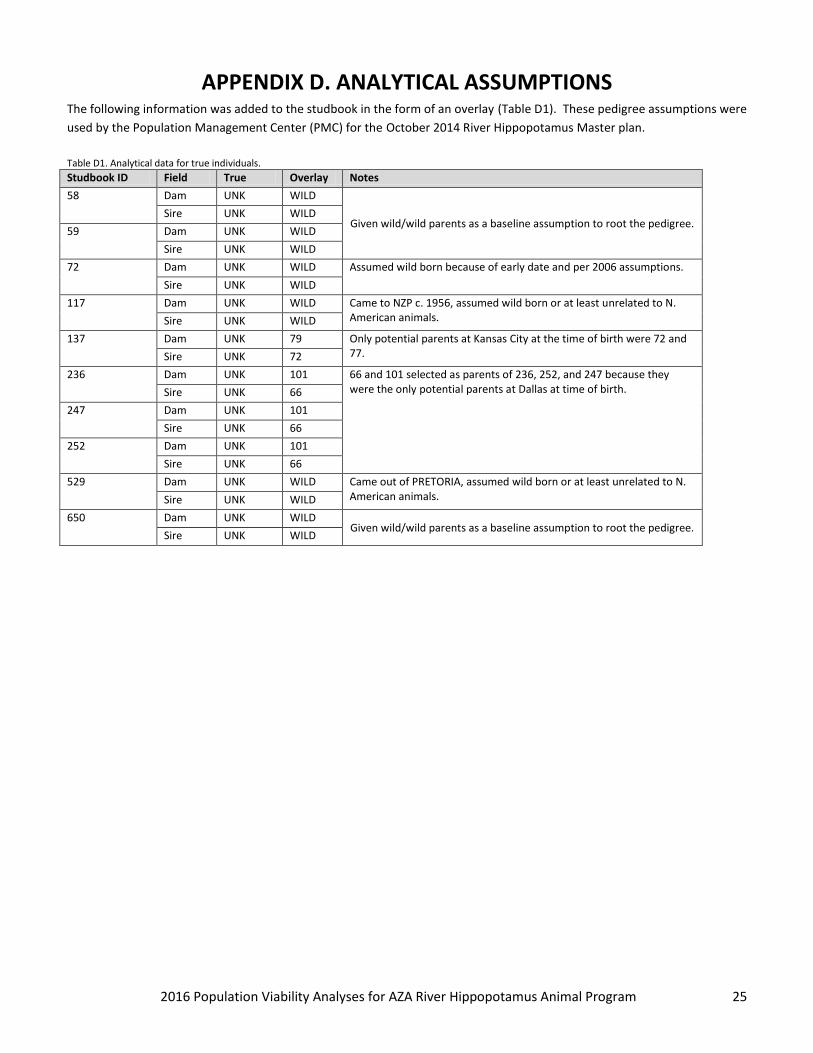
APPENDIX D. ANALYTICAL ASSUMPTIONS The following information was added to the studbook in the form of an overlay (Table D1). These pedigree assumptions were
used by the Population Management Center (PMC) for the October 2014 River Hippopotamus Master plan.
Table D1. Analytical data for true individuals. Studbook ID Field True Overlay Notes
58 Dam UNK WILD
Given wild/wild parents as a baseline assumption to root the pedigree. Sire UNK WILD
59 Dam UNK WILD
Sire UNK WILD
72 Dam UNK WILD Assumed wild born because of early date and per 2006 assumptions.
Sire UNK WILD
117 Dam UNK WILD Came to NZP c. 1956, assumed wild born or at least unrelated to N. American animals. Sire UNK WILD
137 Dam UNK 79 Only potential parents at Kansas City at the time of birth were 72 and 77. Sire UNK 72
236 Dam UNK 101 66 and 101 selected as parents of 236, 252, and 247 because they were the only potential parents at Dallas at time of birth. Sire UNK 66
247 Dam UNK 101
Sire UNK 66
252 Dam UNK 101
Sire UNK 66
529 Dam UNK WILD Came out of PRETORIA, assumed wild born or at least unrelated to N. American animals. Sire UNK WILD
650 Dam UNK WILD Given wild/wild parents as a baseline assumption to root the pedigree.
Sire UNK WILD
2016 Population Viability Analyses for AZA River Hippopotamus Animal Program 26
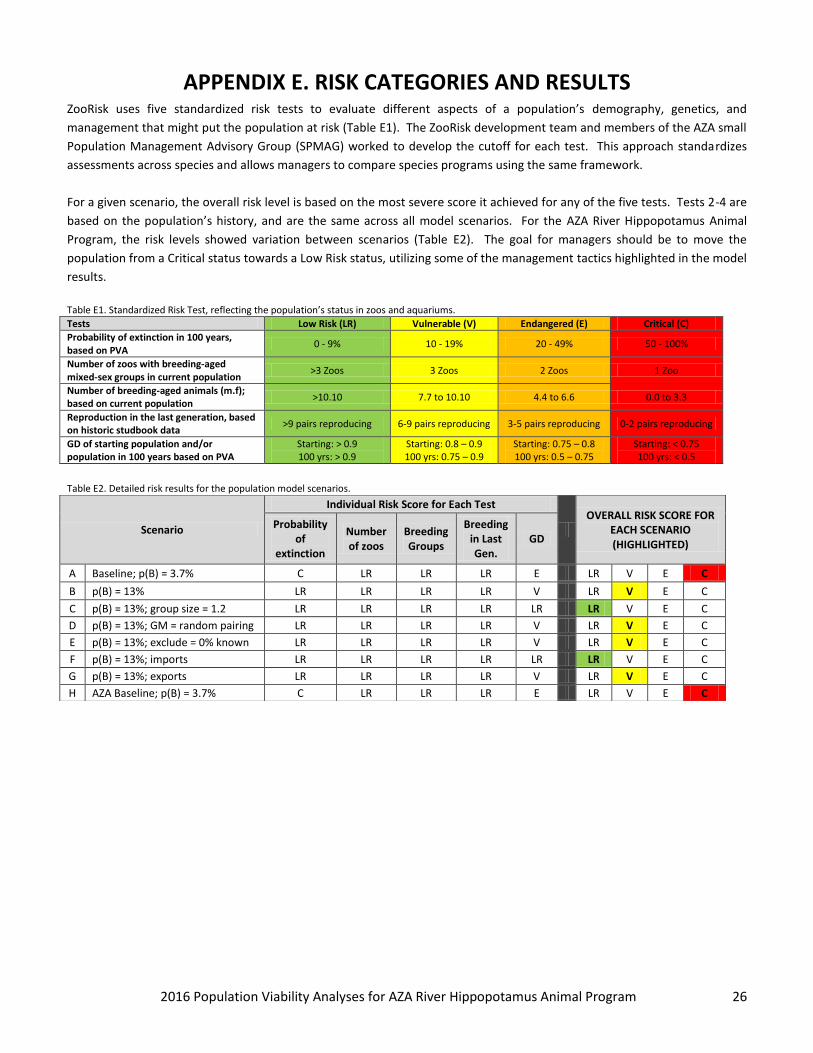
APPENDIX E. RISK CATEGORIES AND RESULTS ZooRisk uses five standardized risk tests to evaluate different aspects of a population’s demography, genetics, and
management that might put the population at risk (Table E1). The ZooRisk development team and members of the AZA small
Population Management Advisory Group (SPMAG) worked to develop the cutoff for each test. This approach standardizes
assessments across species and allows managers to compare species programs using the same framework.
For a given scenario, the overall risk level is based on the most severe score it achieved for any of the five tests. Tests 2-4 are
based on the population’s history, and are the same across all model scenarios. For the AZA River Hippopotamus Animal
Program, the risk levels showed variation between scenarios (Table E2). The goal for managers should be to move the
population from a Critical status towards a Low Risk status, utilizing some of the management tactics highlighted in the model
results.
Table E1. Standardized Risk Test, reflecting the population’s status in zoos and aquariums. Tests Low Risk (LR) Vulnerable (V) Endangered (E) Critical (C)
Probability of extinction in 100 years, based on PVA
0 - 9% 10 - 19% 20 - 49% 50 - 100%
Number of zoos with breeding-aged mixed-sex groups in current population
>3 Zoos 3 Zoos 2 Zoos 1 Zoo
Number of breeding-aged animals (m.f); based on current population
>10.10 7.7 to 10.10 4.4 to 6.6 0.0 to 3.3
Reproduction in the last generation, based on historic studbook data