44
1 Hirmi Cement Works Energy Management

ABG : Business Diversity
2

Vision To be a Premium Global Conglomerate
with a clear focus on each business.
Mission To deliver superior value to our customers,
shareholders, employees and society at large.
Aditya Birla Group
3

Hirmi Cement Works
Jafrabad Cement
Works
Magdalla Cement
Works
Ratnagiri Cement
Works
Andhra Pradesh Cement
Works
Arrakonam Cement
Works
Awarpur Cement
Works
Jharsuguda Cement
Works
West Bengal Cement
Works
Bathinda Cement
Works
Aditya Cement
Vikram
Cement
Gujarat Cement
Works
Kotputli Cement
Works
Hotgi Cement Works
Rajashree Cement
Works
Ginigera Cement
Works
Panipat Cement
Works Dadri Cement
Works Aligarh Cement Works
RWCW
Reddipalayam Cement
Works
Integrated plant
Grinding unit
Bulk terminals Mangalore Cement
Unit BSBT-
Dodballapur
Shankarapally Bulk
Terminal
Navi Mumbai Cement
Unit
4
Hirmi Cement Works
HCW Clinker contributes 7.57 %
Of UltraTech
Hirmi Cement Works
ABG - Largest Cement Producer in India.
7th largest in Asia and 8th Largest in the World.

Our Unit Vision
5
To become a world class cement manufacturing Unit with focus on Safety,
Health, Environment, Customer Satisfaction benefitting all stakeholders and encompassing
Cost Effectiveness.
ISO
9001
ISO
14001
OHSAS
18001 WCM
1997
1999
2008
2009
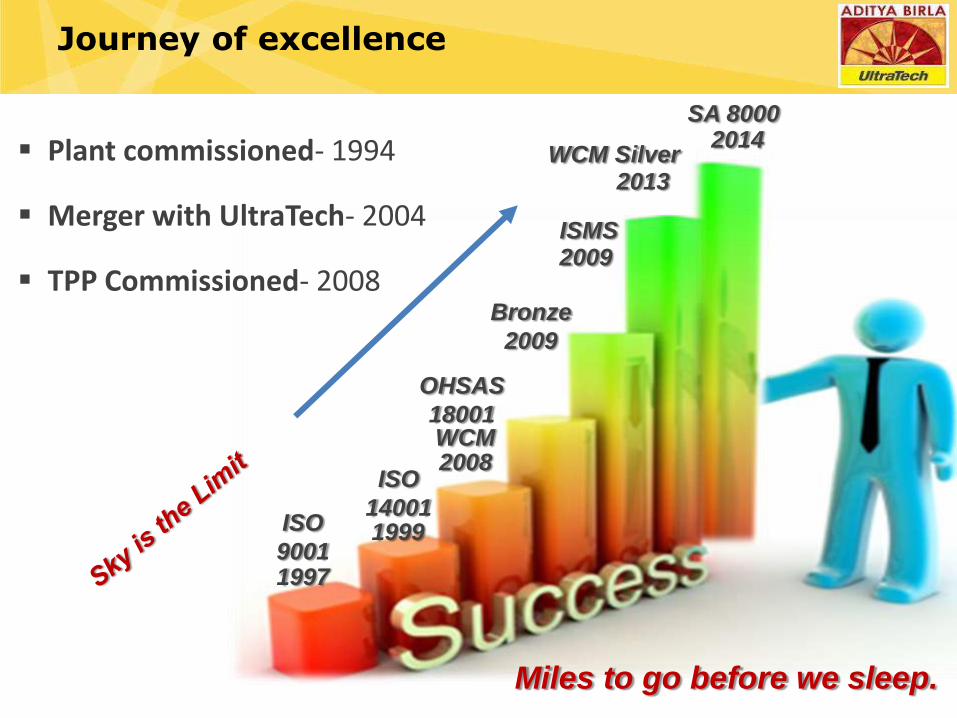
Journey of excellence
Miles to go before we sleep.
ISMS
Bronze
2009
2013 WCM Silver Plant commissioned- 1994
Merger with UltraTech- 2004
TPP Commissioned- 2008
SA 8000 2014

“CII-ITC sustainability award 2009”
7
Awards
“CSR Planet Award 2012”
“DL Shah National Quality Award-2013”
“CII Energy award 2013”
“WCM Silver Award 2013”
“FIMI Award 2014”
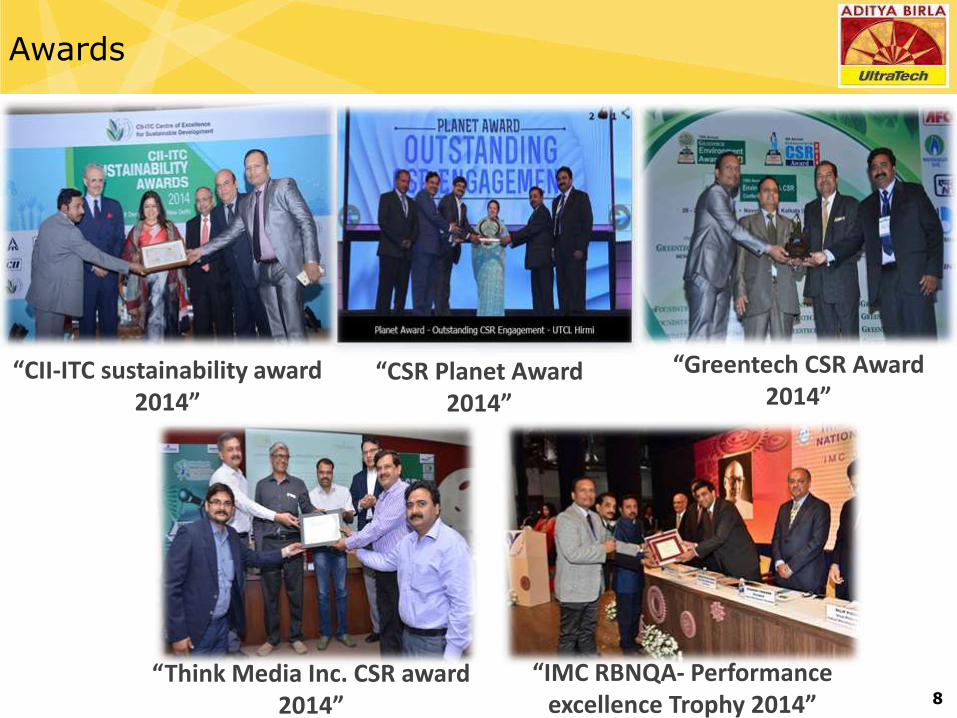
“CII-ITC sustainability award 2014”
8
Awards
“CSR Planet Award 2014”
“Greentech CSR Award 2014”
“Think Media Inc. CSR award 2014”
“IMC RBNQA- Performance excellence Trophy 2014”

9
Energy Cell Structure (HCW)
Joint Executive President (Unit Head)
FH (CPP) FH (F&C) FH (Tech) FH (MIN) FH (HR)
HOD (TS) Energy Manager HOD-TPP
GRT
Energy Cell Leader HOD- Electrical
Members-Process, Mechanical, Electrical. Instrument, Technical
Services, CPP
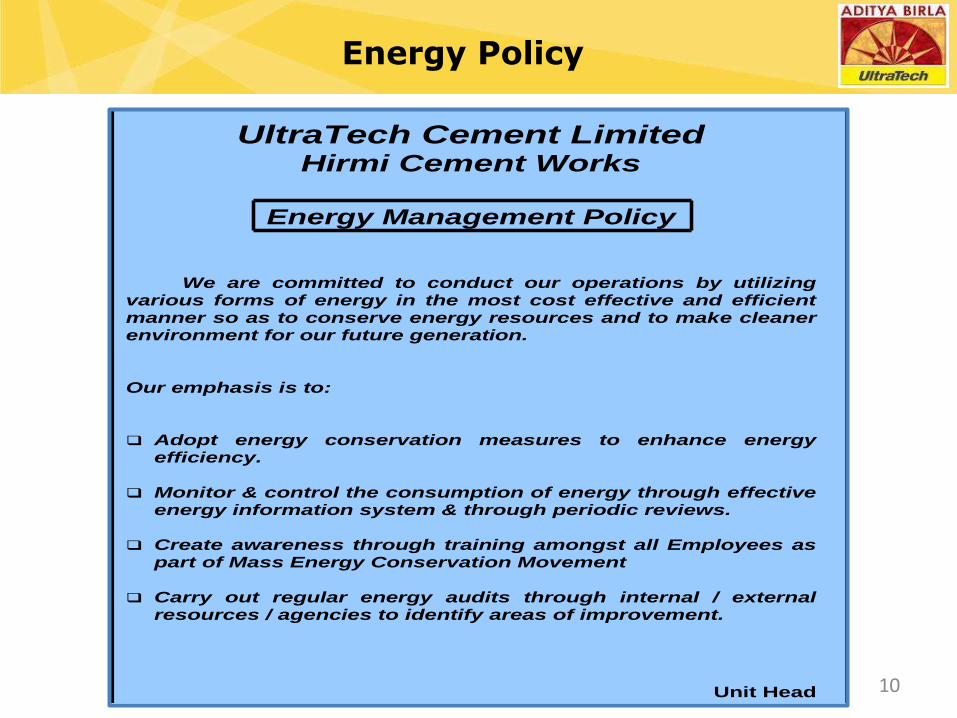
Energy Policy
10
UltraTech Cement Limited Hirmi Cement Works
Energy Management Policy
We are committed to conduct our operations by utilizing various forms of energy in the most cost effective and efficient manner so as to conserve energy resources and to make cleaner environment for our future generation. Our emphasis is to: Adopt energy conservation measures to enhance energy
efficiency. Monitor & control the consumption of energy through effective
energy information system & through periodic reviews. Create awareness through training amongst all Employees as
part of Mass Energy Conservation Movement Carry out regular energy audits through internal / external
resources / agencies to identify areas of improvement.
Unit Head
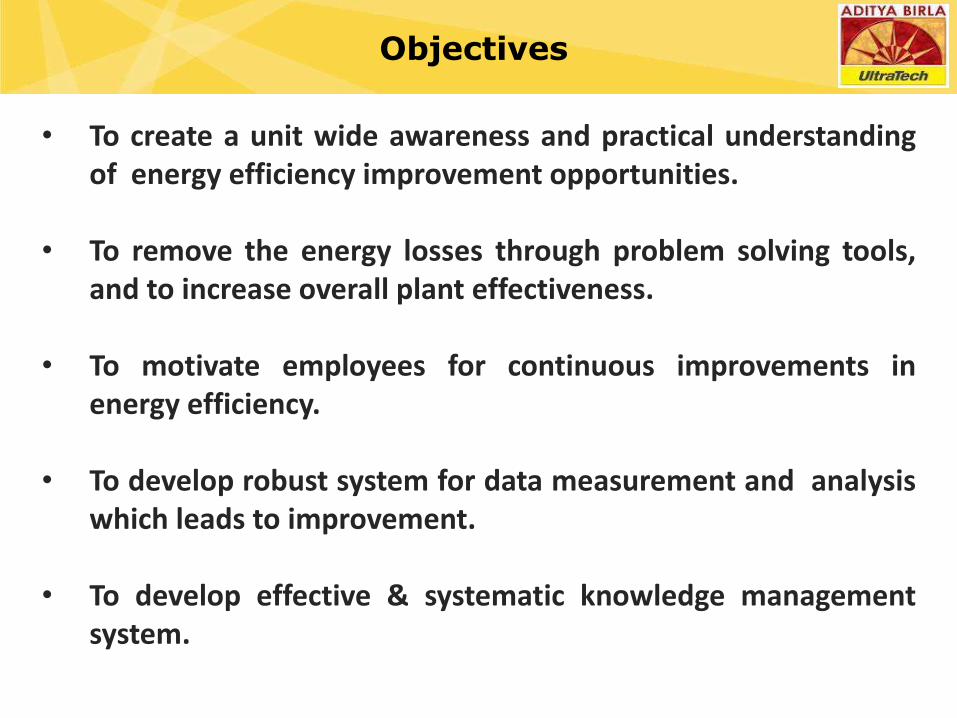
• To create a unit wide awareness and practical understanding of energy efficiency improvement opportunities.
• To remove the energy losses through problem solving tools, and to increase overall plant effectiveness.
• To motivate employees for continuous improvements in energy efficiency.
• To develop robust system for data measurement and analysis which leads to improvement.
• To develop effective & systematic knowledge management system.
Objectives

Energy Cell- Focus Area
Energy Cell Functioning Focus Area
Restoring basic condition of equipment
Effective PM07
Process/energy optimisation
Technological up-gradation
Awareness / Champaign
Knowledge management
Focus Area- • Crusher- Granulometry • Raw Mill- RM Fan and Table
Power, Separator performance • Coal Mill- Fan & Table \ ,
Separator performance • Kiln-KS, CS & CV Fan, False air • Cement Mill- MD Power,
Separator & Fan performance • Compressor- Volumetric
efficiency, Leakage

Energy Cell- Focus Area
Energy Cell Functioning Focus Area
Restoring basic condition of equipment
Process/energy optimisation
Technological up-gradation
Awareness / Champaign
Knowledge management
Focus Area- • Crusher- Hopper empty, Idle
running • Raw Mill- Start/Stop, Feed rate • Coal Mill- Start/Stop, Feed rate • Kiln- TPD, False air, Heat
consumption • Cement Mill- Start/Stop, Feed
rate, Fly ash quality, Grinding aid • Packing plant- TPH • Compressor- Running hr, Leakage

Energy Cell- Focus Area
Energy Cell Functioning Focus Area
Restoring basic condition of equipment
Process/energy optimisation
Technological up-gradation
Awareness / Champaign
Knowledge management
Focus Area- • External energy audit- Once
in a three year • Internal energy audit-
Annual • Technology benchmarking
Focus Area- • Kaizen Mela • Competition
Focus Area- • Participation in conference/
seminar • KIP


Annual Business
Plans
Technical Journals,
Consultants etc.
KIP Visit, Best practices
Energy mapping
Plant performance
Report
Audit process
Bench- marking
report Loss & Cost
Report
Problems / Opportunities
for Improvement
Identified
Identification of Opportunities

Project Execution
Project Identification
Review & Approve Project, issue project charter
Form the team for execution of Project
Prepare action plan for implementation of Project
Execute as per the Action Plan
Monitor the results of the Project with target, take necessary action if deviation observed
Complete the Project, submit project report for final review, establishment of results & sharing of Learning
Review of Projects on periodic basis for
necessary changes
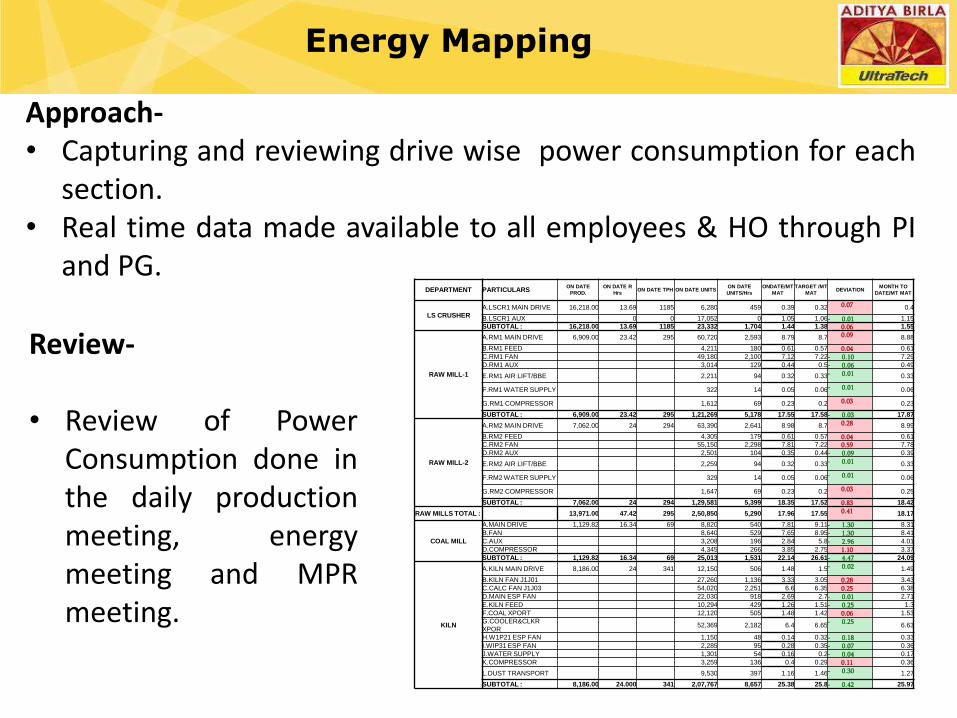
Energy Mapping
Approach- • Capturing and reviewing drive wise power consumption for each
section. • Real time data made available to all employees & HO through PI
and PG. DEPARTMENT PARTICULARS
ON DATE
PROD.
ON DATE R
Hrs ON DATE TPH ON DATE UNITS
ON DATE
UNITS/Hrs
ONDATE/MT
MAT
TARGET /MT
MAT DEVIATION
MONTH TO
DATE/MT MAT
LS CRUSHER
A.LSCR1 MAIN DRIVE 16,218.00 13.69 1185 6,280 459 0.39 0.32 0.07 0.4
B.LSCR1 AUX 0 0 17,052 0 1.05 1.06 - 0.01 1.15
SUBTOTAL : 16,218.00 13.69 1185 23,332 1,704 1.44 1.38 0.06 1.55
RAW MILL-1
A.RM1 MAIN DRIVE 6,909.00 23.42 295 60,720 2,593 8.79 8.7 0.09 8.88
B.RM1 FEED 4,211 180 0.61 0.57 0.04 0.61
C.RM1 FAN 49,180 2,100 7.12 7.22 - 0.10 7.29
D.RM1 AUX 3,014 129 0.44 0.5 - 0.06 0.49
E.RM1 AIR LIFT/BBE 2,211 94 0.32 0.33 - 0.01 0.33
F.RM1 WATER SUPPLY 322 14 0.05 0.06 - 0.01 0.06
G.RM1 COMPRESSOR 1,612 69 0.23 0.2 0.03 0.23
SUBTOTAL : 6,909.00 23.42 295 1,21,269 5,178 17.55 17.58 - 0.03 17.87
RAW MILL-2
A.RM2 MAIN DRIVE 7,062.00 24 294 63,390 2,641 8.98 8.7 0.28 8.99
B.RM2 FEED 4,305 179 0.61 0.57 0.04 0.61
C.RM2 FAN 55,150 2,298 7.81 7.22 0.59 7.78
D.RM2 AUX 2,501 104 0.35 0.44 - 0.09 0.39
E.RM2 AIR LIFT/BBE 2,259 94 0.32 0.33 - 0.01 0.33
F.RM2 WATER SUPPLY 329 14 0.05 0.06 - 0.01 0.06
G.RM2 COMPRESSOR 1,647 69 0.23 0.2 0.03 0.25
SUBTOTAL : 7,062.00 24 294 1,29,581 5,399 18.35 17.52 0.83 18.42
RAW MILLS TOTAL : 13,971.00 47.42 295 2,50,850 5,290 17.96 17.55 0.41 18.17
COAL MILL
A.MAIN DRIVE 1,129.82 16.34 69 8,820 540 7.81 9.11 - 1.30 8.31
B.FAN 8,640 529 7.65 8.95 - 1.30 8.41
C.AUX 3,208 196 2.84 5.8 - 2.96 4.01
D.COMPRESSOR 4,345 266 3.85 2.75 1.10 3.37
SUBTOTAL : 1,129.82 16.34 69 25,013 1,531 22.14 26.61 - 4.47 24.09
KILN
A.KILN MAIN DRIVE 8,186.00 24 341 12,150 506 1.48 1.5 - 0.02 1.49
B.KILN FAN J1J01 27,260 1,136 3.33 3.05 0.28 3.43
C.CALC FAN J1J03 54,020 2,251 6.6 6.35 0.25 6.38
D.MAIN ESP FAN 22,030 918 2.69 2.7 - 0.01 2.71
E.KILN FEED 10,294 429 1.26 1.51 - 0.25 1.3
F.COAL XPORT 12,120 505 1.48 1.42 0.06 1.53
G.COOLER&CLKR
XPOR 52,369 2,182 6.4 6.65
- 0.25 6.63
H.W1P21 ESP FAN 1,150 48 0.14 0.32 - 0.18 0.33
I.WIP31 ESP FAN 2,285 95 0.28 0.35 - 0.07 0.36
J.WATER SUPPLY 1,301 54 0.16 0.2 - 0.04 0.17
K.COMPRESSOR 3,259 136 0.4 0.29 0.11 0.36
L.DUST TRANSPORT 9,530 397 1.16 1.46 - 0.30 1.27
SUBTOTAL : 8,186.00 24.000 341 2,07,767 8,657 25.38 25.8 - 0.42 25.97
Review- • Review of Power
Consumption done in the daily production meeting, energy meeting and MPR meeting.
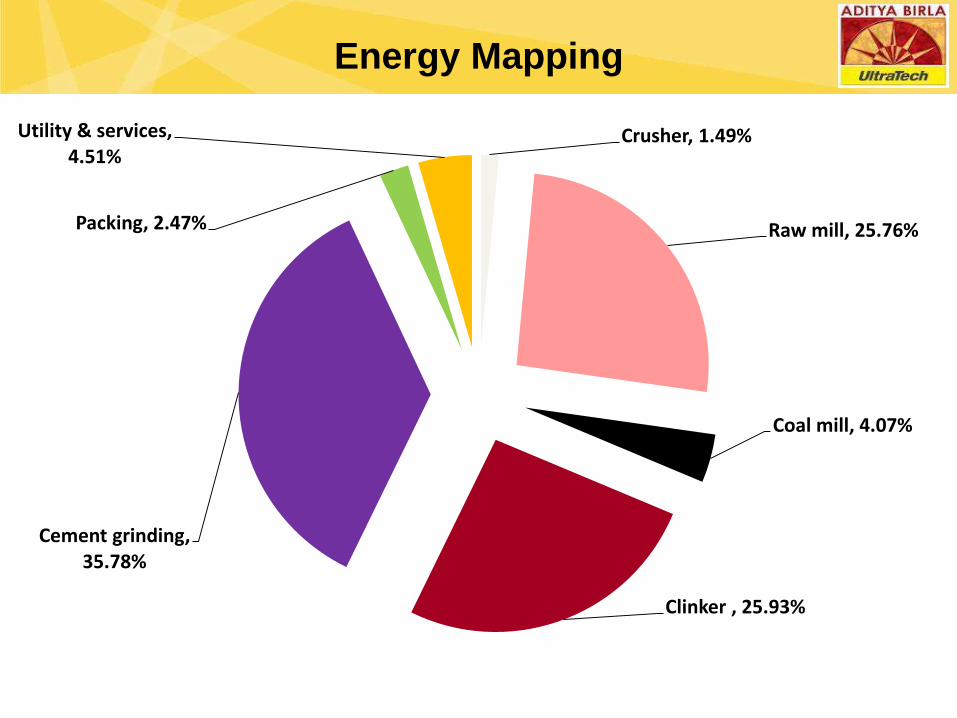
Energy Mapping
Crusher, 1.49%
Raw mill, 25.76%
Coal mill, 4.07%
Clinker , 25.93%
Cement grinding, 35.78%
Packing, 2.47%
Utility & services, 4.51%
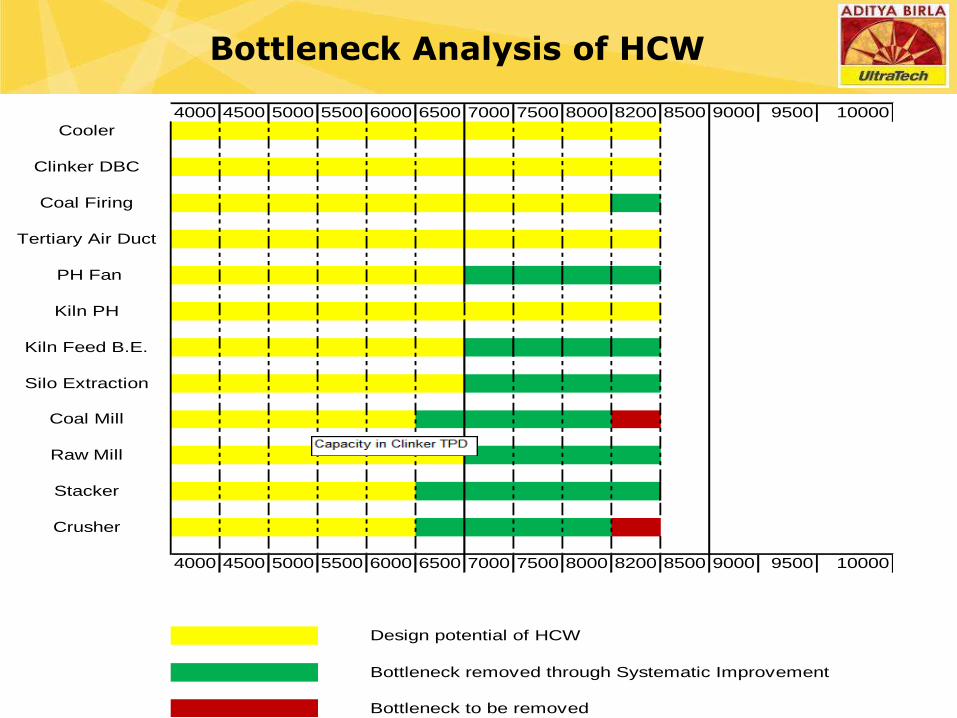
Bottleneck Analysis of HCW
4000 4500 5000 5500 6000 6500 7000 7500 8000 8200 8500 9000 9500 10000
Cooler
Clinker DBC
Coal Firing
Tertiary Air Duct
PH Fan
Kiln PH
Kiln Feed B.E.
Silo Extraction
Coal Mill
Raw Mill
Stacker
Crusher
4000 4500 5000 5500 6000 6500 7000 7500 8000 8200 8500 9000 9500 10000
Design potential of HCW
Bottleneck removed through Systematic Improvement
Bottleneck to be removed

Loss & Cost Matrix
Deployment- Developed Loss matrix for each area.
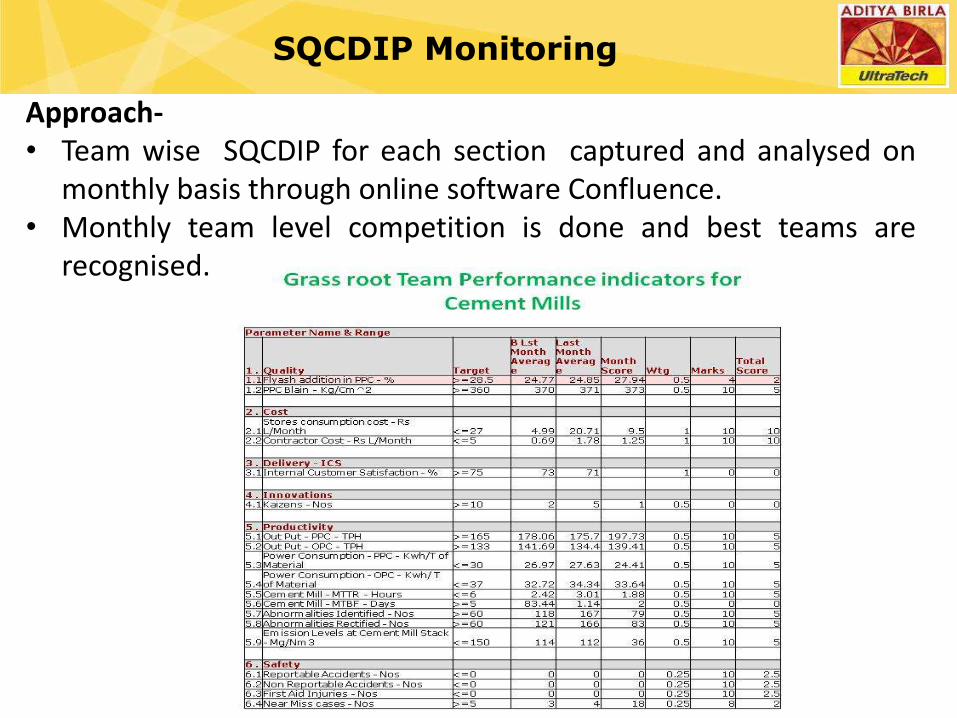
Approach- • Team wise SQCDIP for each section captured and analysed on
monthly basis through online software Confluence. • Monthly team level competition is done and best teams are
recognised.
SQCDIP Monitoring

Approach-
• Monthly heat balance.
• Quarterly audit for fan system.
• Weekly review of false air in RM and Kiln.
• Quarterly audit of Cement Mills.
• Six monthly audit of Raw Mills, Coal Mill and Kiln.
• Six monthly assessment for Compressors and blowers.
• External audit through CTES or other reputed party on once in a
three years.
Energy audit

Benchmarking
Approach- Regular benchmarking of our KPI to identify area of improvement. Some of the benchmarking are as below-
SN Area of Benchmarking Responsibility Frequency
1 Production, Cost, Energy Consumption and Quality Parameter Benchmarking with UTCL Units
TRC Monthly
2 Benchmarking of KPI through Whitehopleman and CSI at International level
TRC Annual
3 TPP and DG performance CTES Quarterly

Benchmarking
Deployment- H . Power Rate Rs / Kwh Cement Business 4.37
AC 3.49 ACW 4.05 WBCW 4.50 JFD 5.03 GICW 5.66
HCW 3.77 KCW 4.13 RC 4.51 MGD 5.03 ALCW 5.98
GCW 3.90 RWCW 4.21 JCW 5.44 RTN 6.40
VC 3.96 RDCW 4.41 BCW 6.58
APCW 4.43 HOCW 6.89
ARCW 6.91
PCW 6.95
DCW 12.70
> Rs. 5.5 /Kwh< Rs 4/Kwh > Rs.4 < Rs.4.5/Kwh > Rs.4.5 < Rs.5/Kwh > Rs.5 < Rs.5.5/Kwh
CONVERSION FACTORS
Month: May 13
Sr
NoDescription RC1 RC 2 RC 3 VC1 VC 2 VC 3 AC I AC II RWCW RDCW ACW-I ACW-II HCW
a LS to Clinker 1.38 1.38 1.38 1.38 1.38 1.38 1.39 1.39 1.48 1.43 1.42 1.42 1.49
b Raw Meal to Clinker 1.48 1.48 1.48 1.48 1.48 1.48 1.48 1.48 1.49 1.51 1.48 1.48 1.50
c Fine Coal to Clinker 0.14 0.14 0.14 0.09 0.09 0.09 0.09 0.09 0.13 0.10 0.18 0.17 0.13
2 Clinker to Cement
a OPC 43/53 0.94 0.94 0.94 0.91 0.91 0.91 0.92 0.93 0.93 0.91 0.96 0.92
b PPC 0.70 0.70 0.70 0.69 0.68 0.69 0.69 0.70 0.68 0.69 0.71 0.71 0.66


Title: Stoppage of compressor having 55 KW drive.
Challenges Faced: 1. Process reliability. 2. OEM recommendation 3. Risk of failure.
Methodology: 1. Formed cross functional team. 2. Conducted brain storming session & root cause analysis. 3. Conducted air leakage audit & arrested all leakages. 4. Optimized pressure setting for field instruments &
compressor loading/unloading. 5. Replaced air dryer from silica to refrigerant type. 6. Checked and improved compressor efficiency.
Project - 1

Benefits: 1. Reduction in auxiliary power by 50 kWh.
Equivalent to 18.6 Lacs Rs annually.
2. Due to pressure optimization, breakdowns in pneumatic lines has been reduced drastically and hence, ensure reliable & smooth operation.
3. Reduction in maintenance cost.
Before After
Loading Pressure 6.6 Kg/cm2 6.3 Kg/cm2
Unloading Pressure 7.0 Kg/cm2 6.5 Kg/cm2
Project - 1

Horizontal replication: 1. Similar study done at Pre and post
clinkerisation. 2. Air requirement analysis done at equipment
level. 3. Basic condition restored and leakages arrested. 4. High pressure air for cleaning stopped.
Before After
No of compressor in operation
4 at Pre + 3 at Post
2 at Pre + 2 at Post
Power saving -
5000 kWh per day = Rs 80 lacs
annually
Project - 1

EQUIPMENT AVG. KW BEFORE
S/D AVG. KW AFTER
S/D DIFFERENCE RUNNING HRS SAVING REMARKS
kWh kWh kWh Hrs per year Rs/Annum
CALCINER FAN(J1J03) 2439.21 2339.64 99.57 7920 3351526
RAW MILL ESP (J1P09) 960.51 868.17 92.34 7920 3108164
KILN STRING(J1J01) 1104.32 1201.41 -97.09 7920 -3268049 Due to
higher speed set point
COAL MILL (K1T02) 526.21 519.74 6.47 6930 190558
COOLER ESP(W1P21) 148.13 121.77 26.36 7920 887278
COOLER ESP(W1P31) 134.97 103.02 31.95 7920 1075437
159.6 5344913
TOTAL POWER SAVING 1257627 KW/year
SAVING IN RS 53.45 Lac/ Annum
Project 2- Cone Gap Correction

31
Project -3- Separator Seal Gap
Modifications done in Separator Inner Seal Plate – Increased by 150mm
Before After

32
Project -3- Separator Seal Gap
• Coal Mill out put increased by 2 TPH- Sp. Power reduced by 0.1 kWh/T of Coal
• Raw Mill out put increased by 4 TPH and Sp. Power reduced by 0.3 kWh/T of material.
• Cement Mill by Pass reduced by 3 %. Saved 0.2 kWh/T of material.
• Saving in coal mill is equivalent to Rs 1.57 (@4.5Rs/kWh and 25 lacs Clinker at 14% coal) Lacs annually.

Project -4 - Cement Grinding
2010
1990
Before
After

Project -4 - Cement Grinding`
• Grinding media filling reduced from 29% to 25%.
• Mill main drive running KW reduced from 2000 KW to 1820 KW.
• Mill out put reduced from 195 TPH to 190 TPH on average.
• Sp. Power reduced by 1.35 kWh/MT of Cement in PPC Grade.
• Saving is equivalent to Rs 109.3 Lacs annually (@18 Lacs PPC and 4.5 Rs/kWh).

35
Reduced Dam ring Height
Before After
185mm 195mm
Project -5 – RM-1 Dam ring
• Raw Mill output increased by 5 TPH and Sp. Power reduced by 0.3 kWh/MT of material. Saving is equivalent to Rs 50.6 Lacs annually.
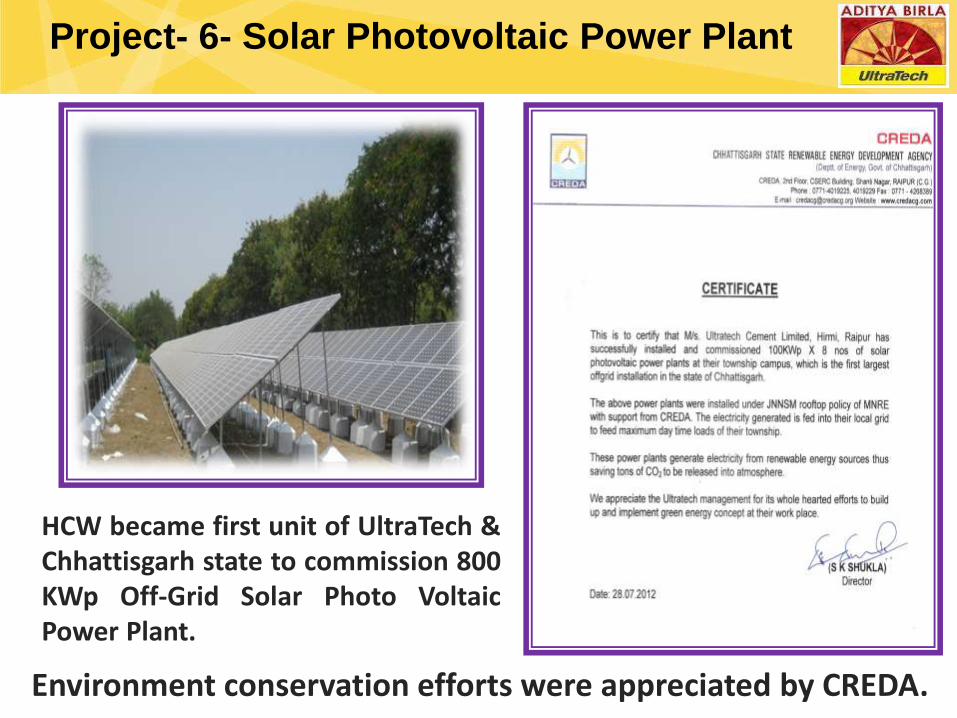
Project- 6- Solar Photovoltaic Power Plant
Environment conservation efforts were appreciated by CREDA.
HCW became first unit of UltraTech & Chhattisgarh state to commission 800 KWp Off-Grid Solar Photo Voltaic Power Plant.

Project 7- False air reduction
• Improvement in system efficiency by reducing false air in raw
mills, achieved ever lowest false air level of <15%.
• Reduced KS false air to 7.25% by modifying AF system.
• Reduced & sustained CS false air level to <5%.

Project 8- Drying chamber removal
Cement Mill 2 drying chamber removed reduced MD load by 60 KW,
saved 0.31 kWh/T with annual saving potential of Rs 19.6 lacs.
BEFORE AFTER
Mill with drying chamber Mill without drying chamber

39
Project 9- Value Engineering Project
S N Project Name Baseline Target Actual Benefit in Rs Lacs in up to Mar 2015
1
Increasing Raw mill
1 productivity to
reduce power
consumption
286 TPH
(Both
Mill)
291 TPH (10 TPH
in Mill 1 will lead
into 5 TPH rise in
both Mills)
YTD rate improved to 291 TPH up to Mar 15.
Corresponding power saving is 0.24 kWh/Ton of
RM and monetary gain is 37.6 Lacs INR.
286
291
18.23
17.99
17.85
17.90
17.95
18.00
18.05
18.10
18.15
18.20
18.25
283
284
285
286
287
288
289
290
291
292
Yr'13-14 Yr'14-15
RM
TP
H
Sp.
Po
we
r,
kWh
/MT
RM Sp. Power Consumption & TPH
TPH Sp Power, kWh/MT
Better Better

40
Project -10 Fly Addition
8.6
10.1 10.6 10.6
11.5
27.0
27.5
28.0
29.4
30.2
25.0
26.0
27.0
28.0
29.0
30.0
31.0
0
2
4
6
8
10
12
Yr'10-11 Yr'11-12 Yr'12-13 Yr'13-14 Yr'14-15
PP
C-1
Day
(M
Pa)
Fly
ash
, %
PPC 1 day strength Vs Fly ash absorption
PPC-1Day Flyash%
Better
Improved one day strength of PPC To 11.5 MPa against earlier best pf 10.6 MPa of last year by-
• Using Pet coke (Alkali Sulphate formation)
• By optimising Clinker C3S
• By optimising fly ash quality

41
Project -11- Cooler Project
Project Name Baseline Target
Reduction in Sp.
Heat consumption
in Kiln
735
Kcal/Kg
705
Kcal/Kg
Parameters Baseline Guaranteed Achieved
Cooler Recuperation efficiency 61.4 - 68.3
Cooler Power (Drive, crusher and Fans)
@ meter [kWh/t] 6.07 4.60 4.50
Clinker temperature[Deg C] 162+Amb 65+Amb 63+ Amb
Clinker heat loss [kcal/kg clinker] 36.16 - 20.32
Cooler losses [kcal/kg clinker] 125 118 116

Impact
785.22
753.44 749.00
712
660
680
700
720
740
760
780
800
GtG Kcal/Kg of Major Product (PPC)
2011-12 2012-13 2013-14 2014-15

43
SN Description
1 Optimisation of Kiln Sp. Heat consumption with target to achieve 705 Kcal/kg of Clinker.
2 Optimisation of Plant Sp. Power consumption per ton of Clinker to 63 kWh/T and PPC Grinding power <25 kWh/T
2.1 Optimisation of RM2 Fan after cone replacement (Expected saving 50 KW)
2.2 Optimisation of Coal Mill with booster fan by pass (30 KW saving)
2.3 Removal of drying chamber from CM 1 (60 KW saving).
2.4 Installation of Screw LP compressor in place of reciprocating
2.5 Installation of Turbo blower in place of twin lobe
3 Improving the fly ash addition in PPC from 30.3 to 32% with grinding aid.
4 To improve TSR through AF usage from 0.67 to 2%.
Way Forward

Thanks !! For more information, please contact: Mr. Vivek Kumar Mishra, HOD-Technical Services, Hirmi Cement Works [email protected]
44


