53
His Majesty Sultan Qaboos bin Said
1
His Majesty Sultan Qaboos bin Said

2

3
Board of Directors ........................................................................................................ 4
Directors’ Report ........................................................................................................... 5 - 10
Auditor’s Report on Corporate Governance ............................................................. 11
Corporate Governance Report - 2015 ....................................................................... 12-17
Auditor’s Report on Consolidated Financial Statements ......................................... 18-19
Consolidated and Parent Company Statement of Comprehensive Income ......... 20
Consolidated and Parent Company Statement of Financial Position ..................... 21
Consolidated and Parent Company Statement of Changes in Equity ................... 22
Consolidated and Parent Company Statement of Cash Flows ............................... 23
Notes to the Consolidated and Parent Company Financial Statements ................ 24 - 53
CONTENTS

4
Hassan bin Ali SalmanChairman
Saud bin Ahmed Al NahariDirector
Maqbool bin Ali SalmanDy. Chairman & M D
B O A R D O F D I R E C T O R S
Khalifa bin Saif Darwish Al KetbiDirector
Mehdi bin Mohamed Jawad Al Abduwani Director
Eng. Salem bin Said Al-GhatamiDirector
5
DIRECTORS’ REPORT(Including Management Discussion and Analysis)
Dear Shareholders,
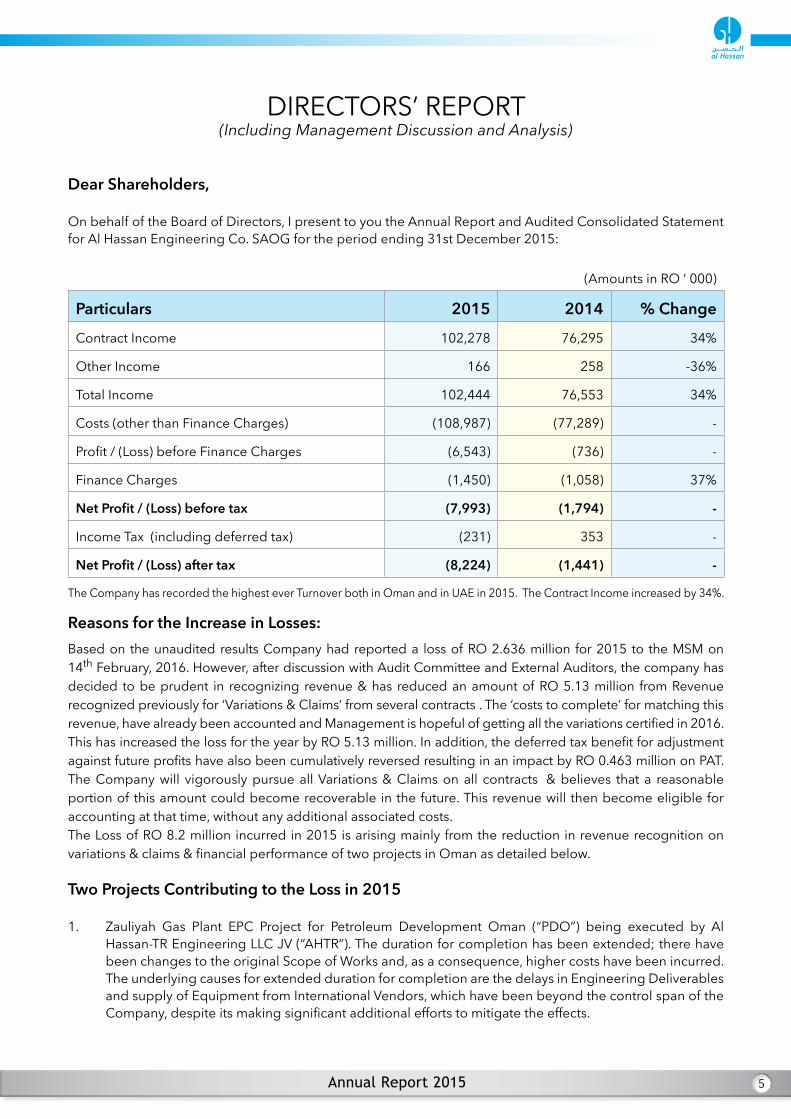
On behalf of the Board of Directors, I present to you the Annual Report and Audited Consolidated Statement for Al Hassan Engineering Co. SAOG for the period ending 31st December 2015:
(Amounts in RO ‘ 000)
Particulars 2015 2014 % Change
Contract Income 102,278 76,295 34%
Other Income 166 258 -36%
Total Income 102,444 76,553 34%
Costs (other than Finance Charges) (108,987) (77,289) -
Profit / (Loss) before Finance Charges (6,543) (736) -
Finance Charges (1,450) (1,058) 37%
Net Profit / (Loss) before tax (7,993) (1,794) -
Income Tax (including deferred tax) (231) 353 -
Net Profit / (Loss) after tax (8,224) (1,441) -
The Company has recorded the highest ever Turnover both in Oman and in UAE in 2015. The Contract Income increased by 34%.
Reasons for the Increase in Losses:Based on the unaudited results Company had reported a loss of RO 2.636 million for 2015 to the MSM on 14th February, 2016. However, after discussion with Audit Committee and External Auditors, the company has decided to be prudent in recognizing revenue & has reduced an amount of RO 5.13 million from Revenue recognized previously for ‘Variations & Claims‘ from several contracts . The ‘costs to complete’ for matching this revenue, have already been accounted and Management is hopeful of getting all the variations certified in 2016. This has increased the loss for the year by RO 5.13 million. In addition, the deferred tax benefit for adjustment against future profits have also been cumulatively reversed resulting in an impact by RO 0.463 million on PAT. The Company will vigorously pursue all Variations & Claims on all contracts & believes that a reasonable portion of this amount could become recoverable in the future. This revenue will then become eligible for accounting at that time, without any additional associated costs.The Loss of RO 8.2 million incurred in 2015 is arising mainly from the reduction in revenue recognition on variations & claims & financial performance of two projects in Oman as detailed below.
Two Projects Contributing to the Loss in 2015
1. Zauliyah Gas Plant EPC Project for Petroleum Development Oman (“PDO”) being executed by Al Hassan-TR Engineering LLC JV (“AHTR”). The duration for completion has been extended; there have been changes to the original Scope of Works and, as a consequence, higher costs have been incurred. The underlying causes for extended duration for completion are the delays in Engineering Deliverables and supply of Equipment from International Vendors, which have been beyond the control span of the Company, despite its making significant additional efforts to mitigate the effects.

6
2. A Project in Sohar where significant increase in the costs have taken place due to expediting work & various issues. The Company is considering all measures to mitigate the loss.
RestructuringA complete Restructuring Plan is being worked out which will include and not limited to; Management Structure, Bank Debt & Addition of Equity Capital. This will focus on; Improved Bidding, Contract Execution, Change/Variation & Claims Management & Financial Accounting. This is expected to be done during the year 2016.
Vacant Land Sale Profit in 2016
The Company and the Major Shareholders are expected to enter into a Sale & Purchase Agreement for the vacant Land at Ghala at a price of RO 3.2 million (subject to Annual General Meeting approval). This land was vacated in 2015 by relocating the Fabrication, Plant Workshop and Stores to a new and improved facility at Nizwa. This agreement is expected to be approved in the AGM and will give the Company a cash inflow of RO 3.2 million, resulting in a one-time non-operational profit of RO 2.9 million in Q2 - 2016.In addition, all efforts are also being made to seek recovery and reimbursement of Company’s additional costs as incurred as a result of the acts/omissions of its Clients/Subcontractors/Suppliers, including involvement of Third Party/Legal Dispute Resolution process as appropriate.
The Revenue growth of the Company over the last five years is as shown in the table below:
Year 2011 2012 2013 2014 2015
Revenue 61,099 50,279 63,348 76,553 102,278
In Oman, a new project for Construction of the Mabrouk Pipeline Project from PDO was awarded to the Company.
UAE New project Awards1. SMP Works (Part A) For Rumaitha/ Shanayel Phase-III Project, from GS Engineering & Construction.2. ICAD Gas Treatment to Remove H2S Project No. 5649, from GASCO EPC3. Electrical & Instrumentation Works for Satah Al Razboot (SARB) Field Development EPC Package-4,
from Hyundai Engineering Offshore.4. Supply, Installation, Testing & Commissioning of 3 Nos. 132 kV Substations For DEWA from
SIEMENS.5. Civil Works (ISBL CCP Area B) For Rumaitha/ Shanayel Phase-III Project, from GS Engineering &
Construction.
Ghaba North Redevelopment Project for Pipeline Emergency Water Reservoir Project, Muscat
7
Oman Projects under EXECUTION:1. Zauliyah Gas Plant for PDO: Al-Hassan is leading the JV of this EPC project with TR as its
Engineering partner. Civil Works and Pipeline Works have been completed. Piping Works are in progress. Major equipment has already been erected. Expected to achieve substantial completion by end of Q3 - 2016.
2. Saih Nihayda Condensate Stabilization for ABB: Multi-disciplinary Construction Works; the Owner being PDO. Civil works, structural erection, piping and pipeline works are in progress. Expected to achieve Mechanical Completion by Q3 – 2016.
3. SoharRefineryImprovementProject(SRIP)forDaelimPetrofacJV- Al-Hassan is carrying out Construction and Pre-commissioning of Civil and Underground Piping Works, the Owner being ORPIC. Expected to complete in Q2 – 2016.
4. RababHarweel Power Plant andHRSG Project for PDO: An EPC contract, Engineering is nearing completion. Orders for major Equipment have already been placed. Construction works is in progress. Expected to achieve Substantial Completion in Q1 - 2017.
5. Ghaba North Redevelopment Project for PDO: – Construction is ongoing for the on-plot facilities for production handling from Ghaba North, and GRE flow lines with well heads. Expected to achieve Mechanical Completion by Q1 – 2016 and Substantial Completion by Q2 – 2016.The Company has successfully completed Musandam Gas Plant Project and received a Letter of Appreciation from M/s. Hyundai Engineering Co. Ltd. for high HSE & Quality standards without any LTI
UAE Projects under EXECUTION:
1. CivilandAssociatedBuildingWorksof400KV/220KV/33kVGridStationatMirfa,for M/s Siemens: Works are in progress, Project completion is targeted in Q1 - 2016.
2. ConstructionofCGLComplexPhase-II, for M/s Ghurair Iron & Steel LLC. (AGIS). Works are in progress, Project is scheduled to complete in Q1 - 2016.
3. Manufacturing, Supply, Testing & Commissioning of 3 way valves (TCVS) 4 Nos. inHydrocrackerplant at Ruwais refinery, for M/s. Takreer: Shut-down and project completion are scheduled in Q2 - 2016.
4. BuildingWorks forSatahAlRazboot (SARB)FieldDevelopmentEPCPackage4, for M/s. Hyundai Engineering & Construction Co Ltd: Works are in progress, Project completion is scheduled in Q3 - 2017.
5. EPCworks for Replacement ofValves andActuators at BuHasa, for GASCO Abu Dhabi: Project completion is scheduled in Q4 - 2016.
6. EPCWorksforBlackPowderManagement(NewSeparation&FiltrationProject), for GASCO Abu Dhabi: Construction works commenced at all locations, Project completion is scheduled in Q3 - 2016.
Human Resources The Company continues to strive towards keeping its HRD function abreast with the changing work environment and aligning itself with the newest innovations in employee engagement, compensation and recruitment. 2015 proved to be yet another year where the Company HR continued to roll out innovations.This year the Company introduced a multidimensional assessment tool for potential candidates. This initiative is a watershed moment in recruitment, because it enables the recruiters to assess a candidate on several variables including behavioral attributes, enabling the Company to have a comprehensive idea of a probable candidate’s capabilities. The
8
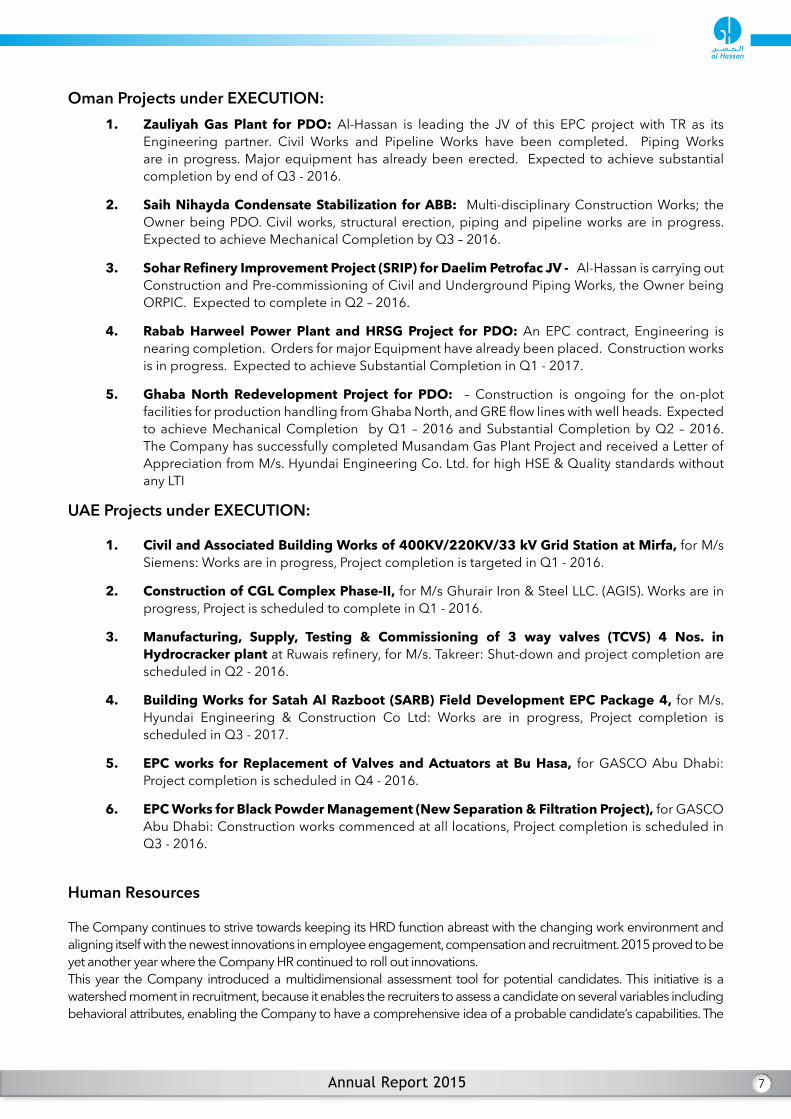
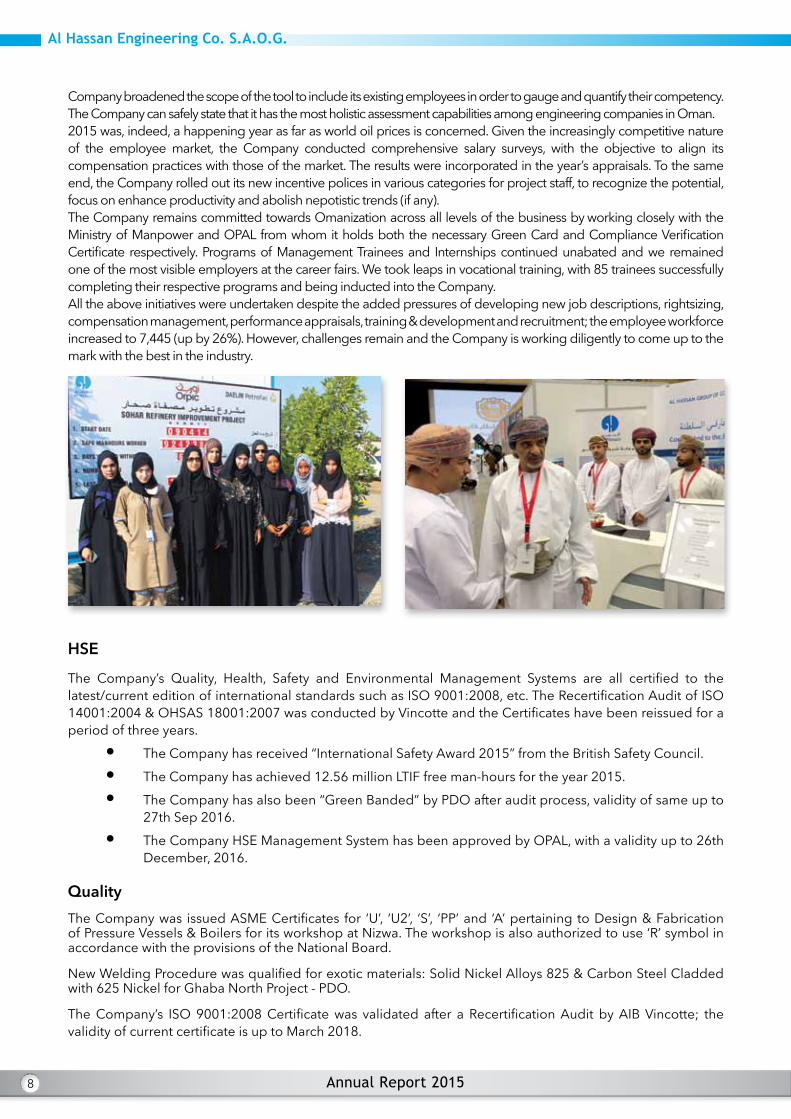
Company broadened the scope of the tool to include its existing employees in order to gauge and quantify their competency. The Company can safely state that it has the most holistic assessment capabilities among engineering companies in Oman.2015 was, indeed, a happening year as far as world oil prices is concerned. Given the increasingly competitive nature of the employee market, the Company conducted comprehensive salary surveys, with the objective to align its compensation practices with those of the market. The results were incorporated in the year’s appraisals. To the same end, the Company rolled out its new incentive polices in various categories for project staff, to recognize the potential, focus on enhance productivity and abolish nepotistic trends (if any). The Company remains committed towards Omanization across all levels of the business by working closely with the Ministry of Manpower and OPAL from whom it holds both the necessary Green Card and Compliance Verification Certificate respectively. Programs of Management Trainees and Internships continued unabated and we remained one of the most visible employers at the career fairs. We took leaps in vocational training, with 85 trainees successfully completing their respective programs and being inducted into the Company.All the above initiatives were undertaken despite the added pressures of developing new job descriptions, rightsizing, compensation management, performance appraisals, training & development and recruitment; the employee workforce increased to 7,445 (up by 26%). However, challenges remain and the Company is working diligently to come up to the mark with the best in the industry.
HSE
The Company’s Quality, Health, Safety and Environmental Management Systems are all certified to the latest/current edition of international standards such as ISO 9001:2008, etc. The Recertification Audit of ISO 14001:2004 & OHSAS 18001:2007 was conducted by Vincotte and the Certificates have been reissued for a period of three years.
• The Company has received “International Safety Award 2015” from the British Safety Council.• The Company has achieved 12.56 million LTIF free man-hours for the year 2015.• The Company has also been “Green Banded” by PDO after audit process, validity of same up to
27th Sep 2016.• The Company HSE Management System has been approved by OPAL, with a validity up to 26th
December, 2016.
QualityThe Company was issued ASME Certificates for ‘U’, ‘U2’, ‘S’, ‘PP’ and ‘A’ pertaining to Design & Fabrication of Pressure Vessels & Boilers for its workshop at Nizwa. The workshop is also authorized to use ‘R’ symbol in accordance with the provisions of the National Board.
New Welding Procedure was qualified for exotic materials: Solid Nickel Alloys 825 & Carbon Steel Cladded with 625 Nickel for Ghaba North Project - PDO.
The Company’s ISO 9001:2008 Certificate was validated after a Recertification Audit by AIB Vincotte; the validity of current certificate is up to March 2018.
9
Corporate Social Responsibility (CSR)
The Company has taken throughout 2015 a number of activities with the objective of providing a sustainable contribution to the growth and well-being of the local community. An amount of RO 23,358/- was spent during the year across various CSR activities that include contributions to the various sports, health and cultural initiatives in various parts of Oman; Employment and Training of the local people in and around its work sites; building of mosques and contributions to the educational activities of children. The Company shall continue with such initiatives that bring about a positive change in the society and environment at large.
Risks / Opportunities
A Risk Management Committee has been formed to assess/address the risks and their mitigation in a timely manner The Company will continue to adopt transparent and ethical business practices
The construction and contracting business does, however, have inherent cost risks associated with scope / time / resource estimation. There are also risks associated with contractual interpretations and/or non-receipt of timely inputs from Clients/Subcontractors/Suppliers which can affect the overall cost recovery. The Company continues to review and update processes for recognizing, managing and mitigating these business risks to the best possible extent.
Variation & Claims on contracts have been included in Revenue as per the Accounting policy & International Accounting Standards. The matching costs incurred/expected to be incurred for these revenues have also been included in the Project ‘Cost to Complete’
An assessment is made of outstanding variations & their recoverability and an amount of RO 19.29 million which is approximately 50% of such amounts claimed, is included as revenue up to Dec 2015. The actual realization could be higher or lower due to a variety of factors.
Internal Control
The Company Internal Audit function independently and periodically assesses compliance with the established business procedures within the Company and recommends corrective actions for any lapse in the Internal Control System.
The Company Audit Committee regularly meets with Internal Audit to assess the effectiveness of the Internal Control System.
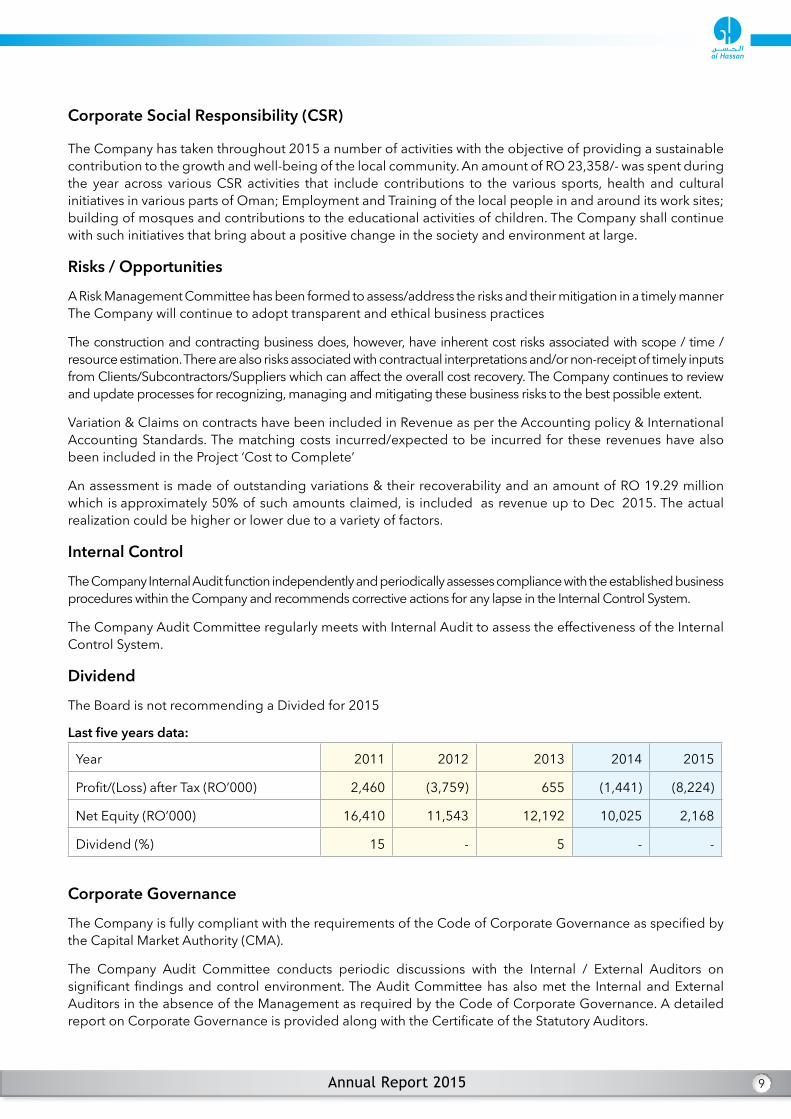
Dividend
The Board is not recommending a Divided for 2015
Last five years data:
Year 2011 2012 2013 2014 2015
Profit/(Loss) after Tax (RO’000) 2,460 (3,759) 655 (1,441) (8,224)
Net Equity (RO’000) 16,410 11,543 12,192 10,025 2,168
Dividend (%) 15 - 5 - -
Corporate Governance
The Company is fully compliant with the requirements of the Code of Corporate Governance as specified by the Capital Market Authority (CMA).
The Company Audit Committee conducts periodic discussions with the Internal / External Auditors on significant findings and control environment. The Audit Committee has also met the Internal and External Auditors in the absence of the Management as required by the Code of Corporate Governance. A detailed report on Corporate Governance is provided along with the Certificate of the Statutory Auditors.

10
Management Changes and Cost OptimizationIn January 2016 Mr. Stephen Scott relinquished his position as CEO, and Dr. Shawqi Hamdan Sajwani has taken over as the new CEO. Dr. Sajwani has over 30 years of experience, starting with General Motors in USA, Dubai Aluminum Co. (“DUBAL”) and Dubai Holding (“DH”) as Group Director Business Excellence. Since 2009 he has practiced consultancy in Business Management.
Mr. Adil Darwish Yousef Al Lawati has also joined the company as General Manager-Projects, He is an Omani National, and a Mechanical Engineer trained in the USA, and has over two decades of extensive and diverse work experience in the Oil & Gas business in organisations such as PDO and Tebodin.
Significant changes led by the new CEO are underway to restructure the Company; to improve asset/manpower utilization and to reduce costs all across the Company, which can be expected to make it lean and efficient for the future challenges.
Al Hassan Engineering Co. Abu Dhabi LLC Subsidiary CapitalisationThe financial requirements of the Abu Dhabi LLC subsidiary (which has had a good growth) are presently supported by the Parent Company in Oman. It is expected that in 2016 a re-capitalization of this LLC Company may be implemented, subject to selection of a new shareholder and the obtaining of all necessary approvals. This will increase the Share Capital and bring in the cash required for independent operations. This is expected to reduce the Parent Company support requirement, strengthen the Net Worth at a consolidated level, and reduce the Bank Borrowings by the Parent Company.
Future OutlookThe Company has built a very strong market reputation in over 30 years of operation for completing all projects undertaken successfully, and presently employs over 4000 people in Oman. It has a confirmed Order Book of RO 94 million (as of December 2015) and expects its Revenues in 2016 to be at par with 2015, despite the market environment.
The changes as described above are also expected to improve Project Delivery and Deliver Cost Reductions in 2016
The Inflow of RO 3.2 million from the Ghala Land Sale, Recapitalization of the Abu Dhabi subsidiary and the concluding of current negotiations with some Clients that are currently in their final closing stages are expected to reduce the debt level by Q2 - 2016.
Although the recent Oil Price decline inevitably affects the total market size where the Company operates, its current bidding scope and revenue is unlikely to be adversely affected in the immediate future years due to forthcoming opportunities such as Liwa Plastics, Duqm Refinery, IPP’s and other PDO projects. The Company is well placed to get a reasonable share of these significantly high value Projects being/to be tendered. The Company as part of its initiative has also established Engineering Design capability in UAE which will identify new opportunities in years to come.
Gratitude and AppreciationThe Board expresses its gratitude and appreciation to His Majesty Sultan Qaboos Bin Said and to His Government for their continuous support to the private sector.
The Board would also like to thank all Regulatory Authorities, Commercial Banks in Oman where it maintains excellent relationships, business partners and all the clients of the Company and media for their co-operation and continued support.
Hassan bin Ali SalmanChairman

11

12
CORPORATE GOVERNANCE REPORT - 2015
Company Philosophy
In line with the requirements of Capital Market Authority (CMA), Company’s management is pleased to present Company’s Thirteenth Corporate Governance Report for the year ended December 31st, 2015.
The Company is firmly committed to high standards of Corporate Governance and promotes the culture of compliance. The Company ensures good Corporate Governance through a combination of factors like:
• Regular management reviews and structured written reports by Management to the Board.• Periodical communication with shareholders.• Establishment of Internal Regulations, Operating procedures, Human Resource & Administration Manual, Accounts Manual to ensure effective Internal Control.• Monitoring adherence to these by the Operating Management, through frequent checks including checks by ISO Audit, HSE Audit, Internal Auditors reporting to Audit Committee comprising of Board Members.
The Company is committed to the business integrity, high levels of transparency, accountability, and business propriety. The Board supports the highest standards of Corporate Governance and promotes the culture of compliance. The Corporate Governance of the Company envisages the ultimate objective of increasing long-term shareholders’ value and maximizes interest of other stakeholders, which in turn will lead to corporate growth.
Board of DirectorsThe present strength of the Board is six Directors comprising one Executive Directors and five Non-Executive Directors.
Sr Name Designation Category Directorship and Designation in other Joint Stock Companies.
1 Hassan Ali Salman Chairman Non - Executive -
2 Maqbool Ali Salman Dy. Chairman & Mg. Director Executive -
3 Saud Ahmed Al Nahari IndependentDirector Independent
- Oman Telecommunications Co. SAOG (Dy Chairman)- Oman United Insurance Co. SAOG (Dy Chairman)- Port Services Corporation SAOG (CEO)- Oman Al Arabi Fund (Director)
4 Khalifa Saif Darwish Alketbi IndependentDirector Independent
- Vision Investment Service- Chairman- Vision Insurance - member
5 Eng. Salim Bin Said Bin Issa Al Ghatami
IndependentDirector Independent -
6Mehdi bin Mohamed Jawad Al Abduwani (Appointed on 24th March 2015)
IndependentDirector Independent
- National Ferries Co. SAOC (CEO)- Computer Stationery Industry SAOG (Chairman)- Al Maha Ceramics SAOG (Director)- Sun Packaging SAOC (Director)- Oman Telecommunications Co. SAOG- Board member
13
The Board has clearly demarcated its functions vis-à-vis the management, and has adequately empowered the executive management on all day-to-day matters, subject to overall authority vested with the Board. The Company lays strong emphasis on audits and internal controls and has introduced suitable checks and balances to ensure sound integrity of operations. The Company also emphasizes on total compliance with various laws and regulations of the country and transparency in its accounts as required by the International Accounting Standards.In order to facilitate governance, the Board of Directors reviews the periodical reports of Company’s operating plans of business, capital budgets and updates, Quarterly results of the Company, Minutes/recommendations of the Audit Committee, Related party transactions etc.
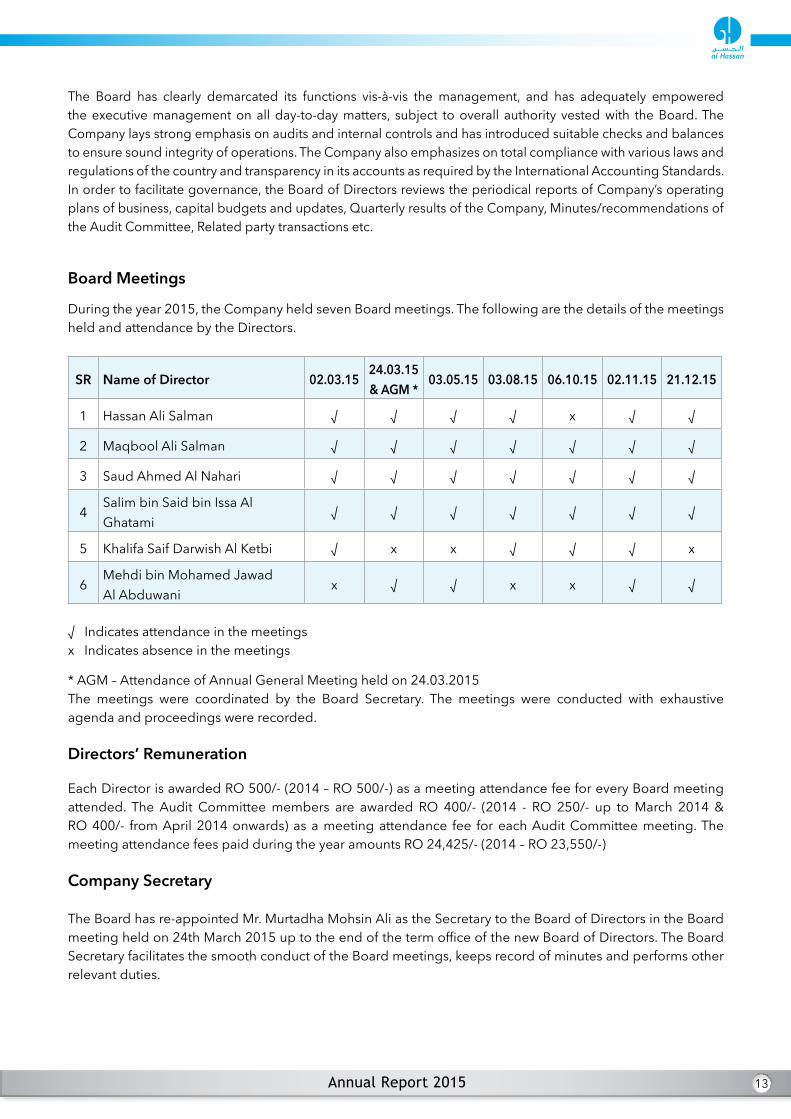
Board Meetings
During the year 2015, the Company held seven Board meetings. The following are the details of the meetings held and attendance by the Directors.
SR Name of Director 02.03.1524.03.15 & AGM *
03.05.15 03.08.15 06.10.15 02.11.15 21.12.15
1 Hassan Ali Salman √ √ √ √ x √ √
2 Maqbool Ali Salman √ √ √ √ √ √ √
3 Saud Ahmed Al Nahari √ √ √ √ √ √ √
4Salim bin Said bin Issa Al Ghatami
√ √ √ √ √ √ √
5 Khalifa Saif Darwish Al Ketbi √ x x √ √ √ x
6Mehdi bin Mohamed Jawad Al Abduwani
x √ √ x x √ √
√ Indicates attendance in the meetingsx Indicates absence in the meetings
* AGM – Attendance of Annual General Meeting held on 24.03.2015The meetings were coordinated by the Board Secretary. The meetings were conducted with exhaustive agenda and proceedings were recorded.
Directors’ Remuneration
Each Director is awarded RO 500/- (2014 – RO 500/-) as a meeting attendance fee for every Board meeting attended. The Audit Committee members are awarded RO 400/- (2014 - RO 250/- up to March 2014 & RO 400/- from April 2014 onwards) as a meeting attendance fee for each Audit Committee meeting. The meeting attendance fees paid during the year amounts RO 24,425/- (2014 – RO 23,550/-)
Company Secretary
The Board has re-appointed Mr. Murtadha Mohsin Ali as the Secretary to the Board of Directors in the Board meeting held on 24th March 2015 up to the end of the term office of the new Board of Directors. The Board Secretary facilitates the smooth conduct of the Board meetings, keeps record of minutes and performs other relevant duties.

14
Company Management
The name, designation, description of responsibilities of the Company management personnel is as follows
• Stephen Curtis Scott – Chief Executive Officer Experience of 30 years. Responsible for strategy and day-to-day management of the Company. Appointed in February 2015 and resigned in February 2016.• Dr. Shawqi Hamdan Sajwani – Chief Executive Officer Experience of 30 years. Responsible for strategy and day-to-day management of the Company. Appointed in February 2016. • Mr. Adil Darwish Yousef Al Lawati– General Manager - Projects Experience of 20 years. Appointed in December 2015. Responsible for projects operations and execution• Shahzad Sadan – General Manager - Organizational Development Experience of 32 years. Responsible for Organizational Development issues.• Taketsugu Kimura – General Manager - Business Development
Experience of 43 years. Responsible for Business Development.• S A Naqvi – General Manager - Plant Experience of 43 years. Responsible for all fixed and mobile plant assets and capital equipment.• Abbas Muljiani – General Manager - Finance & IT Experience of 32 years. Responsible for the Finance, Procurement and IT functions of the Company.
Operating Management Remuneration
Salary, allowances including traveling expenses of the top five senior officers paid during the year 2015 is RO 395,078/- (2014 - RO 349,462/-for top five senior officers ).
The severance notice period of these executives is one to six months, with end of service benefits payable as per Omani Labour Law.
Audit Committee
During the year 2015 six meetings were held and the following are the details of the meetings held and attendance by the Directors:
Sr Name of Director Category 02.03.15 24.03.15 03.05.15 03.08.15 02.11.15 21.12.15
1 Saud Ahmed Al Nahari Chairman √ √ √ √ √ √
2 Salim bin Said bin Issa al Ghatami
Vice-Chairman √ √ √ √ √ √
3 Khalifa Saif Darwish Al Ketbi (up to 24th March 2015) Member √ x x x x x
4Mehdi bin Mohamed Jawad Al Abduwani (Appointed on 24th March 2015)
Member x x √ x √ √
√ Indicates attendance in the meetingsx Indicates absence in the meetings
The Audit Committee is appointed by the Board of Directors to assist the board in discharging its oversight responsibilities. The Audit Committee charter is reviewed by the Board of Directors every year.
The Audit Committee reviews: the effectiveness of the Company’s internal financial control and risk management system; the effectiveness of the internal audit function; the independent audit process including
15
recommending the appointment and assessing the performance of the external auditor; the Company’s process for monitoring compliance with laws and regulations affecting financial reporting, including requirements of CMA and code of conduct. The Audit Committee checks for financial frauds protection and appropriate systems to ensure adoption of appropriate accounting policies and principles leading to fairness in financial statements. The Audit Committee also oversees the financial reporting process to ensure the balance, transparency and integrity of published financial information and appropriate accounting policies leading to fairness therein are in place. In performing its duties, the committee will maintain effective working relationships with the board of directors, management, and the external and internal auditors.
Audit and Internal Control
In consultation with the Audit Committee, the Board of Directors recommends the appointment of external auditors to the Annual General Meeting. In the Annual General Meeting held on 24th March, 2015, Deloitte & Touche (M.E.) has been appointed as external auditors for the financial year 2015.
In accordance with the Corporate Governance Code, the services of Deloitte & Touche (M.E.) are not used where a conflict of interest might occur.
The Audit Committee has, as per their charter, reviewed the internal control environment of the Company. They have met the internal auditors to review the internal audit reports, recommendations and management comments thereupon. They have also met the external auditors to review audit findings and management letter. The Audit Committee and the Board are pleased to inform the shareholders that an adequate and effective internal control system is in place and that there are no significant concerns.
Means of Communications with the Shareholders and Investors
The Annual Report is mailed to all shareholders. The Annual General Meeting is a regular forum where there is a face-to-face interaction between the Directors and the Shareholders. The quarterly results of the Company are sent to the CMA as per the requirement and made available to the shareholders either through CMA or from the Company’s head office on demand. These are also published in local newspapers in English and Arabic. The Company has its web site www.al-hassan.com.
The executives have regular interaction with institutional investors, financial analysts and news reporters on the operations, opportunities and performance of the Company.
Dividend Policy
The Company will aim to have a consistent sustainable dividend policy that meets the long-term expectations of all shareholders & has a balance between strengthening the Reserves vs. the need for a yield on investments.
Details of Non-compliance
2015 – There have been no specific areas of non compliance with the provisions of corporate governances during the year. 2014 – There have been no specific areas of non compliance with the provisions of corporate governances during the year. 2013 – There have been no specific areas of non compliance with the provisions of corporate governances during the year.
Related Party Transaction
The Company entered into transactions with entities related to these significant shareholders and the Board of Directors at prices approved by the management and the Board of Directors.

16
Market Price DataMonthly High / Low share price data for financial year 2015:- (Amounts in RO)
Month 2015 High Low Volume MSM Index (Average)
January 0.114 0.097 5,374,414 6,478
February 0.137 0.112 8,287,171 6,648
March 0.130 0.115 2,019,718 6,352
April 0.127 0.108 4,679,811 6,296
May 0.114 0.097 2,378,154 6,359
June 0.102 0.097 684,985 6,458
July 0.101 0.097 310,554 6,501
August 0.102 0.080 1,105,514 6,181
September 0.089 0.083 352,768 5,772
October 0.097 0.086 1,383,758 5,899
November 0.090 0.073 510,511 5,820
December 0.076 0.070 394,495 5,436
Share holders holding more than 5 % of Total Shares as on 31/12/2015
Sr Shareholder Name No of Shares Held Shareholding %1 Hassan Ali Salman 15,092,000 20.072 Maqbool Ali Salman 15,092,000 20.073 Al Hassan Electricals Co. LLC 15,008,000 19.96
17
Professional Profile of Deloitte: Statutory Auditor
About Deloitte
Deloitte refers to one or more of Deloitte Touche Tohmatsu Limited, a UK private company limited by guarantee (“DTTL”), its network of member firms, and their related entities. DTTL and each of its member firms are legally separate and independent entities. DTTL (also referred to as “Deloitte Global”) does not provide services to clients. Please see www.deloitte.com/about for a more detailed description of DTTL and its member firms.
Deloitte provides audit, consulting, financial advisory, risk management, tax and related services to public and private clients spanning multiple industries. With a globally connected network of member firms in more than 150 countries and territories, Deloitte brings world-class capabilities and high-quality service to clients, delivering the insights they need to address their most complex business challenges. Deloitte’s more than 220,000 professionals are committed to making an impact that matters.
About Deloitte & Touche (M.E.)
Deloitte & Touche (M.E.) is a member firm of Deloitte Touche Tohmatsu Limited (DTTL) and is a leading professional services firm established in the Middle East region with uninterrupted presence since 1926.
Deloitte provides audit, tax, consulting, and financial advisory services through 26 offices in 15 countries with more than 3,300 partners, directors and staff. It is a Tier 1 Tax advisor in the GCC region since 2010 (according to the International Tax Review World Tax Rankings). It has also received numerous awards in the last few years which include best employer in the Middle East, best consulting firm, the Middle East Training & Development Excellence Award by the Institute of Chartered Accountants in England and Wales (ICAEW), as well as the best CSR integrated organization.
An amount of RO 16,400 towards audit fees of the Company and subsidiaries and fees for other services paid to the Auditor during the year 2015.
Internal Auditor
In order to ensure compliance with statutory regulations and internal controls, the company has a full time internal audit department, to carry on an independent assessment and report to the Audit Committee.
Board of Directors acknowledge that
The Company has its system and procedures formally documented and also hosted in the intranet.
The financial statements have been prepared in accordance with International Financial Reporting standards issued by the International Accounting Standards Board (IASB), interpretations issued by the International Financial Reporting Interpretations Committee (IFRIC) and the requirements of the Commercials Companies Law of the Sultanate of Oman 1974 (as amended) and the rules for disclosure requirements prescribed by the Capital market authority.
There are no material events affecting the continuation of Al Hassan Engineering Co SAOG and its ability to continue its business during the next financial year.
Hassan bin Ali Salman Mr. Saud Ahmed Al NahariChairman Chairman-Audit Committee13th March 2016 13th March 2016
18

19

20
CONSOLIDATED AND PARENT COMPANY STATEMENT OF PROFIT OR LOSS AND OTHER COMPREHENSIVE INCOMEFOR THE YEAR ENDED 31 DECEMBER 2015
Notes2015
Group
2015Parent
Company2014
Group
2014Parent
Company
RO RO RO RO
Contract income 102,278,470 70,767,773 76,294,914 43,441,627
Contract costs 5 (105,433,221) (72,184,386) (74,047,174) (43,092,274)
Gross (loss) / profit (3,154,751) (1,416,613) 2,247,740 349,353
Other income 6 166,407 165,528 257,549 121,375
General and administration expenses 7 (3,554,451) (2,548,260) (3,241,483) (2,330,602)
Operating loss (6,542,795) (3,799,345) (736,194) (1,859,874)
Finance charges 9 (1,450,062) (748,051) (1,057,413) (665,729)
Loss before taxation (7,992,857) (4,547,396) (1,793,607) (2,525,603)
Taxation 10 (230,841) (230,841) 353,089 436,105
Loss for the year (8,223,698) (4,778,237) (1,440,518) (2,089,498)
Other comprehensive income / (loss)
Items that may be reclassified subsequently to profit or loss:
Net change in fair value of forward currency contracts 366,850 366,850 (351,273) (351,273)
Total comprehensive loss for the year (7,856,848) (4,411,387) (1,791,791) (2,440,771)
Basic and diluted loss per share 27 (0.109) (0.064) (0.019) (0.028)
The accompanying notes form an integral part of these consolidated and parent company financial statements

21
CONSOLIDATED AND PARENT COMPANY STATEMENT OF FINANCIAL POSITION AS AT 31st DECEMBER 2015ASSETS Notes 2015
Group
2015Parent
Company2014
Group
2014Parent
CompanyRO RO RO RO
Non-currentassetsProperty and equipment 11(a) 11,389,953 7,841,320 11,280,022 8,089,797Leasehold land 11(b) 715,552 - 746,664 -Goodwill 12 878,478 878,478 878,478 878,478Investments in subsidiaries 13 - 297,900 - 297,900Retentions receivable – non current 16 497,317 - 777,042 -Deferred taxation 22 - - 230,841 230,841Totalnon-currentassets 13,481,300 9,017,698 13,913,047 9,497,016
Current assetsInventories 14 4,904,102 3,887,386 3,350,154 2,823,426Contract and other receivables 16 86,030,719 72,244,955 70,522,296 60,970,799Bank balances and cash 17 2,215,290 1,685,587 2,367,758 1,778,572
93,150,111 77,817,928 76,240,208 65,572,797Assets held-for-sale 11(c) 319,118 319,118 - -Totalcurrentassets 93,469,229 78,137,046 76,240,208 65,572,797Totalassets 106,950,529 87,154,744 90,153,255 75,069,813
EQUITYANDLIABILITIESEquityandreservesShare capital 18 7,520,800 7,520,800 7,520,800 7,520,800Legal reserve 19 1,905,310 1,738,450 1,905,310 1,738,450(Accumulated losses) /retained earnings (7,278,337) (4,199,536) 945,361 578,701Hedging reserve 19,933 19,933 (346,917) (346,917)
Totalequity 2,167,706 5,079,647 10,024,554 9,491,034
LIABILITIESNon-currentliabilitiesEnd of service benefits 21 3,669,701 3,333,892 3,265,077 2,849,298
Current liabilitiesShort term borrowings 23 48,454,008 48,454,008 31,112,482 31,112,482Trade and other payables 24 52,659,114 30,287,197 45,668,130 31,616,999Provision for taxation 10(b) - - 83,012 -Totalcurrentliabilities 101,113,122 78,741,205 76,863,624 62,729,481Totalliabilities 104,782,823 82,075,097 80,128,701 65,578,779
Totalequityandliabilities 106,950,529 87,154,744 90,153,255 75,069,813
Netassetspershare 26 0.029 0.068 0.133 0.126
The financial statements including notes and other explanatory notes on pages 24 to 53 were approved by the Board of Directors and authorised for issue on 13 March 2016 and were signed on their behalf by:
Hassan Ali Salman Maqbool Ali SalmanChairman Managing DirectorThe accompanying notes form an integral part of these consolidated and parent company financial statements.

22
CONSOLIDATED STATEMENT OF CHANGES IN EQUITYFOR THE YEAR ENDED 31 DECEMBER 2015
Sharecapital
Legal reserve
(Accumulated losses)/retained
earnings Hedging reserve Total
Notes RO RO RO RO ROAt 1 January 2014 7,520,800 1,871,949 2,795,280 4,356 12,192,385Loss for the year - - (1,440,518) - (1,440,518)Other comprehensive loss:Net change in fair value of forward currency contracts - - - (351,273) (351,273)Total comprehensive loss - - (1,440,518) (351,273) (1,791,791)
Transactions with owners:Transfer to legal reserve 19 - 33,361 (33,361) - -Dividend paid 20 - - (376,040) - (376,040)
At 1 January 2015 7,520,800 1,905,310 945,361 (346,917) 10,024,554Loss for the year - - (8,223,698) - (8,223,698) Other comprehensive income:Net change in fair value of forward currency contracts - - - 366,850 366,850 Total comprehensive loss - - (8,223,698) 366,850 (7,856,848)
At 31 December 2015 7,520,800 1,905,310 (7,278,337) 19,933 2,167,706
PARENT COMPANY STATEMENT OF CHANGES IN EQUITYFOR THE YEAR ENDED 31 DECEMBER 2015 (continued)
Sharecapital
Legal reserve
(Accumulated losses) / retained earnings
Hedging reserve Total
Notes RO RO RO RO ROAt 1 January 2014 7,520,800 1,738,450 3,044,239 4,356 12,307,845Loss for the year - - (2,089,498) - (2,089,498)Other comprehensive loss:Net change in fair value offorward currency contracts - - - (351,273) (351,273)
Total comprehensive loss - - (2,089,498) (351,273) (2,440,771)
Transaction with owners:Dividend paid 20 - - (376,040) - (376,040)
At 1 January 2015 7,520,800 1,738,450 578,701 (346,917) 9,491,034Loss for the year - - (4,778,237) - (4,778,237)Other comprehensive income:Net change in fair value of forward currency contracts - - - 366,850 366,850
Total comprehensive loss - - (4,778,237) 366,850 (4,411,387)
At 31 December 2015 7,520,800 1,738,450 (4,199,536) 19,933 5,079,647
The accompanying notes form an integral part of these consolidated and parent company financial statements

23
CONSOLIDATED AND PARENT COMPANY STATEMENT OF CASH FLOWSFOR THE YEAR ENDED 31 DECEMBER 2015
Notes2015
Group
2015Parent
Company2014
Group
2014Parent
CompanyRO RO RO RO
Operating activitiesCash receipts from contract and other income 85,864,707 58,943,438 59,120,349 37,534,644Cash paid towards contract costs and expenses (96,880,855) (71,845,613) (58,296,639) (37,646,303)Cash (used in) / generated from operations (11,016,148) (12,902,175) 823,710 (111,659)Finance charges paid - net (1,450,062) (748,051) (1,057,413) (665,729)Tax paid 10 (83,012) - (18,598) -Net cash used in operating activities (12,549,222) (13,650,226) (252,301) (777,388)
Investing activitiesPurchase of property and equipment 11(a) (5,022,926) (3,853,883) (2,497,584) (1,939,488)Proceeds from disposal of equipment 78,154 69,598 81,578 68,978Net cash used in investing activities (4,944,772) (3,784,285) (2,416,006) (1,870,510)
Financing activityDividend paid - - (376,040) (376,040)
Change in cash and cash equivalents during the year (17,493,994) (17,434,511) (3,044,347) (3,023,938)Cash and cash equivalents at the beginning of the year (28,744,724) (29,333,910) (25,700,377) (26,309,972) Cash and cash equivalents at the end of the year (46,238,718) (46,768,421) (28,744,724) (29,333,910)
Cash and cash equivalents at the end of the year comprise:Bank balances and cash 17 2,215,290 1,685,587 2,367,758 1,778,572Short term borrowings 23 (48,454,008) (48,454,008) (31,112,482) (31,112,482)
(46,238,718) (46,768,421) (28,744,724) (29,333,910)
The accompanying notes form an integral part of these consolidated and parent company financial statements.
24
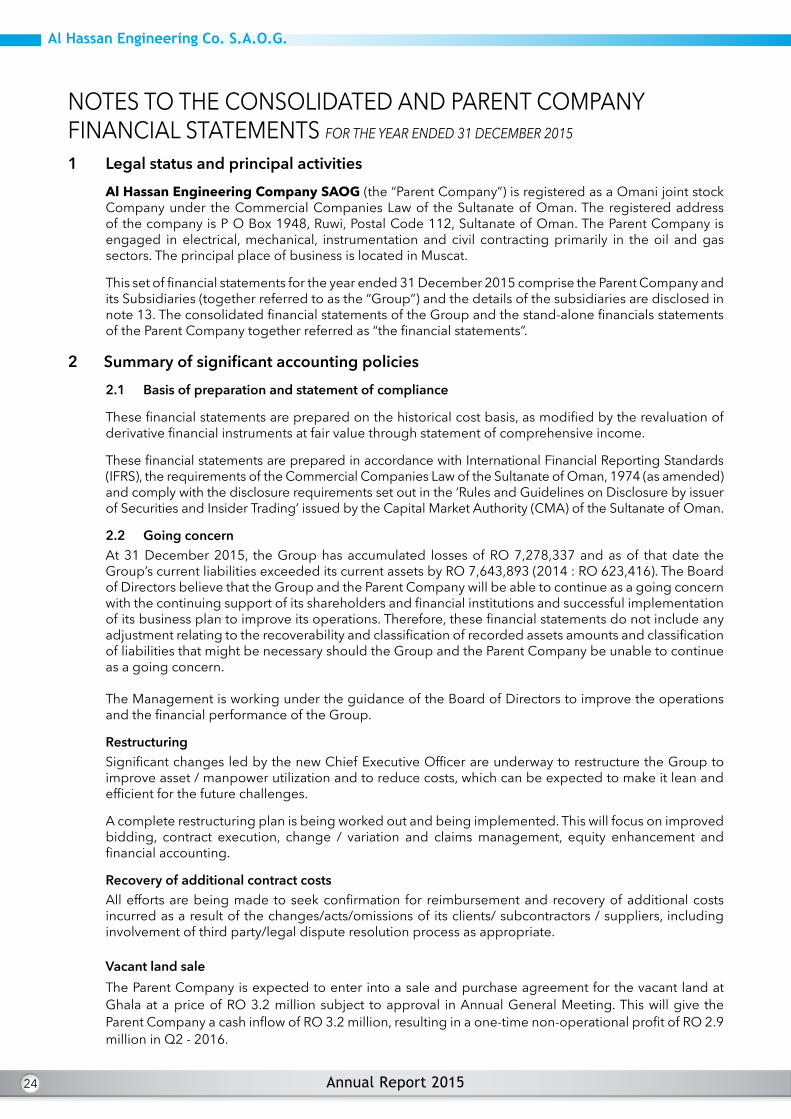
NOTES TO THE CONSOLIDATED AND PARENT COMPANY FINANCIAL STATEMENTS FOR THE YEAR ENDED 31 DECEMBER 2015
1 Legal status and principal activitiesAlHassanEngineeringCompanySAOG (the “Parent Company”) is registered as a Omani joint stock Company under the Commercial Companies Law of the Sultanate of Oman. The registered address of the company is P O Box 1948, Ruwi, Postal Code 112, Sultanate of Oman. The Parent Company is engaged in electrical, mechanical, instrumentation and civil contracting primarily in the oil and gas sectors. The principal place of business is located in Muscat.
This set of financial statements for the year ended 31 December 2015 comprise the Parent Company and its Subsidiaries (together referred to as the “Group”) and the details of the subsidiaries are disclosed in note 13. The consolidated financial statements of the Group and the stand-alone financials statements of the Parent Company together referred as “the financial statements”.
2 Summary of significant accounting policies2.1 Basis of preparation and statement of compliance
These financial statements are prepared on the historical cost basis, as modified by the revaluation of derivative financial instruments at fair value through statement of comprehensive income.
These financial statements are prepared in accordance with International Financial Reporting Standards (IFRS), the requirements of the Commercial Companies Law of the Sultanate of Oman, 1974 (as amended) and comply with the disclosure requirements set out in the ‘Rules and Guidelines on Disclosure by issuer of Securities and Insider Trading’ issued by the Capital Market Authority (CMA) of the Sultanate of Oman.
2.2 Going concern At 31 December 2015, the Group has accumulated losses of RO 7,278,337 and as of that date the Group’s current liabilities exceeded its current assets by RO 7,643,893 (2014 : RO 623,416). The Board of Directors believe that the Group and the Parent Company will be able to continue as a going concern with the continuing support of its shareholders and financial institutions and successful implementation of its business plan to improve its operations. Therefore, these financial statements do not include any adjustment relating to the recoverability and classification of recorded assets amounts and classification of liabilities that might be necessary should the Group and the Parent Company be unable to continue as a going concern.
The Management is working under the guidance of the Board of Directors to improve the operations and the financial performance of the Group.
RestructuringSignificant changes led by the new Chief Executive Officer are underway to restructure the Group to improve asset / manpower utilization and to reduce costs, which can be expected to make it lean and efficient for the future challenges.
A complete restructuring plan is being worked out and being implemented. This will focus on improved bidding, contract execution, change / variation and claims management, equity enhancement and financial accounting.
Recovery of additional contract costsAll efforts are being made to seek confirmation for reimbursement and recovery of additional costs incurred as a result of the changes/acts/omissions of its clients/ subcontractors / suppliers, including involvement of third party/legal dispute resolution process as appropriate.
Vacant land saleThe Parent Company is expected to enter into a sale and purchase agreement for the vacant land at Ghala at a price of RO 3.2 million subject to approval in Annual General Meeting. This will give the Parent Company a cash inflow of RO 3.2 million, resulting in a one-time non-operational profit of RO 2.9 million in Q2 - 2016.

25
NOTES TO THE CONSOLIDATED AND PARENT COMPANY FINANCIAL STATEMENTS FOR THE YEAR ENDED 31 DECEMBER 2015 (continued)
Future business outlook
The Group has an order book of RO 94 million on hand to execute with Petroleum Development of Oman (PDO) and the international prestigious clients.
The Group is prequalified to bid for many projects in Oman and UAE and the future market size is significant . This brings value as the ‘Prequalification’ is a function of time and experience.
There are many other projects under active bidding e.g. the power projects in PDO, ORPIC, Liwa Plastics and Duqm refinery in the near future ,where the Group has a very good potential to win work.
The Business Plan based on future upcoming projects, where the Group is prequalified to bid, competitive position and past experience, indicates a positive future outlook.
Capitalisation and partnering
The order book position, Group’s prequalification’s certifications and registrations with clients, have significant value embedded.
In order to realize its potential and support growth options to increase equity capital, including through value added partners, is also being explored both in Oman and UAE subsidiaries.
This can be expected to strengthen the financial position and give further confidence to all stakeholders.
2.3 Adoption of new and revised International Financial Reporting Standards (IFRS)
New and revised IFRSs applied with no material effect on the combined financial statements
The following new and revised IFRSs, which became effective for annual periods beginning on or after 1 January 2015, have been adopted in these financial statements. The application of these revised IFRSs has not had any material impact on the amounts reported for the current and prior years but may affect the accounting for future transactions or arrangements.
· Annual Improvements to IFRSs 2010 - 2012 Cycle that includes amendments to IFRS 2, IFRS 3, IFRS 8, IFRS 13, IAS 16, IAS 24 and IAS 38.
· Annual Improvements to IFRSs 2011 - 2013 Cycle that includes amendments to IFRS 1, IFRS 3, IFRS 13 and IAS 40.
· Amendments to IAS 19 Employee Benefits to clarify the requirements that relate to how contributions from employees or third parties that are linked to service should be attributed to periods of service.
New and revised IFRS in issue but not yet effective
The Group has not yet applied the following new and revised IFRSs that have been issued but are not yet effective:
New and revised IFRSsEffective for annual periods beginning on or after
IFRS 14 Regulatory Deferral Accounts 1 January 2016Amendments to IAS 1 Presentation of Financial Statements relating to Disclosure initiative 1 January 2016
Amendments to IFRS 11 Joint arrangements relating to accounting for acquisitions of interests in joint operations 1 January 2016
Amendments to IAS 16 Property, Plant and Equipment and IAS 38 Intangible Assets relating to clarification of acceptable methods of depreciation and amortisation
1 January 2016
2 Summary of significant accounting policies (continued)

26
NOTES TO THE CONSOLIDATED AND PARENT COMPANY FINANCIAL STATEMENTS FOR THE YEAR ENDED 31 DECEMBER 2015 (continued)2 Summary of significant accounting policies (continued)
2.3 Adoption of new and revised International Financial Reporting Standards (IFRS) (continued)
Amendments to IAS 16 Property, Plant and Equipment and IAS 41 Agriculture relating to bearer plants 1 January 2016
Amendments to IAS 27 Separate Financial Statements relating to accounting investments in subsidiaries, joint ventures and associates to be optionally accounted for using the equity method in separate financial statements
1 January 2016
Amendments to IFRS 10 Consolidated Financial Statements, IFRS 12 Disclosure of Interests in Other Entities and IAS 28 Investment in Associates and Joint Ventures relating to applying the consolidation exception for investment entities
1 January 2016
Annual Improvements to IFRSs 2012 - 2014 Cycle covering amendments to IFRS 5, IFRS 7, IAS 19 and IAS 34 1 January 2016
IFRS 9 Financial Instruments (revised versions in 2009, 2010, 2013 and 2014)IFRS 9 issued in November 2009 introduced new requirements for the classification and measurement of financial assets. IFRS 9 was subsequently amended in October 2010 to include requirements for the classification and measurement of financial liabilities and for derecognition, and in November 2013 to include the new requirements for general hedge accounting. Another revised version of IFRS 9 was issued in July 2014 mainly to include a) impairment requirements for financial assets and b) limited amendments to the classification and measurement requirements by introducing a ‘fair value through other comprehensive income’ (FVTOCI) measurement category for certain simple debt instruments.A finalised version of IFRS 9 which contains accounting requirements for financial instruments, replacing IAS 39 Financial Instruments: Recognition and Measurement. The standard contains requirements in the following areas:
· Classification andmeasurement: Financial assets are classified by reference to the business model within which they are held and their contractual cash flow characteristics. The 2014 version of IFRS 9 introduces a ‘fair value through other comprehensive income’ category for certain debt instruments. Financial liabilities are classified in a similar manner to under IAS 39, however there are differences in the requirements applying to the measurement of an entity’s own credit risk.
1 January 2018
· Impairment: The 2014 version of IFRS 9 introduces an ‘expected credit loss’ model for the measurement of the impairment of financial assets, so it is no longer necessary for a credit event to have occurred before a credit loss is recognised
· Hedge accounting: Introduces a new hedge accounting model that is designed to be more closely aligned with how entities undertake risk management activities when hedging financial and non-financial risk exposures.
· Derecognition: The requirements for the derecognition of financial assets and liabilities are carried forward from IAS 39.
Amendments to IFRS 7 Financial Instruments: Disclosures relating to disclosures about the initial application of IFRS 9
When IFRS 9 is first applied
27
IFRS 7 Financial Instruments: Disclosures relating to the additional hedge accounting disclosures (and consequential amendments) resulting from the introduction of the hedge accounting chapter in IFRS 9
When IFRS 9 is first applied
IFRS 15 Revenue from Contracts with Customers
In May 2014, IFRS 15 was issued which established a single comprehensive model for entities to use in accounting for revenue arising from contracts with customers. IFRS 15 will supersede the current revenue recognition guidance including IAS 18 Revenue, IAS 11 Construction Contracts and the related interpretations when it becomes effective.
The core principle of IFRS 15 is that an entity should recognize revenue to depict the transfer of promised goods or services to customers in an amount that reflects the consideration to which the entity expects to be entitled in exchange for those goods or services. Specifically, the standard introduces a 5-step approach to revenue recognition:· Step 1: Identify the contract(s) with a customer.· Step 2: Identify the performance obligations in the contract.· Step 3: Determine the transaction price.· Step 4: Allocate the transaction price to the performance
obligations in the contract.· Step 5: Recognise revenue when (or as) the entity satisfies a
performance obligation.
Under IFRS 15, an entity recognises when (or as) a performance obligation is satisfied, i.e. when ‘control’ of the goods or services underlying the particular performance obligation is transferred to the customer. Far more prescriptive guidance has been added in IFRS 15 to deal with specific scenarios. Furthermore, extensive disclosures are required by IFRS 15.
1 January 2018
IFRS 16 Leases
IFRS 16 specifies how an IFRS reporter will recognise, measure, present and disclose leases. The standard provides a single lessee accounting model, requiring lessees to recognise assets and liabilities for all leases unless the lease term is 12 months or less or the underlying asset has a low value. Lessors continue to classify leases as operating or finance, with IFRS 16’s approach to lessor accounting substantially unchanged from its predecessor, IAS 17.
1 January 2019
Amendments to IFRS 10 Consolidated Financial Statements and IAS 28 Investments in Associates and Joint Ventures (2011) relating to the treatment of the sale or contribution of assets from and investor to its associate or joint venture
Effective date deferred indefinitely
2 Summary of significant accounting policies (continued)2.3 Adoption of new and revised International Financial Reporting Standards (IFRS) (continued)
New and revised IFRS in issue but not yet effective (continued)
NOTES TO THE CONSOLIDATED AND PARENT COMPANY FINANCIAL STATEMENTS FOR THE YEAR ENDED 31 DECEMBER 2015 (continued)

28
2 Summary of significant accounting policies (continued)2.3 Adoption of new and revised International Financial Reporting Standards (IFRS) (continued)
New and revised IFRS in issue but not yet effective (continued)
Management anticipates that these new and revised standards, interpretations and amendments will be adopted in the Group financial statements for the year beginning 1 January 2016 or as and when they are applicable and adoption of these new standards, interpretations and amendments, except for IFRS 9, IFRS 15 and IFRS 16, may have no material impact on the financial statements of the Company in the period of initial application.
Management anticipates that IFRS 15 and IFRS 9 will be adopted in the Group financial statements for the annual year beginning 1 January 2018 and IFRS 16 in the year 1 January 2019. The application of IFRS 15, IFRS 9 and IFRS 16 may have significant impact on amounts reported and disclosures made in the Group financial statements in respect of revenue from contracts with customers the Group financial assets and financial liabilities and leasehold assets and related liabilities. However, it is not practicable to provide a reasonable estimate of effects of the application of these standards until the Group performs a detailed review.
2.4 Consolidation
(a) Subsidiaries
Subsidiaries are all entities (including special purpose entities) over which the Group has the power to govern the financial and operating policies generally accompanying a shareholding of more than one half of the voting rights. The existence and effect of potential voting rights that are currently exercisable or convertible are considered when assessing whether the Group controls another entity. Subsidiaries are fully consolidated from the date on which control is transferred to the Group. They are de-consolidated from the date that control ceases.
The purchase method of accounting is used to account for the acquisition of subsidiaries by the Group. The cost of an acquisition is measured as the fair value of the assets given, equity instruments issued and liabilities incurred or assumed at the date of exchange, plus costs directly attributable to the acquisition. Identifiable assets acquired and liabilities and contingent liabilities assumed in a business combination are measured initially at their fair values at the acquisition date, irrespective of the extent of any minority interest. The excess of the cost of acquisition over the fair value of the Group’s share of the identifiable net assets acquired is recorded as goodwill.
Inter-company transactions, balances and unrealised gains on transactions between Group companies are eliminated. Unrealised losses are also eliminated. Accounting policies of subsidiaries are consistent with the policies adopted by the Group.
(b) Joint venture
A joint venture is a contractual arrangement whereby two or more parties undertake an economic activity which is subject to joint control. The Group’s investment in joint venture is reported using the proportionate consolidation method. The Group’s share of the joint venture’s assets and liabilities are classified according to the nature of the assets. The Group accounts for its share of the joint venture’s income and expenses and these are reported in the statement of comprehensive income.
2.5 Revenue
Where the outcome of a construction contract can be estimated reliably, revenue and costs are recognised by reference to the stage of completion of the construction activity at the end of the reporting period, as measured by the proportion that contract costs incurred for work performed to date bear to the estimated total contract costs. Variation in contract work and incentive payments are included to the extent that they have been agreed with the customer. Variations to contract and claims which are not yet formally certified by the client are also included to the extent that management believes that such amounts are recoverable from the customer based on the past and present experience of dealing with the customer.
NOTES TO THE CONSOLIDATED AND PARENT COMPANY FINANCIAL STATEMENTS FOR THE YEAR ENDED 31 DECEMBER 2015 (continued)

29
Where the outcome of a construction contract cannot be estimated reliably, contract revenue is recognised to the extent of contract costs incurred that it is probable will be recoverable. Contract costs are recognised as expenses in the period in which they are incurred.
When it is probable that total contract costs will exceed total contract revenue, the expected loss is recognised as an expense immediately.
2.6 Foreign currency
(a) Functional and presentation currency
Items included in the financial statements of the Group are measured and presented in Rial Omani being the currency of the primary economic environment in which the entity operates.
(b) Transactions and balances
Foreign currency transactions are translated into Rial Omani at the exchange rate prevailing on the transaction date. Foreign currency assets and liabilities are translated into Rial Omani at the exchange rate prevailing at the reporting date. Differences on exchange are dealt with in the consolidated statement of comprehensive income.
Translation differences on non-monetary financial assets and liabilities such as equities held at fair value through profit or loss are recognised in the consolidated statement of comprehensive income as part of the fair value gain or loss. Translation differences on non-monetary financial assets such as equities classified as available-for-sale are included in the fair value reserve in consolidated statement of comprehensive income. At the reporting date, the Group did not have any investments in such instruments.
(c) Group companies
The accounting records of the subsidiaries are maintained in UAE Dirhams (AED). The Rial Omani (RO) amounts included in the consolidated financial statements have been translated at an exchange rate of 0.105 Omani Rial to each AED for the statement of comprehensive income and the statement of financial position items, as the AED to RO exchange rate has effectively remained fixed during the year, both currencies being pegged to the US Dollar.
2.7 Income tax
Income tax on the profit or loss for the year comprises current and deferred tax.
Current tax is recognised in the consolidated statement of comprehensive income and is the expected tax payable on the taxable income for the year, using tax rates enacted or substantially enacted at the reporting date, and any adjustment to tax payable in respect of previous years.
Deferred tax is calculated using the liability method, providing for temporary differences between the carrying amounts of assets and liabilities for financial reporting purposes and the amounts used for taxation purposes. Temporary differences relating to the initial recognition of assets or liabilities that affect neither accounting nor taxable profit are not provided for. The amount of deferred tax provided is based on the expected manner of realisation or settlement of the carrying amount of assets and liabilities, using tax rates enacted or substantially enacted at the reporting date.
A deferred tax asset is recognised only to the extent that it is probable that future taxable profits will be available against which the asset can be utilised and is subsequently reduced to the extent that it is no longer probable that the related tax benefit will be realised.
The principal temporary differences arise from depreciation on property and equipment, provision for doubtful debts and provision for slow moving inventories.
2 Summary of significant accounting policies (continued)2.5 Revenue (continued)
NOTES TO THE CONSOLIDATED AND PARENT COMPANY FINANCIAL STATEMENTS FOR THE YEAR ENDED 31 DECEMBER 2015 (continued)

30
2 Summary of significant accounting policies (continued)
2.8 Property and equipment
Property and equipment are stated at historical cost less accumulated depreciation. The cost of property and equipment is their purchase price together with any incidental expenses that are directly attributable to the acquisition of the item. Subsequent costs are included in the asset’s carrying amount or recognised as a separate asset, as appropriate, only when it is probable that future economic benefits associated with the item will flow to the establishment and the cost of the item can be measured reliably. All other repairs and maintenance are charged to the statement of comprehensive income during the financial year in which they are incurred.
Depreciation is charged to the statement of comprehensive income on a straight-line basis over the estimated useful lives of items of property and equipment. The estimated useful lives are:
Buildings and camp 5- 20 yearsMachinery and equipment 5 - 10 yearsVehicles 5 - 10 yearsFurniture, fixtures and office equipment 3 - 8 years Instrumentation and testing equipment 4 - 8 years
Freehold land is not depreciated as it is deemed to have an indefinite life.
The assets’ residual values and useful lives are reviewed and adjusted, if appropriate, at each reporting date.
Where the carrying amount of an asset is greater than its estimated recoverable amount it is written down immediately to its recoverable amount.
Gains and losses on disposals of property and equipment are determined by reference to their carrying amounts and are taken into account in determining operating profit.
Interest costs on borrowings to finance the construction of property and equipment are capitalised during the period that is required to complete the asset.
2.9 Operating lease
Leases in which a significant portion of the risks and rewards of ownership are retained by the lessor are classified as operating lease. Payments made under operating lease are recognised in the statement of comprehensive income under general and administration expenses on a straight line basis over the term of the lease.
2.10 Goodwill
Goodwill arising on acquisition of the business represents the excess of purchase consideration over the fair value ascribed to the net assets at the date of acquisition. Goodwill is tested annually for impairment and carried at cost less accumulated impairment losses.
2.11 Investment in subsidiary (at the Parent Company level)
Classification
A company is a subsidiary company, if Al Hassan Engineering Company SAOG has the power to govern the financial and operating policies generally accompanying a shareholding of more than one half of the voting rights so as to obtain benefits from the investee company’s activities.
Valuation
Investment in subsidiary companies is stated at cost less any diminution in the value of the specific investment, which is other than temporary. Investment income is accounted for in the year in which entitlement is established.
NOTES TO THE CONSOLIDATED AND PARENT COMPANY FINANCIAL STATEMENTS FOR THE YEAR ENDED 31 DECEMBER 2015 (continued)
31
2.12 Impairment
Financial assets
At the end of each reporting period, the management assesses if there is any objective evidence indicating impairment of the carrying value of financial assets or non-collectability of receivables. Impairment losses are determined as differences between the carrying amounts and the recoverable amounts and are recognised in the statement of comprehensive income. The recoverable amounts represent the present value of expected future cash flows discounted at the original effective interest rate. Cash flows relating to short-term receivables are not discounted.
Non-financial assets
At the end of each reporting period, the management assesses if there is any indication of impairment of non-financial assets. If an indication exists, the management estimates the recoverable amount of the asset and recognises an impairment loss in the statement of comprehensive income. The management also assesses if there is any indication that an impairment loss recognised in prior years no longer exists or has reduced. The resultant impairment loss or reversals (except in case of goodwill) are recognised immediately in the statement of comprehensive income. The recoverable amount adopted is the higher of net realisable value or market value and its value in use.
2.13 Inventories
Inventories of materials are stated at the lower of cost or net realisable value. Cost is determined on a weighted average basis and consists of the direct landed cost of materials. Net realisable value is the price at which inventories can be sold in the normal course of business after allowing for the costs of realisation. Provision is made where necessary for obsolete, slow moving and defective items. The liability for the goods in transit is recorded on the transfer of risks and rewards to the ownership of goods in favour of the Group.
2.14 Financial assets
The Group classifies its financial assets as loans and receivables. The classification depends on the purpose for which the financial assets were acquired. Management determines the classification of its financial assets at initial recognition.
Loans and receivables
Loans and receivables are non-derivative financial assets with fixed or determinable payments that are not quoted in an active market. They are included in current assets, except for maturities greater than 12 months after the reporting date. These are classified as non-current assets. The Group’s loans and receivables comprise contract and other receivables and cash and cash equivalents in the statement of financial position (notes 2.15 and 2.16).
[For derivative financial instruments, please refer to note 2.21].
2.15 Contract and other receivables
Contract and other receivables originated by the Group are measured at cost. An allowance for credit losses of contract and other receivables is established when there is objective evidence that the Group will not be able to collect the amounts due.
Unbilled contract receivables on long term contracts is stated at the costs incurred and applicable on contracts to the end of the reporting period plus attributable profits estimated to be earned to the end of the reporting period based on the stage of contract completion, less provision for foreseeable losses and progress payments received and receivable. Cost comprises materials, labour, procurement and other expenses which are identifiable to contracts and allocation of other overheads.
2 Summary of significant accounting policies (continued)
NOTES TO THE CONSOLIDATED AND PARENT COMPANY FINANCIAL STATEMENTS FOR THE YEAR ENDED 31 DECEMBER 2015 (continued)

32
2 Summary of significant accounting policies (continued)2.15 Contract and other receivables (continued)
When a contract or other receivable is uncollectible, it is written off against the allowance account for credit losses. The carrying values of contract and other receivables approximate to their fair values due to the short-term nature of those receivables.
2.16 Cash and cash equivalentsCash and cash equivalents comprise of bank balances and cash net of bank borrowings. Bank borrowings that are repayable on demand and form an integral part of the Group’s and Parent Company’s cash management are included as a component of cash and cash equivalents for the purpose of the statement of cash flows.
2.17 End of service benefit and leave entitlements
End of service benefits are accrued in accordance with the terms of employment of the Group’s employees at the reporting date, having regard to the requirements of the Oman Labour Law 2003 as amended for the parent company, the UAE labour law as applicable to the subsidiaries and in accordance with IAS 19 ‘Employee Benefits’. Employee entitlements to annual leave and leave passage are recognised when they accrue to employees and an accrual is made for the estimated liability arising as a result of services rendered by employees up to the reporting date. These accruals are included in current liabilities, while that relating to end of service benefits is disclosed as a non-current liability.
Contributions to a defined contribution retirement plan and occupational hazard insurance for Omani employees in accordance with the Omani Social Insurances Law of 1991 are recognised as an expense in the consolidated statement of comprehensive income.
Provision is made for employees’ terminal benefits in the subsidiary companies on the basis prescribed under the UAE labour law based on employees’ salaries and number of years of service.
2.18 Trade and other payable
Trade and other payables are recognised initially at fair value and subsequently measured at amortised cost using the effective interest rate method.
The Group presents as a liability the gross amount due to customers for contract work for all contracts in progress for which progress billings exceed costs incurred plus recognised profits (less recognised losses). This liability is included within ‘Trade and other payables’ as ‘Excess billings’.
Liabilities are recognised for amounts to be paid for goods and services received, whether or not billed to the Group.
2.19 Borrowings
Borrowings are recognized initially at fair value, net of transaction costs incurred. Borrowings are classified as current liabilities unless the Group has an unconditional right to defer settlement of the liability for at least twelve months after the reporting date.
2.20 Operating segment
An operating segment is a component of the Group that engages in business activities from which it may earn revenues and incur expenses and whose operating results are regularly reviewed by the Board of Directors to make decisions about resources to be allocated to the segment and assess its performance. The Group has only one reportable segment that of contracting.
NOTES TO THE CONSOLIDATED AND PARENT COMPANY FINANCIAL STATEMENTS FOR THE YEAR ENDED 31 DECEMBER 2015 (continued)

33
2.21 Derivative financial instrumentsThe Group uses derivative financial instruments (forward foreign exchange contracts) to hedge its exposure to foreign currency fluctuations arising from commitments to purchase contract materials (asset hedges). If the derivative financial instruments qualify for special hedge accounting, they are accounted under hedge accounting principles. Otherwise they are accounted as trading instruments. All derivative financial instruments are recognised initially at cost. Subsequent to initial recognition, they are measured at fair value.Gains or losses arising on subsequent measurement of derivative financial instruments that are asset hedges are recognised in other comprehensive income and classified as a ‘hedging reserve’ in the statement of changes in equity, to the extent they are considered effective. Gains or losses arising on subsequent measurement of other derivative financial instruments are recognised in the statement of comprehensive income.
2.22 Directors’ remunerationThe Parent Company follows the Sultanate of Oman’s Commercial Companies Law, 1974 (as amended), and other latest relevant directives issued by CMA, in regard to determination of the amount to be paid as Directors remuneration. Directors’ remuneration is charged to the statement of comprehensive income in the year to which it relates.
2.23 Dividend distributionThe Board of Directors recommend to the shareholders the dividend to be paid out of Parent Company’s profits. The Directors take into account appropriate parameters including the requirements of the Sultanate of Oman’s Commercial Companies Law, 1974 (as amended) while recommending the dividend. Dividend distribution to the Parent Company’s shareholders is recognised as a liability in the Group’s and Parent Company’s financial statements only in the period in which the dividends are approved by the Parent Company’s shareholders.
3 Financial risk management
3.1 Financial risk factors
The Group’s activities expose it to a variety of financial risks: market risk (including currency risk, price risk and interest rate risk), credit risk and liquidity risk. The Group’s overall risk management program focuses on the unpredictability of financial markets and seeks to minimise potential adverse effects on the financial performance of the Group. Risk management is carried out by the management under policies approved by the Board of Directors.
(a) Market risk
(i) Foreign exchange riskForeign exchange risk arises when future commercial transactions or recognised assets or liabilities are denominated in a currency that is not the entity’s functional currency.The Group is exposed to foreign exchange risk arising from various currency exposures primarily with respect to US Dollar and Euros. Where it is considered appropriate, the Group uses forward contracts to minimise the impact of foreign currency fluctuations.The majority of the Group’s financial assets and financial liabilities are either denominated in local currency (Rial Omani) or currencies fixed against Rial Omani. Hence the management believes that there would not be a material impact on the profitability if these foreign currencies weaken or strengthen against the Omani Rial with all other variables held constant.
2 Summary of significant accounting policies (continued)
NOTES TO THE CONSOLIDATED AND PARENT COMPANY FINANCIAL STATEMENTS FOR THE YEAR ENDED 31 DECEMBER 2015 (continued)
34
3 Financial risk management (continued)3.1 Financial risk factors (continued)(a) Market risk (continued)(ii) Interest rate risk
Interest rate risk arises from the possibility of changes in interest rates and mismatches or gaps in the amount of assets and liabilities that mature or are re-priced in a given period.
Borrowings issued at variable rates expose the company to cash flow interest rate risk. Borrowings at a fixed rate expose the company to fair value interest rate risk. The Group is exposed to interest rate risk on its interest bearing assets and liabilities (bank balances, bank borrowings and term loans). The management manages the interest rate risk by constantly monitoring the changes in interest rates and availing lower interest bearing facilities.
At 31 December 2015, based on the level of interest bearing assets and liabilities, for a 0.5% change in the interest rate, the impact on the profit before taxation in the consolidated statement of comprehensive income will approximate to RO 239,245 (2014 - RO 155,562).
(b) Credit risk
Credit risk is the risk that one party to a financial instrument will fail to discharge an obligation and cause the other party to incur a financial loss.
Credit risk arises from cash and cash equivalents, call deposits with banks as well as credit exposure to contract customers including outstanding debtors and committed transactions.
In case of banks, management deals with local and foreign banks with a minimum rating of P2 and credit risk is considered minimal. The stated rating is as per the global bank ratings by Moody’s Investors Service.
Credit risk on contract receivables is limited to their carrying values as the management regularly reviews these balances to assess recoverability and makes provision for balances whose recoverability is in doubt. The maximum exposure to credit risk is represented by the carrying amount of each financial asset in the statement of financial position. The Group has a significant concentration of credit risk, details of which are provided in note 16 (d) to the financial statements.
Although 90% (2014 - 88%) of the Group’s contract income is from 14 customers (2014 - 8 customers), the Group considers it is well positioned to carry out contracting work for other parties and that the business risk associated with concentration is manageable.
(c) Liquidity risk
Liquidity risk is the risk that the Group will not be able to meet its financial obligations as they fall due. The Group approach to managing liquidity is to ensure, as far as possible, that it will have sufficient liquidity to meet its liabilities when due, under both normal and stressed conditions, without incurring unacceptable losses or risking damage to the company’s reputation.
The Group maintains sufficient facilities and bank balances and cash to meet the Group’s obligations as they fall due for payment.
The table below analyses the Group’s financial liabilities that will be settled on a net basis into relevant maturity grouping based on the remaining period at the reporting date to the contractual maturities date. The amounts disclosed in the table are the contractual undiscounted cash flows. Balances due within 12 months equal their carrying balances, as the impact of discounting is not significant. Balances due above twelve months also approximate to their carrying values as they carry commercial rates of interest.
NOTES TO THE CONSOLIDATED AND PARENT COMPANY FINANCIAL STATEMENTS FOR THE YEAR ENDED 31 DECEMBER 2015 (continued)
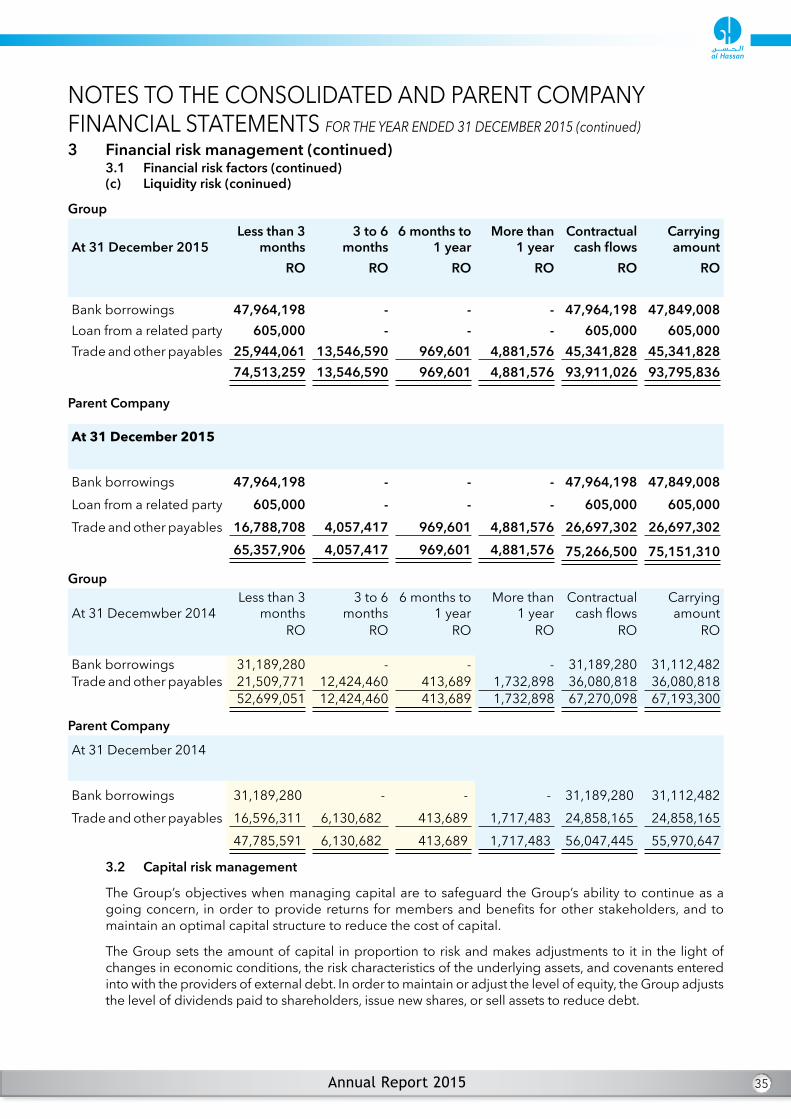
35
Group
At 31 December 2015Less than 3
months3 to 6
months6 months to
1 yearMore than
1 yearContractual
cash flowsCarrying amount
RO RO RO RO RO RO
Bank borrowings 47,964,198 - - - 47,964,198 47,849,008Loan from a related party 605,000 - - - 605,000 605,000Trade and other payables 25,944,061 13,546,590 969,601 4,881,576 45,341,828 45,341,828
74,513,259 13,546,590 969,601 4,881,576 93,911,026 93,795,836
Parent Company
At31December2015
Bank borrowings 47,964,198 - - - 47,964,198 47,849,008Loan from a related party 605,000 - - - 605,000 605,000Trade and other payables 16,788,708 4,057,417 969,601 4,881,576 26,697,302 26,697,302
65,357,906 4,057,417 969,601 4,881,576 75,266,500 75,151,310
Group
At 31 Decemwber 2014Less than 3
months3 to 6
months6 months to
1 yearMore than
1 yearContractual
cash flowsCarrying amount
RO RO RO RO RO RO
Bank borrowings 31,189,280 - - - 31,189,280 31,112,482Trade and other payables 21,509,771 12,424,460 413,689 1,732,898 36,080,818 36,080,818
52,699,051 12,424,460 413,689 1,732,898 67,270,098 67,193,300
Parent Company
At 31 December 2014
Bank borrowings 31,189,280 - - - 31,189,280 31,112,482Trade and other payables 16,596,311 6,130,682 413,689 1,717,483 24,858,165 24,858,165
47,785,591 6,130,682 413,689 1,717,483 56,047,445 55,970,647
3.2 Capital risk management
The Group’s objectives when managing capital are to safeguard the Group’s ability to continue as a going concern, in order to provide returns for members and benefits for other stakeholders, and to maintain an optimal capital structure to reduce the cost of capital.
The Group sets the amount of capital in proportion to risk and makes adjustments to it in the light of changes in economic conditions, the risk characteristics of the underlying assets, and covenants entered into with the providers of external debt. In order to maintain or adjust the level of equity, the Group adjusts the level of dividends paid to shareholders, issue new shares, or sell assets to reduce debt.
3 Financial risk management (continued)3.1 Financial risk factors (continued)(c) Liquidity risk (coninued)
NOTES TO THE CONSOLIDATED AND PARENT COMPANY FINANCIAL STATEMENTS FOR THE YEAR ENDED 31 DECEMBER 2015 (continued)

36
3 Financial risk management (continued)3.2 Capital risk management (continued)
The Group also ensures compliance with externally imposed capital requirements.
In the context of managing capital (equity), the Parent Company has covenanted with banks providing external debt to maintain specified debt to equity ratio. At the end of the reporting period, the actual debt to equity ratio was within the covenanted level, and the Parent Company does not therefore, anticipate that the covenant will require them to increase the level of capital (equity).
3.3 Fair value estimation
The carrying amounts of financial assets and liabilities with a maturity of less than one year are assumed to approximate to their fair values. The fair value of the long term loan approximate to its carrying values as it carries a commercial rate of interest.
4 Critical accounting estimatesThe preparation of the financial statements, as per IFRS, requires management to make estimates and assumptions that affect the reported amount of assets and liabilities at the reporting date and the resultant provisions and changes in fair value for the year. Such estimates are necessarily based on assumptions about several factors involving varying, and possibly significant, degrees of judgment and uncertainty and actual results may differ from management’s estimates resulting in future changes in estimated assets and liabilities.
Key sources of estimation uncertainty
The following are the key assumptions concerning the future, and other key sources of estimation uncertainty at the reporting date, that have a significant risk of causing a material adjustment to the carrying amounts of assets and liabilities within the next financial year.
(a) Goodwill and investment in subsidiaries
The Board of Directors test annually whether goodwill and investment in subsidiaries have suffered any impairment in accordance with IAS 36, ‘Impairment of Assets’ which require the use of estimates.
(b) Revenue recognition
The Group uses the percentage of completion method in recognising its project revenues. Use of this method requires the Group to estimate revenues and costs over the remaining period of the projects. These estimates will, by definition, be seldom equal to the actual results. However, the deviations are not anticipated to be of a material nature as the estimates are based on historical experience, progress to date on contracts and other factors, including expectations of future events that are believed to be reasonable under the circumstances, and are regularly evaluated. Claims totaling to RO 19.29 million (2014 – RO 8.4 million) which are not yet formally certified by the customer are included in the total contract value on open contracts at the reporting period and considered for revenue recognition, as management believes that such amounts are in the normal course of the business activity.
(c) Others
Other estimates that involve uncertainties and judgments which have significant effect on the financial statements include:· provision for slow moving inventories;· the margins of profit ultimately expected on long term contracts that is used to determine the
level of contract profit recognition; and· whether any liquidated damages will apply when there has been a delay in completion of
contracts and it is unsure as to which party is at fault. · depreciation is charged so as to write off the cost of assets over their estimated useful lives. The
calculation of useful lives is based on management’s assessment of various factors such as the operating cycles, the maintenance programs, and normal wear and tear using its best estimates.
NOTES TO THE CONSOLIDATED AND PARENT COMPANY FINANCIAL STATEMENTS FOR THE YEAR ENDED 31 DECEMBER 2015 (continued)

37
5 Contract costs
2015Group
2015Parent
Company2014
Group
2014Parent
CompanyRO RO RO RO
Materials 33,664,604 18,456,128 20,338,834 7,621,596Salaries and employee related costs (note 8) 27,024,466 20,441,325 19,605,433 13,404,166Sub-contract costs 16,777,641 13,718,002 12,073,911 7,456,665Depreciation 3,426,218 2,682,028 3,056,094 2,426,914Future estimated contract losses 87,239 - - -Other direct expenses 24,453,053 16,886,903 18,972,902 12,182,933
105,433,221 72,184,386 74,047,174 43,092,274
6 Other income Profit on disposal of equipment 61,453 52,897 60,383 47,783Hire of equipment 30,231 3,165 70,952 38,432Scrap sales 31,479 25,506 29,208 28,528Services 2,071 43,901 - -Miscellaneous 41,173 40,059 97,006 6,632
166,407 165,528 257,549 121,375
7 General and administration expenses
2015Group
2015Parent
Company
2014Group
2014Parent
CompanyRO RO RO RO
Salaries and employee related costs (note 8) 2,602,869 1,895,079 2,124,473 1,543,856Rent 207,580 196,168 210,787 195,752Depreciation 139,140 72,724 156,202 118,328Professional fees 46,044 26,688 117,359 59,883Advertisement and business promotion 71,124 34,145 90,171 61,336Communication 91,989 71,035 84,280 61,446Travelling and conveyance 20,834 16,775 40,199 28,727Insurance 38,604 20,901 35,419 13,660Utilities 26,173 12,944 25,930 9,487Contributions towards social causes 23,469 23,358 25,473 25,473Printing and stationery 32,526 20,595 24,071 17,032Directors’ sitting fees (note 25b) 23,925 23,925 23,550 23,550Vehicle fuel 17,379 14,273 20,732 9,958Allowance for credit losses (note 16a) (12,534) (12,534) 6,484 6,484Miscellaneous 225,329 132,184 256,353 155,630
3,554,451 2,548,260 3,241,483 2,330,602
NOTES TO THE CONSOLIDATED AND PARENT COMPANY FINANCIAL STATEMENTS FOR THE YEAR ENDED 31 DECEMBER 2015 (continued)

38
8 Salaries and employee related cost
2015Group
2015Parent
Company
2014Group
2014Parent
CompanyRO RO RO RO
Salaries and wages 18,544,881 14,234,229 13,516,755 9,377,429Staff allowances 5,881,115 3,845,891 3,742,503 2,432,549Air fare and leave salary 1,848,390 1,512,635 1,595,327 973,777Accommodation costs 611,294 603,168 950,340 602,570End of service benefits (note 21) 676,483 702,738 647,847 505,866Bonus and incentives 661,196 493,368 580,935 401,207Social security 1,218,477 797,423 501,744 498,397
Others 185,499 146,952 194,455 156,22729,627,335 22,336,404 21,729,906 14,948,022
Allocated as follows:Contract costs (note 5) 27,024,466 20,441,325 19,605,433 13,404,166General and administration expenses (note 7) 2,602,869 1,895,079 2,124,473 1,543,856
29,627,335 22,336,404 21,729,906 14,948,022
9 Finance charges – netInterest expense on:- short term borrowings 1,098,108 1,098,108 809,391 809,391- bank overdrafts 95,274 95,274 52,622 52,622
1,193,382 1,193,382 862,013 862,013Bank and finance charges 256,680 69,240 195,400 90,198Less: recovery from subsidiaries - (514,571) - (286,482)
1,450,062 748,051 1,057,413 665,729
10 Taxation(a) The taxation charge/ (credit) for the year is made up as follows
Current tax: for current year - - 83,016 - for prior years - - 49,348 49,348
- - 132,364 49,348Deferred tax: (note 22) for current year - - (300,162) (300,162) for prior years 230,841 230,841 (185,291) (185,291)
230,841 230,841 (485,453) (485,453)230,841 230,841 (353,089) (436,105)
NOTES TO THE CONSOLIDATED AND PARENT COMPANY FINANCIAL STATEMENTS FOR THE YEAR ENDED 31 DECEMBER 2015 (continued)

39
(b) The movement in the provision for current taxation during the year comprises:
2015Group
2015Parent
Company
2014Group
2014Parent
CompanyRO RO RO RO
At 1 January 83,012 - 18,700 106Charge for the year - - 83,016 -Reversal during the year - - (106) (106)Paid during the year (83,012) - (18,598) -At 31 December - - 83,012 -
(c) The tax rate applicable to the Parent Company is 12% (2014 - 12%). Provision for tax has been made on the accounting profit adjusted for tax purposes. The subsidiary companies operate in a jurisdiction which is not subject to taxation other than Al Hassan Technicas Reunidas Project LLC. The reconciliation of taxation on the accounting profit with the taxation charge for the year is as follows:
Group and Parent Company2015 2014
RO ROTax benefit on loss RO 4,547,396 (2014 - loss of RO 2,525,603) (545,687) (306,672)Taxeffectof:Deferred tax for prior years 230,841 (185,291)Disallowable expenses 2,803 3,309Prior year current tax - 49,348Others 81,202 86,217
230,841 (353,089)
No provision for tax has been made during the year for income tax expense due to loss for the year.
(d) Taxation has been agreed with the Oman Taxation Authorities for all years up to 31 December 2013. The management believes that additional taxes, if any, that may become payable on finalisation of the assessments in respect of open years would not be material to the Groups financial position as at 31 December 2015.
11 (a) Property and equipment
(i) Details of the movement in property and equipment are set out on pages 52 to 53.
(ii) The depreciation charge for the year has been allocated as follows:
2015Group
2015Parent
Company
2014Group
2014Parent
CompanyRO RO RO RO
Contract costs (note 5) 3,426,218 2,682,028 3,056,094 2,426,914General and administration expenses (note 7) 139,140 72,724 156,202 118,328
3,565,358 2,754,752 3,212,296 2,545,242
10 Taxation (continued)
NOTES TO THE CONSOLIDATED AND PARENT COMPANY FINANCIAL STATEMENTS FOR THE YEAR ENDED 31 DECEMBER 2015 (continued)

40
11 (b) Leasehold land A subsidiary company entered into two operating lease agreements in respect of the land used for
construction of an office building. As per the terms of the lease agreements, the subsidiary has paid an up-front advance amounting to RO 840,000 [2014 – RO 840,000 (AED 8,000,000)]. The lease is valid until the year 2037. The up-front fee paid will be amortised on a straight line basis over the period of the lease.
2015 Group
2014 Group
RO ROCosts 840,000 840,000Accumulated amortisation (124,448) (93,336)
715,552 746,664
11 (c) Assets held-for-saleIn a meeting held on 6 October 2015, the Board of Directors decided to sell a plot of land in Ghala and management has started receiving offers from the third party buyers to purchase this asset. At the reporting date, the asset is classified as held-for-sale and recorded at lower of its carrying value and fair value.
12 GoodwillThe recoverable amount of the Group’s construction and engineering operations has been determined based on a value in use calculation which uses cash flow projections based on financial budgets approved by the directors covering a five-year period, and a discount rate at 9% per annum. Cash flow beyond that five years period have been extrapolated using a steady 3% per annum growth rate. This growth rate does not exceed the long-term average growth rate for the construction market in the Sultanate of Oman. The directors believe that any reasonably possible further change in the key assumptions on which recoverable amount is based would not cause the construction operations carrying amount to exceed its recoverable amount.
13 Investments in subsidiaries
Parent Company
Holding ActivityYear of
incorporation 2015 2014RO RO
Al Hassan Engineering Company Dubai LLC 99%
Contracting in oil and gas 2001 103,950 103,950
Al Hassan Engineering Company Abu Dhabi LLC 49%
Contracting in oil and gas 2003 51,450 51,450
Al Hassan Technicas Reunidas Project LLC 95%
Contracting in oil and gas 2013 142,500 142,500
297,900 297,900(a) Investments in subsidiaries have been set off against the share capital and reserves of the subsidiaries
in the consolidated financial statements.
(b) 51% (2014 - 51%) ownership of the Al Hassan Engineering Company Abu Dhabi LLC subsidiary and 1% (2014 – 1%) ownership of the Al Hassan Engineering Company Dubai LLC subsidiary are held in the personal names of certain individuals as nominees for the beneficial interest of the Group. The title to assets and liabilities of these subsidiaries to that extent, are legally held by such nominees. The Parent Company holds 100% beneficial ownership and exercises control over these subsidiaries. Accordingly, these subsidiaries are considered to be entirely owned by the Parent Company. 5% (2014- 5%) ownership of the Al Hassan Technicas Reunidas Project LLC subsidiary is held with Technicas Reunidas S.A.
(c) The Board of Directors of the Parent Company consider that no impairment has arisen during the years 2015 and 2014 as the subsidiaries have positive net worth or orders on hand at the reporting date that will generate future cash flows and no specific indicators for impairment were identified.
NOTES TO THE CONSOLIDATED AND PARENT COMPANY FINANCIAL STATEMENTS FOR THE YEAR ENDED 31 DECEMBER 2015 (continued)

41
14 Inventories
2015Group
2015Parent
Company2014
Group
2014Parent
CompanyRO RO RO RO
Materials 3,815,920 3,585,706 3,501,332 3,052,357Spare parts and consumables 105,156 105,156 128,059 128,058Tools 2,166,954 1,380,452 1,016,321 938,569
6,088,030 5,071,314 4,645,712 4,118,984Less: allowance for slow / non-moving inventories (1,183,928) (1,183,928) (1,295,558) (1,295,558)
4,904,102 3,887,386 3,350,154 2,823,426
The movement in the allowance for inventories is given below:
Group and Parent Company2015 2014
RO ROAt 1 January 1,295,558 1,266,488(Written back) / provided during the year (31,340) 51,725Written off during the year (80,290) (22,655)At 31 December 1,183,928 1,295,558
15 Financial instruments by category
(a) The accounting policies for financial instruments have been applied to the line items below:
Group Loans and receivables2015 2014
RO ROAssets as per statement of financial positionLoans and advances:Contract and other receivables (excluding unbilled contract receivables, advances to suppliers and prepayments) 18,178,384 19,795,029Bank and cash 2,215,290 2,367,758
20,393,674 22,162,787
Other financial liabilities2015 2014
RO ROLiabilities as per statement of financial positionLiabilities measured at amortised cost:Short term borrowings 48,454,008 31,112,482Trade and other payables (excluding excess billings and advance from customers) 45,341,828 36,080,818
93,795,836 67,193,300
NOTES TO THE CONSOLIDATED AND PARENT COMPANY FINANCIAL STATEMENTS FOR THE YEAR ENDED 31 DECEMBER 2015 (continued)
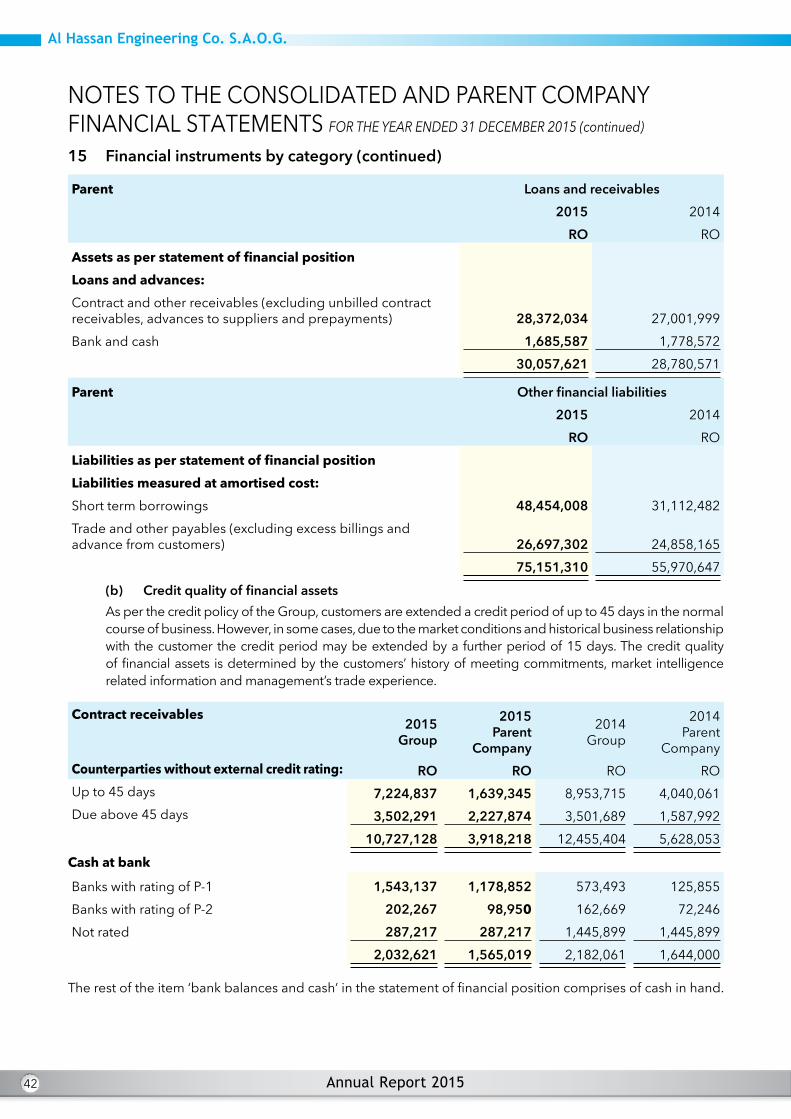
42
Parent Loans and receivables2015 2014
RO ROAssetsasperstatementoffinancialpositionLoansandadvances:Contract and other receivables (excluding unbilled contract receivables, advances to suppliers and prepayments) 28,372,034 27,001,999Bank and cash 1,685,587 1,778,572
30,057,621 28,780,571
Parent Other financial liabilities2015 2014
RO ROLiabilitiesasperstatementoffinancialpositionLiabilitiesmeasuredatamortisedcost:Short term borrowings 48,454,008 31,112,482Trade and other payables (excluding excess billings and advance from customers) 26,697,302 24,858,165
75,151,310 55,970,647(b) Credit quality of financial assets As per the credit policy of the Group, customers are extended a credit period of up to 45 days in the normal course of business. However, in some cases, due to the market conditions and historical business relationship with the customer the credit period may be extended by a further period of 15 days. The credit quality of financial assets is determined by the customers’ history of meeting commitments, market intelligence related information and management’s trade experience.
Contractreceivables2015
Group
2015Parent
Company
2014Group
2014Parent
CompanyCounterpartieswithoutexternalcreditrating: RO RO RO ROUp to 45 days 7,224,837 1,639,345 8,953,715 4,040,061Due above 45 days 3,502,291 2,227,874 3,501,689 1,587,992
10,727,128 3,918,218 12,455,404 5,628,053Cashatbank
Banks with rating of P-1 1,543,137 1,178,852 573,493 125,855Banks with rating of P-2 202,267 98,950 162,669 72,246Not rated 287,217 287,217 1,445,899 1,445,899
2,032,621 1,565,019 2,182,061 1,644,000
The rest of the item ʻbank balances and cash’ in the statement of financial position comprises of cash in hand.
15 Financial instruments by category (continued)
NOTES TO THE CONSOLIDATED AND PARENT COMPANY FINANCIAL STATEMENTS FOR THE YEAR ENDED 31 DECEMBER 2015 (continued)

43
16 Contract and other receivables
2015Group
2015Parent
Company2014
Group
2014Parent
CompanyRO RO RO RO
Contract receivables 10,727,128 3,918,218 12,455,404 5,628,053Unbilled contract receivables 61,086,375 41,590,614 42,448,017 27,867,299Advances to suppliers 3,156,034 1,003,265 6,153,650 5,021,300Prepayments and other receivables 4,107,243 1,279,044 2,902,642 1,080,201Less: allowance for credit losses (1,027,654) (690,862) (672,040) (672,040)
78,049,126 47,100,279 63,287,673 38,924,813Retentions receivable 7,578,482 6,058,283 7,614,232 6,115,976Due from subsidiaries (note 25d) - 18,204,904 - 15,555,540Due from related parties (note 25d) 900,428 881,489 397,433 374,470
86,528,036 72,244,955 71,299,338 60,970,799Less: non-current portion of retentions receivable (497,317) - (777,042) -
86,030,719 72,244,955 70,522,296 60,970,799
(a) The movement in allowance for credit losses is given below
2015Group
2015Parent
Company2014
Group
2014Parent
CompanyRO RO RO RO
At 1 January 672,040 672,040 365,159 365,159Provided / (written back) during the year:Revenue 368,148 31,356 79,687 79,687Contract costs - - 220,710 220,710General and administration expenses (note 7) (12,534) (12,534) 6,484 6,484
At31December 1,027,654 690,862 672,040 672,040
(b) Allowance for credit losses at the end of the reporting date is attributable to the following:
2015Group
2015Parent Company
2014Group
2014Parent Company
RO RO RO ROContract receivables 318,015 318,015 330,549 330,549Unbilled contract receivables 673,439 336,647 305,291 305,291Advances to suppliers 25,200 25,200 25,200 25,200Prepayments and other receivables 11,000 11,000 11,000 11,000
1,027,654 690,862 672,040 672,040
NOTES TO THE CONSOLIDATED AND PARENT COMPANY FINANCIAL STATEMENTS FOR THE YEAR ENDED 31 DECEMBER 2015 (continued)

44
(c) The unbilled contract receivables comprise:
Contracts in progress at cost plus estimated attributable profits 360,043,817 276,211,777 286,223,691 233,816,361
Less: progress billings (298,957,442) (234,621,163) (243,775,674) (205,949,062)
61,086,375 41,590,614 42,448,017 27,867,299
(d) At 31 December 2015, 14 customers (2014 - 8 customers) account for 90% (2014 - 88%) of the contract receivables.
(e) The Group’s and Parent Company’s entire contract receivables are unsecured (2014 - same terms).
(f) A significant portion of the Parent Company’s contract receivables are assigned to banks providing the short term loans and credit facilities referred to in note 23 to the financial statements.
(g) The Group’s contract receivables include RO 9,027,975 (2014 – RO 6,609,595) and the Parent Company’s contract receivables include RO 3,047,844 (2014 - RO 3,351,154) due in foreign currencies.
(h) The Group’s contract receivables amounting to RO 7,224,837 (2014 - RO 8,953,715) and Parent Company’s contract receivables amounting to RO 1,639,345 (2014 - RO 4,040,061) are neither past due nor impaired and are estimated as collectible based on historical experience.
(i) Allowance for credit losses has been established as per the Group’s provisioning policy.(j) At the reporting date, the Group’s and Parent Company’s following contract receivables are past due
but not impaired and are estimated as collectible based on historical experience:
Parent and Group Company2015 2014
RO RODebts due between 1.5 months - 6 months 1,391,205 2,260,508Debts due between 6 months - 1 year 1,617,853 684,021Debts due more than 1 year 175,218 226,611
3,184,276 3,171,140
(k) At the reporting date, contract receivables of the Group and the Parent Company amounting to RO 318,015 (2014 – 330,549) are impaired and fully provided for.
17 Bank balances and cash
2015Group
2015Parent
Company
2014Group
2014Parent
CompanyRO RO RO RO
Cash in hand 182,669 120,568 185,697 134,572Bank balances 2,032,621 1,565,019 2,182,061 1,644,000
2,215,290 1,685,587 2,367,758 1,778,572
16 Contract and other receivables (continued)
NOTES TO THE CONSOLIDATED AND PARENT COMPANY FINANCIAL STATEMENTS FOR THE YEAR ENDED 31 DECEMBER 2015 (continued)

45
18 Share capital(a) The share capital comprise of 100,000,000 shares (2014 - 100,000,000 shares) of RO 0.100 each (2014-
RO 0.100 each). The issued and fully paid up capital consists of 75,208,000 shares of RO 0.100 each (2014 - 75,208,000 shares of RO 0.100 each).
(b) Shareholders of the Parent Company who own 10% or more of the Parent Company’s shares, whether in their name or through a nominee account and the number of shares they hold are as follows;
2015 and 2014
Shareholder % holding Number ofshares held
Mr Hassan Ali Salman 20.07% 15,092,000
Mr Maqbool Ali Salman 20.07% 15,092,000
Al Hassan Electricals Company LLC 19.96% 15,008,000
19 Legal reserveIn accordance with Article 106 of the Commercial Companies Law of the Sultanate of Oman, 1974, as amended, and Company Law of United Arab Emirates, 10% of the net profit of the individual companies (parent and subsidiaries) has been transferred to a non-distributable legal reserve until the amount of the legal reserve becomes equal to one-third of the Parent Company’s issued share capital and one-half of the capital of the subsidiary companies.
20 Dividend
(a) No dividend has been proposed for 2015 (2014 - Nil).
(b) During the year, an amount of RO Nil (2014 - RO 622) representing unclaimed dividends for the year has been transferred to the Investor’s Trust Fund of the Capital Market Authority.
(c) During 2014 the dividend amount paid of RO 376,040 related to 2013.
21 End of service benefits
2015Group
2015Parent
Company2014
Group
2014Parent
CompanyRO RO RO RO
At 1 January 3,265,077 2,849,298 2,923,371 2,599,050Charge for the year (note 8) 676,483 702,738 647,847 505,866Transfer to subsidiaries / related party (460) (900) (4,052) (18,809)Expense recharged - 14,477 - 11,731Paid during the year (271,399) (231,721) (302,089) (248,540)At 31 December 3,669,701 3,333,892 3,265,077 2,849,298
NOTES TO THE CONSOLIDATED AND PARENT COMPANY FINANCIAL STATEMENTS FOR THE YEAR ENDED 31 DECEMBER 2015 (continued)

46
22 Deferred taxationThe net deferred tax liability in the statement of financial position and deferred tax (credit)/charge in the statement of comprehensive income are attributable to the following items:
2015 1 JanuaryGroup and
ParentCompany
Charge / (credit) to profit or loss
31 DecemberGroup and
Parent Company
RO RO RODeferredtaxliability:Accelerated tax depreciation 279,869 (68,101) 211,768Goodwill 105,360 - 105,360Deferredtaxasset:Provision for inventories (155,467) 94,544 (60,923)Allowance for credit losses (80,645) (2,258) (82,903)Tax loss carried forward (379,958) 206,656 (173,302)Net deferred tax liability/(asset) (230,841) 230,841 -
2014Deferred tax liability:Accelerated tax depreciation 345,050 (65,181) 279,869Goodwill 105,360 - 105,360Deferred tax asset:Provision for inventories (151,979) (3,488) (155,467)Allowance for credit losses (43,819) (36,826) (80,645)Tax loss carried forward - (379,958) (379,958)Net deferred tax liability / (asset) 254,612 (485,453) (230,841)
At 31 December 2015 no deferred tax asset on the excess of deductible temporary difference including (tax losses) over taxable temporary differences has been recognised in these financial statements due to uncertainty regarding the timing of availability of adequate future taxable profits.
23 Short term borrowings
Group and Parent Company2015 2014
RO ROShort term loans 45,428,168 29,650,000Unsecured loan from a related party 605,000 -Bank overdrafts 2,420,840 1,462,482
48,454,008 31,112,482
Short term loans and overdraft facilities have been obtained from commercial banks at average interest rates ranging from 2.5% to 3.75% (2014 - 2.5% to 2.75%) per annum. The interest rates are subject to change upon re-negotiation of the facilities which takes place on an annual basis in the case of overdrafts and at more frequent intervals in the case of short term loans. An amount of RO 39,718,879 of the Parent Company’s contract receivables are assigned to banks as a security against the short term loans.
NOTES TO THE CONSOLIDATED AND PARENT COMPANY FINANCIAL STATEMENTS FOR THE YEAR ENDED 31 DECEMBER 2015 (continued)

47
24 Trade and other payables
2015Group
2015Parent
Company2014
Group
2014Parent
Company
RO RO RO RO
Trade payables 16,275,816 10,826,985 6,498,050 4,431,982
Creditors for capital purchases 360,893 360,893 1,372,681 1,372,681
Due to related parties (note 25d) 1,368,889 1,342,400 1,493,505 1,466,264
Due subsidiaries (note 25d) - 531,649 - -
Accrued expenses 3,931,892 2,776,559 3,465,373 2,295,478
Accrued project expenses 21,054,811 8,720,145 19,938,843 12,087,270
Excess billings (see (c) below) 276,298 276,298 1,935,300 1,935,300
Advances from customersProvision for estimated contract losses
7,040,98887,239
3,313,597-
7,652,012-
4,823,534-
Other payables 2,262,288 2,138,671 3,312,366 3,204,490
52,659,114 30,287,197 45,668,130 31,616,999
(a) The Group’s accounts payable include RO 1,430,747 (2014 - RO 3,179,115) and the Parent Company’s accounts payable include RO 1,288,630 (2014 - RO 3,179,115) payable in foreign currencies.
(b) Other payables include a gain of RO 19,933 (2014 – loss of RO 346,917) which relates to a revision of forward currency contracts to fair values.
(c) The excess billings comprise of:
2015Group
2015Parent
Company2014
Group
2014Parent
CompanyRO RO RO RO
Progress billings 40,350,312 40,350,312 13,823,236 13,823,236Less: contracts in progress at cost plus estimated attributable profits (40,074,014) (40,074,014) (11,887,936) (11,887,936)
276,298 276,298 1,935,300 1,935,300
25 Related parties
The Group and the Parent Company have entered into transactions with entities and shareholders who have significant influence over the Group and also have holding of 10% or more interest in the Parent Company (“significant shareholders”). The Group and the Parent Company also entered into transactions with entities related to these significant shareholders and the Board of Directors at prices approved by the management and the Board of Directors.
(a) The details of related party transactions carried out during the year are as follows:
NOTES TO THE CONSOLIDATED AND PARENT COMPANY FINANCIAL STATEMENTS FOR THE YEAR ENDED 31 DECEMBER 2015 (continued)

48
2015Group
2015Parent
Company2014
Group
2014Parent
Company
RO RO RO RO
EntitiesrelatedtoDirectors
Contract costs (1,257,113) (1,257,113) (1,420,529) (1,420,529)
General and administration expense (36,300) (36,300) (179,040) (179,040)
Contract income 375,900 375,900 - -
Other income 2,071 2,071 14,244 14,244
Purchase of equipment (3,774) (3,774) - -
Unsecured loan (605,000) (605,000) - -
Subsidiarycompany
Recharge of interest - 514,571 - 284,871
Staff costs recharged - 502,524 - 371,773
Contract income - 2,036,894 - 5,583,118
Other income 41,830 - -
Purchase / sale of equipment / material - 24,565 - -
(b) The compensation to key management personnel for the year comprises:
2015Group and Parent
Company
2014Group and Parent
Company
RO RO
Short term employment benefits 378,460 332,117
End of service benefits 16,618 17,345
Directors’ sitting fees 23,925 23,550
419,003 373,012
(c) The Directors’ remuneration and meeting attendance fees are subject to shareholders’ approval at the Annual General Meeting.
(d) The amounts due from subsidiaries are repayable on demand and carry commercial rates of interest. The amount due to and from other related parties are interest free and pertain to the entities related to the Directors (note 16 and 24). During the year, the Parent Company has waived interest for the year in respect of amounts due from a subsidiary company, the balance of which at 31 December 2015 is RO 3.05 million (2014 - RO 4.10 million).
(e) The Parent Company has provided bank guarantees to the customers of the subsidiary companies amounting to RO 19,623,058 (2014 - RO 13,078,239) [note 29].
25 Related parties (continued)
NOTES TO THE CONSOLIDATED AND PARENT COMPANY FINANCIAL STATEMENTS FOR THE YEAR ENDED 31 DECEMBER 2015 (continued)

49
26 Net assets per share
Net assets per share are calculated by dividing the net assets at the end of the reporting period by the number of shares outstanding as follows:
2015Group
2015Parent
Company2014
Group
2014Parent
CompanyRO RO RO RO
Net assets (in Rial Omani) 2,167,706 5,079,647 10,024,554 9,491,034
Number of shares outstanding 75,208,000 75,208,000 75,208,000 75,208,000Net assets per share (in Rial Omani) 0.029 0.068 0.133 0.126
27 Basic and diluted loss per share
Basic loss per share is calculated by dividing the net (loss) profit for the year by the weighted average number of shares outstanding during the year as follows:
2015Group
2015Parent
Company2014
Group
2014Parent
CompanyRO RO RO RO
Net loss for the year (in Rial Omani) (8,223,698) (4,778,237) (1,440,518) (2,089,498)Average number of shares outstanding during the year 75,208,000 75,208,000 75,208,000 75,208,000
Basic and diluted loss per share (in Rial Omani) (0.109) (0.064) (0.019) (0.028)
As the Group and Parent Company does not have any dilutive potential shares, the diluted earnings per share is the same as the basic earnings per share.
28 Joint venture
The Parent Company had entered into a joint venture agreement with SNC Lavalin International, Inc., (an entity registered in Calgary, Canada) dated 4 July 2002, for the execution of an Engineering, Procurement and Construction (EPC) contract for Saih Nihayda Gas Plant Project of Petroleum Development of Oman (PDO) which has been substantially completed. The interest of the Parent Company in the joint venture is 40%.
The JV and the JV Agreement have been terminated under clause 13.2 of the Joint Venture Agreement dated 4 July 2002.
The amounts relating to the Parent Company’s 40% interest in the joint venture which were included in the Parent Company’s financial statements, based on management accounts as at 31 December 2014 were as follows:
2015 201440%shareinjointventure 40% share in joint venture
RO ROCurrent assets - 30,729Current liabilities - 32,955Accumulated losses - 2,226
NOTES TO THE CONSOLIDATED AND PARENT COMPANY FINANCIAL STATEMENTS FOR THE YEAR ENDED 31 DECEMBER 2015 (continued)
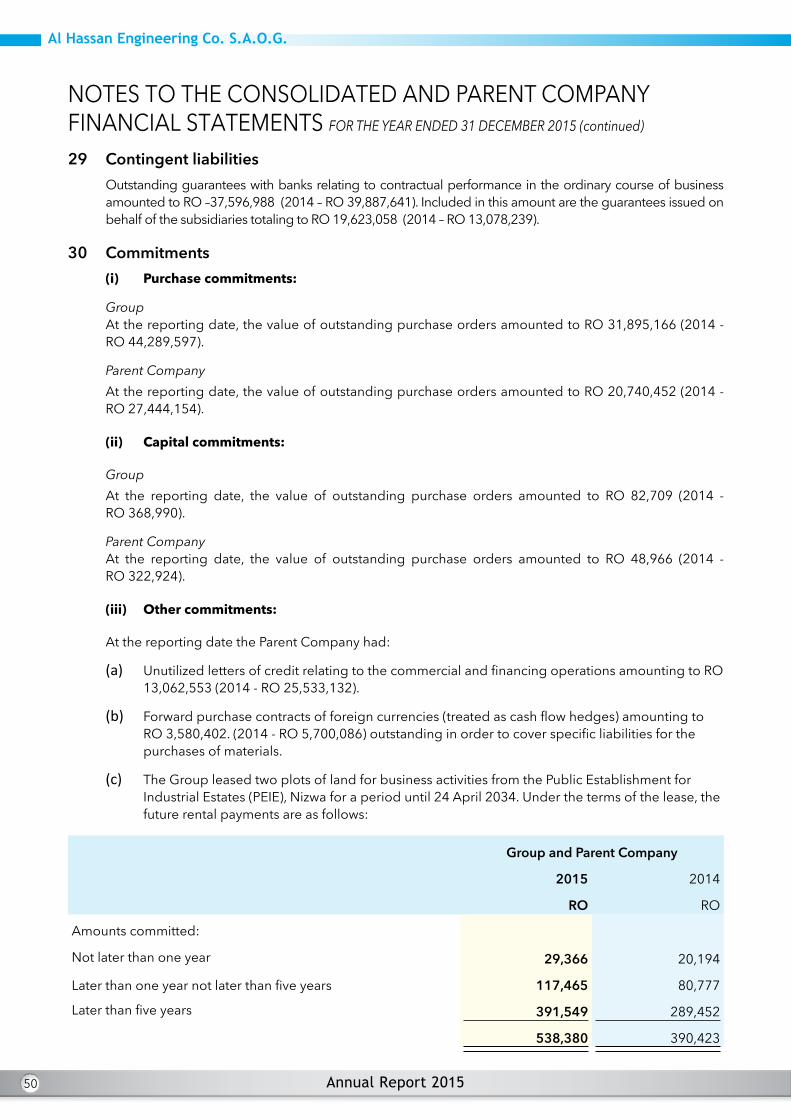
50
29 Contingent liabilitiesOutstanding guarantees with banks relating to contractual performance in the ordinary course of business amounted to RO –37,596,988 (2014 – RO 39,887,641). Included in this amount are the guarantees issued on behalf of the subsidiaries totaling to RO 19,623,058 (2014 – RO 13,078,239).
30 Commitments(i) Purchasecommitments:
GroupAt the reporting date, the value of outstanding purchase orders amounted to RO 31,895,166 (2014 - RO 44,289,597).
Parent CompanyAt the reporting date, the value of outstanding purchase orders amounted to RO 20,740,452 (2014 - RO 27,444,154).
(ii) Capitalcommitments:
GroupAt the reporting date, the value of outstanding purchase orders amounted to RO 82,709 (2014 - RO 368,990).
Parent CompanyAt the reporting date, the value of outstanding purchase orders amounted to RO 48,966 (2014 - RO 322,924).
(iii) Othercommitments:
At the reporting date the Parent Company had:
(a) Unutilized letters of credit relating to the commercial and financing operations amounting to RO 13,062,553 (2014 - RO 25,533,132).
(b) Forward purchase contracts of foreign currencies (treated as cash flow hedges) amounting to RO 3,580,402. (2014 - RO 5,700,086) outstanding in order to cover specific liabilities for the purchases of materials.
(c) The Group leased two plots of land for business activities from the Public Establishment for Industrial Estates (PEIE), Nizwa for a period until 24 April 2034. Under the terms of the lease, the future rental payments are as follows:
Group and Parent Company
2015 2014
RO RO
Amounts committed:
Not later than one year 29,366 20,194
Later than one year not later than five years 117,465 80,777
Later than five years 391,549 289,452
538,380 390,423
NOTES TO THE CONSOLIDATED AND PARENT COMPANY FINANCIAL STATEMENTS FOR THE YEAR ENDED 31 DECEMBER 2015 (continued)
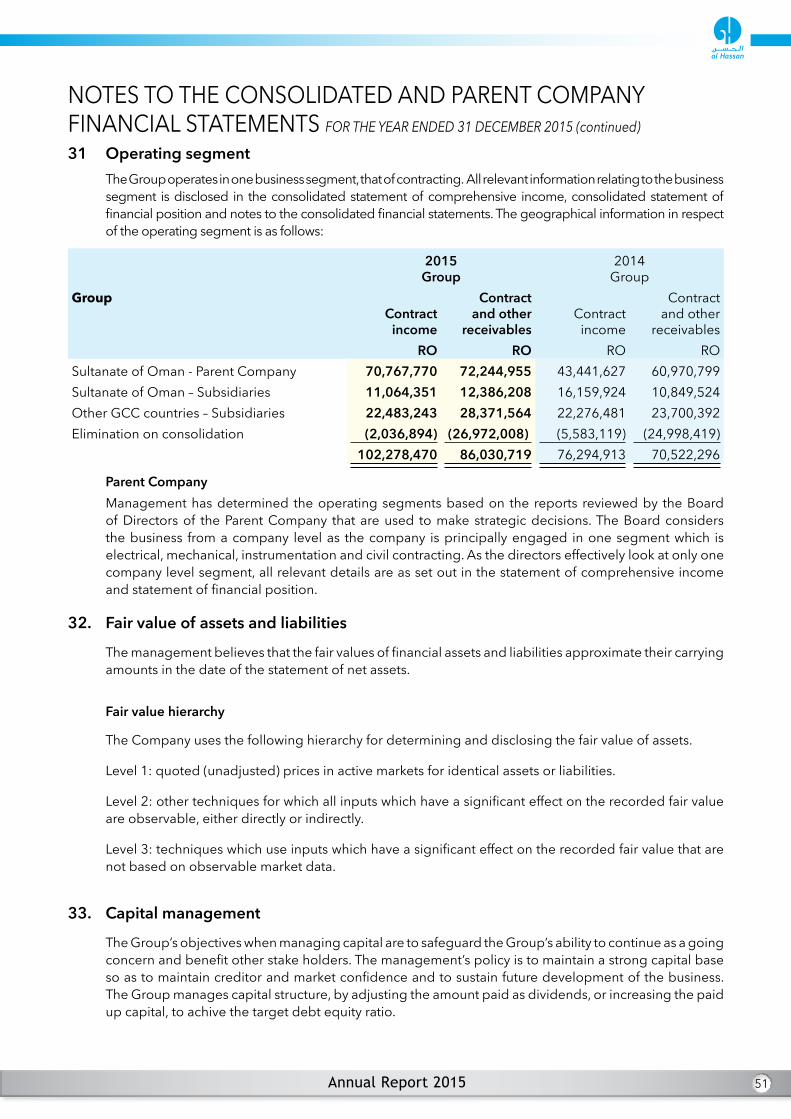
51
31 Operating segmentThe Group operates in one business segment, that of contracting. All relevant information relating to the business segment is disclosed in the consolidated statement of comprehensive income, consolidated statement of financial position and notes to the consolidated financial statements. The geographical information in respect of the operating segment is as follows:
2015Group
2014Group
GroupContract
income
Contract and other
receivablesContract
income
Contract and other
receivablesRO RO RO RO
Sultanate of Oman - Parent Company 70,767,770 72,244,955 43,441,627 60,970,799Sultanate of Oman – Subsidiaries 11,064,351 12,386,208 16,159,924 10,849,524Other GCC countries – Subsidiaries 22,483,243 28,371,564 22,276,481 23,700,392Elimination on consolidation (2,036,894) (26,972,008) (5,583,119) (24,998,419)
102,278,470 86,030,719 76,294,913 70,522,296
Parent CompanyManagement has determined the operating segments based on the reports reviewed by the Board of Directors of the Parent Company that are used to make strategic decisions. The Board considers the business from a company level as the company is principally engaged in one segment which is electrical, mechanical, instrumentation and civil contracting. As the directors effectively look at only one company level segment, all relevant details are as set out in the statement of comprehensive income and statement of financial position.
32. Fair value of assets and liabilities
The management believes that the fair values of financial assets and liabilities approximate their carrying amounts in the date of the statement of net assets.
Fair value hierarchy
The Company uses the following hierarchy for determining and disclosing the fair value of assets.
Level 1: quoted (unadjusted) prices in active markets for identical assets or liabilities.
Level 2: other techniques for which all inputs which have a significant effect on the recorded fair value are observable, either directly or indirectly.
Level 3: techniques which use inputs which have a significant effect on the recorded fair value that are not based on observable market data.
33. Capital management
The Group’s objectives when managing capital are to safeguard the Group’s ability to continue as a going concern and benefit other stake holders. The management’s policy is to maintain a strong capital base so as to maintain creditor and market confidence and to sustain future development of the business. The Group manages capital structure, by adjusting the amount paid as dividends, or increasing the paid up capital, to achive the target debt equity ratio.
NOTES TO THE CONSOLIDATED AND PARENT COMPANY FINANCIAL STATEMENTS FOR THE YEAR ENDED 31 DECEMBER 2015 (continued)
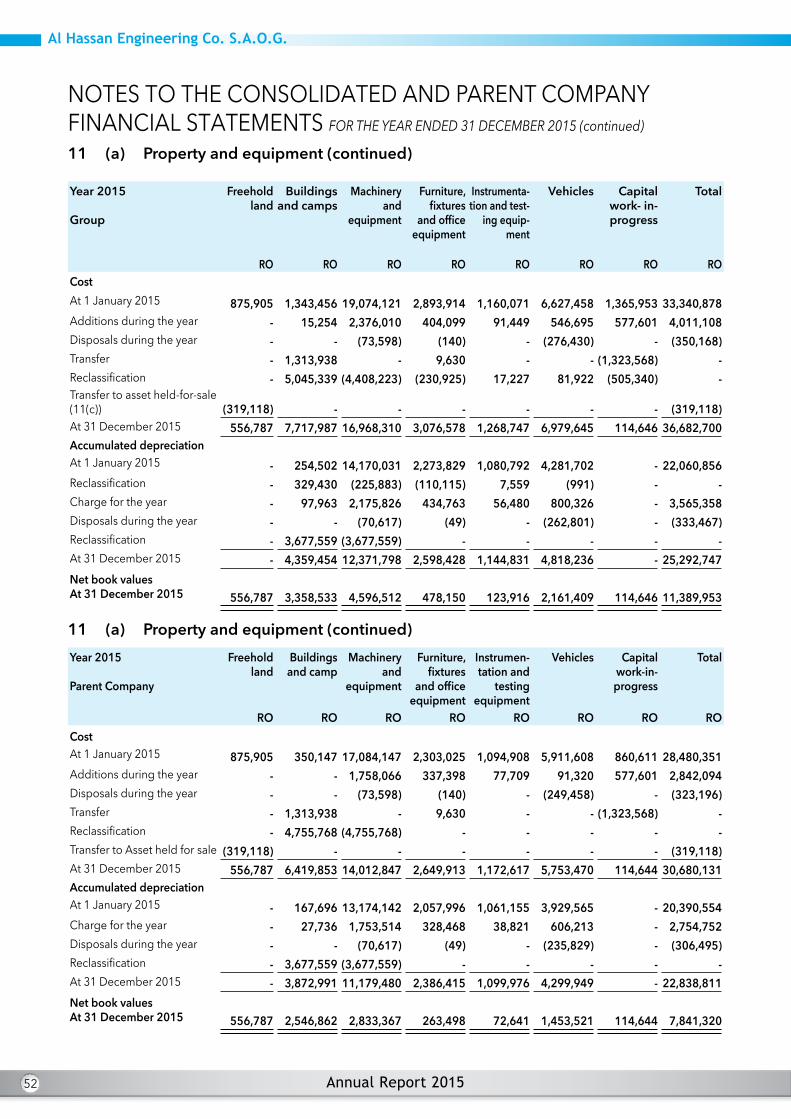
52
11 (a) Property and equipment (continued)
Year 2015
Group
Freeholdland
Buildings and camps
Machinery and
equipment
Furniture, fixtures
and office equipment
Instrumenta-tion and test-
ing equip-ment
Vehicles Capital work- in-progress
Total
RO RO RO RO RO RO RO ROCostAt 1 January 2015 875,905 1,343,456 19,074,121 2,893,914 1,160,071 6,627,458 1,365,953 33,340,878 Additions during the year - 15,254 2,376,010 404,099 91,449 546,695 577,601 4,011,108 Disposals during the year - - (73,598) (140) - (276,430) - (350,168)Transfer - 1,313,938 - 9,630 - - (1,323,568) -Reclassification - 5,045,339 (4,408,223) (230,925) 17,227 81,922 (505,340) -Transfer to asset held-for-sale (11(c)) (319,118) - - - - - - (319,118)At 31 December 2015 556,787 7,717,987 16,968,310 3,076,578 1,268,747 6,979,645 114,646 36,682,700 Accumulated depreciationAt 1 January 2015 - 254,502 14,170,031 2,273,829 1,080,792 4,281,702 - 22,060,856 Reclassification - 329,430 (225,883) (110,115) 7,559 (991) - - Charge for the year - 97,963 2,175,826 434,763 56,480 800,326 - 3,565,358 Disposals during the year - - (70,617) (49) - (262,801) - (333,467)Reclassification - 3,677,559 (3,677,559) - - - - -At 31 December 2015 - 4,359,454 12,371,798 2,598,428 1,144,831 4,818,236 - 25,292,747 Net book values At 31 December 2015 556,787 3,358,533 4,596,512 478,150 123,916 2,161,409 114,646 11,389,953
11 (a) Property and equipment (continued)Year 2015
Parent Company
Freehold land
Buildings and camp
Machinery and
equipment
Furniture, fixtures
and office equipment
Instrumen-tation and
testing equipment
Vehicles Capital work-in-progress
Total
RO RO RO RO RO RO RO ROCostAt 1 January 2015 875,905 350,147 17,084,147 2,303,025 1,094,908 5,911,608 860,611 28,480,351 Additions during the year - - 1,758,066 337,398 77,709 91,320 577,601 2,842,094 Disposals during the year - - (73,598) (140) - (249,458) - (323,196)Transfer - 1,313,938 - 9,630 - - (1,323,568) -Reclassification - 4,755,768 (4,755,768) - - - - -Transfer to Asset held for sale (319,118) - - - - - - (319,118)At 31 December 2015 556,787 6,419,853 14,012,847 2,649,913 1,172,617 5,753,470 114,644 30,680,131 Accumulated depreciation At 1 January 2015 - 167,696 13,174,142 2,057,996 1,061,155 3,929,565 - 20,390,554 Charge for the year - 27,736 1,753,514 328,468 38,821 606,213 - 2,754,752 Disposals during the year - - (70,617) (49) - (235,829) - (306,495)Reclassification - 3,677,559 (3,677,559) - - - - -At 31 December 2015 - 3,872,991 11,179,480 2,386,415 1,099,976 4,299,949 - 22,838,811 Net book valuesAt 31 December 2015 556,787 2,546,862 2,833,367 263,498 72,641 1,453,521 114,644 7,841,320
NOTES TO THE CONSOLIDATED AND PARENT COMPANY FINANCIAL STATEMENTS FOR THE YEAR ENDED 31 DECEMBER 2015 (continued)

53
11 (a) Property and equipment (continued) Year 2014
Group
Freehold land
Buildings and camps
Machinery and
equipment
Furniture, fixtures
and office equipment
Instrumen-tation and
testing equipment
Vehicles Capital work-in-progress
Total
RO RO RO RO RO RO RO ROCostAt 1 January 2014 875,905 1,199,441 17,697,298 2,498,662 1,125,991 5,823,335 722,550 29,943,182Additions during the year - 111,907 1,260,580 410,694 34,080 897,898 949,296 3,664,455Transfer - - 308,728 - - - (308,728) -Reclassification - 4,006,193 (4,009,028) - - - 2,835 -Disposals during the year - - (157,542) (15,442) - (93,775) - (266,759)At 31 December 2014 875,905 5,317,541 15,100,036 2,893,914 1,160,071 6,627,458 1,365,953 33,340,878
Accumulated depreciationAt 1 January 2014 - 125,111 12,368,873 1,904,538 1,022,760 3,672,842 - 19,094,124Reclassification - 3,315,371 (3,264,031) (11,689) (1,575) (38,076) - -Charge for the year - 174,450 1,841,294 396,239 59,607 740,706 - 3,212,296Disposals during the year - - (136,535) (15,259) - (93,770) - (245,564)At 31 December 2014 - 3,614,932 10,809,601 2,273,829 1,080,792 4,281,702 - 22,060,856
Net book values At 31 December 2014 875,905 1,702,609 4,290,435 620,085 79,279 2,345,756 1,365,953 11,280,022
11 (a) Property and equipment (continued)
Year 2014
Parent Company
Freehold land
Buildings and camps
Machinery and
equipment
Furniture, fixtures
and office equipment
Instrumen-tation and
testing equipment
Vehicles Capital work-in-progress
Total
RO RO RO RO RO RO RO ROCostAt 1 January 2014 875,905 238,240 15,906,467 2,026,330 1,092,178 5,254,152 234,878 25,628,150Additions during the year - 111,907 1,026,494 279,537 2,730 751,231 934,461 3,106,360Transfer - - 308,728 - - - (308,728) -Reclassification - 3,974,085 (3,974,085) - - - - -Disposals during the year - - (157,542) (2,842) - (93,775) - (254,159)At 31 December 2014 875,905 4,324,232 13,110,062 2,303,025 1,094,908 5,911,608 860,611 28,480,351Accumulated depreciationAt 1 January 2014 - 78,287 11,867,733 1,721,859 1,015,430 3,394,967 - 18,078,276Charge for the year - 89,409 1,442,944 338,796 45,725 628,368 - 2,545,242Reclassification - 3,360,430 (3,360,430) - - - - -Disposals during the year - - (136,535) (2,659) - (93,770) - (232,964)At 31 December 2014 - 3,528,126 9,813,712 2,057,996 1,061,155 3,929,565 - 20,390,554
Net book valuesAt 31 December 2014 875,905 796,106 3,296,350 245,029 33,753 1,982,043 860,611 8,089,797
NOTES TO THE CONSOLIDATED AND PARENT COMPANY FINANCIAL STATEMENTS FOR THE YEAR ENDED 31 DECEMBER 2015 (continued)


