66


His Majesty Sultan Qaboos Bin Said


5
Board of Directors and Management
Contents
Board of Directors’ Report
Operational Highlights
Description of the Project
Profile of the Founders
Management Discussion and Analysis Report
Report of the Auditors on Corporate Governance
Corporate Governance Report
Report of the Auditors on Financial Statements
Financial Statements
PAGe NO.
4
7
10
13
17
20
23
24
36
37
6
Representing:
Chairman Mr. Murtadha Ahmed Sultan W.J. Towell & Co. LLC.
Vice Chairman Mr. Frederic Henning -
Director Mr. C.S. Badrinath The Zubair Corporation
Director Mr. Abdulraouf Abudayyeh Sogex (Oman) LLC
Director Ameed Rukn Mohammad Bin Suleyam Bin Nasser Al Mazidi
Ministry of Defence Pension Fund
Director Mr. Navneet Kasbekar -
Director Mr. Karel Breda -
Director Mr. Sankaran Subramaniam -
Director Mr. Marc Van Haver -
Director Mr. Jean Rappe -
Director Mr. Johan Van Kerrebroeck Kahrabel FZE (International Power)
Director Mr. Saif Abdullah Al Harthy -
BOARD OF DIReCTORS AND MANAGeMeNT
6

7
Key executive Officers
Chief Executive Officer Mr. Arnaud de Limburg Stirum
Company Secretary Mr. Zoher Karachiwala
Chief Financial Officer Mr. S. M. Tariq
Technical Manager Mr. Sreenath Hebbar
Administration Manager Mr. Jamal Al Bloushi
7


9
BOARD OF DIReCTORS’ RePORT
Dear Shareholders,
On behalf of the Board of Directors of Sohar Power Company SAOG (“Sohar Power” or the “Company”), I am glad to present you with the Eighth Annual Report of the Company for the year ended 31 December 2011.
Sohar Power was incorporated in 2004 after award of the Sohar IWPP project. The Company owns and operates the 585MW electricity generation and 33MIGD seawater desalination plant in Sohar industrial estate. It is selling power and water to Oman Power and Water Procurement Company SAOC (“OPWP”) under a 15-year Power and Water Purchase Agreement (“PWPA”). The Company was listed on the Muscat Securities Market since 2008.
In its fifth year of operation, the Sohar plant had an excellent year until September 2011. In October and November two of the three gas turbines underwent scheduled Major Inspections. During this inspection, cracks were discovered on one retaining ring of each of the generators of the Gas Turbines. The steam turbine generator is not affected. Such cracks are not normal and repairs to them necessitated extension to the outages. The Gas Turbines generator manufacturer, Siemens, has been involved to determine the root causes for the event. The study is still ongoing and is expected to be released in May 2012. The cost of repairs and the loss of availability due to extended outage have adversely affected the Company’s revenues as outlined below. The Company is also discussing with Insurers on the issue.
Sohar Power concluded in May 2011 an agreement with OPWP, making available for the summer months an additional 10MW of power capacity. This brought the Company additional revenues. In August, the Company concluded an agreement with Majan Electricity for the settlement of a past liability related to use of energy in 2006-2008. This has allowed the final settlement of a long outstanding dispute at conditions favourable to the Company.
The Company recorded an EBITDA of 19,484 (OMR’000) [50,608 (USD’000)] in 2011 compared to 21,305 (OMR’000) [55,337 (USD’000)] in 2010. Profit is 2,522 (OMR’000) [6,550 (USD’000)] for the year 2011. The same was 4,562 (OMR’000) [11,849 (USD’000)] in 2010. The variance of 2,040 (OMR’000) [5,299 (USD’000)] between the profits of 2010 and 2011 is mainly due to major inspection and repairs of GT#1 and GT#2. The Company distributed 8% (bz. 80 per each share) interim dividend in 2011; with the negative impact mentioned above, retained earnings are insufficient to pay additionally a final dividend for the year.
The operational and financial results are outlined hereafter. As regards safety, the Company’s record has always been outstanding, and the Company had achieved in the first half of 2011 more than 2,000 days without incidents. However, in the month of October 2011 during the Major Inspection, two of the sub-contractor personnel suffered foot injuries, which is classified as Lost Time Accident (LTA).
2011 also witnessed significant efforts by the Company and its Operator, SOMC, in training and employment of young Omani graduates in our operations. Training capabilities have been doubled over the year, and the Sohar Plant saw a second group of trainees completing their program and joining the operation and maintenance teams.
The Company does all efforts to ensure that its high standards of corporate governance are in full compliance with the Code of Corporate Governance promulgated by the Capital Market Authority. In 2011, the Board of Directors approved a new Disclosure policy, in line with the Capital Market Authority recommendations, to ensure complete and timely communication to all stakeholders.
Sohar Power supported in 2011 the DG Education of the Northern Batinah region by offering projection equipment, and donated school bags, stationary, and other equipment to primary and secondary schools

10
close to our main place of operation. Sohar Power prides itself in actively supporting communities it lives in. The Company supports every year a broad array of initiatives, with a particular focus on education in 2011.
On behalf of the Board of Directors, I would also like to take this opportunity to wish His Majesty Sultan Qaboos Bin Said long life, good health and prosperity. The Board wishes to express its gratitude to the Government of Oman for their continued support and encouragement to the private sector in creating an environment that allows us to participate effectively in the growth of the economy and dedicate our humble achievements towards the building of strong Oman.
We wish to thank our valued shareholders for their continued support for their trust and confidence in us. Finally, we would like to thank all the personnel associated with the operation and maintenance of the Sohar plant and the staff of the Company for their dedication and commitment in ensuring that it achieves its goals and objectives.
May Allah protect them for all of us.
Murtadha Ahmed SultanChairman of the Board

12
OPeRATION HIGHLIGHTSCapacity
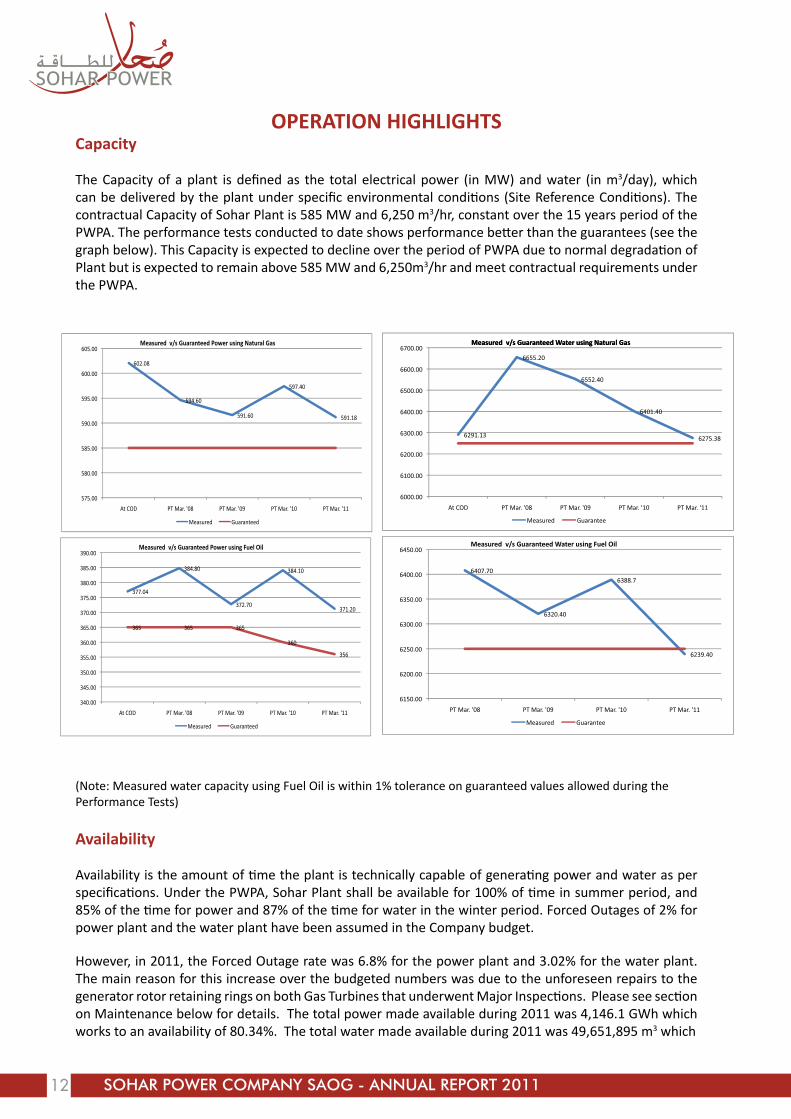
The Capacity of a plant is defined as the total electrical power (in MW) and water (in m3/day), which can be delivered by the plant under specific environmental conditions (Site Reference Conditions). The contractual Capacity of Sohar Plant is 585 MW and 6,250 m3/hr, constant over the 15 years period of the PWPA. The performance tests conducted to date shows performance better than the guarantees (see the graph below). This Capacity is expected to decline over the period of PWPA due to normal degradation of Plant but is expected to remain above 585 MW and 6,250m3/hr and meet contractual requirements under the PWPA.
(Note: Measured water capacity using Fuel Oil is within 1% tolerance on guaranteed values allowed during the Performance Tests)
Availability
Availability is the amount of time the plant is technically capable of generating power and water as per specifications. Under the PWPA, Sohar Plant shall be available for 100% of time in summer period, and 85% of the time for power and 87% of the time for water in the winter period. Forced Outages of 2% for power plant and the water plant have been assumed in the Company budget.
However, in 2011, the Forced Outage rate was 6.8% for the power plant and 3.02% for the water plant. The main reason for this increase over the budgeted numbers was due to the unforeseen repairs to the generator rotor retaining rings on both Gas Turbines that underwent Major Inspections. Please see section on Maintenance below for details. The total power made available during 2011 was 4,146.1 GWh which works to an availability of 80.34%. The total water made available during 2011 was 49,651,895 m3 which

13
works to an availability of 90.69%. The lower power availability is on account of the two Major Inspections that were undertaken on two Gas Turbines and the extension in time due to unforeseen repairs.
At the end of March, our operator SOMC faced a strike of its employees. The strike ended 4 days later after intensive negotiations with the employees. There was no impact on the availability of the plant.
Reliability
The reliability of the plant is the ability of the plant to deliver the declared availability, as per PWPA. Any failure to deliver the declared capacity will be treated as forced outage. The goal of Sohar Power is to minimize these forced outages, in order to maximize its revenues. During 2011 the plant showed exceptional reliability of 99.64% for power and 99.62% for water till October 2011. However, on account of the extension in outages due to unforeseen repairs in the months of November and December 2011, the overall forced outage and reliability numbers showed a strong deterioration. The overall reliability of the plant for power was 93.17% and for water 97.94%, for the complete year.
Plant efficiency (Heat Rate)
The efficiency of the power plant is measured in terms of the amount of heat required to produce one unit of power. Demonstrated efficiency in the original performance test was better than contractual requirements under the PWPA, thus bringing an upside to the Company.
The Contracted Heat Rate is 8,997 MJ/MWh for natural gas; the initial performance tests demonstrated a heat rate of 8,512 MJ/MWh.
Utilization and energy and Water Delivered
During the year 2011 the energy delivered was 2,836.6 GWh with a utilization factor of the power plant of 68.42%. The total water delivered by the water plant was 33,016,616 m3 with a utilization factor of 66.5%.
Evolution of these statistics since Commercial Operation Date of the Plant is depicted in the following charts.

14
Maintenance
Sohar gas turbine nr1 (“GT#1”), having clocked 40,100 Equivalent Operating Hours (“EOH”) was shut down on October 2nd for Major Inspection in accordance with the recommendations of the manufacturer. While “GT#1” Generator was not due for Major Inspection, it was pulled out of the stator housing for a physical inspection to check on earlier rotor earth faults that were not satisfactorily addressed. On October 12th, two cracks on the Generator turbine end retaining ring (RR) were discovered, one on each side at 180o from each other.
After having clocked 40,677 EOH, GT#2 was shut down on November 1st for undergoing Major Inspection. Given that cracks were discovered on GT#1 Generator, it was decided to pull out the rotor on GT#2 Generator rotor as well. On November 9th, four cracks were noticed on the generator retaining ring on the turbine end of the generator rotor – set of two cracks, each about 180o to each other.
The rotors were sent to specialized workshop of the manufacturer, Siemens, based in Saudi Arabia to carry out repairs. GT#1 rotor returned to site on December 3rd, while GT#2 rotor returned to site on January 6th.
GT#3 Generator could not be inspected in 2011 as the plant was required to address the power and water demand faced by our client. At the earliest opportunity, following the year end, GT#3 Generator was inspected and similar issue was identified. Repairs are ongoing.
The Steam Turbine Generator was also inspected and found with no defect.
The manufacturer is engaged in determining the causes for these unexpected cracks. The Root Cause Analysis is expected to cover issues related to materials, manufacturing, operations and any extraneous influences. The Company has further engaged the services of Laborelec, an international technical expert in power technology, to assist it in this analysis.
The Company is in touch with its Insurers on these unexpected repairs and is pursuing the claim diligently.
Other annual maintenance works of the HRSGs and Water Plant were conducted during the period. All equipment and systems were found to be in order.
15
DeSCRIPTION OF THe PROJeCT
History of the Project
The Project was awarded to the promoters, comprising GDF Suez, National Trading Company, SOGEX Oman, Ministry of Defense Pension Fund, W.J. Towell & Co and The Zubair Corporation, by the Government following a competitive bidding process. The promoters formed Sohar Power Company SAOC for the purposes of entering into the project agreements and undertaking the Project.
Sohar Power has been established under a Build-Own-Operate scheme. The BOO concept enables the Company to operate as a going concern beyond the project horizon of 15 years by either extending the PWPA (if agreed to with OPWP) or selling into a liberalized electricity market which may exist at that time. It may be noted that the anticipated useful life of the Plant is 30 years.
The 585 MW combined cycle gas fired power plant and 150,000 m3/d desalination plant is located in the Sohar Industrial Port Area in the North Al Batinah Governorate of the Sultanate of Oman. The site is strategically located near the main gas transmission system and electricity grid network.
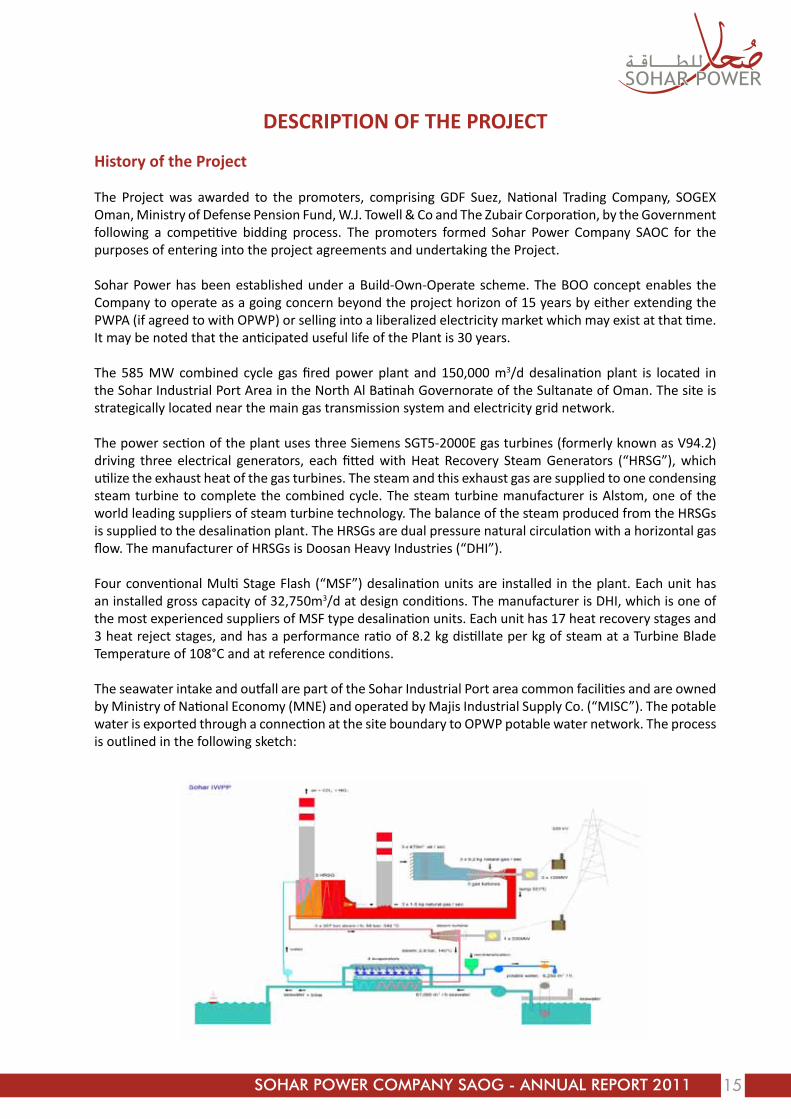
The power section of the plant uses three Siemens SGT5-2000E gas turbines (formerly known as V94.2) driving three electrical generators, each fitted with Heat Recovery Steam Generators (“HRSG”), which utilize the exhaust heat of the gas turbines. The steam and this exhaust gas are supplied to one condensing steam turbine to complete the combined cycle. The steam turbine manufacturer is Alstom, one of the world leading suppliers of steam turbine technology. The balance of the steam produced from the HRSGs is supplied to the desalination plant. The HRSGs are dual pressure natural circulation with a horizontal gas flow. The manufacturer of HRSGs is Doosan Heavy Industries (“DHI”). Four conventional Multi Stage Flash (“MSF”) desalination units are installed in the plant. Each unit has an installed gross capacity of 32,750m3/d at design conditions. The manufacturer is DHI, which is one of the most experienced suppliers of MSF type desalination units. Each unit has 17 heat recovery stages and 3 heat reject stages, and has a performance ratio of 8.2 kg distillate per kg of steam at a Turbine Blade Temperature of 108°C and at reference conditions.
The seawater intake and outfall are part of the Sohar Industrial Port area common facilities and are owned by Ministry of National Economy (MNE) and operated by Majis Industrial Supply Co. (“MISC”). The potable water is exported through a connection at the site boundary to OPWP potable water network. The process is outlined in the following sketch:

16
The land for the power plant is owned by the Government which (through the Ministry of Transport and Communication) has entered into an Usufruct Agreement with Sohar Industrial Port Company SAOC (“SIPC”). SIPC entered into a Sub-Usufruct agreement with Sohar Power to grant the Company usufruct rights for 15 years on the land (renewable for another 10 years). Additionally, Ministry of Transport and Communication committed towards Sohar Power to extend the lease up to 30 years under a Sub-Usufruct Direct Agreement. Natural Gas is supplied by the Ministry of Oil and Gas to a pressure reduction station supplying the consumer of the Sohar Industrial Port area. The power output of the gas turbine generator feeds the auxiliary of the Plant and is exported to the grid through a 220 kV substation owned by OETC.
Contractual arrangements
Off-taker
The entire output from the plant’s installed Capacity is contracted for through a single long term PWPA with the Oman Power and Water Procurement Company SAOC until 31st March 2022. Beyond this date, Sohar Power will either extend its PWPA with OPWP or sell its output in a liberalized market in a pool or to eligible customers, depending on the evolution of the market regulation set by the Regulatory Authority.
Fuel Supply
The natural gas is supplied by Ministry of Oil & Gas (“MOG”) for 15 years (commences and ends with the PWPA). In accordance with the Natural Gas Sales Agreement (“NGSA”), natural gas will be supplied up to the gas delivery point of the plant. In case of non-availability of gas conforming to specifications, Sohar Power shall run the plant on fuel oil for up to a continuous period of 3 days as per the provisions of the PWPA and the NGSA. Sohar Power would be reimbursed all the additional costs of running the plant on fuel oil by MOG and any capacity shortfall, which arises there from.
Sea Water
The raw seawater is made available by MNE for 15 years (commences and ends with the PWPA). In accordance with the Sea Water Extraction Agreement (“SWEA”), MISC shall operate, maintain, and avail Seawater Intake/Outfall facility and provide chlorinated seawater to the Company. In return, Sohar Power is making monthly payments to MISC.
Electrical connection
The power produced is supplied to the OETC owned Grid at the connection point in the 220 kV sub-station under an Electrical Connection Agreement (“ECA”). The ECA was executed in June 2011 and is valid for the term of the PWPA. Charges payable to OETC under the ECA passed through are under the PWPA to OPWP, keeping the Company neutral.
Water supply connection
As per PWPA the potable water is supplied under a Water Connection Agreement (“WCA”) valid for 15 years (commences and ends with the PWPA) to the storage facility and its downstream transmission network owned by PAEW.

17
During the commissioning of the water plant, OPWP and MISC approached Sohar Power to provide distillate water (the output of the evaporators prior to potabilization) in order to meet the industrial requirements of the Sohar industrial complex. A long term agreement has been entered into with OPWP in July 2009. The long term supply was studied and found to be of no risk to the originally designed process, while providing additional revenues to the original PWPA revenues.
EPC Contractor
The Company entered into an EPC Contract with Sohar Global Contracting and Construction Company LLC (“SGCCC”), with Doosan Heavy Industries as subcontractor. The construction was completed in 2007, and outstanding claims were settled in March 2008 through a Settlement Agreement. The period of warranty under the EPC contract expired on 28th May 2008, and the few items outstanding under a renewed warranty period were settled in 2009.
Operation and Maintenance
The operation and maintenance services are provided by Sohar Operations & Maintenance Company LLC (“SOMC”), a part of Suez Tractebel Operation and Maintenance Oman LLC (“STOMO”), an experienced power plant operator in the region. The contract broadly covers the following scope:
¾ Day-to-day operation of the plant, procurement of spare parts and maintenance services necessary to perform scheduled maintenance;
¾ Training of human resources, including in order to meet Omanization requirements; ¾ Health and security policies and procedures; ¾ Maintain and generate invoices based on fuel demand model and settlement system; ¾ Performance testing, periodic reporting; ¾ Management of inventory and wastes.
The Operation and Maintenance Agreement is expiring at the same time as the PWPA. The performance and payment obligations of SOMC under the O&M Agreement are guaranteed by several corporate indemnities from each of International Power (GDF Suez) and Suhail Bahwan Holding Group.
Revenue Details
Operating Revenues comprise Capacity Charge and Energy Charge and Water Output Charge. Revenues are indexed to the RO-USD exchange rate, US Purchasing Power indices, and Omani Consumer Price indices.
Capacity Charges
Capacity Charges are payable for each hour during which the plant is available for generation and is paid by OPWP. The Capacity Charge is the total of:
¾ Investment charge: covers capital and all related costs of the Project like tax payments, debt service and return on capital,
¾ Fixed operation and maintenance charge: covers fixed operation and maintenance and all related costs of the plant; and
¾ New Industry charge: covers period licensing costs under the Sector Law, and charges due to OETC under the ECA.

18
Force Majeure events
If Sohar Power is prevented or hindered in performing of its obligations for reasons outside of its control, it will constitute a Force Majeure (“FM”) event.
In accordance with the PWPA, declaration of FM results in extension of the Term by an amount of time equal to the period of the FM. Revenues during the FM is delayed and paid during the Term extension.
Energy and Water Output Charges
The energy and water output charge is the short term marginal cost of power and water delivered and is paid by OPWP it is the total of:
¾ Variable operating costs; ¾ Start-up Costs: payable to Sohar Power for the costs of the starts.
Fuel Costs
Based on the theoretical natural gas consumption to produce the electrical energy and water output delivered, which will be calculated with the help of a fuel demand model and on the basis of the contractual heat rate.

19
PROFILe OF THe FOUNDeRS
Kahrabel FZe (International Power)
Kahrabel FZE is a wholly owned subsidiary of International Power (GDF Suez) and the vehicle through which International Power (GDF Suez) conducts its energy business in the Middle East. International Power plc. is a leading independent electricity generating company with 75,579MW gross (43,288MW net) in operation and a significant programme of 12,820MW gross (5,868MW net) projects under construction as at 31st December 2011. International Power is present in 30 countries across six regions worldwide. Together with power generation, the group is also active in closely linked businesses including downstream LNG, gas distribution, desalination and retail. International Power is listed on the London Stock Exchange with ticker symbol IPR. GDF SUEZ holds a 70% interest in International Power plc.
In the Middle East, Turkey & Africa region (META), International Power has a direct equity interest in more than 26GW power capacity and almost 4.7 million m³/day of desalination capacity in operation and under construction. In the GCC, it is the leading operating independent power and desalinated water producer, with over 15 years of experience. In Turkey, International Power has two plants in operation with a total capacity of 1.2 GW, and runs a natural gas distribution and retail company, IZGAZ, with over 200,000 subscribers east of Istanbul. In Africa, International Power is actively pursuing a number of projects, specifically in Morocco and South Africa.
W.J. Towell & Co. LLC
W.J. Towell & Co. LLC was established in the year 1866 and today it is one of the leading and respected business houses in Oman, having interests in over 40 industries. Its business activities include Distribution of Fast Moving Consumer goods, Property development both residential and commercial, Manufacturing of paints, dairy products, mattresses, linen, etc., and Services related to shipping, insurance and telecommunications.
Apart from above, the group has interest in automobiles, printing, retailing, computer services, building materials, electronic goods, and engineering.
The group has brought into Oman some of the world famous brands like, Unilever, Nestle, Mars, Colgate, British American Tobacco, Mazda, Bridgestone, Jotun Paints etc. either in the form of Joint ventures or as sole distributors.
W.J. Towell & Co. LLC is headquarted in Oman and also has offices in Dubai, Kuwait and Iran. It prides itself as being professionally managed and governed by its Board of Directors.
The Board consists of Hussain Jawad (Chairman), Tawfiq Ahmed Sultan (Deputy Chairman), Anwar A. Sultan, Murtadha A. Sultan, Jamil. A Sultan, Hassan Q. Sultan, Mushtaq Q. Sultan, Mohamed Ali A. Sultan and Imad Sultan.
The Zubair Corporation LLC
Founded in 1967, the Zubair Corporation LLC today is diversified corporation consisting of almost sixty wholly owned companies, subsidiaries and associates that operate in Oman, the rest of the Middle East, Europe and the USA. The group has a marked presence in the automotive, furnishing, electric, energy, information and communication technology, property and construction, investment, tourism, manufacturing and trading in a host of products and services.

20
With reliable high-quality resources and expertise at its command, Zubair has played a lead role in the fulfillment of many national projects, which have primary roles in industry, public utilities, technological advancement and financial services. The group is constantly engaged in identifying and participating in new ventures to fulfill the socio-economic needs of the Sultanate of Oman.
All Zubair companies are professionally managed by internationally experienced executives. The emphasis on transparency, responsible corporate governance and professional management has made The Zubair Corporation one of the most respected names in Oman and the Middle East.
Ministry of Defence Pension Fund
The Ministry of Defence Pension Fund is a public legal entity in the Sultanate of Oman duly organized under, and registered pursuant to, Sultani Decree 87/93 issued on 29th December 1993.
The Ministry of Defence Pension Fund is one of the largest pension funds in Oman and is a major investor in the local capital markets; both in equities as well as bonds. It is also a major participant in project investments and real estate investments. The fund is represented on the boards of several prominent Corporates in Oman.
Sogex (Oman) LLC
SOGEX Oman Company LLC started in Oman in 1971 as a small contracting firm and then contributed remarkably in the development of Sultanate of Oman to meet the challenge of rapid growth. Sogex has grown within a short time into multinational group of companies located throughout the Middle East, Europe and in the United States.
Sogex Oman as a partnership company and one of Sogex Group Companies continues its operations in Oman and has participated in supply, construction and services of a number of large projects covering various fields on turnkey basis such as building and civil construction, EPC (Engineering, Procurement, Construction) contractor for power & desalination plants, electrical transmission lines and associated sub-stations of voltage level up and including 132KV.
On November 15, 1984 Messrs Bahwan Group of Companies acquired the whole of Sogex and renamed it as Sogex Oman Co LLC. Thereafter all legal relations with Sogex International were discontinued.


22
MANAGeMeNT DISCUSSION AND ANALYSIS
Industry structure and development
The Company is one of the largest privately owned Independent Water & Power Project in the country.
The Government regulates the development of the electricity sector under a well-formulated program on long-term basis. The Sector Law is in existence since 2004.
Opportunities and threats
The Company was formed specifically to build, own and operate the plant located at Sohar and its Generation License, issued by the Authority for Electricity Regulation of Oman (“AER”) does not allow it to undertake new ventures.
A long term PWPA with guaranteed off-take with Government protects the Company from market fluctuations and enjoys revenues guaranteed by the Government of the Sultanate. The Company has been relatively immune from the consequences of the economic downturn experienced since 2009 and with its refinancing closed in 2008, the Company is also not directly affected by the reduced credit availability.
Analysis of Results
Sohar Power earned profit of 6,550 (USD’000) [2,522 (OMR’000)] for the year 2011. The same was 11,849 (USD’000) [4,562 (OMR’000)] in 2010. The variance of 5,299 (USD’000) [2,040 (OMR’000)] between the profits of 2010 and 2011 is mainly due to major inspection and repairs of GT#1 and GT#2. During major inspection in 2011 unexpected technical faults were found in two of the three gas turbines generators. As a result of this Company incurred repair costs and, the Company lost revenues during November and December 2011 due to prolonged unavailability of the units.
Analysis of Balance Sheet
There was no increase or decrease in Property, Plant and Equipment during the year. The reduction in this account was due to Depreciation. The Company continued capitalizing cost of decommissioning of its Property, Plant and Equipment, to be incurred in 2037 (end of the life of the Sohar plant).
One month trade debtor was outstanding both in 2010 and 2011 end. The volume of December 2010 billing was higher than December 2011.
The net Hedging Deficit after deferred tax on it in 2011 (excluding Accruals) on its three IRSs (Interest Rate Swaps), which does not affect the profitability of the Company, was 69,811 (USD’000) [26,877 (RO’000)]; the same was 50,441 (USD’000) [19,420 (RO’000)] in 2010. As per IAS 39, this is calculated on each Balance Sheet date and represents the loss, which Company would incur, if it opts to terminate its Swap agreement on this date. However, under the terms of its Financing Agreements, Sohar Power is not permitted to terminate its Swap agreements and the loss is then nominal.
The Company repaid installments of its long term loans in accordance with the agreed loan repayment schedule under its Financing Agreements.
Trade and other liabilities was higher in 2010 as compared to 2011 mainly due to higher value of O&M and Fuel invoices and on account of provision made in 2010 for import of electricity.

23
Financial Highlights
The Company’s performance for the past five years was as follows:
All figures in USD’000 2011 2010 2009 2008 2007
Net Profit 1 6,550 11,849 8,454 11,142 8,121
Total Assets 2 486,813 511,463 522,099 528,010 602,607
Total Revenue 3 109,231 110,743 117,405 114,545 71,677
Total Shareholders’ Fund before hedging deficit
4 76,907 81,909 75,837 83,904 10,431
Total Shareholders’ Fund including hedging deficit
5 7,096 31,468 35,956 23,575 (9,209)
Paid up Capital 6 72,300 72,300 72,300 1,299 1,299
Increase in Capital 7 - - - 71,001 -
Current Paid up Capital 8 72,300 72,300 72,300 72,300 1,299
2011 2010 2009 2008 2007
Return on Total Assets 1÷2 1.35% 2.32% 1.62% 2.11% 1.34%
Net Profit to Revenue 1÷3 6.00% 10.70% 7.20% 9.73% 11.33%
Debt: Capital ratio (*) 16:84 16:84 15:85 15:85 26:74
Ordinary Dividend (**) 8.0% 16.0% - 8.0% 12%
* Till 2007 for capital ratio equity bridge loan was considered under “Capital”** In 2011, 8% interim dividend was paid for the year 2011. Company does not have sufficient
retained earnings to pay an additional final dividend.
Outlook for 2012
Due to nature of our activities we see no major change in 2012. Due to decreasing tariff structure contained in the Power & Water Purchase Agreement, the revenue will show a similar trend.
The GT#3 generator was inspected in January 2012 and found with similar issue then GT#1 and GT#2. Repairs have been contracted with Siemens, and the cost of it plus the associated loss of availability will affect significantly the results of the first quarter of 2012. The Company is in discussion with its insurers in respect of these costs and losses.

24
Internal control system and their adequacy
The Company believes in strong internal control systems as a tool to contribute high performance in operation and management of the Company. Sohar Power started implementation in 2009 of an Internal Control tool ‘INCOME’, which entails critical review of all unique processes of the Company, and that for these appropriate control and segregation of duties is applied. Implementation of this process has been completed in 2011, and was subjected to an audit in December. The conclusions from such audit were that the current controls in place provide a reasonable assurance on the design and operational effectiveness of the processes and main risks are covered.
Besides in-house process, our principal shareholders also oversee that we continue to maintain a highly efficient and adequate controls.
Transfers to Investors Trust Fund
During 2011, Muscat Clearing and Depository Company SAOC transferred following amount to Investors Trust Fund on behalf of the Company (Sohar Power Company SAOG):
¾ Final Dividend for 2010 = OMR 7,607.760 ¾ Interim Dividend for 2011 = OMR 5,547.280


26
CORPORATe GOVeRNANCe RePORT
In the Sultanate of Oman, Capital Market Authority implemented the Code of Governance by issuing “Code of Corporate Governance for Muscat Securities Market listed Companies” vide its Circular No. 11/2002 on June 3, 2002. Sohar Power believes that Code of Governance is an effective tool to improve operational and financial performance of listed companies. Code of Governance ensures accountability, which leads to transparency and ensuring impartial treatment to all investors. This ultimately increases the confidence of shareholders and prospective investor in the results. We confirm that we are complying with the Code and that we are aiming at the highest standards of governance and at enhancing our image as a good corporate citizen. In compliance with the Article 26 of the above Code, Sohar Power is including this separate chapter on Governance in its annual financial statements for the year ended December 31, 2011.
Board of Directors
Composition of the Board of Directors, Category of Directors, their attendance record and number of Board of Directors meeting held during the year.
name of Directors Category of DirectorsBoard Meeting held and attended during 2011 2011
AGM6 Mar 30 Apr 26 Jul 25 oct Total
Mr Murtadha Ahmed Sultan(Chairman)
Non-Executive Nominee & Independent
ü ü ü ü 4 ü
Mr Shankar Krishnamoorthy **(Vice Chairman)
Non-Executive & Independent - - - 0 -
Mr Frederic Henning (Vice Chairman)
Non-Executive & Independent ü ü ü 3
Mr C.S. BadrinathNon-Executive Nominee & Independent
ü ü ü ü 4 ü
Mr Abdulraouf AbudayyahNon-Executive Nominee & Independent
ü ü ü ü 4
Ameed Rukn Mohammad Bin Sulayem Bin Nasser Al Mazidi
Non-Executive Nominee & Independent
ü ü ü ü 4 ü
Mr Jan Vanoudendycke** Non-Executive & Independent ü ü - - 2 -
Mr Mario Savastano** Non-Executive & Independent - - - 0 -
Mr Ghassan K. Al Hashar**Non-Executive Nominee & Independent
ü - - - 1 ü
Mr Guillaume Baudet** Non-Executive & Independent - - - 0 -
Mr Johan Van Kerrebroeck Non-Executive Nominee & Independent
- ü ü 2 ü
Mr Johan de Saeger ** Non-Executive & Independent - - - 0 -
Mr Saif Abdullah Al Harthy* Non-Executive & Independent - ü 1
Mr Jean Rappe* Non-Executive & Independent - ü ü ü 3

27
name of Directors Category of DirectorsBoard Meeting held and attended during 2011 2011
AGM6 Mar 30 Apr 26 Jul 25 oct Total
Mr Navneet Kasbekar*Non-Executive & Independent
- ü ü ü 3 x
Mr Sankaran Subramaniam*
Non-Executive & Independent
- ü ü ü 3 x
Mr Marc Van Haver*Non-Executive & Independent
- ü ü 2 x
Mr Karel Breda*Non-Executive & Independent
- 0
* Appointed during the year ** Resigned during the year
Directorship / membership in other SAOG companies in Oman, held during the year.
name of Directors Position held Name of the Company
Mr Murtadha A. SultanDirectorDirector
Chairman
Gulf International ChemicalsOman Flour MillsUnited Power Company
Mr C.S. BadrinathDirectorDirector
National Finance Co.Sweets of Oman
Mr Sankaran Subramaniam Director Al Kamil Power Co. SAOG
Mr Karel Breda Director Al Kamil Power Co. SAOG
The profile of directors and management team is included as an annexure to the Corporate Governance Report.
Audit Committee
a. Brief description of terms of reference.
The primary function of the Audit Committee is to assist the Board of Directors in fulfilling its oversight responsibilities by reviewing:
¾ the financial reports and other financial information provided by the Company to any governmental body or the public;
¾ the Company’s systems of internal controls regarding finance, accounting, legal compliance and ethics that management and the Board have established; and
¾ the Company’s auditing, accounting and financial reporting processes generally.
Consistent with this function, the Audit Committee encourages continuous improvement of, and fosters adherence to, the Company’s policies, procedures and practices at all levels.
The Audit Committee’s primary duties and responsibilities are to:
¾ Serve as an independent and objective party to monitor the Company’s financial reporting process and internal control system;
¾ Review and appraise the audit efforts of the Company’s statutory and internal auditors; ¾ Provide an open avenue of communication among the statutory and internal auditors, financial
and senior management and the Board of Directors.
Board of Directors (Continued)

28
b. Composition of Audit Committee and attendance record of Committee Members.
Name of Committee Members PositionMeetings held and attended during 2011
06 Mar 30 Apr 25 Jul 25 oct Total
Mr C.S. Badrinath Chairman ü ü ü ü 4
Mr Johan Van Kerrebroeck Member ü ü ü 3
Mr Guillaume Baudet** Member ü - - - 1
Mr Karel Breda * Member - 0* Appointed during the year ** Resigned during the year
c. Activities during the year
The Audit Committee has reviewed, on behalf of the Board, the effectiveness of internal controls by meeting the Company’s internal auditor and external auditor, and reviewed the audit findings and the management letter.
In 2011, the Board of Directors, through the Audit Committee, reviewed and assessed the Company’s system of internal controls based on the audit report submitted by the Internal Auditor. The internal auditor, in coordination with the Audit Committee, has implemented a systematic review of the Company main process and ensured the effectiveness of adequate controls. Internal controls have been reviewed. Implementation of required changes and application of controls has also been audited by auditors from GDF Suez for the following processes:
¾ Customer’s payment debts ¾ Third parties management ¾ Invoicing and payment ¾ Billing and revenue ¾ Publication of regulatory information
This audit concluded that the current controls in place provide a reasonable assurance on the design and operational effectiveness of the processes and that the main risks are covered. The following processes have been reviewed in 2011 and the control activities implemented:
¾ Valuation and depreciation ¾ Financial policies and strategies ¾ Equity and debt ¾ Liquidity ¾ Access and security management ¾ Delegation of authority and delegation of signature ¾ Compliance with law and ethics
The Board of Directors also reviews the operational reports generated by the Management of the Company, which compares the budget and the actual. The Audit Committee and the Board of Directors are pleased to inform the shareholders that, in their opinion, an adequate and effective system of internal controls is in place.
PROCeSS OF NOMINATION OF DIReCTORS
The election of the Board is governed by the Company’s Articles of Association (Article 19 to 22). The Board of Directors was elected on 28 March 2009 for the term of three years and the election process was done in accordance with the amended Articles of Association of the Company. Further, as required

29
by CMA circulars, the Company obtained Nomination Form from all directors and the forms were verified to its compliance and authenticity by the Company’s Secretary and its legal counsel, before being sent to the Capital Market Authority.
ReMUNeRATION
a. Directors Remuneration and Attendance Fee.
As per Articles of Association, the Company was entitled to pay directors’ remuneration equivalent to 10% of calculated net profit. However, due to administrative decision 11/2005 issued by CMA, the Directors’ remuneration including sitting fees are restricted to 5% and is also subject to limits prescribed.
The total remuneration to the Directors were as follows:
Ro
Total sitting fee and remuneration 45,818Sitting fee (14,400)Directors’ remuneration 31,428
On the Second Board meeting on 30th April 2011, the Board resolved that the Directors’ remuneration be paid in accordance with each Director’s attendance to the meetings. This has been applied for the first time in 2011. The Board further resolved to pay a sitting fee of RO 200 to Audit Committee members.
The sitting fees paid to Directors for meetings attended during the year are given below. The Company does not pay any sitting fee for other sub-committee meetings.
# name of DirectorNo. of
meetingPaid
Total Sitting fees paid in
Ro
Total Remuneration
in Ro
1 Mr Murtadha Ahmed Sultan 4 1,600 3,492
2 Mr Shankar Krishnamoorthy** 0 - -
3 Mr Frederic Henning 3 1,200 2,6194 Mr C. S. Badrinath 4 1,600 3,4925 Mr Abdulraouf Abudayyah 4 1,600 3,492
6Ameed Rukn Mohammad Bin Sulayem Bin Nasser Al Mazidi
4 1,600 3,492
7 Mr Jan Vanoudendycke** 2 800 1,746
8 Mr Mario Savastano** 0 - -
9 Mr Ghassan Al Hashar** 1 400 873
10 Mr Guillaume Baudet** 0 - -11 Mr Johan Van Kerrebroeck 2 800 1,74612 Mr Johan de Saeger** 0 - -13 Mr Saif Abdullah Al Harthy* 1 400 87314 Mr Jean Rappe* 3 1,200 2,61915 Mr Navneet Kasbekar* 3 1,200 2,61916 Mr Sankaran Subramaniam* 3 1,200 2,61917 Mr Marc Van Haver* 2 800 1,74618 Mr Karel Breda* 0 - -TOTAL 14,400 31,428
* Appointed during the year** Resigned during the year

30
The Company will continue to pay sitting fee per Director per Board meeting amounting to RO 400 and per Audit Committee member per meeting of the Audit Committee amounting to RO 200, in the year 2012, up to a maximum of R.O. 10,000 to any individual Director.
b. Top Five Officers
The aggregate remuneration paid to the top five officers of the Company was RO 341,000. Pursuant to Management Sharing Agreement only 40% of the amount is chargeable to the Company, namely RO 136,400.
NON-COMPLIANCe PeNALTIeS
No penalties or strictures were imposed on the Company by Muscat Securities Market / Capital Market Authority or any other statutory authority on any matter related to Capital Market during the last three years.
MeANS OF COMMUNICATION WITH THe SHAReHOLDeR AND INVeSTORS
Annual accounts and quarterly accounts are put on official website of MSM as per the guidelines by the market regulators. Notice to the annual general meetings is sent by post to the registered shareholders. Further, the Board has on 25th October 2011, adopted new Procedures, Rules and Guidelines on Disclosure regulating its communication with Shareholders, in compliance with CMA guidelines.
The Chairman gives press releases in case of important news and development that arises. Such press releases are posted to the web site of MSM in accordance with the guidelines issued by the market regulators.
Disclosures to investors and Company events are disclosed on the website regularly. Information on the project, Company’s management and financial information is also available. The website is www.soharpower.com
The Company is available to meet its shareholders and their analysts on as and when need basis.
MARKeT PRICe DATA
High / Low during each month in the last financial year and performance in comparison to broad based index of MSM (service sector).
Month High Price Low Price Average PriceMSM Index
( Service Sector )Jan 1.605 1.440 1.523 2,858.380Feb 1.660 1.500 1.580 2,810.145Mar 1.645 1.540 1.593 2,733.545Apr 1.580 1.501 1.541 2,676.985May 1.580 1.550 1.565 2,639.195Jun 1.582 1.575 1.579 2,558.715Jul 1.621 1.562 1.592 2,504.880
Aug 1.750 1.615 1.683 2,415.460Sep 1.700 1.600 1.650 2,458.475Oct 1.673 1.600 1.637 2,432.725Nov 1.720 1.600 1.660 2,428.845Dec 1.690 1.600 1.645 2,498.275

31
DISTRIBUTION OF SHAReHOLDING
The Shareholder pattern as on 31 December 2011:
Category of shareholders Number of
ShareholdersTotal
ShareholdersShare capital %
Major Shareholders 7 22,184,737 79.80 %Shareholders less than 5% more than 1% - - -Shareholders below 1% 11,068 5,615,263 20.20 %TOTAL 11,075 27,800,000 100 %
PROFeSSIONAL PROFILe OF THe STATUTORY AUDITORS
The Committee has the authority to meet with internal and external auditors without management present. Each year, the Committee considers the performance of the external auditors prior to a resolution on their reappointment and remuneration at the AGM.
The Oman branch of Moore Stephens commenced practice in 1988. Over the years, the practice has developed considerably and now services a number of clients, including major listed companies, Groups, government organizations and Ministries providing either audit, tax or management consultancy services. The local staff strength is around 40, most of whom are qualified Chartered Accountants, internal auditors and information systems auditors.
Since Moore Stephens London was founded 100 years ago, the Moore Stephens International Limited network has grown to be one of the largest international accounting and consulting groups worldwide. Moore Stephens International is regarded as one of the world’s major accounting and consulting networks consisting of 301 independent firms with 636 offices and 21,197 people across 100 countries.
ACKNOWLeDGeMeNT BY THe BOARD OF DIReCTORS
The Board of Director confirms the following:
¾ Its responsibility for the preparation of the financial statements in accordance with the applicable standards and rules.
¾ Review of the efficiency and adequacy of internal control systems of Sohar Power and that it complies with internal rules and regulations.
¾ That there is no material matters that affect the continuation of the Company and its ability to continue its operations during the next financial year.

32
ANNeXURe
Brief Profiles of Directors
Name : Murtadha Ahmed Sultan – ChairmanYear of Joining : 2004Education : Graduate - Sales and Marketing ManagementExperience : Director of W. J. Towell Group of Companies
Well known in the business community, Mr Sultan has more than 30 years’ experience in different commercial fields; holding or held various positions in public, private and government organizations. Mr Murtadha Sultan is the Chairman of United Power Company. He is also a Director of Oman Flour Mills and Gulf International Chemicals.
Name : Frederic Henning – Vice ChairmanYear of Joining : 2009Education : Master Degree in Civil Engineering – University of Liege, Belgium Master of Science in Management – Boston UniversityExperience : Mr Henning has 38 years of technical, commercial and managerial experience in
the power business in the GDF Suez Group. In is currently Executive Managing Director of Gulf Total Tractebel Power Company of the Tawellah A1 Power and Desalination Plant in Abu Dhabi. He was previously CEO of Sohar Power and United Power Company. He supervised and developed the construction and commissioning of the Sohar Power plant.
Name : C.S. BadrinathYear of Joining : 2004Education : Chartered Accountant and Cost and Management AccountantExperience : Mr. Badrinath is a member of the Institute of Chartered Accountants of India
and the Institute of Cost and Works Accountants of India, and has been with the Zubair Group for the last 29 years. He has handled senior positions and important responsibilities with the Group over this period, and is presently the Chief Executive Officer of The Zubair Corporation Group. He is also a Member of the Board of the Zubair Automotive Group. Mr. Badrinath represents the Zubair Group as Director in several Joint Ventures as well as some of the public limited companies.
Name : Abdulraouf AbudayyehYear of Joining : 2004Education : B.S. Engineering Experience : Mr Abudayyeh has forty four years in Power and Desalination plants project
management and Operation Maintenance of Power and Water facilities. He is the CEO of Sogex Oman Co. LLC since 1977.

33
Name : Mohammad Bin Sulayem Bin Nasser Al MazidiYear of Joining : 2004Education : M.A. Defence Studies, Madras University, IndiaExperience : Since June 2003, Brigadier Mohammed Al Mazidi has been working as Director
General Finance and Account till 28 February 2010. Now working as Account Manager for Pilog Technology Solutions LLC. He has also been a Board member of United Power Company SAOG till March 2008 and now member of Board of Sohar Power since inauguration to date.
Name : Johan Van KerrebroeckYear of Joining : 2010Education : Master Degree Industrial Engineering Electricity Business Education-Vlerick Management School, Belgium and CEDEP/INSEAD,
FranceExperience : Mr. Johan Van Kerrebroeck is with the International Power (GDF Suez) group since
1989, and developed over this period experience in energy business in Belgium and outside Europe. Presently he is CEO of SMN Power Holding Company in the Sultanate of Oman.
Name : Saif Al HarthyYear of Joining : 2011Education : Masters in Chemical Engineering, University of Nottingham, UK Experience : Saif Al Harthy started his carrier as a field Engineer in Petroleum Development
Oman (PDO), he was involved in the design and upgrade of the major gas exporting facilities in central Oman. He later worked as a senior Business Planner for the PDO gas directorate before joining Qalhat LNG in 2006 as a Technical Coordinator, Saif is now working for Qalhat LNG as Vice President for Technical and Investments.
Name : Jean RappeYear of Joining : 2011Education : Master Degree in Electrical Engineering, University of Louvain-la-Neuve, Belgium Experience : More than 20 years of experience in IPP power business globally. Currently holding
the position of Chief Business Development for International Power (GDF Suez) in Dubai. He is responsible for all new projects developments including greenfield, merger and acquisition for the region covering Middle East, Turkey and Africa.
Name: : Navneet KasbekarYear of Joining : 2011Education: : Graduate in Commerce, Bombay University, India
Member of Institute of Chartered Accountants of IndiaExperience : Totally thirty six years of work experience in finance and managing businesses in
India and the Sultanate of Oman. Of which 31 years of experience in Oman and is currently Chief Executive Officer of Al Kamil Power Company SAOG since 2001. From 1995 to 2000. Navneet Kasbekar worked as General Manager and Director of Muscat Real Estate Development Company SAOC. From 1989 to 1995 he was a General Manager of Computer Stationary Industry SAOG and from 1981 to 1988 worked as a Finance Manager for Al Yousef International Enterprises.

34
Name : Sankaran SubramaniamYear of Joining : 2011Education : Bachelor’s Degree in Mechanical Engineering Experience : Sankaran has 31 years of technical, commercial and managerial experience in
the power business. He was Deputy Generation Coordinator for GDF Suez Energy Asia, based at Bangkok between 2008 to 2010. In the past between 1999/2000 he worked for International Power plc in London as Business Manager. He is now Senior Vice President, Asset Management in International Power (GDF Suez) for the GCC, based in Dubai.
Name : Marc Van HaverYear of Joining : 2011Education : Commercial and Enterprise Economics Engineer, Catholic University of Leuven,
Belgium. Experience : Mr. Van Haver has more than 21 years of experience in the energy business in
operations, sales & marketing and business development. He was from 2007 to 2010 Managing Director of the natural gas distribution companies in Mexico. He is now Chief Executive Officer Turkey for International Power (GDF Suez) and is based in Istanbul.
Name : Karel BredaYear of Joining : 2011Education : Master’s Degree in Applied Economics, Katholieke Universiteit Leuven, Belgium,
and MBA from the University of Chicago, USA.Experience : Karel Breda is the Chief Financial Officer of International Power Middle East,
Turkey & Africa.Prior to that, he was the Head of the Acquisitions, Investments & Financial Advisory department for International Power (GDF Suez) in the Middle East and North Africa. He has nine years of Energy Finance and Mergers & Acquisitions experience, working mainly on transactions in Europe (Italy, Poland, Belgium and the Netherlands) and in the Middle East.Landmark transactions he led in the Middle East are the project financing of Al Dur in Bahrain, Shuweihat 2 in Abu Dhabi, Riyadh IPP in Saudi Arabia and Barka 3/Sohar 2 in Oman. Prior to joining GDF SUEZ in 2002, he worked as a Strategy Consultant in a start-up strategy consulting firm specializing in e-business.

35
Brief Profile of Management Team
Under the terms of the management agreement entered with Power Management Company LLC (“PMC”) in 2009, PMC provides day to day management of Sohar Power and gives all supports by providing manpower and other infrastructure. For this PMC is paid an annual fee and its expenses. It provides the following staff to Sohar Power:
Particulars omani non-omani Total
Managers 1 4 5
Other staff 7 6 13
The management team has been empowered by the Board of Directors and jointly operates within well-defined authorization limits.
Brief profile of the current managerial team is as follows:
Name : Arnaud de Limburg StirumYear of Joining : 2008Education : Law Degree, University of Leuven, Belgium
Postgraduate in Economics and International Relations, London School of Economics, UK General Management Program – CEDEP/INSEAD, France
Experience : 13 years of experience in the field of power project development in Europe, Asia and the Middle East. He joined GDF Suez in 1999. As General Counsel for the Middle East, based in Dubai since 2004, he was instrumental in the development of International Power (GDF Suez) in the region. In his current role of CEO, he is responsible for managing the operation of the Company.
Name : Zoher KarachiwalaYear of Joining : Since inception of the Company in 2004Education : Chartered AccountantExperience : Currently Company Secretary, he was CFO until June 2009. He also acts as
Company Secretary for other GDF Suez group of companies in Oman. Mr. Karachiwala has been for 34 years in field of Statutory Audit & Accounting and Finance. He was KPMG Audit Partner in Pakistan before joining United Power Company in 1995. He acted as Honorary Chairman of Audit Committee and the Board of Directors for a public company in Oman.
Name : Sreenath HebbarYear of Joining : 2009Education : Bachelor of Engineering (Mechanical), VJTI, Mumbai University, IndiaExperience : 27 years of work experience, primarily in Business Development of Engineer
Procure Construct (EPC) Contracts in Gas Turbine based Cogeneration & Combined Cycle Power Plants. In his current position as Technical Manager, he is responsible for technical liaison with the client, statutory authorities, contractors and provides technical support to the CEO.

36
Name : S.M. Tariq
Year of Joining : Since inception of the Company in 2004
Education : MBA and ACA (Intermediate), Institute of Chartered Accountants of Pakistan
Experience : Overall 35 years of experience of External Audit, Internal Audit and Accounting & Finance. Currently, working as Chief Financial Officer of the Company. Prior to this, he was Financial Controller of United Power Company SAOG. Prior to that he had worked as Internal Auditor for National Trading Company LLC, Muscat and as External Auditor for KPMG, Muscat (Oman) and Karachi (Pakistan) Offices.
Name : Jamal Al Bloushi
Year of Joining : Since inception of the Company in 2004Education : Diploma in Computer
Experience : 17 years’ experience in administration activity including managing spare parts logistics, liaisons with government organizations, licenses, translation function and supervising local insurance programs and assisting CEO for statutory meetings.


39
Note 2011 2011 2010 2010ASSETS Ro’000 UsD’000 RO’000 USD’000Non-current assetsProperty, plant and equipment and total non-current assets
4 169,863 441,202 176,580 458,650
------------ ------------ ------------ ------------Current assetsInventories 3 c) 728 1,890 722 1,875Accounts and other receivables 5 3,103 8,060 4,443 11,540Bank balances and cash 13,729 35,661 15,168 39,398
------------- ------------- ------------ ------------Total current assets 17,560 45,611 20,333 52,813
------------- ------------- ------------ ------------Total assets 187,423 486,813 196,913 511,463
======= ======= ======= =======
EQUITY AND LIABILITIESEquityShare capital 6 27,800 72,300 27,800 72,300Legal reserve 7 1,629 4,232 1,377 3,577Retained earnings 177 367 2,358 6,032
------------- ------------- ------------- -------------Shareholders’ funds 29,606 76,899 31,535 81,909Hedging deficit 9 (26,877) (69,811) (19,420) (50,441)
------------- ------------- ------------- -------------Total equity 2,729 7,088 12,115 31,468
------------- ------------- ------------- -------------LiabilitiesNon-current liabilitiesHedging deficit 9 32,461 84,314 23,890 62,052
Non-current portion of long-term loans 10 134,979 350,595 141,781 368,262
Provision for decommissioning costs 11 1,028 2,671 967 2,512Deferred tax liability 14 4,632 12,032 4,760 12,364
------------- ------------- ------------- -------------Total non-current liabilities 173,100 449,612 171,398 445,190
------------- ------------- ------------- -------------Current liabilitiesCurrent portion of long-term loans 10 7,573 19,670 7,539 19,582Accounts and other payables 12 3,341 8,677 5,582 14,498Due to related parties 13 c) 680 1,766 279 725
------------- ------------- ------------- -------------Total current liabilities 11,594 30,113 13,400 34,805
------------- ------------- ------------- -------------Total liabilities 184,694 479,725 184,798 479,995
------------- ------------- ------------- -------------Total equity and liabilities 187,423 486,813 196,913 511,463
======= ======= ======= =======Net assets per share 19 1.065 2.77 1.134 2.95
===== ===== ===== =====
……………………… ………………………Director Director
The accompanying notes form an integral part of these financial statements.
STATeMeNT OF FINANCIAL POSITIONat 31 December 2011
40
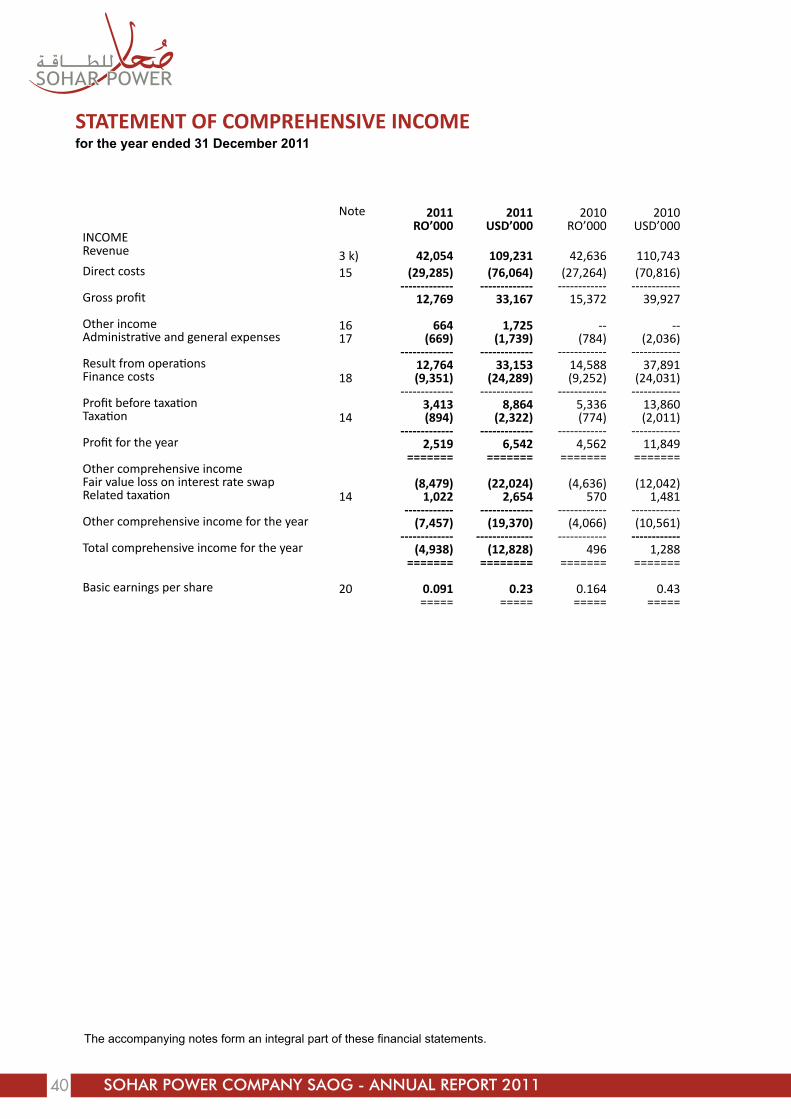
Note 2011 2011 2010 2010Ro’000 UsD’000 RO’000 USD’000
INCOMERevenue 3 k) 42,054 109,231 42,636 110,743 Direct costs 15 (29,285) (76,064) (27,264) (70,816)
------------- ------------- ------------ ------------ Gross profit 12,769 33,167 15,372 39,927
Other income 16 664 1,725 -- -- Administrative and general expenses 17 (669) (1,739) (784) (2,036)
------------- ------------- ------------ ------------ Result from operations 12,764 33,153 14,588 37,891 Finance costs 18 (9,351) (24,289) (9,252) (24,031)
------------- ------------- ------------ ------------ Profit before taxation 3,413 8,864 5,336 13,860 Taxation 14 (894) (2,322) (774) (2,011)
------------- ------------- ------------ ------------ Profit for the year 2,519 6,542 4,562 11,849
======= ======= ======= ======= Other comprehensive incomeFair value loss on interest rate swap (8,479) (22,024) (4,636) (12,042)Related taxation 14 1,022 2,654 570 1,481
------------ ------------- ------------ ------------ Other comprehensive income for the year (7,457) (19,370) (4,066) (10,561)
------------- -------------- ------------ ------------ Total comprehensive income for the year (4,938) (12,828) 496 1,288
======= ======== ======= =======
Basic earnings per share 20 0.091 0.23 0.164 0.43 ===== ===== ===== =====
STATeMeNT OF COMPReHeNSIVe INCOMefor the year ended 31 December 2011
The accompanying notes form an integral part of these financial statements.

41
Sha
re c
apita
lLe
gal
res
erve
Ret
aine
d ea
rnin
gs
Tota
l S
hare
hold
ers’
fu
nds
Hed
ging
defic
itTo
tal
Equ
ity
Tota
leq
uity
RO
’000
RO
’000
RO
’000
RO
’000
RO
’000
RO
’000
US
D’0
00(n
ote
6)(n
ote
7)(n
ote
9)
At 3
1 D
ecem
ber
2009
27,8
0092
147
629
,197
(15,
354)
13,8
43 3
5,95
6--
----
----
----
----
----
----
----
----
----
----
----
----
----
----
----
----
----
----
----
----
----
----
----
----
Tota
l com
preh
ensi
ve in
com
e fo
r th
e ye
ar:
Pro
fit fo
r th
e ye
ar--
--4,
562
4,56
2--
4,56
211
,849
Oth
er c
ompr
ehen
sive
inco
me
for
the
year
----
----
(4,0
66)
(4,0
66)
(10,
561)
----
----
----
----
----
----
----
----
----
----
----
----
----
----
----
----
----
----
----
----
----
----
----
----
----
--4,
562
4,56
2(4
,066
)49
61,
288
----
----
----
----
----
----
----
----
----
----
----
----
----
----
----
----
----
----
----
----
----
----
----
----
--P
aym
ent o
f div
iden
d fo
r th
e ye
ar 2
009
----
(2,2
24)
(2,2
24)
--(2
,224
)(5
,776
)T
rans
fer
to le
gal r
eser
ve--
456
(456
)--
----
----
----
----
----
----
----
----
----
----
----
----
----
----
----
----
----
----
----
----
----
----
----
----
----
----
At 3
1 D
ecem
ber
2010
27,8
001,
377
2,35
831
,535
(19,
420)
12,1
1531
,468
==
==
==
==
==
==
==
==
==
==
==
==
==
==
==
==
==
==
==
==
==
==
==
==
=
At
31 D
ecem
ber
201
027
,800
1,37
72,
358
31,5
35(1
9,42
0)12
,115
31,4
68--
----
----
----
----
----
----
----
----
----
----
----
----
----
----
----
----
----
----
----
----
----
----
----
----
Tota
l co
mp
reh
ensi
ve in
com
e fo
r th
e ye
ar:
Pro
fit
for
the
year
--
--
2
,519
2,
519
--
2
,519
6,54
2
Oth
er c
om
pre
hen
sive
inco
me
for
the
year
----
----
(7,4
57)
(7,4
57)
(19,
370)
----
----
----
----
----
----
----
----
----
----
----
----
----
----
----
----
----
----
----
----
----
----
----
----
----
--
2,5
19
2
,519
(7
,457
)(4
,938
)(1
2,82
8)--
----
----
----
----
----
----
----
----
----
----
----
----
----
----
----
----
----
----
----
----
----
----
----
----
Tran
sfer
to
leg
al r
eser
ve--
2
52
(252
)--
----
--P
aym
ent
of
div
iden
d
for
the
year
20
10
[no
te 8
a)]
----
(2,2
24)
(2,2
24)
--(2
,224
)(5
,776
)
Pay
men
t o
f in
teri
m d
ivid
end
fo
r th
e ye
ar 2
011
[no
te 8
b)]
----
(2,2
24)
(2,2
24)
--(2
,224
)(5
,776
)--
----
----
----
----
----
----
----
----
----
----
----
----
----
----
----
----
----
----
----
----
----
----
----
----
At
31 D
ecem
ber
201
1
2
7,80
0
1
,629
17
729
,606
(
26,8
77)
2,72
97,
088
==
==
==
==
==
==
==
==
==
==
==
==
==
==
==
==
==
==
==
==
==
==
==
==
==
The
acc
ompa
nyin
g no
tes
form
an
inte
gral
par
t of t
hese
fina
ncia
l sta
tem
ents
.
STAT
eMeN
T O
F CH
AN
GeS
IN e
QU
ITY
for
the
year
en
ded
31
Dec
emb
er 2
011
42
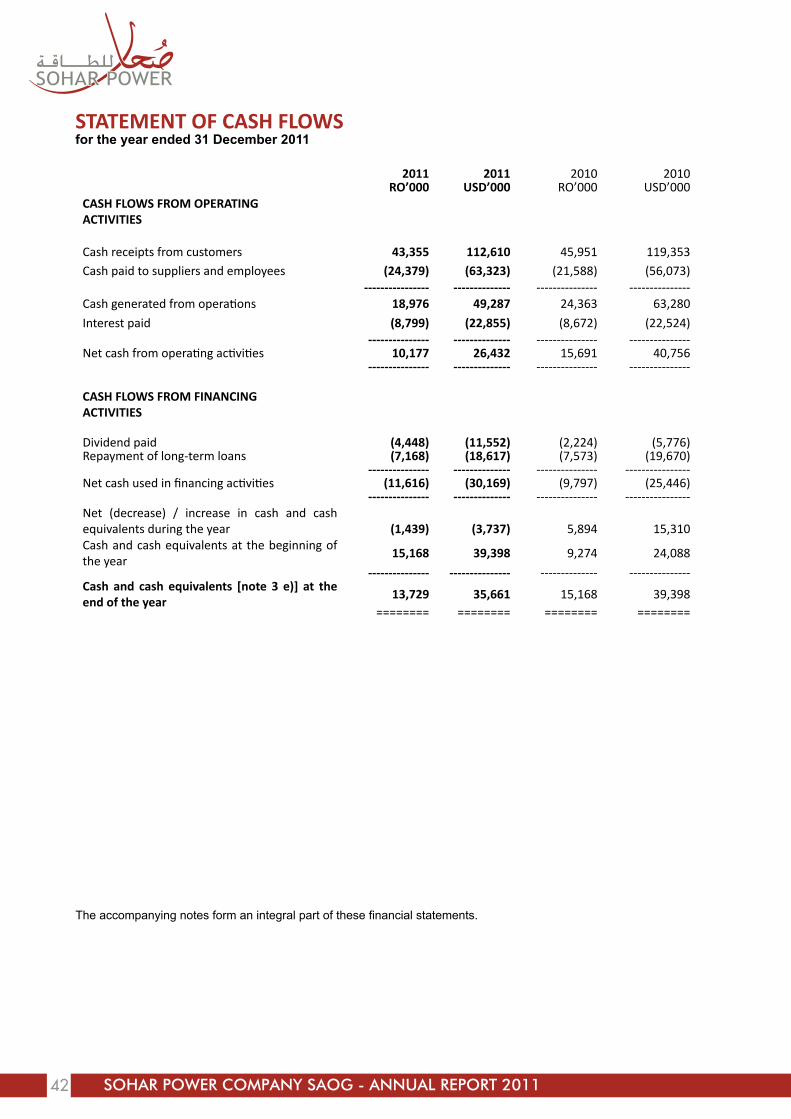
2011 2011 2010 2010Ro’000 UsD’000 RO’000 USD’000
CASH FLOWS FROM OPeRATING ACTIVITIeS
Cash receipts from customers 43,355 112,610 45,951 119,353Cash paid to suppliers and employees (24,379) (63,323) (21,588) (56,073)
---------------- -------------- --------------- ---------------Cash generated from operations 18,976 49,287 24,363 63,280
Interest paid (8,799) (22,855) (8,672) (22,524) --------------- -------------- --------------- ---------------
Net cash from operating activities 10,177 26,432 15,691 40,756 --------------- -------------- --------------- ---------------
CASH FLOWS FROM FINANCING ACTIVITIeS
Dividend paid (4,448) (11,552) (2,224) (5,776)Repayment of long-term loans (7,168) (18,617) (7,573) (19,670)
--------------- -------------- --------------- ---------------- Net cash used in financing activities (11,616) (30,169) (9,797) (25,446)
--------------- -------------- --------------- ----------------Net (decrease) / increase in cash and cash equivalents during the year
(1,439) (3,737) 5,894 15,310
Cash and cash equivalents at the beginning of the year
15,168 39,398 9,274 24,088
--------------- --------------- -------------- ---------------Cash and cash equivalents [note 3 e)] at the end of the year
13,729 35,661 15,168 39,398======== ======== ======== ========
The accompanying notes form an integral part of these financial statements.
STATeMeNT OF CASH FLOWSfor the year ended 31 December 2011
43
1. legal status and principal activities
Sohar Power Company SAOG (‘the Company’) was registered as a closed joint stock company in the Sultanate of Oman on 17 July 2004. The Company was incorporated on 22 June 2004. The Company has been established to build and operate a 585 MW electricity generating station and 33 Million Imperial Gallon per Day of water desalination plant at Sohar. The commercial operation date (“COD”) has been determined to be 28 May 2007.
The Shareholders in their Extraordinary General Meeting held on 23 March 2008 resolved to convert the Company from a closed joint stock Company into a public joint stock Company.
2. Significant agreements
The Company has entered into the following significant agreements:
a) Power and Water Purchase Agreement (“PWPA”) with the Government of Sultanate of Oman (the “Government”) granting the Company the right to generate electricity and produce water at Sohar and; (i) to make available to the Government the Guaranteed Contracted Power Capacity and the Guaranteed Contracted Water Capacity (ii) to sell to the Government the Electrical Energy and Potable Water associated with the Guaranteed Contracted Power Capacity and the Guaranteed Contracted Water Capacity. The Company has entered into a long-term power and water supply agreement with the Ministry of Housing, Electricity and Water (“MHEW”) of the Government for a period of fifteen years commencing from the scheduled Commercial Operation Date (“COD”) of 28 May 2007. On 1 May 2005 the PWPA was novated to Oman Power and Water Procurement Co SAOC (“OPWP”), a closed joint stock company owned by the Government of Oman. All the financial commitments of OPWP are guaranteed by the Government of Oman (also refer note 4);
b) Natural Gas Sales Agreement with the Ministry of Oil and Gas (“MOG”) for the purchase of natural gas from MOG. The Natural Gas Sale Agreement is co-terminus with PWPA;
c) Sub-usufruct agreement with Sohar Industrial Port Company SAOC for grant of Usufruct rights over the project site for 15 years, with the option possibility of extension of 15 years;
d) Seawater Extraction Agreement with the Ministry of National Economy of the Government of Oman, to provide seawater inlet and reject facilities for the plant. The Seawater Extraction Agreement is co-terminus with PWPA;
e) Operation and Maintenance Agreement (“O & M” Agreement) with Sohar Operation and Maintenance Company LLC, a related party, for operations and maintenance of the plant for a period of 15 years from the commercial operations date or the date of termination of PWPA, whichever is earlier; and
f) Financing Agreements with lenders for long-term loan facilities (also refer note 10).
3. Significant accounting policies
Basis of preparation
The financial statements have been prepared in accordance with International Financial Reporting Standards (IFRS) issued by the International Accounting Standards Board (IASB), interpretations issued by the International Financial Reporting Interpretations Committee (IFRIC), the requirements of the Commercial Companies Law of the Sultanate of Oman, 1974 (as amended) and the rules for disclosure requirements prescribed by the Capital Market Authority.
NOTeS TO THe FINANCIAL STATeMeNTSfor the year ended 31 December 2011

44
NOTeS TO THe FINANCIAL STATeMeNTSfor the year ended 31 December 2011 (Continued)
The financial statements have been prepared in Rials Omani and United States Dollars (USD) rounded off to the nearest thousand.
The Company has adopted the following new and revised Standards and Interpretations issued by IASB and the IFRIC, which were effective for the current accounting period:
• Amendments to IAS 24 ‘Related party disclosures’ has simplified the definition of a related party, clarifying its intended meaning and eliminated inconsistencies from the definition. The amendments have also provided a partial exemption from the disclosure requirements for government-related entities, being those entities over which the government has control, joint control or significant influence.
• Amendment to IAS 32 ‘Financial Instruments: Presentation’ issued in October 2009 deals with classification of rights issue, denominated in a currency other than the functional currency.
• Amendments to IFRIC 14 ‘IAS 19 - The Limit on a Defined Benefit Asset, Minimum Funding Requirements and their Interaction’. The amendment permits a voluntary prepayment of minimum funding contributions to be recognised as an asset.
• Annual improvements to IFRS issued in the year 2010 has resulted, amongst other amendments, changes to the following standards:
> IFRS 3 ‘Business Combinations’ addresses the transition requirements for contingent consideration from a business combination that occurred before the effective date of the revised IFRS.
> IFRS 7 ‘Financial Instruments: Disclosures’ clarifies certain disclosure requirements for financial instruments.
> IAS 1 ‘Presentation of Financial Statements’ clarifies the disclosure requirements for items in other comprehensive income.
> IAS 34 ‘Interim Financial Reporting’ emphasizes the disclosures principles in IAS 34 and adds further guidance on how to apply those principles.
> IAS 27 ‘Consolidated and Separate Financial Statements’ - consequential amendments to the transitional provisions of IAS 21, IAS 28 and IAS 31.
> IFRIC 13 ‘Customer Loyalty Programmes’ clarifies the measurement of the fair value of award credits.
• IFRIC 19 ‘Extinguishing Financial Liabilities with Equity Instruments’ deals with the issue of financial liabilities that have been extinguished through issuing equity instruments.
The management believes the adoption of the amendments has not had any material impact on the presentation and disclosure of items in the financial statements for the current year.
At the date of issue of these financial statements, the following new and revised standards were in issue but not yet effective:
• IFRS 9 ‘Financial Instruments’ was issued partially in November 2009 and October 2010 and will eventually replace IAS 39 ‘Financial Instruments: Recognition and Measurement’. The chapter issued in November 2009 related to the classification and measurement of financial assets. The chapter issued in October 2010 related to the classification and measurement of financial liabilities. An entity shall apply this IFRS for annual periods beginning on or after 1 January 2013, though earlier application is permitted.
for the year ended 31 December 2011 (Continued)
45
NOTeS TO THe FINANCIAL STATeMeNTSfor the year ended 31 December 2011 (Continued)
• Amendments to IFRS 7 ‘Financial Instruments’ issued in October 2010 helps the users of financial statements evaluate the risk exposures relating to transfers of financial assets and the effect of those risks on an entity’s financial position and will promote transparency in the reporting of transfer transactions, particularly those that involve securitization of financial assets. The amendment is effective for annual periods commencing on or after 1 July 2011.
• Amendments to IAS 12 ‘Deferred Taxes’ issued in December 2010 provides a practical approach for measuring deferred tax assets and liabilities when investment property is measured using the fair value model under IAS 40 ‘Investment Property’. The amendment is effective for annual periods beginning on or after 1 January 2012.
• Amendments to IAS 1 ‘Presentation of Financial Statements’ issued in June 2011 improves the consistency and clarity of the presentation of items of other comprehensive income. The amendment is effective for annual periods beginning on or after 1 July 2012.
• The revised IAS 19 ‘Employee benefits’ issued in June 2011 has resulted, amongst other amendments, in the removal of ‘corridor approach’ to defer some gains and losses arising from defined benefit plans. The revised IAS is effective for annual periods beginning on or after 1 January 2013.
• IFRS 10 ‘Consolidated Financial Statements’ was issued in May 2011 primarily to deal with divergence in practice in applying the existing IAS 27 ‘Consolidated and Separate Financial Statements’ and SIC 12 ‘Consolidation – Special Purpose Entities’. IFRS 10 and revised IAS 27 ‘Separate Financial Statements’ together supersede the current IAS 27 ‘Consolidated and Separate Financial Statements’. The standard requires consolidated financial statements to be prepared when an entity controls another entity. The standard provides extensive guidance on applying the principle of control. The standard is effective for annual periods beginning on or after 1 January 2013.
• IFRS 11 ‘Joint arrangements’ was issued in May 2011 and improves on IAS 31 ‘Joint ventures’ by establishing principles to the accounting for all joint arrangements. IFRS 11 also eliminates the option available for accounting of joint ventures by the proportionate consolidation method. The rights and obligations attached to a joint arrangement governs the type of arrangement and accounting treatment to be applied. The standard is effective for annual periods beginning on or after 1 January 2013.
• IFRS 12 ‘Disclosure of interest in other entities’ was issued in May 2011 and requires an entity to disclose information to evaluate the nature of, and risks associated with, its interests in other entities and effects of those interests on its financial position, performance and cash flows. The standard is effective for annual periods beginning on or after 1 January 2013.
• IFRS 13 ‘Fair value Measurements’ was issued in May 2011 and sets out in a single IFRS a framework for measuring fair values. The standard is effective for annual periods beginning on or after 1 January 2013.
The management believes the adoption of the above amendments is not likely to have any material impact on the presentation and disclosure of items in the financial statements for future periods.

46
NOTeS TO THe FINANCIAL STATeMeNTSfor the year ended 31 December 2011 (Continued)
Power and Water Purchase Agreement
The Power Capacity Investment charge rate and Water Capacity Investment charge rate in PWPA has been structured in such a way that the investment tariff rates are reducing at a constant rate each year over the term of agreement.
In 2005, IFRIC 4 (“Determining whether an arrangement contains a lease”) was issued and it became effective from 1 January 2006. The Company at that time considered the applicability of IFRIC 4, which provides guidance for determining whether an arrangement is, or contains, a lease that should be accounted for in accordance with IAS 17. If such an assessment results in an operating lease; then lease income from such an operating lease would be recognized in income on a straight line basis over the lease term, unless another systematic basis is more representative of the time pattern of the use benefit of the asset. The management has reviewed the applicability of IFRIC 4 and concluded that, although the PWPA conveys a right of use of the Company’s plant consistent with an operating lease arrangement, the income from that right is only one component of the billing arrangements. Therefore the Management’s view is that application of IFRIC 4 and IAS 17 on the overall contractual revenues will result in unfair presentation of the economic reality and would not reflect a fair value of amounts earned in any one reporting period. That view is supported in that:
o any change in the recognition of revenue from the billing pattern will not be consistent with the intention of the PWPA and other project arrangements;
o recognising income on a straight line basis without considering the pattern of related costs (such as finance costs which are significantly higher in earlier years and lower in later years) would result in uneven distribution of results of operations over the term of the contract, so that there would be lower profits in earlier years;
o the recognition of deferred revenue as a liability that arises from the application of IFRIC 4 would not be consistent with the principle that liabilities should only be recognized if an event has occurred with a ‘present obligation’.
The management believes that the gradually decreasing lease payments reflect the fair value of the consideration for the Company’s availability with respect to Electrical Energy generating capacity, and Water Output desalination capacity in the respective years, evidenced by:
o The off taker’s acceptance of the decreasing tariff, recognizing that the expense incurred by the Company to make available capacity to generate the energy and the desalinated water also follows a decreasing pattern. This pattern is driven by the importance of the debt service costs;
o The PWPA explicitly mentioning that the (frontloaded) lease payments compensate for the Company’s debt service costs that are significantly higher in the earlier years and lower in the later years; and
o The absence of any explicit claw-back provisions for the off taker with respect to the initially higher amounts of Investment Charge paid, in case of a breach of contract by the Company.
.

47
NOTeS TO THe FINANCIAL STATeMeNTSfor the year ended 31 December 2011 (Continued)
The following accounting policies have been consistently applied in dealing with items considered material to the Company’s financial statements:
a) Accounting convention
These financial statements have been prepared under the historical cost convention as modified by the measurement at fair value of certain financial instruments.
b) Property, plant and equipment
Items of property, plant and equipment are stated at cost less accumulated depreciation and impairment losses. Following initial recognition at cost, expenditure incurred to replace a component of an item of property, plant and equipment which increases the future economic benefits embodied in the item of property, plant and equipment is capitalised. All other expenditures are recognised in the statement of comprehensive income as an expense as incurred.
Items of property, plant and equipment are derecognised upon disposal or when no future economic benefit is expected to arise from the continued use of the asset. Any gain or loss arising on de-recognition of the asset is included in the statement of comprehensive income in the year the item is derecognized.
Depreciation is charged to the statement of comprehensive income on a straight-line basis over the estimated useful lives of items of property, plant and equipment. The estimated useful economic lives are as follows:
Years
Buildings 30Plant and machinery 30Technical parts 30Other assets 4Decommissioning assets 30
c) Inventories
Inventories comprise of fuel oil and are stated at lower of cost and net realisable value. Net realisable value is the estimated selling price in the ordinary course of business, less the estimated costs of completion and selling expenses. The cost of inventories is based on first-in-first-out basis and includes expenditure incurred in acquiring the inventories and includes an appropriate share of fixed and variable overheads.
d) Accounts and other receivables
Accounts and other receivables originated by the Company are measured at cost. An allowance for credit losses of accounts and other receivables is established when there is objective evidence that the Company will not be able to collect the amounts due. When an account or other receivable is uncollectible, it is written off against the allowance account for credit losses. The carrying value of accounts and other receivables approximate their fair values due to the short-term nature of those receivables.
e) Cash and cash equivalents
For the purpose of statement of cash flows, cash and cash equivalents consist of bank balances and cash and short term deposits with maturity of three months or less from the date of placement.
48
NOTeS TO THe FINANCIAL STATeMeNTSfor the year ended 31 December 2011 (Continued)
f) Impairment
Financial assets At the end of each reporting period, the management assesses if there is any objective evidence indicating
impairment of financial assets carried at cost or non collectability of receivables. An impairment loss, if any, arrived at as a difference between the carrying amount and the recoverable amount, is recognised in the statement of comprehensive income. The recoverable amount represents the present value of expected future cash flows discounted at the original effective interest rate. Cash flows relating to short term receivables are not discounted.
Non-financial assetsAt the end of each reporting period, the management assesses if there is any indication of impairment of non financial assets. If an indication exists, the management estimates the recoverable amount of the asset and recognizes an impairment loss in the statement of comprehensive income. The management also assesses if there is any indication that an impairment loss recognized in prior years no longer exists or has reduced. The resultant impairment loss or reversals are recognised immediately in the statement of comprehensive income.
g) Dividends
Dividends are recognised as a liability in the period in which they are declared.
The Board of Directors recommend to the shareholders the dividend to be paid out of Company’s profits. The Directors take into account appropriate parameters including the requirements of the Commercial Companies Law, 1974 (as amended), while recommending dividend.
h) employees’ end of service benefits
Payment is made to Omani Government’s Social Security Scheme under Royal Decree number 72/91 (as amended) for Omani employees. Provision is made for amounts payable under the Sultanate of Oman’s labour law under Royal Decree number 35 / 2003 applicable to non Omani employees’ accumulated periods of service at the end of the reporting period.
i) Provisions
A provision is recognised in the statement of financial position when the Company has a legal or constructive obligation as a result of a past event, and it is probable that an outflow of economic benefits will be required to settle the obligation.
Provision for decommissioning costsA provision for future decommissioning costs is recognised, when there is a present obligation as a result of activities undertaken, it is probable that an outflow of economic benefits will be required to settle the obligation, and the amount of provision can be measured reliably. The estimated future obligations include the costs of removing the facilities and restoring the affected areas.
The provision for future decommissioning cost is the best estimate of the present value of the expenditure required to settle the decommissioning obligation at the reporting date based on the current requirements as per the sub-usufruct agreement. Future decommissioning cost is reviewed annually and any changes in the estimate are reflected in the present value of the decommissioning provision at each reporting date.
The initial estimate of the decommissioning provision is capitalized into the cost of the asset and depreciated on the same basis as the related asset. Changes in the estimate of the provision for decommissioning is treated in the same manner, except that the unwinding of the discount is recognised as a finance cost rather than being capitalised into the cost of the related asset.

49
NOTeS TO THe FINANCIAL STATeMeNTSfor the year ended 31 December 2011 (Continued)
j) Accounts and other payables
Liabilities are recognised for amounts to be paid for goods and services received, whether or not billed to the Company.
k) Revenue
Revenue comprises tariffs for power capacity, electrical energy, water capacity and water output charges. Tariffs are calculated in accordance with the Power and Water Purchase Agreement (PWPA). The operating revenue is recognized by the Company on an accrual basis of accounting. No revenue is recognized if there are significant uncertainties regarding recovery of the consideration due and associated costs.
l) Operating lease payments
Payments made under operating leases are recognised in the statement of comprehensive income on a straight line basis over the term of the lease.
m) Borrowing costs
Borrowing costs comprise interest payable on borrowings. Borrowing costs directly attributable to the acquisition, construction or production of qualifying assets, which are assets that necessarily take a substantial period of time to get ready for their intended use or sale, are added to the cost of those assets, until such time as the assets are substantially ready for their intended use or sale. Investment income earned on the temporary investment of specific borrowings pending their expenditure on qualifying assets is deducted from the cost of those assets. All other borrowing costs are recognized as expenses in the period in which they are incurred.
n) Foreign currency transactions
Transactions denominated in foreign currencies are translated to Rial Omani at the foreign exchange rate ruling at the date of the transaction. Monetary assets and liabilities denominated in foreign currencies at the end of the reporting period are translated to Rial Omani at the foreign exchange rates ruling at that date. Foreign exchange differences arising on translation are recognised in the statement of comprehensive income.
o) Taxation
Taxation for the year comprises current and deferred tax.
Current tax is the expected tax payable on the taxable income for the year, using tax rates enacted or substantially enacted at the end of the reporting period.
Deferred tax is calculated using the liability method, providing for temporary differences between the carrying amounts of assets and liabilities for financial reporting purposes and the amounts used for taxation purposes. The amount of deferred tax provided is based on the expected manner of realisation or settlement of the carrying amount of assets and liabilities, using tax rates enacted or substantially enacted at the end of the reporting period.
A deferred tax asset is recognised only to the extent that it is probable that future taxable profits will be available against which the asset can be utilised. Deferred tax assets are reduced to the extent that it is no longer probable that the related tax benefit will be realised.
Current and deferred tax are recognised as an expense or income in the statement of comprehensive income, except when they relate to items that are recognised in statement of other comprehensive income, in which case the tax is also recognised in the statement of other comprehensive income.

50
NOTeS TO THe FINANCIAL STATeMeNTSfor the year ended 31 December 2011 (Continued)
p) Deferred financing costs
The cost of obtaining long-term financing is deferred and amortized over the term of the long-term loan using the effective interest rate method. Deferred financing costs less accumulated amortization are offset against the drawn amount of long-term loans. The amortization of deferred financing costs is capitalized as part of the cost of the plant during construction. Subsequent to plant completion, the element of amortization of deferred financing costs is charged to the statement of comprehensive income.
q) Financial liabilities
All financial liabilities are initially measured at fair value and are subsequently measured at amortised cost.
r) Derivative financial instruments
The Company holds derivative financial instruments to hedge its interest rate risk exposures. Derivatives are initially recognised at fair value at the date the derivative contract is entered into and are subsequently remeasured to their fair value at the end of each reporting period. The resulting gain or loss is recognised in the statement of comprehensive income immediately, unless the derivative is designated and effective as a hedging instrument, in which event the timing of the recognition in the statement of comprehensive income depends on the nature of the hedge relationship.
A derivative with a positive fair value is recognised as a financial asset; a derivative with a negative fair value is recognised as a financial liability. A derivative is presented as a non-current asset or a non-current liability if the remaining maturity of the instrument is more than 12 months and it is not expected to be realised or settled within 12 months. Other derivatives are presented as current assets or current liabilities.
Hedge accountingThe Company designates the hedging instrument as cash flow hedges. At the inception of the hedge relationship, the Company documents the relationship between the hedging instrument and the hedged item, along with its risk management objectives and its strategy for undertaking various hedge transactions. Furthermore, at the inception of the hedge and on an ongoing basis, the Company documents whether the hedging instrument is highly effective in offsetting changes in fair values or cash flows of the hedged item.
Cash flow hedgesThe effective portion of changes in the fair value of derivatives that are designated and qualify as cash flow hedges is recognised in the statement of other comprehensive income. The gain or loss relating to the ineffective portion is recognised immediately in the statement of comprehensive income.
Amounts previously recognised in and accumulated in statement of other comprehensive income are reclassified to statement of comprehensive income in the periods when the hedged item is recognised in the statement of comprehensive income.
Hedge accounting is discontinued when the Company revokes the hedging relationship, when the hedging instrument expires or is sold, terminated, or exercised, or when it no longer qualifies for hedge accounting.
s) Directors’ remuneration
The Company follows the Commercial Companies Law 1974 (as amended), and other latest relevant directives issued by CMA, in regard to determination of the amount to be paid as Directors’ remuneration. Directors’ remuneration is charged to the statement of comprehensive income in the year to which they relate.

51
NOTeS TO THe FINANCIAL STATeMeNTSfor the year ended 31 December 2011 (Continued)
t) estimates and judgements
In preparing the financial statements, the management is required to make estimates and assumptions which affect reported income and expenses, assets, liabilities and related disclosures. The use of available information and application of judgements based on historical experience and other factors are inherent in the formation of estimates. Actual results in future could differ from such estimates.
The estimates and assumption considered by the management to have a significant risk of material
adjustment in subsequent years primarily comprise:
• Estimation of future taxable income against which available carry forward losses will be utilized for
set off;
• Estimation of useful lives of the assets which is based on management’s assessment of various
factors such as the operating cycles, the maintenance programs and normal wear and tear using its
best estimates;
• Decommissioning costs which are based on the management’s technical assessment of the probable
future costs to be incurred in respect of the decommissioning of the plant facilities;
• Estimation is involved in the determination of the fair value of the interest rate swaps and accordingly
the amount of hedging deficit at the end of the reporting period; and
• Allowance for credit losses which is based on the management’s estimates of recoverability of the
amounts based on historical experiences.
4 Property, plant and equipment
a) The details of property, plant and equipment are set out on pages 28 and 29.
b) Land on which the power station, building and auxiliaries are constructed has been sub-leased from Sohar Industrial Port Company SAOC for a period of 15 years from the Commercial Operation Date. The sub-lease is further extendable for another 15 years (refer note 21). Lease rent is paid at the rate of approximately USD 140,000 per annum.
c) Property, plant and equipment is mortgaged against long-term loan facilities availed by the Company (note 10).
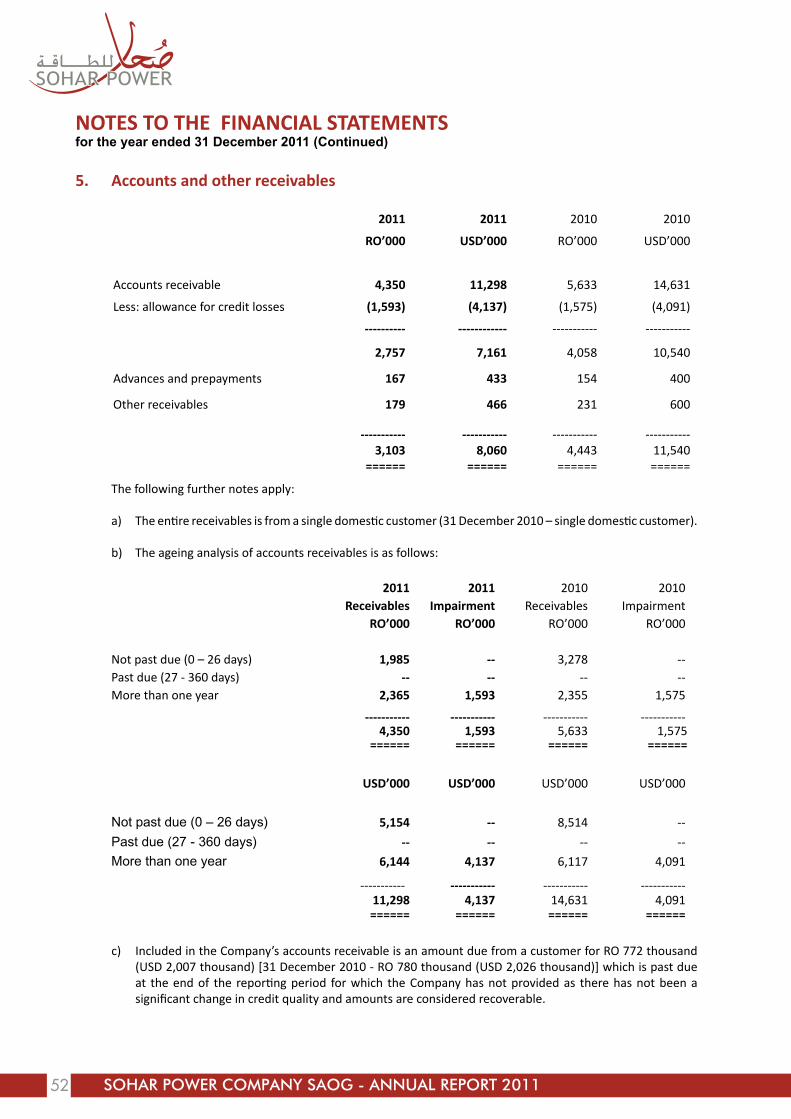
52
NOTeS TO THe FINANCIAL STATeMeNTSfor the year ended 31 December 2011 (Continued)
5. Accounts and other receivables
2011 2011 2010 2010
Ro’000 UsD’000 RO’000 USD’000
Accounts receivable 4,350 11,298 5,633 14,631
Less: allowance for credit losses (1,593) (4,137) (1,575) (4,091)
---------- ------------ ----------- -----------
2,757 7,161 4,058 10,540
Advances and prepayments 167 433 154 400
Other receivables 179 466 231 600
----------- ----------- ----------- -----------3,103 8,060 4,443 11,540
====== ====== ====== ======
The following further notes apply:
a) The entire receivables is from a single domestic customer (31 December 2010 – single domestic customer).
b) The ageing analysis of accounts receivables is as follows:
2011 2011 2010 2010Receivables Impairment Receivables Impairment
Ro’000 Ro’000 RO’000 RO’000
Not past due (0 – 26 days) 1,985 -- 3,278 --Past due (27 - 360 days) -- -- -- --More than one year 2,365 1,593 2,355 1,575
----------- ----------- ----------- -----------4,350 1,593 5,633 1,575
====== ====== ====== ======
UsD’000 UsD’000 USD’000 USD’000
Not past due (0 – 26 days) 5,154 -- 8,514 --
Past due (27 - 360 days) -- -- -- --
More than one year 6,144 4,137 6,117 4,091
----------- ----------- ----------- -----------11,298 4,137 14,631 4,091====== ====== ====== ======
c) Included in the Company’s accounts receivable is an amount due from a customer for RO 772 thousand (USD 2,007 thousand) [31 December 2010 - RO 780 thousand (USD 2,026 thousand)] which is past due at the end of the reporting period for which the Company has not provided as there has not been a significant change in credit quality and amounts are considered recoverable.

53
NOTeS TO THe FINANCIAL STATeMeNTSfor the year ended 31 December 2011 (Continued)
6. Share capital
a) At the end of the reporting period, the Company’s authorised and issued / paid up share capital is as follows:
2011 2011 2010 2010Ro’000 UsD’000 RO’000 USD’000
Authorised share capital of shares of RO 1 each 60,000 156,000 60,000 156,000
====== ====== ====== ======
Issued and fully paid up share capital of shares of RO 1 each 27,800 72,300 27,800 72,300
====== ====== ====== ======
b) At the end of the reporting period, shareholders who own 10% or more of the Company’s share capital and the number of shares they hold are as follows:
2011 2010
No of shares held %
No of shares held %
Kahrabel FZE 12,510,000 45 12,510,000 45========= ==== ========= ====
7. Legal reserve
In accordance with Article 106 of the Commercial Companies Law of the Sultanate of Oman, 1974 (as amended), 10% of the Company’s net profit for the year has been transferred to a non-distributable legal reserve until the amount of the legal reserve becomes equal to one-third of the Company’s issued share capital.
8. Dividend
a) During the year, a cash dividend declared of RO 0.080 per share for the year 2010 amounting to RO 2.2 million was paid (31 December 2010 – RO 0.080 per share for the year 2009 amounting to RO 2.2 million).
b) At the Annual General Meeting held on 30 March 2011, the Board of Directors was authorized to distribute interim dividends for the period of 1 January 2011 to 30 June 2011, subject to a ceiling of RO 0.100 per share during the year. Accordingly, an interim cash dividend of RO 0.080 per share amounting to RO 2.2 million was declared and paid during the year.

54
NOTeS TO THe FINANCIAL STATeMeNTSfor the year ended 31 December 2011 (Continued)
9. Hedging deficit
Interest rate swapThe long-term loan facilities of the Company bear interest at US LIBOR plus applicable margins (refer note 10). In accordance with the term loan agreement, the Company has fixed the rate of interest through Interest Rate Swap Agreements (“IRS”) to hedge the risk of variation in US LIBOR for 95% of its loan facility for the entire tenure of the agreement. The corresponding maximum hedged notional amount of HSBC and SCB swaps at 31 December 2011 is approximately RO 138 million (USD 359 million) [31 December 2010 - approximately RO 145 million (USD 377 million)] bearing fixed interest rates of HSBC at 5.75%, 4.50% and SCB at 5.70% per annum (31 December 2010 – HSBC at 4.25%, 2.98% and SCB at 5.70% per annum) excluding applicable margin. At 31 December 2011, the USD LIBOR was approximately 0.55% per annum, (31 December 2010 - 0.44% per annum) whereas the Company has fixed interest on its borrowing as described above.
2011 2011 2010 2010
Ro’000 UsD’000 RO’000 USD’000
Cash flow hedge
Hedging deficit (equity) 26,877 69,811 19,420 50,441
Related taxation 3,687 9,576 2,665 6,922
Ineffective portion of hedging cost 159 414 126 328
------------- ------------- ------------- -------------
Fair value of derivative financial liabilities 30,723 79,801 22,211 57,691
Interest accrual on hedging instrument 1,738 4,513 1,679 4,361
------------- ------------- ------------- -------------Hedging deficit (liability) 32,461 84,314 23,890 62,052
======= ======= ======= =======
In case, the Company terminates the IRS at 31 December 2011, it may incur losses to the extent of approximately RO 32.46 million (USD 84.31 million) [31 December 2010 - RO 23.89 million (USD 62.05 million)]. However, under the term of Loan Agreements, the Company is not permitted to terminate the interest rate swap agreements.
In accordance with ‘IAS 39 Financial Instruments: Recognition and Measurement’, the hedge is being tested at least annually for its effectiveness and consequently effective and ineffective portions are being recognized in equity and statement of comprehensive income respectively.

55
NOTeS TO THe FINANCIAL STATeMeNTSfor the year ended 31 December 2011 (Continued)
10 Long term loans 2011 2011 2010 2010
Ro’000 UsD’000 RO’000 USD’000
Base facility 122,168 317,319 128,179 332,932
Repayment facility 23,497 61,031 24,653 64,034
Less: current portion of loans (7,573) (19,670) (7,539) (19,582)
------------- ------------- ------------- -------------
138,092 358,680 145,293 377,384
Less: deferred financing cost (3,113) (8,085) (3,512) (9,122)
------------- ------------- ------------- ------------- 134,979 350,595 141,781 368,262 ======= ======= ======= =======
The following further notes apply:
a) Syndicated facilitiesThe Company has syndicated long-term loan facilities (“syndicated facilities”) in the aggregate maximum amount of USD 550 million. HSBC Bank PLC is the facility agent (“Facility Agent”) for administration and monitoring of the overall loan facilities. HSBC Bank USA – National Association and Bank Muscat have respectively been appointed as the offshore security trustee and on-shore security agent for the secured finance parties.
b) Base facilityThe Company has obtained the term loan under base facility in an aggregate amount of USD 382.50 million. The aggregate amount of base facility is repayable in 34 (thirty four) semi annual installments, of which twenty eight installments are ranging between USD 6.5 million and USD 13.2 million. The last six, post concession, installments shall be of USD 20.35 million each. Repayments under revised Base facility commenced from 30 September 2008.
c) Repayment facilityThe Company has obtained the term loan under repayment facility in an aggregate amount of USD 72 million. The aggregate amount of repayment facility is repayable in 34 (thirty four) semi annual installments, of which twenty eight installments are ranging between USD 1.2 million and USD 2.5 million. The last six, post concession, installments shall be of USD 3.91 million each. Repayments under repayment facility commenced from 30 September 2008.
d) InterestThe facilities bear interest at USD LIBOR rates plus applicable margins. The margins vary depending upon outstanding facilities.
e) Commitment and other feesUnder the terms of the loan facilities, the Company is required to pay Commitment Fees, Performance Bond Fee, Front End Fee for the facilities, Agency Fee and all Bank Fees.
f) SecurityThe facilities are secured by comprehensive legal and commercial mortgages on all the assets of the Company.
g) CovenantsThe facilities agreements contain certain covenants pertaining to, amongst other things, project finance ratios, entering into material new agreements, negative pledge, change of business, loan and guarantee, etc.
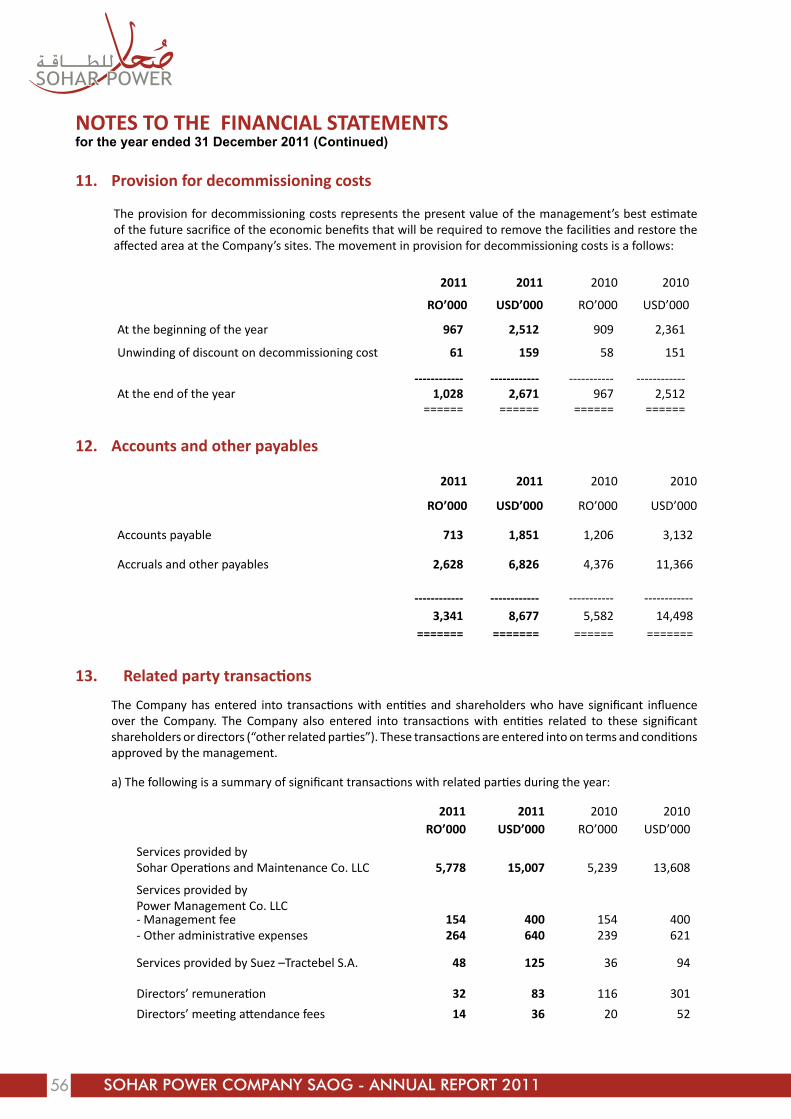
56
NOTeS TO THe FINANCIAL STATeMeNTSfor the year ended 31 December 2011 (Continued)
11. Provision for decommissioning costs
The provision for decommissioning costs represents the present value of the management’s best estimate of the future sacrifice of the economic benefits that will be required to remove the facilities and restore the affected area at the Company’s sites. The movement in provision for decommissioning costs is a follows:
2011 2011 2010 2010
Ro’000 UsD’000 RO’000 USD’000
At the beginning of the year 967 2,512 909 2,361
Unwinding of discount on decommissioning cost 61 159 58 151
------------ ------------ ----------- ------------At the end of the year 1,028 2,671 967 2,512
====== ====== ====== ======
12. Accounts and other payables
2011 2011 2010 2010
Ro’000 UsD’000 RO’000 USD’000
Accounts payable 713 1,851 1,206 3,132
Accruals and other payables 2,628 6,826 4,376 11,366
------------ ------------ ----------- ------------ 3,341 8,677 5,582 14,498======= ======= ====== =======
13. Related party transactions
The Company has entered into transactions with entities and shareholders who have significant influence over the Company. The Company also entered into transactions with entities related to these significant shareholders or directors (“other related parties”). These transactions are entered into on terms and conditions approved by the management.
a) The following is a summary of significant transactions with related parties during the year:
2011 2011 2010 2010Ro’000 UsD’000 RO’000 USD’000
Services provided by Sohar Operations and Maintenance Co. LLC 5,778 15,007 5,239 13,608
Services provided by Power Management Co. LLC- Management fee- Other administrative expenses
154264
400640
154239
400621
Services provided by Suez –Tractebel S.A. 48 125 36 94
Directors’ remuneration 32 83 116 301
Directors’ meeting attendance fees 14 36 20 52

57
NOTeS TO THe FINANCIAL STATeMeNTSfor the year ended 31 December 2011 (Continued)
b) Amounts due to related parties are interest free and repayable on demand.
c) The following are the detail of amounts due to related parties:
2011 2011 2010 2010Ro’000 UsD’000 RO’000 USD’000
Due to related partiesSohar Operations and Maintenance Co LLC 680 1,766 279 725
======= ======= ======= =======
14. Taxation
2011 2011 2010 2010
Ro’000 UsD’000 RO’000 USD’000
Statement of comprehensive income
Deferred tax charge (net)
- current year (486) (1,262) (774) (2,011)
- previous year (408) (1,060) -- --
------------- ------------- ------------- -------------(894) (2,322) (774) (2,011)
======= ======= ======= =======
Statement of other comprehensive income
Taxation credit relating to interest rate swap 1,022 2,654 570 1,481 ======= ======= ======= =======
Statement of financial position
Deferred tax liability 4,632 12,032 4,760 12,364======= ======= ======= =======
The following further notes apply:
a) The Company is subject to income tax in accordance with the income tax law of the Sultanate of Oman at the tax rate of 12% on taxable profits in excess of RO 30,000.
b) The Company’s taxation assessments for the years 2004 and 2005 have been finalized by the Secretariat General for Taxation (SGT) during the year with no additional demand for tax.
c) The Company’s taxation assessments for the years 2006 to 2010 have not been finalised by the SGT. The management believes that any additional tax assessed in respect of the above tax years would not be material to the Company’s financial position at the end of the reporting period.

58
NOTeS TO THe FINANCIAL STATeMeNTSfor the year ended 31 December 2011 (Continued)
d) The deferred tax liability and the deferred tax (charge) / credit in the statement of comprehensive
income and statement of other comprehensive are attributable to the following items:
At 31
December 2010
Recognised in the statement of
comprehensive income
Recognised in the statement
of other comprehensive
income
At 31 December
2011
Ro’000 Ro’000 Ro’000 Ro’000Interest accrual on hedging instruments 202 7 -- 209Provisions 223 (2) -- 221Tax losses 512 493 -- 1,005Fair value of hedgingInstrument 2,665 -- 1,022 3,687Depreciation (8,362) (1,392) -- (9,754)
-------------- -------------- -------------- ------------ (4,760) (894) 1,022 (4,632)======== ======== ======== =======
UsD’000 UsD’000 UsD’000 UsD’000
Interest accrual on hedging instruments 525 19 -- 544Provisions 578 (5) -- 573Tax losses 1,330 1,280 -- 2,610Fair value of hedgingInstrument 6,922 -- 2,654 9,576Depreciation (21,719) (3,616) -- (25,335)
-------------- -------------- -------------- ------------(12,364) (2,322) 2,654 (12,032)
======== ======== ======== =======15. Direct costs
2011 2011 2010 2010Ro’000 UsD’000 RO’000 USD’000
Fuel gas 14,366 37,314 13,362 34,707
O & M fee 5,531 14,366 5,239 13,608
Depreciation 6,715 17,441 6,710 17,428
Seawater extraction 663 1,721 672 1,745
Other operating expenses 2,010 5,222 1,281 3,328
------------- ------------- ------------- -------------29,285 76,064 27,264 70,816
======= ======= ======= =======
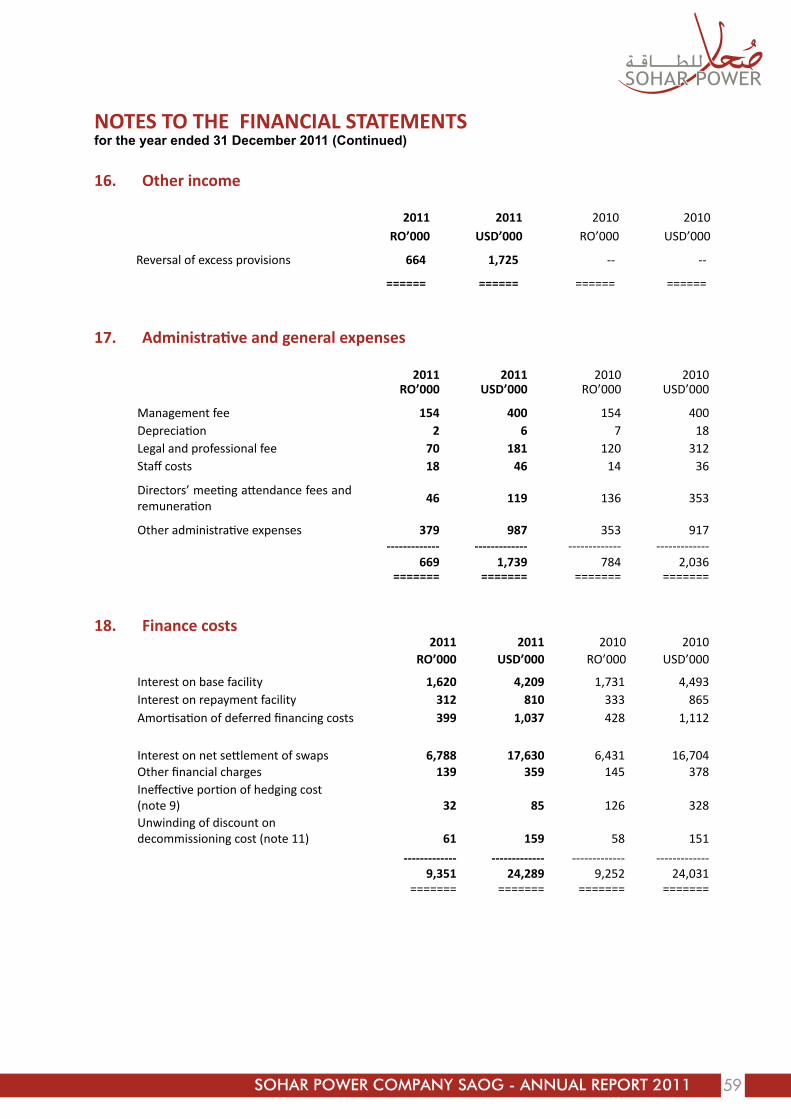
59
NOTeS TO THe FINANCIAL STATeMeNTSfor the year ended 31 December 2011 (Continued)
16. Other income
2011 2011 2010 2010Ro’000 UsD’000 RO’000 USD’000
Reversal of excess provisions 664 1,725 -- --
====== ====== ====== ======
17. Administrative and general expenses
2011 2011 2010 2010Ro’000 UsD’000 RO’000 USD’000
Management fee 154 400 154 400Depreciation 2 6 7 18Legal and professional fee 70 181 120 312Staff costs 18 46 14 36
Directors’ meeting attendance fees and remuneration
46 119 136 353
Other administrative expenses 379 987 353 917------------- ------------- ------------- -------------
669 1,739 784 2,036======= ======= ======= =======
18. Finance costs 2011 2011 2010 2010
Ro’000 UsD’000 RO’000 USD’000
Interest on base facility 1,620 4,209 1,731 4,493Interest on repayment facility 312 810 333 865Amortisation of deferred financing costs 399 1,037 428 1,112
Interest on net settlement of swaps 6,788 17,630 6,431 16,704Other financial charges 139 359 145 378Ineffective portion of hedging cost (note 9) 32 85 126 328Unwinding of discount on decommissioning cost (note 11) 61 159 58 151
------------- ------------- ------------- -------------9,351 24,289 9,252 24,031
======= ======= ======= =======

60
NOTeS TO THe FINANCIAL STATeMeNTSfor the year ended 31 December 2011 (Continued)
19. Net assets per share Net assets per share is calculated by dividing the shareholders’ funds by the number of shares at the end of the reporting period.
2011 2011 2010 2010
Ro UsD RO USD
Shareholders’ funds (in ‘000) 29,606 76,899 31,535 81,909
------------ ------------ ------------ ------------Number of shares at the end of thereporting year (in ‘000) 27,800 27,800 27,800 27,800
------------ ------------ ------------ ------------Net assets per share 1.065 2.77 1.134 2.95
====== ====== ====== ======
The management believes that the hedging deficit of RO 26.88 million (USD 69.81 million) [31 December
2010 – RO 19.42 million (USD 50.44 million)] at the end of the reporting period represents the loss which the Company would incur, if it opts to terminate its swap agreement on this date. However under the terms of its financing agreements the Company is not permitted to terminate the swap agreements. Accordingly the hedging deficit has been excluded from the shareholders’ funds.
20. Basic earnings per share Basic earnings per share is calculated by dividing the profit for the year by the weighted average number of shares issued during the year.
2011 2011 2010 2010
Ro UsD RO USD
Profit for the year (in ‘000) 2,519 6,542 4,562 11,849
------------ ------------ ------------ ------------Weighted average number of shares at the end of the reporting year (in ‘000) 27,800 27,800 27,800 27,800
------------ ------------ ----------- ------------Basic earnings per share 0.091 0.23 0.164 0.43
====== ====== ====== ======
As the Company does not have any dilutive potential shares, the diluted earnings per share is the same as the basic earnings per share.
21. Lease commitments Land on which the Sohar Power and Water Plant is constructed, has been leased from Sohar Industrial Port Company SAOC for a 15 year period [note 4 b)]. At the end of the reporting period, future minimum lease commitments under non-cancellable operating leases are as follows:
2011 2011 2010 2010Ro’000 UsD’000 RO’000 USD’000
Within 1 year 54 140 54 140
Between 2 and 5 years 217 564 217 564
After 5 years 285 740 339 880
------------ ------------- ------------- -------------556 1,444 610 1,584
======= ======= ======= =======
61
NOTeS TO THe FINANCIAL STATeMeNTSfor the year ended 31 December 2011 (Continued)
22 Subsequent events and related contingencies
During the year, the Company has encountered unexpected technical faults with two of the three gas turbines’ generators, and the same fault has been encountered subsequent to the reporting date in the third gas turbine generator. The steam turbine generator has been inspected and does not present defect. As a result of the problems encountered, the Company has incurred and expensed repair costs of RO 600,000 approximately (USD – 1.559 million) for two generators in the current year and a further RO 296,000 (USD – 769,000) is expected to be incurred and expensed in the subsequent period for repair of the third generator.
Furthermore, during the year 2011, the Company has, as a consequence, lost revenue of RO 1.915 million (USD – 4.97 million) and is likely to lose further revenue of RO 2.263 million (USD – 5.88 million) in the subsequent period as a result of the prolonged unavailability of the units.
Although the Company has insurance arrangements in place to cover both the repairs and loss of revenues from specified events, it is not yet certain how much, if any, of the revenue losses and repair costs will be recovered through insurance claims. The uncertainty arises because the root cause analysis of the defects is still ongoing, and it is too early to conclude on the exact nature of the cause.
The management’s view is that of the total anticipated repair costs and lost revenue of approximately RO 5.08 million (USD – 13.19 million), a minimum amount of RO 2.38 million (USD – 6.18 million) will be recovered from insurance claims, so that the amounts provided in the current year of RO 2.515 million (USD – 6.53 million) will cover a significant portion of the anticipated overall loss.
23 Financial risk and capital management
The Company’s activities expose it to various financial risks, primarily being, market risk (including foreign currency risk and interest rate risk), credit risk and liquidity risk. The Company’s risk management is carried out internally in accordance with the policies approved by the Board of Directors. Risk management policies and systems are reviewed regularly to ensure that they reflect any changes in market conditions and the Company’s activities.
a) Market risk
Foreign currency riskThe Company is exposed to currency risk on borrowings that are denominated in a currency other than the functional currency of Company. The currency in which these transactions are denominated is USD. In respect of Company’s transactions denominated in USD, the management believes the Company is not exposed to the currency risk as the RO is effectively pegged to the USD. At the end of the reporting period, the Company had bank balances and short term deposits denominated in USD amounting to RO 1.6 million (31 December 2010 – RO 0.9 million).
Interest rate riskThe Company’s interest rate risk arises from long-term loans availed by the Company. The Company has entered into an interest rate swap to hedge its interest rate risk exposure. Under interest rate swap contracts, the Company agrees to exchange the difference between fixed and floating rate interest amounts calculated on agreed notional principal amounts. Such contracts enable the Company to mitigate the risk of changing interest rates on the fair value of issued fixed rate debt and the cash flow exposures on the issued variable rate debt. All interest rate swap contracts exchanging floating rate interest amounts for fixed rate interest amounts are designated as cash flow hedges in order to reduce the Company’s cash flow exposure resulting from variable interest rates on borrowings. The interest rate swaps and the interest payments on the loan occur simultaneously.

62
NOTeS TO THe FINANCIAL STATeMeNTSfor the year ended 31 December 2011 (Continued)
b) Credit risk
Credit risk is the risk of financial loss to the Company if a customer or counterparty to a financial instrument fails to meet its contractual obligations, and arises principally from the Company’s receivables. At the end of the reporting period, the entire accounts receivable was from a government owned company (OPWP). The management considers the credit risk associated with the receivables to be very low because the receivables are from the Government. Furthermore, the cash and short term deposits are also placed in reputable banks, which minimize the credit risk.
c) Liquidity risk
Liquidity risk is the risk that the Company will not be able to meet its financial obligations as they fall due. The Company maintains sufficient bank balances and cash to meet the Company’s obligations as they fall due for payment.
The table below analyses the expected contractual maturities of the financial liabilities at the end of the reporting year.
31 December 2011
Carrying value
Contractual cash flow
6 months or less
6 to12 months
1 to 2 years
2 to 5 years
More than
5 yearsRo’000 Ro’000 Ro’000 Ro’000 Ro’000 Ro’000 Ro’000
Non-derivative financial liabilities A)Secured bank loans 142,552 145,665 2,973 4,600 7,754 24,864 105,474 Accounts and related party payable 4,021 4,021 4,021 -- -- -- --
Derivative financial liabilities (B)Interest rate swaps used for hedging 26,877 32,461 3,401 2,841 5,946 12,685 7,588
---------- ------------ ----------- ----------- ------------ ------------ ------------
Total (A + B) 173,450 182,147 10,395 7,441 13,700 37,549 113,062======= ======= ======= ======= ======= ======= =======
UsD’000 UsD’000 UsD’000 UsD’000 UsD’000 UsD’000 UsD’000Non-derivative financial liabilities (A)Secured bank loans 370,265 378,350 7,721 11,949 20,139 64,582 273,959
Accounts and related party payable 10,443 10,443 10,443 -- -- -- --
Derivative financial liabilities (B)Interest rate swaps used for hedging 69,811 84,314 8,833 7,380 15,444 32,948 19,709
----------- ------------ ----------- ----------- ------------ ------------ ------------Total (A + B) 450,519 473,107 26,997 19,329 35,583 97,530 293,668
======= ======= ======= ======= ======= ======= =======

63
NOTeS TO THe FINANCIAL STATeMeNTSfor the year ended 31 December 2011 (Continued)
31 December 2010
Carrying value
Contractual cash flow
6 months or less
6 to12 months
1 to 2 years
2 to 5 years
More than
5 yearsRO’000 RO’000 RO’000 RO’000 RO’000 RO’000 RO’000
Non-derivative financial liabilities (A)Secured bank loans 149,320 152,832 2,983 4,184 7,573 24,000 114,092Accounts and related party payable
5,861 5,861 5,861-- -- -- --
Derivative financial liabilities (B)Interest rate swaps used for hedging 19,420 23,890 3,279 3,380 7,811 8,375 1,045
------------ ------------ -------- -------- ------------ -------- -----------Total (A + B) 174,601 182,583 12,123 7,564 15,384 32,375 115,137
======= ======= ======= ======= ======= ======= =======
USD’000 USD’000 USD’000 USD’000 USD’000 USD’000 USD’000Non-derivative financial liabilities (A)
Secured bank loans387,844 396,966 7,749 10,868 19,670 62,339 296,340
Accounts and related party payable
15,223 15,223 15,223 -- -- -- --
Derivative financial liabilities (B)Interest rate swaps used for hedging
50,441 62,052 8,517 8,780 20,284 21,753 2,718
------------ ------------ ------------ ---------- ----------- ------------ ------------Total (A + B) 453,508 474,241 31,489 19,648 39,954 84,092 299,058
======= ======= ======= ======= ======= ======= =======
d) Capital management
The Company’s objectives when managing capital are:
o to safeguard the entity’s ability to continue as a going concern, so that it can continue to provide returns for shareholders and benefits for other stakeholders, and
o to provide an adequate return to shareholders and sustain future development of the business.
The Company has complied with externally imposed capital requirements as stipulated in the Commercial Companies Law, 1974 (as amended) and by the Capital Market Authority.
In the context of managing capital (equity), the Company has covenanted with banks providing external debt to maintain specified debt to equity ratio. At the end of the reporting period, the actual debt to equity ratio was within the covenanted level, and the Company does not therefore anticipate that covenant will require them to increase the level of capital (equity).
64
NOTeS TO THe FINANCIAL STATeMeNTSfor the year ended 31 December 2011 (Continued)
24. Fair value measurement
The management believes that the fair values of financial assets and liabilities are not significantly different from their carrying amounts at the end of the reporting period. The fair value hierarchy has the following levels:
- quoted prices (unadjusted) in active markets for identical assets or liabilities (Level 1);- inputs other than quoted prices included within Level 1 that are observable for the asset or liability,
either directly (i.e. as prices) or indirectly (i.e. derived from prices) (Level 2); and- inputs for the asset or liability that are not based on observable market data (unobservable inputs)
(Level 3).
The derivative financial liabilities with a carrying value of RO 30.7 million (USD 79.8 million) [31 December 2010 – RO 22.2 million (USD 57.6 million)] have been fair valued under the Level 2 hierarchy. There were no transfers between the Level 1 and Level 2 hierarchies in the current period.
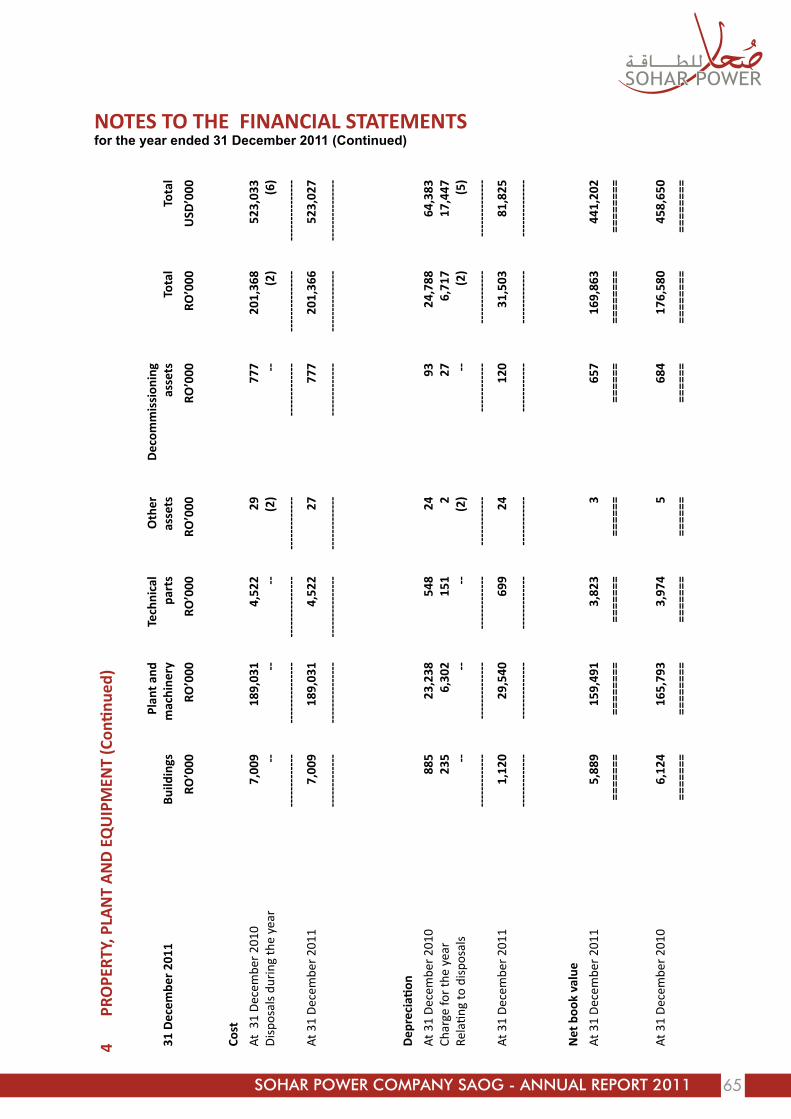
65
NOTeS TO THe FINANCIAL STATeMeNTSfor the year ended 31 December 2011 (Continued)
31 D
ecem
ber
2011
Build
ings
Pl
ant a
nd
mac
hine
ry
Tech
nica
l pa
rts
Oth
er a
sset
s D
ecom
mis
sion
ing
asse
tsTo
tal
Tota
l
Ro’0
00Ro
’000
Ro’0
00Ro
’000
Ro’0
00Ro
’000
UsD
’000
Cost
At 3
1 D
ecem
ber
2010
7,00
918
9,03
14,
522
2977
720
1,36
852
3,03
3D
ispo
sals
dur
ing
the
year
----
--(2
)--
(2)
(6)
----
----
----
---
----
----
----
---
----
----
----
---
----
----
---
----
----
----
---
----
----
----
---
----
----
----
-
At 3
1 D
ecem
ber
2011
7,00
918
9,03
14,
522
2777
720
1,36
652
3,02
7
----
----
----
---
----
----
----
---
----
----
----
---
----
----
---
----
----
----
---
----
----
----
---
----
----
----
-
Dep
reci
ation
At 3
1 D
ecem
ber
2010
885
23,2
3854
824
9324
,788
64,3
83Ch
arge
for
the
year
235
6,30
215
12
276,
717
17,4
47Re
latin
g to
dis
posa
ls--
----
(2)
--(2
)(5
)
----
----
----
---
----
----
----
----
----
----
---
----
----
----
----
----
----
----
----
---
----
----
----
--
At 3
1 D
ecem
ber
2011
1,12
029
,540
699
2412
031
,503
81,8
25
----
----
----
---
----
----
----
----
----
----
---
----
----
----
----
----
----
----
----
---
----
----
----
--
Net
boo
k va
lue
At 3
1 D
ecem
ber
2011
5,88
915
9,49
13,
823
365
716
9,86
344
1,20
2
====
===
====
====
====
===
====
====
====
====
====
====
====
At 3
1 D
ecem
ber
2010
6,12
416
5,79
33,
974
568
417
6,58
045
8,65
0
====
===
====
====
====
===
====
====
====
====
====
====
====
4 PR
OPe
RTY,
PLA
NT
AN
D e
QU
IPM
eNT
(Con
tinu
ed)

66
NOTeS TO THe FINANCIAL STATeMeNTSfor the year ended 31 December 2011 (Continued)
4 PR
OPe
RTY,
PLA
NT
AN
D e
QU
IPM
eNT
(Con
tinu
ed)
31 D
ecem
ber
2010
Build
ings
Pl
ant a
nd
mac
hine
ry
Tech
nica
l pa
rts
Oth
er a
sset
s D
ecom
mis
sion
ing
asse
tsTo
tal
Tota
l
RO’0
00RO
’000
RO’0
00RO
’000
RO’0
00RO
’000
USD
’000
Cost
At 3
1 D
ecem
ber
2009
an
d 31
Dec
embe
r 20
107,
009
189,
031
4,52
229
777
201,
368
523,
033
----
----
----
---
----
----
----
---
----
----
----
---
----
----
---
----
----
----
---
----
----
----
---
----
----
----
-
Dep
reci
ation
At 3
1 D
ecem
ber
2009
652
16,9
3839
717
6718
,071
46,9
37Ch
arge
for
the
year
233
6,30
015
17
266,
717
17,4
46
----
----
----
---
----
----
----
----
----
----
---
----
----
----
----
----
----
----
----
---
----
----
----
--
At 3
1 D
ecem
ber
2010
885
23,2
3854
824
9324
,788
64,3
83
----
----
----
---
----
----
----
----
----
----
---
----
----
----
----
----
----
----
----
---
----
----
----
--
Net
boo
k va
lue
At 3
1 D
ecem
ber
2010
6,12
416
5,79
33,
974
568
417
6,58
045
8,65
0
====
===
====
====
====
===
====
====
====
====
====
====
====
At 3
1 D
ecem
ber
2009
6,35
717
2,09
34,
125
1271
018
3,29
747
6,09
6
====
===
====
====
====
===
====
====
====
====
====
====
====


