Eur. J. Biochem. 135, 143- 149 (1983) 6:) FEBS 1983 Histones from Chinese hamster ovary cells Multiple modified forms : a quantitative approach GL-rard JOSEPH, Michele CAIZERGUES-FERRER, and FrdnGois AMALRIC Centre de Recherche de Biochimie et de Genetique Cellulaires du Centre National de la Recherche Scientifique, Toulouse (Received April S/June 8, 1983) - EJB 83 0332 A quantitative analysis of histone variants and of their modified forms in exponentially growing Chinese hamster ovary cells is described. A two-step analytical procedure has been developed. Total nuclear proteins were first fractionated on a sodium dodecyl sulfate/polyacrylamide slab gel electrophoresis. After electroelution from the corresponding bands cut out of the gel, each individual histone was analysed on an acetic acid/urea/Triton X-100 slab gel. All the variants and most of the acetylated and phosphorylated molecules were thus resolved. In absence of butyrate, we have detected four, three and two different levels of acetylation respectively for H4, H3, H2A and H2B. Scanning of the stained gel has allowed the determination of the relative amount of each forms. H3 and H4 present a higher turnover of the acetate groups than H2A and H2B. For the four histones, acetate label appeared preferentially in the multi-acetylated forms then gradually in the less acetylated forms. The data suggest that the deacetylation- acetylation process of a given histone molecule involves all the acetate groups of the molecule (three for a triacetylated histone, one for a monoacetylated histone). The main structural function of histones is to package DNA into nucleosomes [l, 21. This function has placed severe constraints on the types of amino acid substitutions that a histone can accomodate. This selective constraint is reflected in the highly conserved sequence of each histone when examined in an evolutionary context. Although a histone may be evolutionarily conserved, recent reports indicate that there is a diversity of forms within a histone family. Several variants have been detected which are related by amino acid substitutions [3] or that diverged by insertions and deletions [4,5]. Furthermore, another level of complexity involves postsynthetic modifi- cations such as acetylation, phosphorylation, methylation and ubiquitin addition [6-81. Histone H2A appeared to be a heterogenerous family of eight protein species in mouse cells 151. H2AX, H2AZ and ubiquitin-H2A complexes are different enough in sizes to be separated by electrophoresis on sodium dodecyl sulfate gels, while other H2A forms, differing by point mutations, can only be resolved in the presepce of non-ionic detergent (Triton X-100) on acid/urea gels [3]. The existence of such heterogeneous variants has also been reported for the histone H2B of sea urchin [9, 101. In contrast, only point mutation variants have been detected for H3 [3]. The relative amounts of each variant, which may change during em- bryogenesis [I I], could play a role in the functional differen- tiation of parts of chromatin 151. However, the quantification of the different species has been difficult to achieve since the acidic extraction of total histones routinely used, results in an unequal solubilization [I 2, 131. Among histone modifications, phosphorylation and acetylation are the most abundant 161. These modifications could reflect local or general alterations in chromatin structure and be involved in different functions. For example, an increase in histone phosphorylation appears to be related to the chromatin condensation process [I41 while the Abbreviations. CHO cells, Chinese hamster ovary cells; SDS, sodium dodecyl sulfate; HMG, high-mobility-group proteins. actively transcribed chromatin, which is more sensitive to nuclease, possesses a higher proportion of acetylated histones than the bulk of chromatin, although hyperacetylation of H4 cannot be directly correlated with transcriptional activity [I 5, 161. The distribution of modified histones along the DNA, as well as their role in the general organization of chromatin, are still unknown. The relative proportion of the modified mol- ecules has only been determined in cells grown in the presence of butyrate, which causes acetylated species to accumulate [I 7, 181. Recently, a quantitative determination of modified H2A.1 molecules showed an unsuspectedly high level of acetylated molecules [ 191. In this paper, we present a quantitative analysis of vari- ants and modified histones using a method developed in our laboratory [I 31. Histones were first fractionated on sodium dodecyl sulfate gels which allowed a complete recovery of the different species and then each protein was analysed on acetic acid/urea/Triton X-100 polyacrylamide gels. Most of the variants and of the modified forms were thus resolved. Acetylated and phosphorylated histones were further charac- terised from cells labeled with [3H]acetate or [32P]ortho- phosphate. MATERIALS AND METHODS Cell culture and fructionntion Chinese hamster ovary cells were grown in monolayer culture in Falkon flasks [20]. Cells were labeled with ["]acetate for 15 min at 37 ' C (0.5 mCi/ml, 3 Ci/inmol; Amersham International, England). For [32P]orthophosphate labeling, cells were preincubated for 1 h in Eagle's minimum essential medium without phosphate, then labeled for 4 h in the presence of 0.01 vol. complete medium [I 31. After labeling, cells were harvested and nuclei prepared according to Zalta et al. [21]. Proteolytic inhibitors (1 mM phenylmethylsulfonyl fluo-
Histones from Chinese hamster ovary cells Multiple modified forms : a quantitative approach
GL-rard JOSEPH, Michele CAIZERGUES-FERRER, and FrdnGois AMALRIC Centre de Recherche de Biochimie et de Genetique Cellulaires du Centre National de la Recherche Scientifique, Toulouse
(Received April S/June 8, 1983) - EJB 83 0332
A quantitative analysis of histone variants and of their modified forms in exponentially growing Chinese hamster ovary cells is described. A two-step analytical procedure has been developed. Total nuclear proteins were first fractionated on a sodium dodecyl sulfate/polyacrylamide slab gel electrophoresis. After electroelution from the corresponding bands cut out of the gel, each individual histone was analysed on an acetic acid/urea/Triton X-100 slab gel. All the variants and most of the acetylated and phosphorylated molecules were thus resolved. In absence of butyrate, we have detected four, three and two different levels of acetylation respectively for H4, H3, H2A and H2B. Scanning of the stained gel has allowed the determination of the relative amount of each forms. H3 and H4 present a higher turnover of the acetate groups than H2A and H2B. For the four histones, acetate label appeared preferentially in the multi-acetylated forms then gradually in the less acetylated forms. The data suggest that the deacetylation- acetylation process of a given histone molecule involves all the acetate groups of the molecule (three for a triacetylated histone, one for a monoacetylated histone).
The main structural function of histones is to package DNA into nucleosomes [ l , 21. This function has placed severe constraints on the types of amino acid substitutions that a histone can accomodate. This selective constraint is reflected in the highly conserved sequence of each histone when examined in an evolutionary context. Although a histone may be evolutionarily conserved, recent reports indicate that there is a diversity of forms within a histone family. Several variants have been detected which are related by amino acid substitutions [3] or that diverged by insertions and deletions [4,5]. Furthermore, another level of complexity involves postsynthetic modifi- cations such as acetylation, phosphorylation, methylation and ubiquitin addition [6-81. Histone H2A appeared to be a heterogenerous family of eight protein species in mouse cells 151. H2AX, H2AZ and ubiquitin-H2A complexes are different enough in sizes to be separated by electrophoresis on sodium dodecyl sulfate gels, while other H2A forms, differing by point mutations, can only be resolved in the presepce of non-ionic detergent (Triton X-100) on acid/urea gels [3]. The existence of such heterogeneous variants has also been reported for the histone H2B of sea urchin [9, 101. In contrast, only point mutation variants have been detected for H3 [3]. The relative amounts of each variant, which may change during em- bryogenesis [I I], could play a role in the functional differen- tiation of parts of chromatin 151. However, the quantification of the different species has been difficult to achieve since the acidic extraction of total histones routinely used, results in an unequal solubilization [I 2, 131. Among histone modifications, phosphorylation and acetylation are the most abundant 161. These modifications could reflect local or general alterations in chromatin structure and be involved in different functions. For example, an increase in histone phosphorylation appears to be related to the chromatin condensation process [I41 while the
Abbreviations. CHO cells, Chinese hamster ovary cells; SDS, sodium dodecyl sulfate; HMG, high-mobility-group proteins.
actively transcribed chromatin, which is more sensitive to nuclease, possesses a higher proportion of acetylated histones than the bulk of chromatin, although hyperacetylation of H4 cannot be directly correlated with transcriptional activity [I 5, 161. The distribution of modified histones along the DNA, as well as their role in the general organization of chromatin, are still unknown. The relative proportion of the modified mol- ecules has only been determined in cells grown in the presence of butyrate, which causes acetylated species to accumulate [ I 7, 181. Recently, a quantitative determination of modified H2A.1 molecules showed an unsuspectedly high level of acetylated molecules [ 191.
In this paper, we present a quantitative analysis of vari- ants and modified histones using a method developed in our laboratory [I 31. Histones were first fractionated on sodium dodecyl sulfate gels which allowed a complete recovery of the different species and then each protein was analysed on acetic acid/urea/Triton X-100 polyacrylamide gels. Most of the variants and of the modified forms were thus resolved. Acetylated and phosphorylated histones were further charac- terised from cells labeled with [3H]acetate or [32P]ortho- phosphate.
MATERIALS AND METHODS
Cell culture and fructionntion
Chinese hamster ovary cells were grown in monolayer culture in Falkon flasks [20]. Cells were labeled with ["]acetate for 15 min at 37 ' C (0.5 mCi/ml, 3 Ci/inmol; Amersham International, England). For [32P]orthophosphate labeling, cells were preincubated for 1 h in Eagle's minimum essential medium without phosphate, then labeled for 4 h in the presence of 0.01 vol. complete medium [I 31. After labeling, cells were harvested and nuclei prepared according to Zalta et al. [21]. Proteolytic inhibitors (1 mM phenylmethylsulfonyl fluo-
144
ride, 1 mM diisopropylfluorophosphate and 10 pM leupeptin) and inhibitors of dephosphorylation [5 mM 53‘ dithio-bis(2- nitrobenzoic acid)] and of deacetylase ( 5 mM sodium butyrate) were included in all buffers. During the fractionation. all the histones remained in the nuclear fraction.
Elect ropho ret ic analysis
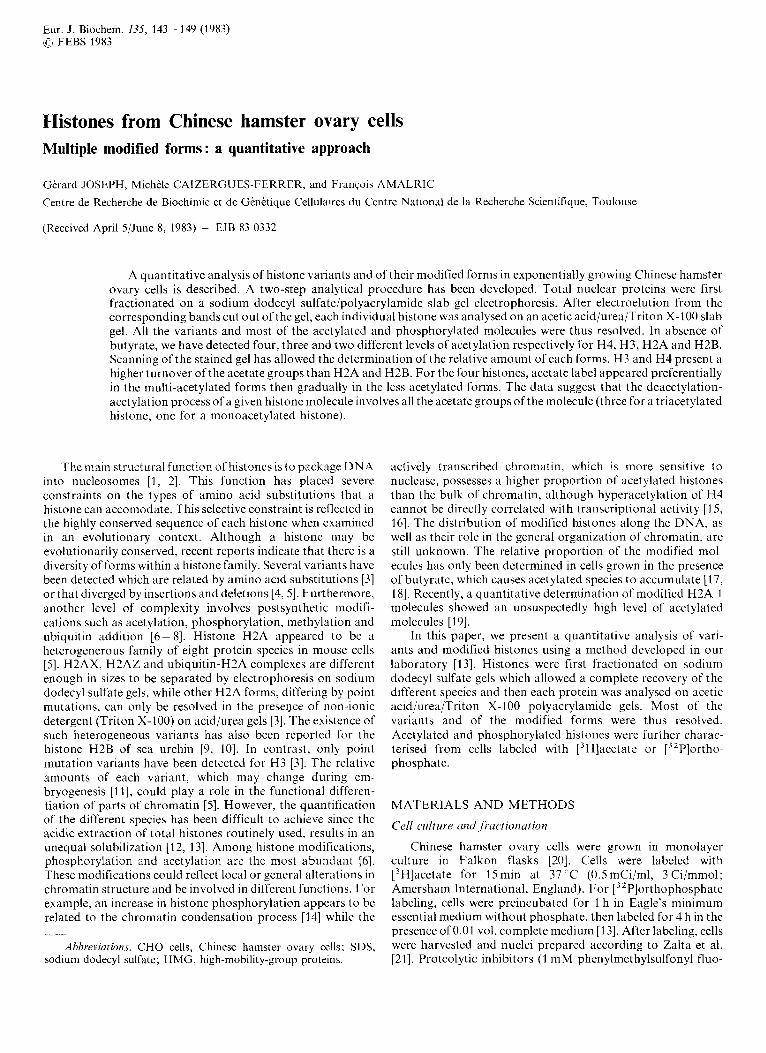
400pg of nuclear proteins were resuspended in 1 ml of sample buffer (2 w/v sodium dodecyl sulfate, 2 M urea, 26 ”/: w/v Ficoll, 5 :4 v/v mercaptoethanol, 10 mM Tris/HCl pH 8.3). After sonication (1 min at 4 ‘-C under a nitrogen current), the sample was loaded onto a preparative sodium dodecyl sulfate 15-22?; gradient polyacrylamide slab gel [13]. After 15 h of electrophoresis at 25 mA, the gel was rapidly stained with Coomassie blue. After destaining, bands corresponding to histones were cut out, placed into a dialysis bag and electro- eluted for 15 h at 40 mV. The electroelution was carried out with Laemmli buffer containing 2 2-mercaptoethanol[22]. Eluted samples were then precipitated with 25 (x trichloroacetic acid and, after 30 min at 4 T, centrifuged for 30 min at 100000 x g. The pellets were washed with acetone and after dissolution analysed on an acetic acid/urea/Triton X-I 00 slab gel, 12 04, w/v acrylamide [23]. H2A, H3 and H4 were fractionated in gels containing 6 mM Triton, 7.5 M urea. H2B was fractionated in gels containing 6 m M Triton, 6 M urea. After staining with amid0 black and &staining, gel bands were cut out, put in vials and the proteins were hydrolysed overnight in 1 ml 30 cx H,O, at 37 ‘C and incorporated radioactivity counted in a liquid scintillator. Stained gels wcrc scanned with a Vcrnon apparatus.
Fig. 1. Preparative sodiunz dodec.yl sulfate gels qf totul nuclearproteins. Nuclei were solubilized in the sample buffer and, after a I-min sonication, proteins were analysed by polyacry1;rmide gradient slab gel electrophoresis (15-22”;). The gel was stained with Coomassic blue
RESULTS
Analysis qf histone variants
The four core histones were well separated by SDS/poly- acrylamide slab gel electrophoresis (Fig. 1). All the variants of a species with the same apparent molecular weight co- migrate. After staining of the gel the four bands were excised and the proteins were electroeluted from the gel slices [13]. Each individual histone was then analysed on an acetic acid/urea/Triton polyacrylamide gel which allowed the sepa- ration of the variants and of the forms that are modified by acetylation and phosphorylation (Fig. 2). A quantitative anal- ysis of the different variants was carried out by densitometric scanning of the stained gels and counting of the uniformly labeled proteins hydrolysed out of the gel. The unmodified fraction migrated the fastest and was called b,. For each variant, four different fractions that migrated slower than b, were excised and sequentially designated b, to b,. In order to detect the acetylated and phosphorylated forms, cells were labeled with [3H]acetate or [32P]orthophosphate and the incorporated radioactivity was determined in each gel band (b, - b4). In some cases, comigration of a modified variant species with another modified variant species was observed (H2B and H3). In all this study, the acetate labeling was carried out in exponentially growing cells. Some [3H]acetate radioac- tivity was recovered in the unmodified species (b,), this was predominantly derived from contamination of b, by the monoacetylated form b,. A low level of label incorporated into the protein backbone cannot be excluded but does not alter the quantitative analysis presented.
As shown in Table 1, all the core histones were labeled with [“]acetate in exponentially growing cells. However, the level
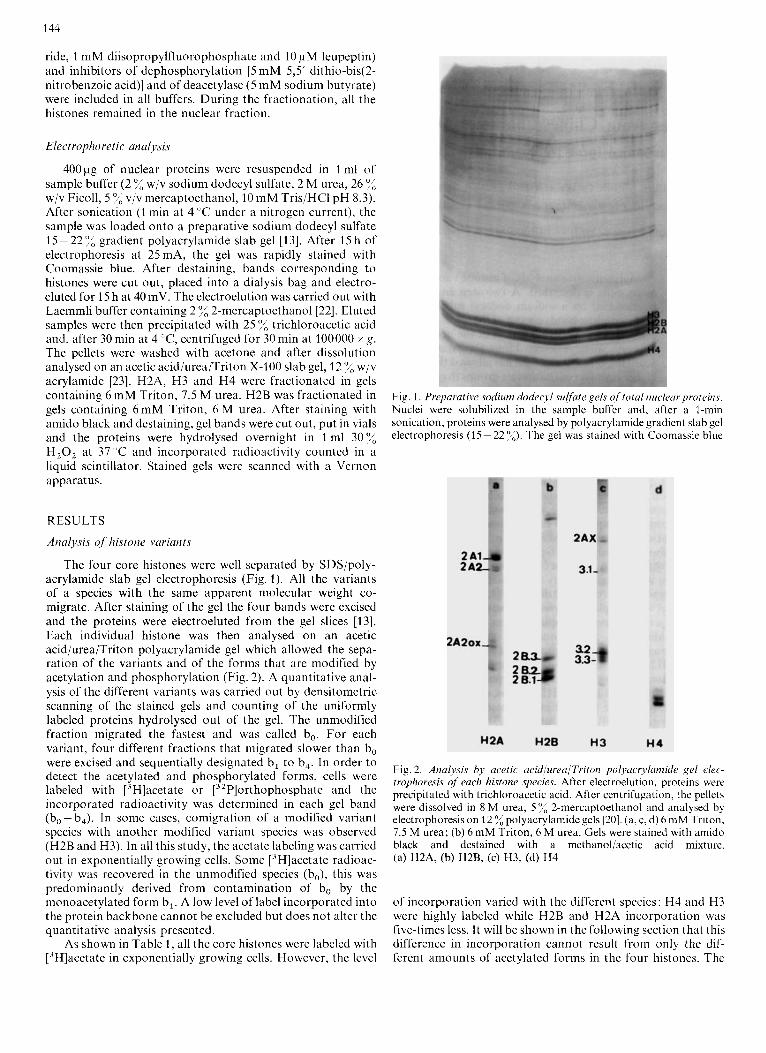
Fig. 2. Ana1ysi.c. by acetic ucid/ureu/Triton polyucryluniide gel elec- trophoresis qf each histone species. After electroelution, proteins were precipitated with trichloroacetic acid. After centrifugation, the pellets were dissolved in 8 M urea, 5 :4 2-mercaptoethanol aiid analysed by electrophoresis on 12 p.olyacrylamide gels [20]. (a, c, d) 6 mM Triton, 7.5 M urea; (b) 6 mM Triton, 6 M urea. Gels were stained with amido black and destained with a methanol/acetic acid mixture. (a) H2A, (b) H2B, (c) H3, (d) H4
of incorporation varied with the different species: H4 and H3 were highly labeled while H2B and H2A incorporation was five-times less. It will be shown in the following section that this difference in incorporation cannot result from only the dif- ferent amounts of acetylated forms in the four histones. The
145
H2A family incorporates the most [32P]phosphate while the three others are labeled considerably less, their specific activity was 2-10'x of H2A. The direct determination on the SDS/polyacrylamide gel will result in an over-evaluation of the 32P incorporation into H3 since H2A-X, which is highly phosphorylated, comigrates with it (Fig. 2c). The phosphory- lated forms migrate near the monoacetylated form and between that and the diacetylated form. Gels were cut in such a way that the monoacetylated and phosphorylated forms were recovered in the b, fractions [13].
H2A. In exponentially growing CHO cells, three H2A variants are detected. H2A. 1 and H2A.2 were separated from
Table I . Levels o f histotle ucetplutiori und phospliorylution Nuclei were prepared froin cells uniformly labeled with [32P]orthophosphate or [3H]acetate. After separation by electro- phoresis on sodium dodecyl sulfate/polyacrylamide gels, the individual histone species were electroeluted and rerun on a Triton/acid/urea gel. The amount of each histone was determined by densitometric scanning of the stained gel and the incorporated radioactivity after hydrolysis of the gel bands. The specific activity (radioactivity/relative absorbance) is then calculated and the results are expressed as the ratio of the specific activity of each histone to the specific activity of H2A
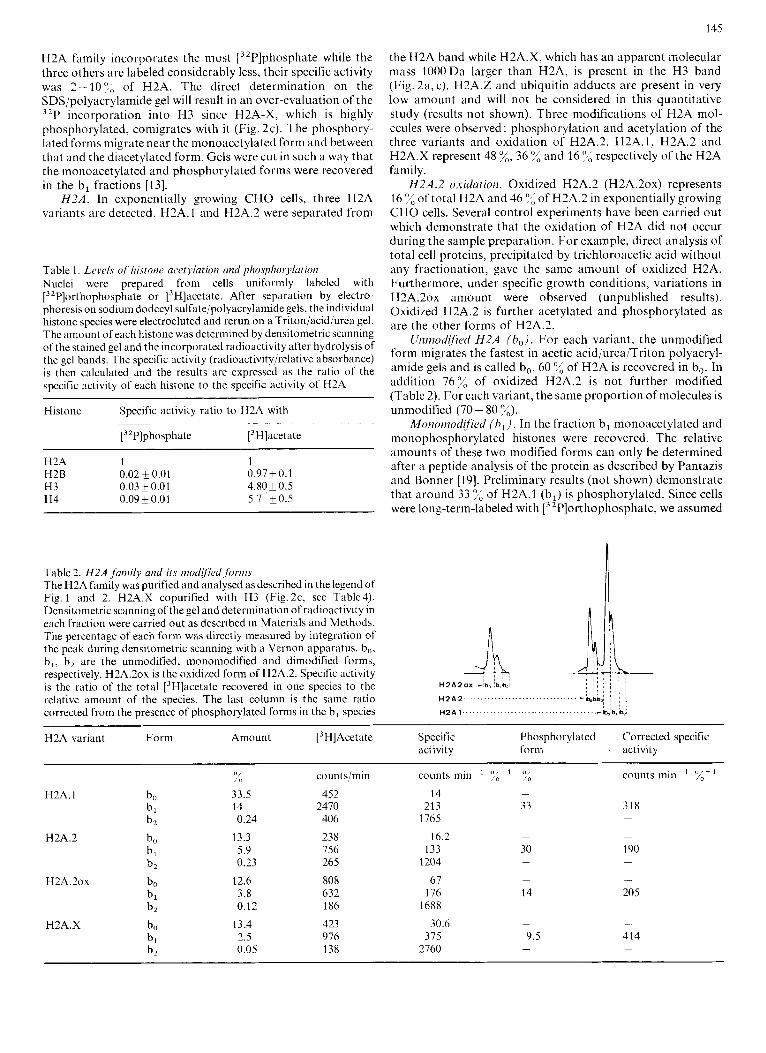
Table 2. H2A family and its mud(fic~d,fiirn~.r The H2A family was purified and analysed as described in the legend of Fig. 1 and 2. H2A.X copurified with H3 (Fig.2c, see Table4). Densitometric scanning of the gel and determination of radioactivity in each fraction were carried out as described in Materials and Methods. The perccntage of each form was directly measured by integration of the peak during densitometric scanning with a Vernon apparatus. b,,, b,, bZ are the unmodified, monomodified and dimodified forms, respectively. H2A.20~ is the oxidized form of H2A.2. Specific activity is the ratio of the total [3H]acetate recovered in one species to the relative amount of the species. The last column is the same ratio corrected from the presence of phosphorylated forms in the b , species
the H2A band while H2A.X, which has an apparent molecular mass l 0 0 0 D a larger than H2A, is present in the H3 band (Fig. 221, c). H2A.Z and ubiquitin adducts are present in very low amount and will not be considered in this quantitative study (results not shown). Three modifications of H2A mol- ecules were observed : phosphorylation and acetylation of the three variants and oxidation of H2A.2. H2A.1, H2A.2 and H2A.X represent 48 x, 36 % and 16 7; respectively of the H2A family.
H2A.2 oridnrion. Oxidized H2A.2 (H2A.20~) represents 16 7; of total H2A and 46 ?( of H2A.2 in exponentially growing CHO cells. Several control experiments have been carried out which demonstrate that the oxidation of H2A did not occur during the sample preparation. F o r example, direct analysis of total cell proteins, precipitated by trichloroacetic acid without any fractionation, gave the same amount of oxidized H2A. Furthermore, under specific growth conditions, variations in H2A.20~ amount were observed (unpublished results). Oxidized H2A.2 is further acetylated and phosphorylated as are the other forms of H2A.2.
Unniodifi'ed H2A (b,). F o r each variant, the unmodified form migrates the fastest in acetic acid/urea/Triton polyacryl- amide gels and is called b,. 60 % of H2A is recovered in b,. In addition 7 6 % of oxidized H2A.2 is not further modified (Table 2). For each variant, the same proportion of molecules is unmodified (70- 80 "/,).
hfOi70t770dified (b i ) . In the fraction b, monoacetylated and monophosphorylated histones were recovered. The relative amounts of these two modified forms can only be determined after a peptide analysis of the protein as described by Pantazis and Bonner [19]. Preliminary results (not shown) demonstrate that around 33 "/, of H2A.1 (b,) is phosphorylated. Since cells were long-term-labeled with [32P]orthophosphate, we assumed
n I b
" 2 A 1.. ...................................
H2A variant Form Amount [3H]Acetate Specific Phosphorylated Corrected specific activity form . activity
H2A.1 bo bl b2
H2A.2 bo b, b2
H2A.20~ bo bl b2
bl b2
H2A.X
V,!
33.5 14 0.24
13.3 5.9 0.23
12.6 3.8 0.12
13.4 2.5 0.05
counts/min 452
2470 406 238 756 265 808 632 186 423 976 138
counts min-' "/b 14
213 1765
16.2 133
1204 67
176 1688
375 2760
30.6
~
30
-
9.5 -
counts min-' ':<-I
-
318 -
-
20 5 -
-
414 -
146
that the different H2A variants which bear a single phosphate group present the same specific activity. This assumption allows the calculation of the relative amounts of each phos- phorylated variant (30 %, 14% and 9.5 '%; respectively for b, : H2A.2, H2A.20~ and H2A.X). As shown in Table2, labeled acetate is highly incorporated in the b, fraction of all the variants. Taking into account the relative amount of the conlaminating phosphorylated forms, we have calculated the specific activity of the acetylated molecules. It increases from 200 counts min-' %-' for H2A.2 to 400 counts inin-' for H2A.X.
Dinzodifi'ed (b2 ) . The b, fraction migrates slower than b, and can barely be detected by densitometric scanning of the stained gel. The relative amounts of these dimodified forms is under 0.5% of total H2A which results in an inaccurate determination of the specific activity. However, a large amount of ['Hlacetate is incorporated (Table 2) and the specific activity is ten-times higher than in the monoacetylated form. No [32P]phosphate was detected in this fraction suggesting that neither a diphosphorylation or a phosphorylation of the monoacetylated form of H2A occurred.
Triacetylated H2A were not detected in H2A.1 and H2A.X, no labeled acetate being present in the b3 fraction.
H2B. Good separation of the three H2B variants was obtained by electrophoresis on acid/urea gels containing 6 M urea. The three main bands and two bands with a slower migration than H2B.3 were excised and incorporation of labeled acetate was determined. As shown in Table 3, labeled acetate was recovered in the main H2B.2 fraction. According to the variation in migration observed after addition of an acetate group to the histone molecule (Fig. 2), we assume that the b, H2B.2 band comigrated with the monoacetylated form of H2B.1 (bl). Moreover, H2B.2 (b,) was contaminated by H2B.1 (bJ. To calculate the relative percentage of these forms, we assumed that the acetate was incorporated similarly in the three variants and that the specific activities of their b, and b, forms wereidentical. H2B.1 is the main variant and represents around 67% of the total H2B while H2B.2 and H2B.3 are present in similar amounts. Around 20"/, of each variant is monoacet- ylated (bl). The percentage of diacetylated molecules is very low, especially for H2B.1 (bJ. The high level of labeled acetate in H2B.3 (b,) can arise from contamination by the diacetylated H2B.2 (b2) or by a triacetylated H2B.2 [I81 or from unusual incorporation in the backbone.
H3. Three H3 variants are resolved by acetic acid/urea/ Triton polyacrylamide gel electrophoresis (Fig. 2), H3.1, which migrates the slowest, is separated into modified mono and diacetylated forms. H3.2 and H3.3 migrate closely and the polyacetylated forms of H3.3 comigrate with H3.2 (Table4). Between H3.1 and H3.2 at least five different proteins are detected that could correspond to H M G proteins [3]. However, all five of these species must have the same apparent molec- ular weight as H3, according to our purification procedure. The possibilities that they are unknown variants of H3 cannot be ruled out.
of the H3 family. Labeled acetate is recovered in bl and b, forms. As shown in Table 5 , an important amount of acetate is present in the b, form. It could correspond to a contamination by acetylated forms of the unknown proteins migrating slower than H3.1 (b"). The specific activities of the mono and diacetylated H3.1 are almost identical to H3.3 (b,) and H3.2 (bJ, respectively, which have been determined directly.
H3.2 and H3.3. In calculating the relative amount of proteins that comigrate, H3.2(b0) with H3.3 (bZ) and H3.2(b,)
H3.1. H3.1 represents 7.1
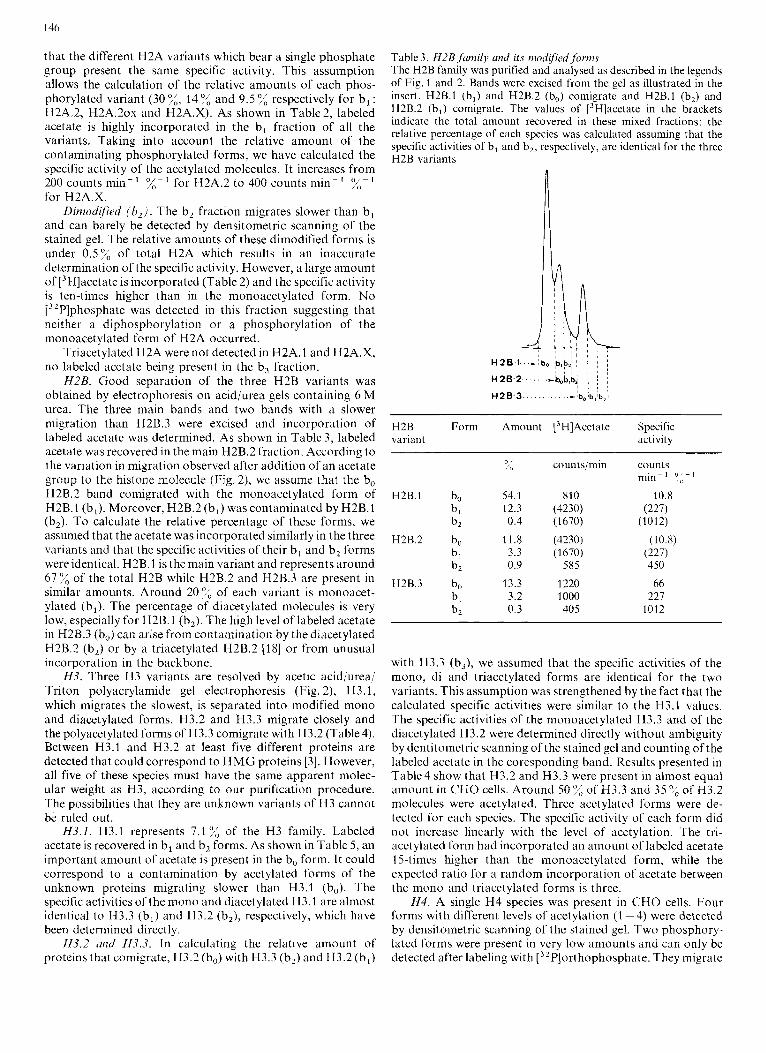
Table 3. H2B family and its rnodifiiedfornzs The H2B family was purified and analysed as described in the legends of Fig. 1 and 2. Bands were excised from the gel as illustrated in the insert. H2B.1 (b,) and H2B.2 (b,) comigrate and H2B.1 (b,) and H2B.2 (b,) comigrate. The values of [3H]acetate in the brackets indicate the total amount recovered in these mixed fractions: the relative percentage of each species was calculated assuming that the specific activities of b, and b,, respectively, are identical for the three H2B variants
I ; &
. .-:bo :b,lb, I 8 , H2B.3 . . . . .
H2B Form Amount [3H]Acetate Specific variant activity
H2B.1 b, bl b2
bl b*
bl b,
H2B.2 b,
H2B.3 b,
O /
54. 1 12.3 0.4
11.8 3.3 0.9
13.3 3.2 0.3
counts/min
810 (4230) (1670)
(4230) (1670)
585
1220 1000 40 5
~
count? m l n - l 0 - 1
10.8 1
(227) (1012)
(227) (20.8)
450 66
227 1012
with H3.3 (b3), we assumed that the specific activities of the mono, di and triacetylated forms are identical for the two variants. This assumption was strengthened by the fact that the calculated specific activities were similar to the H3.1 values. The specific activities of the monoacetylated H3.3 and of the diacetylated H3.2 were determined directly without ambiguity by dentitometric scanning of the stained gel and counting of the labeled acetate in the coresponding band. Results presented in Table4 show that H3.2 and H3.3 were present in almost equal amount in CHO cells. Around 50 :,; of H3.3 and 35 of H3.2 molecules were acetylated. Three acetylated forms were de- tected for each species. The specific activity of each form did not increase linearly with the l e d of acetylation. The tri- acetylated form had incorporated an amount of labeled acetate 15-times highcr than the monoacetylated form, while the expected ratio for a random incorporation of acetate between the mono and triacetylated forms is three.
H 4 . A single H4 species was present in CHO cells. Four forms with different levels of acetylation (1 -4) were detected by densitometric scanning of the stained gel. Two phosphory- lated forms were present in very low amounts and can only be detected after labeling with [3ZP]orthophosphate. They migrate
147
A
IW, j ~ i4Lk - 2.3. . ; ' 8 1 : ; ;
I H3.2 . . . _ ._ bob,&
, ' / I ' I "
Table4. Relative proportion of H3.2 arid H3.3 modifivd..nf&tt?s The H3 family was purified and analysed as described in the legend of Fig. 1 and 2. Bands were excised from the gel as shown in the insert. H3.3 (b2) and H3.2 (b,) comigrate and H3.3 (b,) and H3.2 (b,) comigrate. Calculation of the relative percentage of the different forms is carried out as described in Table 3
Migration position Amount [3H]Acetate Form Relative proportion of
H 3.3-lbo bpb,; ' I ! ~ I I I I
H 2 A X ...............................................
~ .- - ~ ~ ~~
total H3.3 H3.2
H 3.1.. ....................................
~~
counts/min '%; ~ ~~
%
1. 27.9 1040 H3.3 bo 27.9 50.3
2. 25.2 10 783 H3.3 bl 25.2 45.7
3. 40.5 (4608) H3.3 b2 1.35 2.4
4. 17.5 (1 2231) H3.3 b, 0.75 1.4
H3.2 bo 39.2 66.0
H3.2 b, 16.7 28.1
5. 3.2 7 450 H3.2 bz 3.2 5.4
6. 0.3 2030 H3.2 b, 0.3 0.5
Table 5. H3 ,family and its rnod(fiedforrns The experimental procedures are as described in Tables2 and 3. The results are calculated as in Table 4
Table 6. H4 mod(f2edforms The experimental procedure is described in the legends to Fig. 1 and 2 and Table2
H3 Form Amount [3H]Acetate Specific variant activity
between the acetylated forms [13]. The relative percentage of the acetylated forms was dependent on cell growth conditions. In exponentially growing cells 47 %, of H4 was unmodified and 36% was monoacetylated. The specific activities of the mul- tiacetylated forms were higher than the calculated values obtained assuming that the addition of one, two and three acetate groups t o a inonoacetylated form must increase the specific activity by a factor of 2, 3 and 4 respectively (Table 6).
DISCUSSION
We have characterised histone variants and their modified forms from exponentially growing Chinese hamster ovary cells. The fractionation technique that we utilized allowed us t o
quantify, without ambiguity, most of the modified species. The main improvements of this technique result from the initial isolation of the histone species from SDS/polyacrylamide gels, thus obviating the need for acidic extraction of histones [12]. In CHO cells, more than 90'x of H2A and H2B are extracted by the acidic treatment of nuclei while almost 50 of H3 and H 4 remains in the acid-insoluble fraction [13]. It should be noted that the less extracted species (H3 and H4) are the most acetylated. In order t o separate the variant species, the acid- extracted proteins were routinely separated by bidimensional electrophoresis which makes quantification by densitometric
148
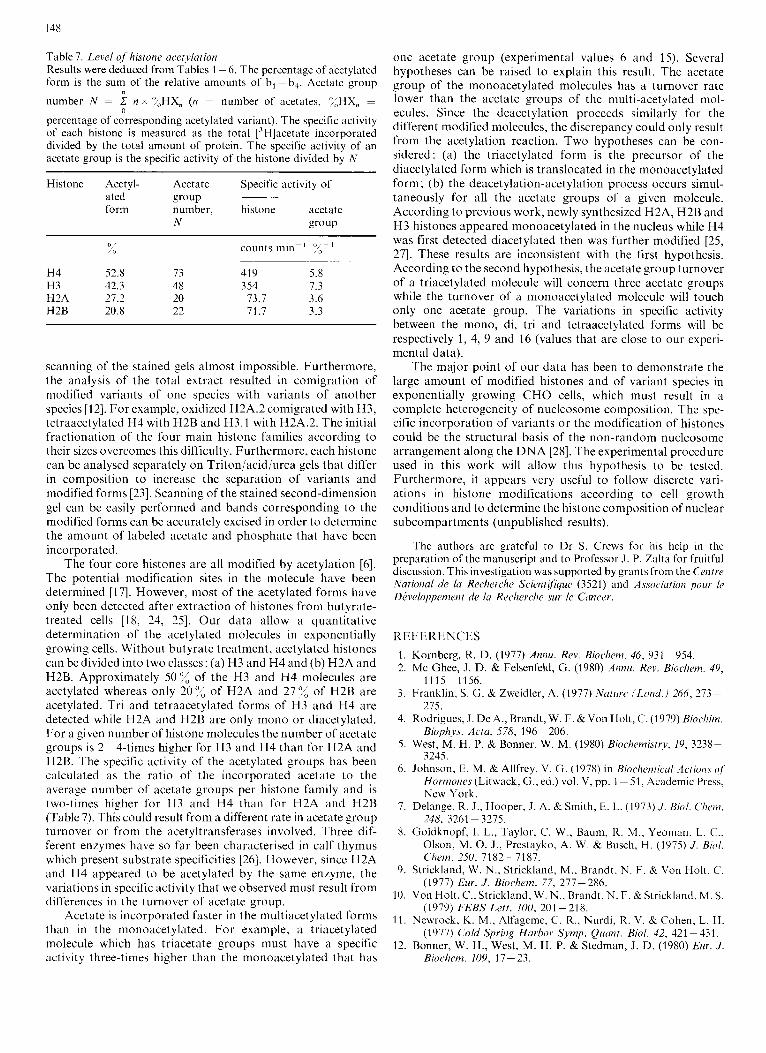
Table 7. Level of liistone acetylutiun Results were deduced from Tables 1 - 6. The percentage of acetylated form is the sum of the relative amounts of b, - b,. Acetate group number N = C n x "/,HX,, (n = number of acetates, OAHX, =
percentage of corresponding acetylated variant). The specific activity of each histone is measured as the total [3H]acetate incorporated divided by the total amount of protein. The specific activity of an acetate group is the specific activity of the histone divided by N
" 0
~~~
Histone Acetyl- Acetate Specific activity of ~~ ated group
scanning of the stained gels almost impossible. Furthermore, the analysis of the total extract resulted in comigration of modified variants of one species with variants of another species [12]. For example, oxidized H2A.2 comigrated with H3, tetraacetylated H 4 with H2B and H3.1 with H2A.2. The initial fractionation of the four main histone families according to their sizes overcomes this difficulty. Furthermore, each histone can be analysed separately on Triton/acid/urea gels that differ in composition to increase the separation of variants and modified forms [23]. Scanning of the stained second-dimension gel can be easily performed and bands corresponding t o the modified forms can be accurately excised in order t o determine the amount of labeled acetate and phosphate that have been incorporated.
The four core histones are all modified by acetylation [6]. Thc potential modification sites in the molecule have been determined [17]. However, most of the acetylated forms have only been detectcd after extraction of histones from butyrate- treated cells [18, 24, 251. O u r data allow a quantitative determination of the acetylated molecules in exponentially growing cells. Without butyrate treatment, acetylated histones can be divided into two classes: (a) H 3 and H 4 and (b) H2A and H2B. Approximately 5 0 ' x of the H 3 and H 4 molecules are acetylated whereas only 20';; of H2A and 2704 of H2B are acetylated. Tri and tetraacetylated forms of H 3 and H 4 are detected while H2A and H2B are only mono o r diacetylated. For a given number of histone molecules the number of acetate groups is 2- 4-times higher for H 3 and H 4 than for H2A and H2B. The specific activity of the acetylated groups has been calculated as the ratio of the incorporated acetate to the average number of acetate groups per histone family and i s two-times higher for H3 and H 4 than for H2A and H2B (Table 7). This could result from a different rate in acetate group turnover or from the acetyltransferases involved. Three dif- ferent enzymes have so far been characterised in calf thymus which present substrate specificities [26]. However, since H2A and H 4 appeared to be acetylated by the same enzyme, the variations in specific activity that we observed must result f rom differences in the turnover of acetate group.
Acetate i s incorporated faster in the multiacetylated forms than in the monoacetylated. F o r example, a triacetylated molecule which has triacetate groups must have a specific activity three-times higher than the monoacetylated that has
one acetate group (experimental values 6 and 15). Several hypotheses can be raised to explain this result. The acetate group of the monoacetylated molecules has a turnover rate lower than the acetate groups of the multi-acetylated mol- ecules. Since the deacetylation procccds similarly for the different modified molecules, the discrepancy could only result from the acetylation reaction. Two hypotheses can be con- sidered: (a) the triacetylated form is the precursor of the diacetylated form which is translocated in the monoacetylated form; (b) the deacetylation-acetylation process occurs simul- taneously for all the acetate groups of a given molecule. According to previous work, newly synthesized H2A, H2B and H3 histones appeared monoacetylated in the nucleus while H 4 was first detected diacetylated then was further modified [25, 271. These results are inconsistent with the first hypothesis. According t o the second hypothesis, the acetate group turnover of a triacetylated molecule will concern three acetate groups while the turnover of a monoacetylated molecule will touch only one acetate group. The variations in specific activity between the mono, di, tri and tetraacetylated forms will be rcspcctivcly 1, 4, 9 and 16 (values that are close to our experi- mental data).
The major point of our data has been to demonstrate the large amount of modified histones and of variant species in exponentially growing C H O cells, which must result in a complete heterogeneity of nucleosome composition. The spe- cific incorporalion of variants o r the modification of histones could be the structural basis of the non-random nucleosome arrangement along the D N A [28]. The experimental procedure used in this work will allow this hypothesis to be tested. Furthermore, it appears very useful t o follow discrete vari- ations in histone modifications according t o cell growth conditions and to determine the histone composition of nuclear subcompartments (unpublished results).
The authors are grateful to Dr S. Crews for his hclp in thc preparation of the manuscript and to Professor J . P. Zalta for fruitful discussion. This investigation was supported by grants from the Ceiitre Natiorial de la Recherche Scicwtzfl'yue (3521) and Association poiir le DPveloppement cle h Recherche sur 10 Cancer.
REFERENCES 1. 2.
3.
4.
5.
6.
7.
8.
9.
10.
11.
12.
Kornberg, R. D. (1977) Annu. Rev. Biochem. 46, 931-954. Mc Ghee, J. D. & Felsenfeld, G. (1980) Anizu. Rev. Biochem. 49,
Franklin, S . C . & Zweidler, A. (1977) Nutiire (Lorid.) 266, 273-
Rodrigues, J . De A., Brandt, W. F. &VonHolt, C. (1979) Biochim.
West, M. H. P. & Bonner, W. M. (1980) Biochemistry, 19, 3238- 3245.
Johnson, E. M . & Allfrey, V. G. (1978) in BiochemicuI Actions of' Hormones (Litwack, G., ed.) vol. V, pp. 1 - 51, Academic Press, New York.
Delange, R. J., Hooper, J. A. & Smith, E. L. (1973) J . Biol. C ~ h e r ~ ,
Goldknopf, I. L., Taylor, C. W., Baum, 11. M., Yeoman, L. C., Olson, M. 0. J., Prestayko, A. W. & Busch, H. (1975) J . B id . Chenz. 250, 7182-7187.
Strickland, W. N., Strickland, M., Brandt. N. F. & Von Holt, C . (1977) Eur. J . Biochem. 77, 277-286.
Von Holt, C., Strickland, W. N., Brandt, N. F. & Strickland, M. S.
Newrock, K. M., Alfageme, C. R., Nurdi, R. V. & Cohen, L. H. (1977) Cold Spring Harbor Synip. Quant. Bid. 42, 421 -431.
Bonner, W. H., West, M. H. P. & Stedman, J. D. (1980) Eur. J . Rioclzem. 109, 17- 23.
11 15- 1156.
275.
Bi0phy.Y. Actg, 578, 196-206.
248, 3261 - 3215.
(1979) FEBS Left. 100, 201-218.
149
13. Joseph, G., Caizergues-Ferrer, M., Amalric, F. & Zalta, J . P. (1981) Bioclzem. Biophys. Res. Commun. 1110, 738- 745.
14. Halleck, M. S. & Gurley, L. R. (1980) ESP. Cell Res. 125, 377- 388.
IS. Allfrey, V. G. (1977) in Chromutiri and Cliromosorue Structure (Li, H. J . & Eckhardt, R. A,, eds), pp. 167- 192, Academic Press, New York.
16. Oliva, R. & Mezeprita, C. (1982) Nudeic Acid RPS. 10, 8049- 8059.
17. Isenberg, I . (1979) Annu. Rev. Biocliem. 48, 159- 191. 18. Georgieva, E. I., Pashev, I. G. & Tsanev, R. G. (1982) Arch.
19. Pantazis, P. & Bonner, W. M. (1981) J . Biol. Chem. 256, 4669- Biocliem. Biopliys. 216, 88-92.
4675.
20. Caboche, M. & Bachellerie, J . P. (1977) Eur. J . Biochern. 74, 19-
21. Zalta,J.,Zalta,J.P.&Siinard, R.(1971)J. Ce//Biol.5/,563-568. 22. Laemmli, U. K. (1970) Nuture (Lorid.) 227, 680-685. 23. Zweidler, A. (1978) Methocis Cell Biol. 17, 223-232. 24. Riggs, M. G., Whittaker, M. G., Neumann, J. R. & Ingram, V. M.
25. Sealy, L. 61 Chalkley, R . (1978) Cell, 14, 115-121. 26. Sures, I . & Gallwitz, D. (1980) Bioclzemistry, 19, 943-951. 27. Ruiz-Carrillo, A,, Wangh, L. J. & Allfrey, V. G. (1975) Scieizc,e
28. Igo-Kemenes, T., Horz, W. & Zachau, H. G. (1982) Aunu. Rev.
29.
(1977) Nuturc (Lond.) 268, 462- 464.
( W U S ~ . DC) 190, 117-128.
Biochem. 51, 89- 121.
G. Joseph, M. Cai~ergues-Ferrer, and F. Amalric, Centre de Recherche dc Biochimie et de Genetique Cellulaires d u Centre National de la Rechcrchc Scicntifique, 11 8 Route de Narbonne, F-31062 Toulouse-Cedcx, Haute-Garonne, France