Historic Eastern United States Winter Storm of 22-24 January 2016: Record snow along the megalopolitan corridor by Richard H. Grumm National Weather Service State College, PA 16803 1. Introduction An historic storm brought record to near record snows from the Washington, DC area to New York City. Table 1 lists sites which set new snowfall records for the event. The estimated liquid equivalent precipitation (QPE: Fig. 1) showed a stripe of high precipitation which fell mainly as snow (Fig. 2) form south-central Kentucky into eastern Pennsylvania and a second strip over southern New York. Higher QPE amounts were located in the Washington-Baltimore region. Snowfall totals in the New York metropolitan area ranged from 23.4 inches at Islip, 26.8 inches in central Park, to 30.5 inches at JFK in Queens County. Table 2 lists the 48 locations in central Pennsylvania that received 24 or more inches of snow. The top two sites, Mechanicsburg and Somerset had 36.9 and 35.8 inches respectively. Harrisburg International Airport had 30.2 inches, a new record snowfall. Shepherdstown and Glengary had 42 and 40.5 inches in West Virginia. Reports of over 30 inches were common in portions of Maryland and West Virginia. The impacts of the storm on transportation were considerable. AMTRAK canceled trains in the northeast corridor (AP 2016a; AP 2016B) and most of the major airports were closed which led to the cancelation of thousands of flights (AP 2016C). The storm also produced power outages to hundreds of thousands of customers and produced record to near record coastal flooding from the Delmarva to New York City. The storm developed from a disturbance which moved across the United States on 21-23 January 2016 (Fig. 3). A relatively strong 500 hPa short-wave moved into the southern plains on 22 January deepening as it moved eastward and then up the East Coast. There was relatively strong confluence ahead of the shortwave and in implied jet entrance region over the northeastern United States. The surface low tracked out fo the southern Plains (Fig. 4) and up the East Coast. Most of the snow and heavy snow fell in the gradient between the surface anticyclone to the north and the developing surface cyclone. In the CFS re-analysis the cyclone was about -3σ below normal. As with most meteorologically and climatological significant snowstorms (Stuart and Grumm 2009), the heavies snow fell in close proximity to a strong low-level jet (LLJ: Fig. 5). The 850 hPa u-wind anomalies were -3 to -6σ below normal at the height of the storm. The 850 hPa winds peaked in the Mid-Atlantic region (Fig. 5c-d) and along the southern New England coast (Figs.5d-e) with -5 to 6σ 850 hPa u-wind anomalies. The strong LLJ likely led to the strong winds, blizzard conditions, and severe coastal flooding (WP 2016 ) in Delaware and New Jersey. The storm surge and flooding in some locations was reported to have exceeded the record levels set in Sandy in October 2012. Not surprisingly, both events were characterized by strong easterly flow and -6σ 850 hPa u-wind anomalies with wind speeds over 70kts. Cape
Transcript
Historic Eastern United States Winter Storm of 22-24 January 2016: Record snow along the megalopolitan corridor
by Richard H. Grumm
National Weather Service State College, PA 16803
1. Introduction
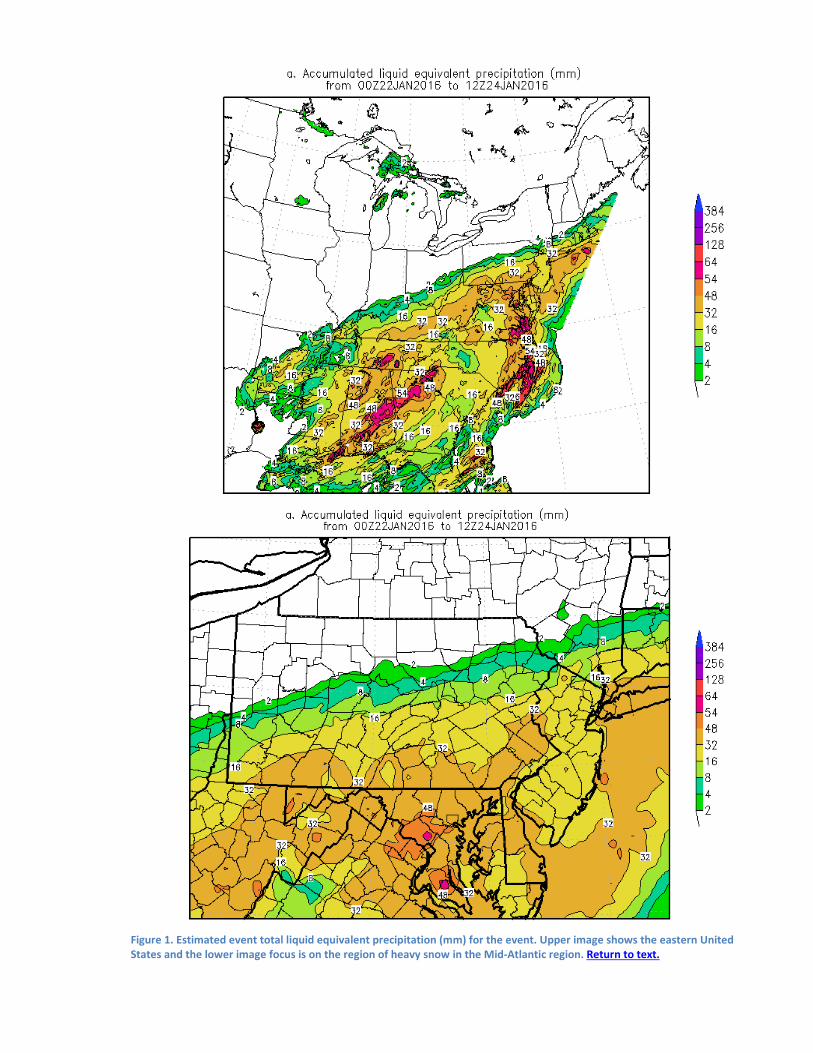
An historic storm brought record to near record snows from the Washington, DC area to New York City. Table 1 lists sites which set new snowfall records for the event. The estimated liquid equivalent precipitation (QPE: Fig. 1) showed a stripe of high precipitation which fell mainly as snow (Fig. 2) form south-central Kentucky into eastern Pennsylvania and a second strip over southern New York. Higher QPE amounts were located in the Washington-Baltimore region. Snowfall totals in the New York metropolitan area ranged from 23.4 inches at Islip, 26.8 inches in central Park, to 30.5 inches at JFK in Queens County.
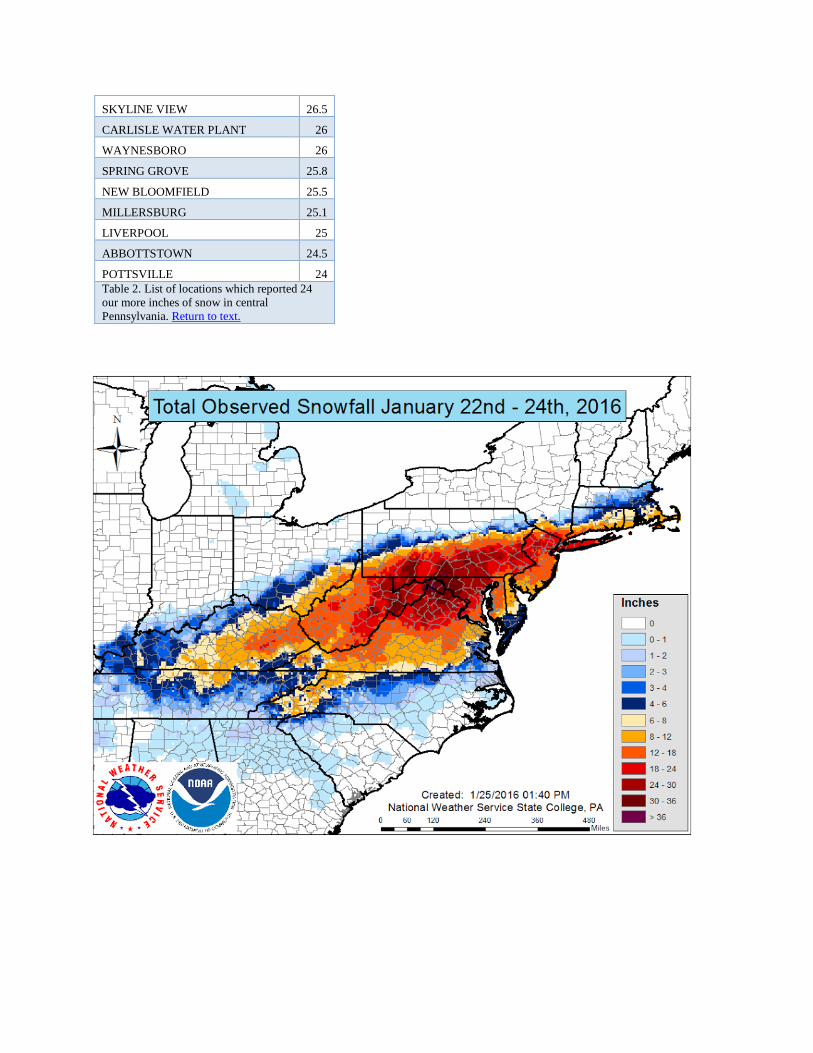
Table 2 lists the 48 locations in central Pennsylvania that received 24 or more inches of snow. The top two sites, Mechanicsburg and Somerset had 36.9 and 35.8 inches respectively. Harrisburg International Airport had 30.2 inches, a new record snowfall. Shepherdstown and Glengary had 42 and 40.5 inches in West Virginia. Reports of over 30 inches were common in portions of Maryland and West Virginia.
The impacts of the storm on transportation were considerable. AMTRAK canceled trains in the northeast corridor (AP 2016a; AP 2016B) and most of the major airports were closed which led to the cancelation of thousands of flights (AP 2016C). The storm also produced power outages to hundreds of thousands of customers and produced record to near record coastal flooding from the Delmarva to New York City.
The storm developed from a disturbance which moved across the United States on 21-23 January 2016 (Fig. 3). A relatively strong 500 hPa short-wave moved into the southern plains on 22 January deepening as it moved eastward and then up the East Coast. There was relatively strong confluence ahead of the shortwave and in implied jet entrance region over the northeastern United States. The surface low tracked out fo the southern Plains (Fig. 4) and up the East Coast. Most of the snow and heavy snow fell in the gradient between the surface anticyclone to the north and the developing surface cyclone. In the CFS re-analysis the cyclone was about -3σ below normal.
As with most meteorologically and climatological significant snowstorms (Stuart and Grumm 2009), the heavies snow fell in close proximity to a strong low-level jet (LLJ: Fig. 5). The 850 hPa u-wind anomalies were -3 to -6σ below normal at the height of the storm. The 850 hPa winds peaked in the Mid-Atlantic region (Fig. 5c-d) and along the southern New England coast (Figs.5d-e) with -5 to 6σ 850 hPa u-wind anomalies. The strong LLJ likely led to the strong winds, blizzard conditions, and severe coastal flooding (WP 2016 ) in Delaware and New Jersey. The storm surge and flooding in some locations was reported to have exceeded the record levels set in Sandy in October 2012. Not surprisingly, both events were characterized by strong easterly flow and -6σ 850 hPa u-wind anomalies with wind speeds over 70kts. Cape
May, NJ saw a storm surge of 8.98 feet exceeding the record of 8.90 feet set in October 2012. Record storm surge values were set in Delaware.
This paper will examine the meteorological setting for the historic snowstorm of 22-24 January 2016. The focus is on the key fields used to identify high-impact winter storms to demonstrate why this storm was a record event. Forecasts of the storm, focused on the QPF and snow are used to show some of the critical issues associated with forecasting significant QPF events. During this event, there was considerable uncertainty along the northern edge of what proved to be a very sharp northern QPF and thus heavy snow shield. From the Mid-Atlantic region into southern New England, the heavy snow fell slightly far north than earlier predictions indicated.
2. Methods and data
Gridded Stage-IV data were used to obtain the total QPE for the event. These data clearly had too much QPE on the extreme northern edge of the QPE shield (Fig. 1). Along the northern edges areas of 2-4 mm of QPE were shown that were not observed. An example would be Williamsport, Pennsylvania where no snow or precipitation was observed.
Gridded and point data snowfall data was retrieved form the National snow site. The gridded snowfall data had similar issues. The gridding process had areas of snow along the northern edge which did not occur (Fig. 2). Additionally the process diminished point data where snowfall exceeded 30 inches in portions of southwestern Pennsylvania and the 44 inches in Glengary, West Virginia. The point data contained too many reports to effectively plot on a map.
The climate forecast system re-analysis data was used to reconstruct the patterns and the standardized anomalies associated with the storm. A focus was on several key fields often used to anticipate the intensity of a storm.
The NCEP GEFS and SREF were used to highlight the forecast issues related to the prediction of the QPF and snow. As the event came into the realm of the SREF, it showed higher QPF amounts and higher snowfall totals farther north than the GEFS and EC (not shown). The SREF was likely too robust and was over dispersive.
3. Results a. pattern
The storm developed as a strong 500 hPa shortwave moved into the southern Plains (Fig. 3) and across the Gulf States. This short-wave originated over the North Pacific Ocean (not shown). As this wave moved eastward, strong convergence developed over the northeastern United States (Fig. 3a-d). A strong 250 hPa jet developed in this region (Fig. 6). At 1200 UTC 22 January 2016 (Fig. 6b) a well-developed “banana jet” was present over the eastern United states with an implied jet entrance over the Ohio Valley. At 850 hPa on 22 January a strong 850 hPa LLJ was present with -4σ 850 hPa u-wind anomalies (Fig. 5a-c). The heavy snow (Fig. 2) in south-central Kentucky fell in close proximity to this strong 850 hPa easterly jet.
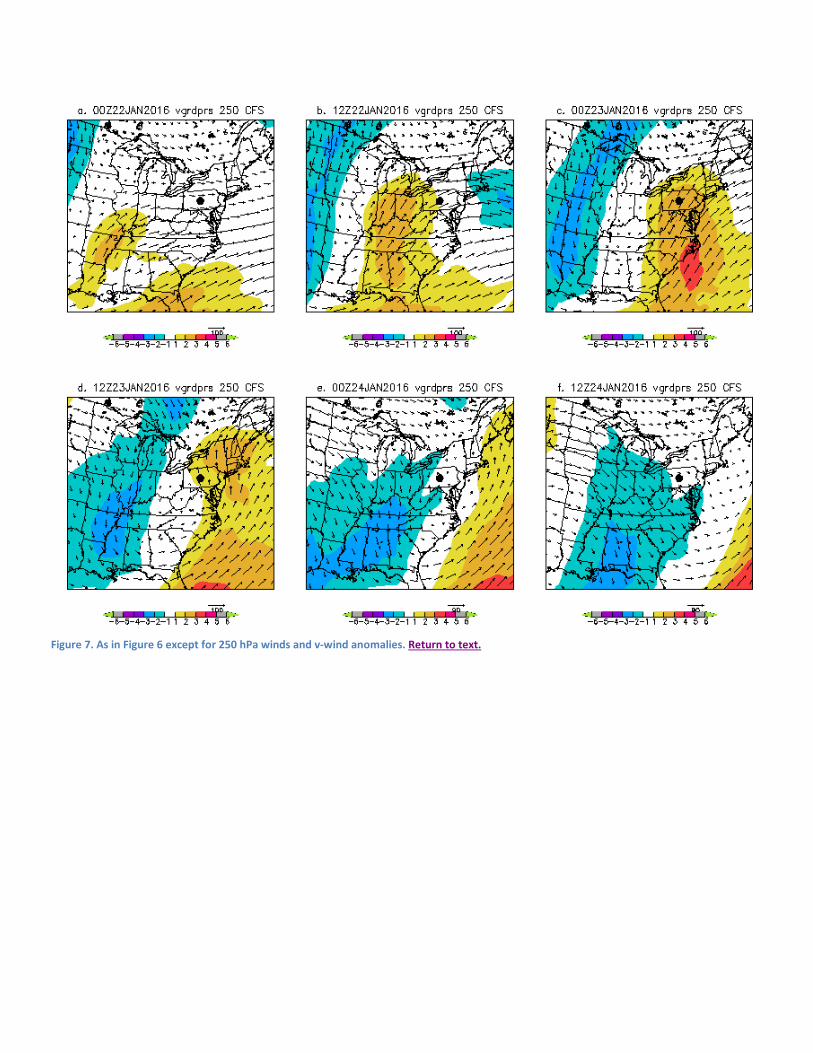
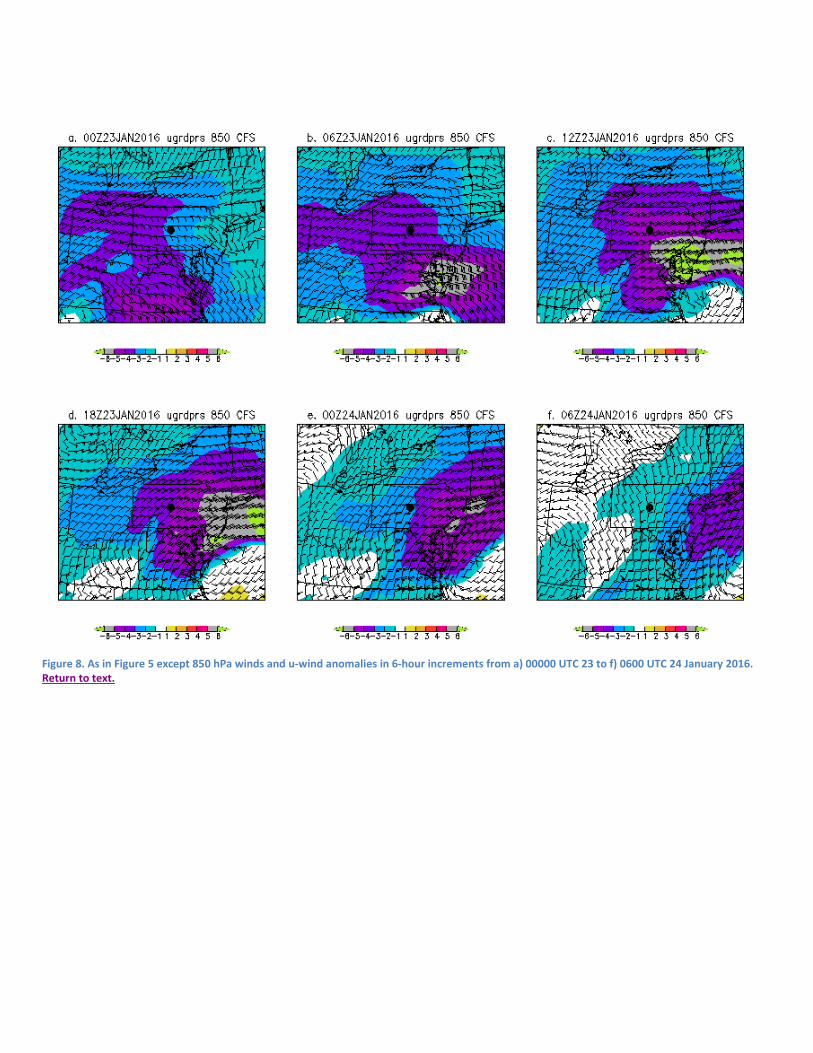
As the pattern shifted eastward, the 250 hPa winds peaked along the East Coast around 0000 UTC 23 January 2016 (Fig. 7c). Between 0000 and 0600 UTC the 850 hPa jet had
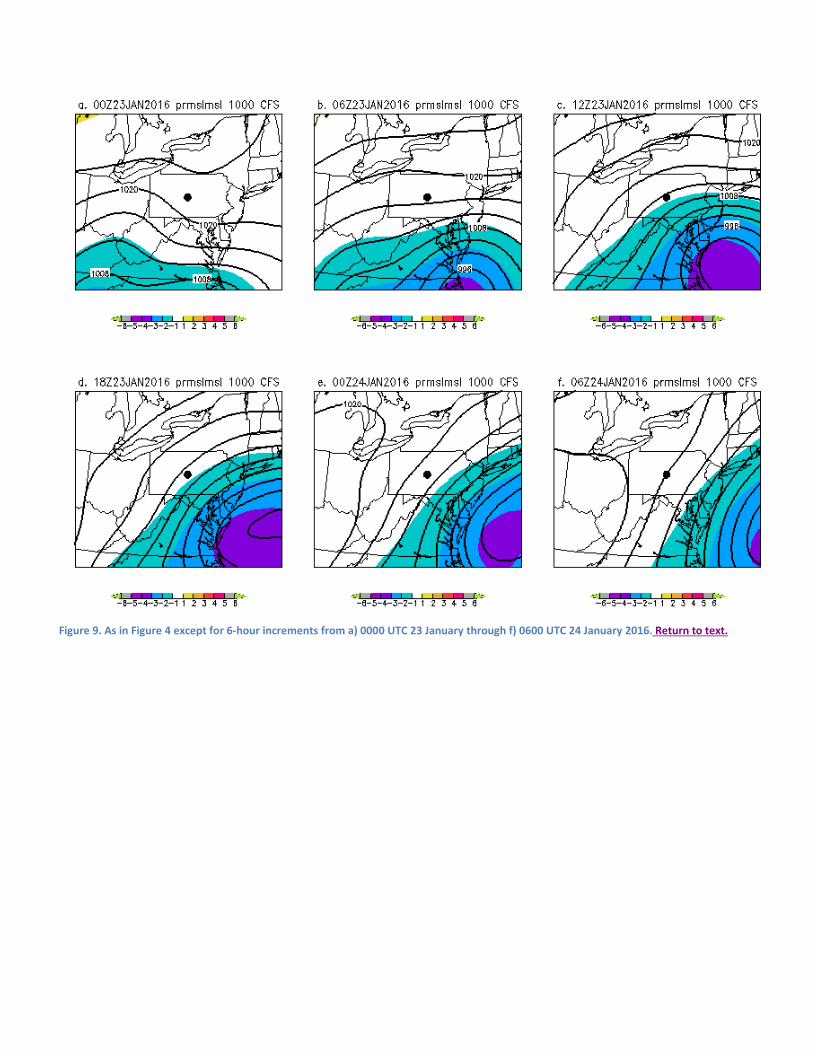
strengthened along the Mid-Atlantic coast (Fig. 8a-c) with -6σ 850 hPa u-wind anomalies. This strong LLJ was associated with the QPE and snow maximum across the Mid-Atlantic region from West Virginia across northern Maryland and southern Pennsylvania. During this period the coastal cyclone deepened as it moved up the coast (Fig. 9). The surface cyclone pressure in the CFS was about -4σ below normal.
The strong 250 hPa jet and the strong easterly flow at 850 hPa are well known features associated with many major and historic East Coast Winter storms. This storm with -6σ 850 hPa jet was one of the strongest ECWS in recent memory and the 850 hPa u-wind anomalies were on the same scale as those observed during Hurricane Sandy in October 2012. The strong 850 hPa winds were a known signal for a potential record setting event.
b. GEFS forecast
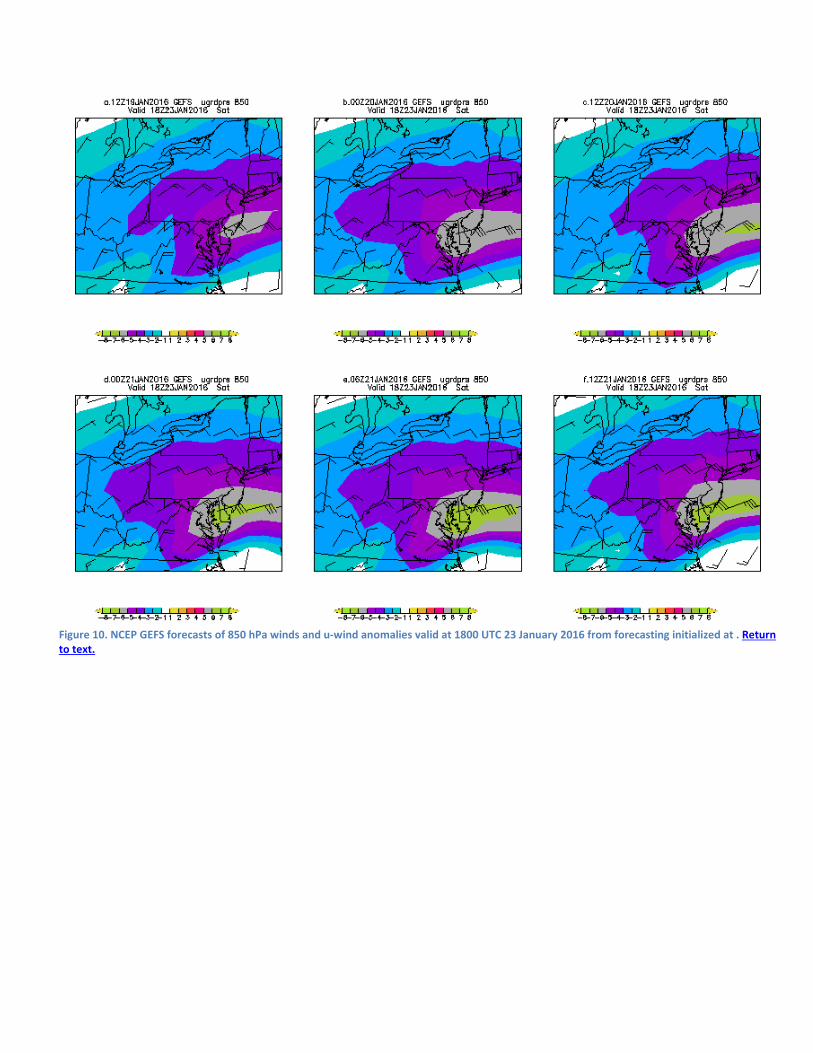
The NCEP GEFS indicated the potential for an East Coast Winter storm with about 8 days of lead-time. However the forecasts did not converge on a major storm with high confidence with much more than about 5.5 days of lead-time. To illustrate this 6 GEFS forecasts of the 850 hPa winds and u-wind anomalies are presented. (Fig. 10). These data show that as early as 1200 UTC 19 January the NCEP GEFS was forecasting a -5σ 850 hPa easterly jet. As the forecast horizon decreased the intensity of the LLJ increased to about -6s and remained relatively focused toward the Mid-Atlantic region. The strong winds and significant wind anomalies implied a strong convergence of solutions in the NCEP GEFS.
c. SREF forecasts d. HRRR forecasts
4. Conclusions
The strong 250 hPa jet and the strong easterly flow at 850 hPa are well known features associated with many major and historic East Coast Winter storms. This storm with -6σ 850 hPa jet was one of the strongest ECWS in recent memory and the 850 hPa u-wind anomalies were on the same scale as those observed during Hurricane Sandy in October 2012. The strong 850 hPa winds were a known signal for a potential record setting event.
In addition to the strong 850 hPa winds, a deep surface cyclone was present which, similar to may significant ECWS had a deep cyclone and -4s below normal mean sea-level pressure near the storms center. Higher values were obtained using the 3km HRRR 00-hr analysis.
5. Acknowledgement 6. References
Figure 1. Estimated event total liquid equivalent precipitation (mm) for the event. Upper image shows the eastern United States and the lower image focus is on the region of heavy snow in the Mid-Atlantic region. Return to text.
Figure 2. As in Figure 1 except for snowfall (in). These data were gridded from station data and show snow in locations where no snow was reported and under represented the areas of 30 inches of snow in southwestern Pennsylvania (small blue oval. The large blue oval has areas where no snow was reported. Return to text.
Location Snowfall 1 NNW MECHANICSBURG 36.9
SOMERSET 35.8
7 SE WINDBER 35
WINDBER 35
YORK SPRINGS 34
MONT ALTO 33.3
UPPER STRASBURG 33
CHAMBERSBURG 32
2 S YORK 31.5
MECHANICSBURG 31
LEBANON 31
GOLDSBORO 31
4 NE YORK 30.5
1 E ROCKVILLE 30.3
HARRISBURG INTERNATI 30.2
LEMOYNE 30
NEW CUMBERLAND 30
NEW FRANKLIN 30
QUINCY 30
EAST YORK 30
SUMMERDALE 29
HERSHEY 29
MERCERSBURG 29
LEWISBERRY 29
JONESTOWN 28.5
2 N ABBOTTSTOWN 28
4 WSW DOVER 28
SEVEN VALLEYS 28
1 S NEW SALEM 28
1 NNE ELIZABETHTOWN 27.9
MEYERSDALE 27.5
1 SE MOUNT WOLF 27.5
GETTYSBURG 27.3
CASHTOWN 27
1 SE YORK SPRINGS 27
CASHTOWN 1S 27
MOUNT JOY 27
PORT CARBON 27
MILLERSVILLE 26.8
SKYLINE VIEW 26.5
CARLISLE WATER PLANT 26
WAYNESBORO 26
SPRING GROVE 25.8
NEW BLOOMFIELD 25.5
MILLERSBURG 25.1
LIVERPOOL 25
ABBOTTSTOWN 24.5
POTTSVILLE 24 Table 2. List of locations which reported 24 our more inches of snow in central Pennsylvania. Return to text.
Figure 3. Heights every 60 m and standardized anomalies in standard deviations from normal. Return to text.
Figure 4. As I Figure 4 except for mean sea level pressure (hPa) and pressure anomalies in 12 hour increments from a) 1200 UTC 21 through 0000 UTC 24 January 2016. Isobars every 4 hPa. Return to text.
Figure 5. As in Figure 4 except for CFSR 850 hPa wind (ms-1) and 850 hPa u-wind anomalies for the 6-hour periods from a) 1800 UTC 22 January through f) 0000 UTC 24 January 2016. Return to text.
Figure 6. As in Figure 5 except for 250 hPa windspeed. Iostachs every 10ms-1 . Return to text.
Figure 7. As in Figure 6 except for 250 hPa winds and v-wind anomalies. Return to text.
Figure 8. As in Figure 5 except 850 hPa winds and u-wind anomalies in 6-hour increments from a) 00000 UTC 23 to f) 0600 UTC 24 January 2016. Return to text.
Figure 9. As in Figure 4 except for 6-hour increments from a) 0000 UTC 23 January through f) 0600 UTC 24 January 2016. Return to text.
Figure 10. NCEP GEFS forecasts of 850 hPa winds and u-wind anomalies valid at 1800 UTC 23 January 2016 from forecasting initialized at . Return to text.