Transactions of the 17 th International Conference on Structural Mechanics in Reactor Technology (SMiRT 17) Prague, Czech Republic, August 17 –22, 2003 Paper # A01 1 Historical Development of the Seismic Requirements for Construction of Nuclear Power Plants in the U.S. and Worldwide and their Current Impact on Cost and Safety John D. Stevenson (1) KEY WORDS: Seismic Requirements, Construction, Nuclear Power Plants, U.S., Worldwide, Current Impact, Cost, Safety INTRODUCTION Seismic design requirements applicable in Nuclear Power Plants in what has been defined in the West, over and above what might be required by individual National Building Codes for conventional industrial Structures, Systems and Components, began in the early to mid 1960’s. For example, there were 5 nuclear power plants designed in that era in the U.S. which had no seismic design requirements. This approach continued in Finland, Sweden and Great Britain and East block countries until the mid 1980’s. During this period for most sites except in recognized active earthquake regions, the resultant seismic lateral loads required for use in design were typically less than applicable lateral wind loads and would result in little or no damage to engineered industrial facilities. As a result they had little or no impact on design or construction. In the U.S. the National Building Code (UBC-67) lateral peak ground accelerations ranged from 0.025g to 0.1g as shown in Figure 1. (1) While such loads were not defined on a probabilistic basis these peak ground acceleration values would appear to range from about 2x10 -2 to 1x10 -2 per year probability of exceedence or return periods of 50 to 100 years which was consistent with wind return period design requirements. These deign basis ground accelerations correlated with Modified Mercalli or Medvedev, Sponheuer, Karnik, MSK-64 damage and behavior intensity scale levels of V to VII. Earthquake experience studies indicate that significant damage or malfunction of industrial type facilities, even when they are not explicitly designed to resist earthquakes, do not occur until the upper region of Intensity Level VI or the lower region of Intensity Level VII is reached at or about 0.08 to 0.10g pga (2) . For this reason minimum pga have been established for nuclear power plant design purposes by the International Atomic Energy Agency at 0.1g pga in 1979 with publication of their Safety Guide S-1. (3) Specified acceleration values below 0.1g pga or spectral values less than 0.2g simply do not cause damage to engineered structures, systems and components even when they are not designed to be earthquake resistant. However, they are capable of causing damage to architectural components such as un-reinforced masonry, plaster, glass and ceramics It should be understood that the mid to late 1960’s seismic design requirements are not as unconservative as they may appear by comparison to today’s requirements expressed in terms of peak ground acceleration. Seismic designs during this period were based on elastic analysis. Later National Building Codes (1988 in the U.S.) (4) increased seismic pga significantly by defining a seismic zone coefficient (1) Senior Consultant, J.D. Stevenson Consulting Engineer, 9217 Midwest Avenue, Cleveland, Ohio 44125, Phone: 216-587-3808, Fax: 216-587-2205, E:mail: [email protected]
Transcript
Transactions of the 17th International Conference on Structural Mechanics in Reactor Technology (SMiRT 17)Prague, Czech Republic, August 17 –22, 2003
Paper # A01
1
Historical Development of the Seismic Requirements for Construction ofNuclear Power Plants in the U.S. and Worldwide and their Current Impact onCost and Safety
Seismic design requirements applicable in Nuclear Power Plants in what has been defined in the West,over and above what might be required by individual National Building Codes for conventional industrialStructures, Systems and Components, began in the early to mid 1960’s. For example, there were 5nuclear power plants designed in that era in the U.S. which had no seismic design requirements. Thisapproach continued in Finland, Sweden and Great Britain and East block countries until the mid 1980’s.During this period for most sites except in recognized active earthquake regions, the resultant seismiclateral loads required for use in design were typically less than applicable lateral wind loads and wouldresult in little or no damage to engineered industrial facilities. As a result they had little or no impact ondesign or construction.
In the U.S. the National Building Code (UBC-67) lateral peak ground accelerations ranged from 0.025g to0.1g as shown in Figure 1.(1) While such loads were not defined on a probabilistic basis these peakground acceleration values would appear to range from about 2x10⁻² to 1x10⁻² per year probability ofexceedence or return periods of 50 to 100 years which was consistent with wind return period designrequirements.
These deign basis ground accelerations correlated with Modified Mercalli or Medvedev, Sponheuer,Karnik, MSK-64 damage and behavior intensity scale levels of V to VII. Earthquake experience studiesindicate that significant damage or malfunction of industrial type facilities, even when they are notexplicitly designed to resist earthquakes, do not occur until the upper region of Intensity Level VI or thelower region of Intensity Level VII is reached at or about 0.08 to 0.10g pga(2). For this reason minimumpga have been established for nuclear power plant design purposes by the International Atomic EnergyAgency at 0.1g pga in 1979 with publication of their Safety Guide S-1.(3) Specified acceleration valuesbelow 0.1g pga or spectral values less than 0.2g simply do not cause damage to engineered structures,systems and components even when they are not designed to be earthquake resistant. However, they arecapable of causing damage to architectural components such as un-reinforced masonry, plaster, glass andceramics
It should be understood that the mid to late 1960’s seismic design requirements are not as unconservativeas they may appear by comparison to today’s requirements expressed in terms of peak groundacceleration. Seismic designs during this period were based on elastic analysis. Later National BuildingCodes (1988 in the U.S.)(4) increased seismic pga significantly by defining a seismic zone coefficient
equivalent to pga which range between 0.075 to 0.4g. However, they also permitted implicit inelasticbehavior by the introduction of a factor (R) for building structures which ranged between 4 and 12 and Rpwhich ranged from 2 to 6 for non-building and mechanical and electrical equipment and distributionsystems as a function of the type of structure and materials of construction. The R or Rp factors were usedas a divisor to reduce the elastically computed seismic moments and forces which in turn are used tocompute resultant stresses to be compared to Code defined or referenced acceptance criteria.
HISTORICAL DEVELOPMENT OF NPP SEISMIC DESIGN REQUIREMENTS
PEAK GROUND ACCELERATION
In Table 1 is a commonly used comparison of the relationship between peak ground acceleration andModified Mercalli or MSK-64 intensity scale levels. These Intensity scales, as well as the JapaneseMeteorological Agency (JMA) scale, are summarized in Attachment A hereto. Most of the EasternEuropean Nuclear Power Plants original design were specified as MSK-V or at approximately 0.025g pgahence, effectively had no impact on design.
In the U.S. the first departure from the National Building Code requirements was to identify a secondMaximum Hypothetical Earthquake, MHE level starting in 1966 which was typically defined as thelargest earthquake in recorded history that had occurred within 300 km (200 miles) of the site with itsepicenter intensity region moved to the site. This MHE often typically had a pga 4 to 8 times that of theNational Building Code defined earthquake from the 1967 UBC and began the practice of definingearthquake peak ground acceleration on a site specific basis.
An example of this application was the Connecticut Yankee NPP which was originally designed for a0.03g pga using the requirements of UBC-64. Detailed design of this plant started in early 1964 and wascompleted in mid 1967. In 1966 the plant was re-evaluated for a 0.17g pga well after the plant design andconstruction were well underway.
The MHE nomenclature was soon dropped in favor of a Design Basis Earthquake nomenclature and bythe early 1970’s had been redefined in the U.S. as the Safe Shutdown Earthquake, SSE. In addition, asmaller (usually taken as one half the SSE in the U.S.) earthquake was defined as the Operating BasisEarthquake, OBE which had more conservative behavior criteria and damping values specified. As aresult in many instances it was determined that the smaller Operating Basis Earthquake controlled design.
Other countries such as Canada and Japan did not follow the U.S. example but instead defined a differentdesign level earthquake applicable to different sets of structures, systems and components which had adifferent impact on safety. The Canadians defined two earthquakes, the Site Design Earthquake, SDE anda larger Design Basis Earthquake, DBE.(5) The Canadian DBE is evaluated on a case-by-case basis asdescribed in Reference 5. The SDE on the other hand is defined on a probabilistic basis as having areturn period of 100 years or a probability of exceedence of 0.01.(6)
The Japanese developed 4 earthquake levels As, A, B and C for design purposes as shown in Tables 2 and3.(7) In general the S1 earthquake lower bound limit for Japan has been taken as 0.27g corresponding to aSurface Magnitude 6.5 peak ground acceleration and S2 typically 1.5 times higher or 0.4g at the rockfoundation media interface at the site. Initially all Japanese NPP were founded on rock. Higher levelpeak ground acceleration on a site specific basis are specified for regions of Japan with higher seismicpotential.
Most other countries, except Sweden, Finland and Great Britain, which did not consider earthquakesapplicable to their sites as well as the East Block countries until the 1980’s, tended to follow the two
3
earthquakes OBE and SSE U.S. procedures which were also identified in the IAEA Safety Guide S-1 asthe S1 and S2 earthquakes in 1979.(3) It should be noted that most existing NPP, regardless of theiroriginal seismic design basis, have or are planning to re-evaluate their ability to resist earthquakes.
RESPONSE SPECTRA AND DAMPING
From the beginning of nuclear power plant design, attempts were made to perform some type of dynamicanalysis. Initially this was performed by use of ground response spectra. In the U.S. ground responsespectra first developed by Dr. G. Housner in 1953(8) were applied to nuclear power plant facilities by TID7024 Nuclear Reactors and Earthquakes(9) using the Housner free field ground surface response spectra asshown in Figure 2.
In the period 1964 to 1967 dynamic analysis was usually accomplished by applying the peak of theHousner defined ground response spectra to structures, equipment or distribution systems as function oftheir specified damping value as shown in Table 4. For example, in seismic design of piping 0.5 with theHousner Spectrum percent damping was used which had a spectral peak amplification factor of 4.2 timesthe pga. This acceleration was applied to the mass distribution of the piping to get resultant inertia forceson the piping which in turn were statically applied to a structural model of the piping system to getresultant stresses. For structures or equipment a similar approach was taken except that different percentdamping factors typically were used as shown in Table 5. For equipment or distribution systemssupported above the ground floor the pga of the ground response spectra were also increased as a functionof building floor acceleration as a function of height.
It should be noted that until about 1967, when computer programs that could perform multi-degree offreedom dynamic analysis calculations became generally available multi-degree of freedom frequencycalculations had to be performed by tedious hand calculation. For example, to determine the dynamiccharacteristics of a 5-degree of freedom system such a calculation using a mechanical calculator wouldtypically require 150 manhours.
From 1967 to 1972 in the U.S. there was a gradual transition away from the Housner shaped spectrawhich was a weighted average spectra developed from averaging four recorded strong motionearthquakes 3 of which were from California to what became known as the Regulatory Guide 1.60(10)
mean plus one standard deviation response spectra developed by Newmark, Blume and Kapoor recordedfrom 14 different strong motion earthquakes predominately from California.(11) In addition, distinctvertical spectra different from the horizontal spectra were developed as well as individual spectraapplicable to rock versus soil sites.
The R.G. 1.60 free field ground surface shaped response spectra is shown in Figure 3. It should be notedthese spectra, for the same level of damping, resulted in much larger amplification than was the case withthe Housner Spectra. However, damping values to be used with the R.G. 1.60 were also modified asshown in Tables 4 and 5 such that the resultant seismic inertia loads coming from the R.G. 1.60 groundacceleration were approximately the same as determined by use of the Housner spectra.
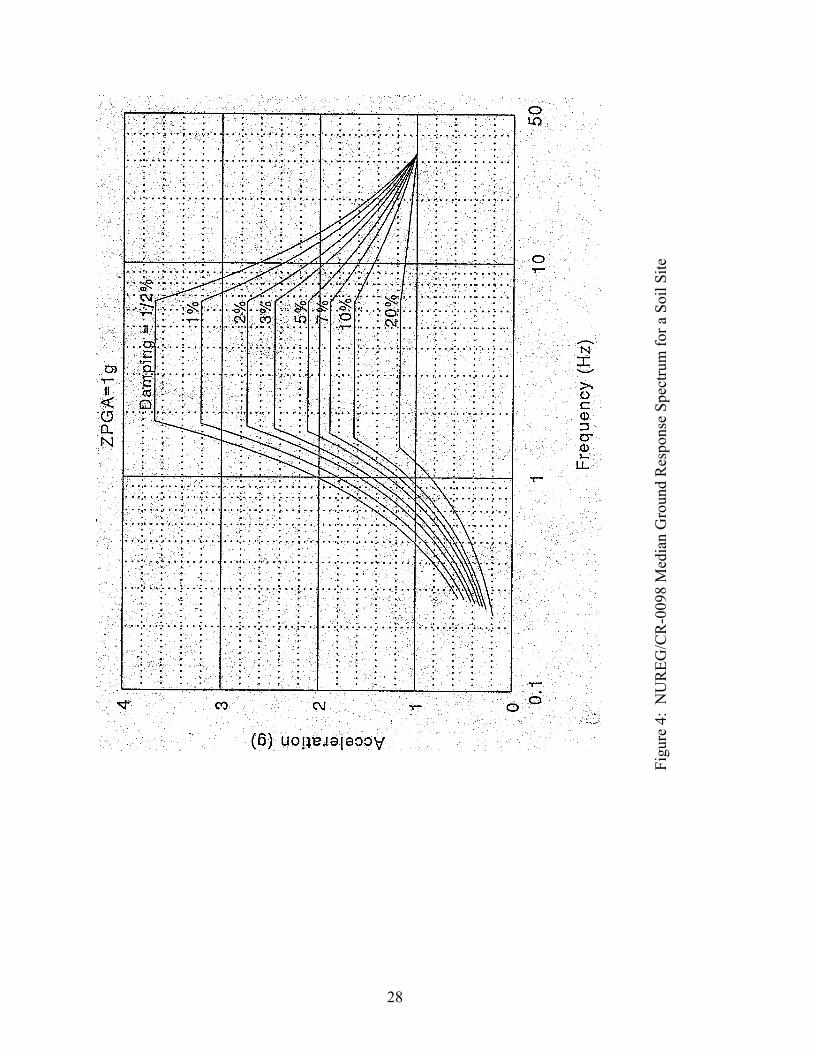
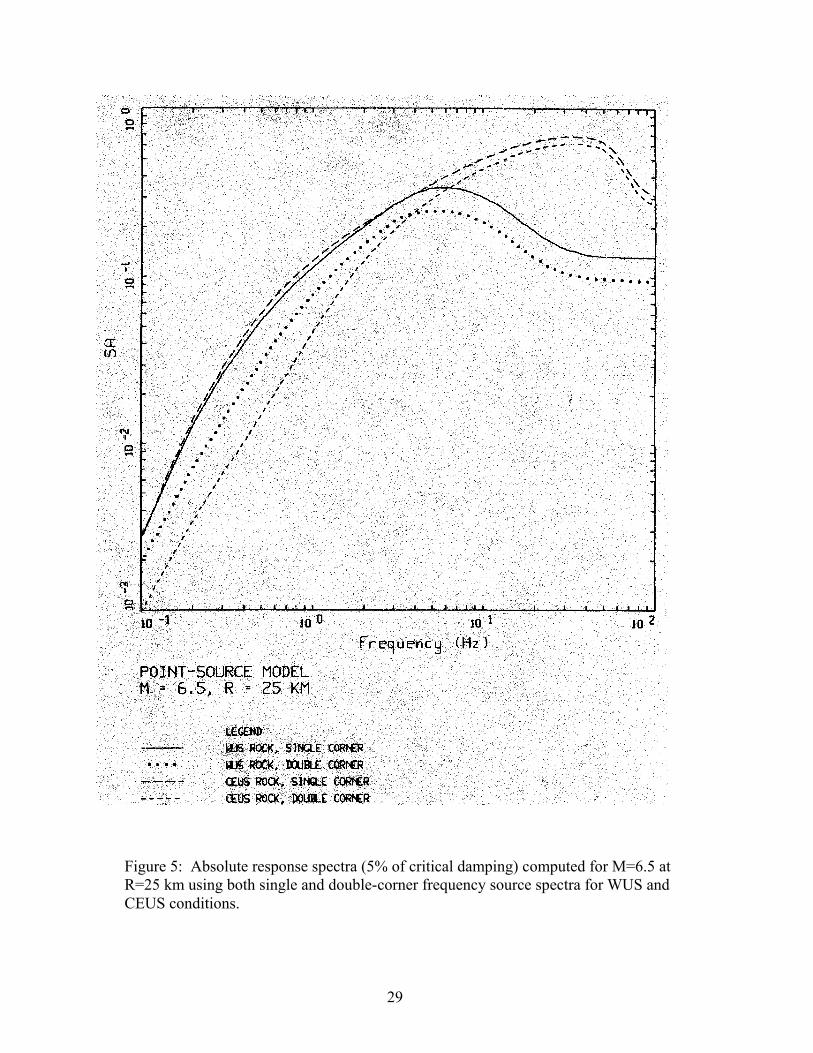
More recently starting about 1992 the median shaped NUREG/CR-0098(12) ground spectra which wasdeveloped in 1978 as shown in Figure 4 has come in to use in evaluating existing NPP which hassignificantly less amplification than the R.G. 1.60 spectra as shown in Table 4 for the same dampingvalue. Associated with the use of earthquake experience data in the same time frame was the ReferenceGIP spectrum as shown in Figure 5.
Currently a new series of generic rock Uniform Hazard Ground Response Spectra on hard rock(vs=6000ft/sec) at Central and Eastern U.S. sites compared to soft rock (vs=3000 ft/sec) West U.S. sites as
4
shown in Figure 6 were developed. It is thought these hard rock shape ground response spectra are moreapplicable to basement hard rock motion at sites in the Central and Eastern U.S. and Western Europe andtime-history motions representative of these rock motions can be used with SSI models to generateground surface and in-structure design basis response spectra.
FLOOR OR AMPLIFIED RESPONSE SPECTRA
It was well known prior to the late 1960’s that the earthquake ground motion was modified as this motionwas transmitted from the ground through a building structure and that such motions became much moresinusoidal in nature as the building tended to respond in its dominate natural modes of vibration. Sinceresponse to sinusoidal motion is a function of 1.0 divided by 2 times critical damping, the more or lessrandom earthquake ground motion which for 5 percent critical damping had ground amplifications of 2 to3 had amplifications of close to 10 when filtered by the building at the dominate response naturalfrequency of the building. In addition, based on earthquake experience zero period acceleration at eachfloor elevation tended to increase as a function of the height of the building. For concrete shear wall typestructures the floor zero period acceleration, zpa tends to increase by a factor of 3 from the base to theroof of the structure. For flexible moment resisting steel frames the ratio of roof to base zpa typicallyapproaches a factor of 5.
Prior to 1967 when the heavy construction industry was limited to dynamic analysis by hand calculationthere was no practical way to generate floor or amplified response spectra at the mass points reflecting thevarious building elevations. After 1967 with the advent of computerized dynamic analysis programs, itwas possible to generate such floor or amplified response spectra. As a result peaks of design basisresponse spectra accelerations went from less than 1.0g with ground response spectra to typically 5 to 10g’s or higher acceleration levels at building resonance frequencies at elevated floor levels.
Typical or generic floor response spectra generated to be compatible with R.G. 1.60 ground motionspectra are shown in Figures 6 and 7. This generation of highly amplified in-structure response spectraalso resulted in a virtual explosion in dynamic analysis effort for safety related distribution systems.Previously most safety related distribution systems were seismically designed by simplified supportspacing tables and charts based on peaks of ground response spectra. These peak ground spectral valuesseldom exceeded 1.0g. With the advent of floor spectra the design of these systems was now faced withspectra having peak values of 5 – 10 g’s or more. This meant that the conservative use of the peak of theapplicable response spectra could no longer be used practically to design distribution systems since use of5 – 10 g’s or more inertia accelerations resulted in support spacing which were impractical and difficult todemonstrate design adequacy for evaluated temperature piping. In the case of high temperature lines useof peak floor spectra resulted in excessive restraint of free-end displacement stresses which violated codeacceptance criteria. This resulted in the excessive use of dynamic restraint snubbers which wereunreliable, costly and require constant operational testing and maintenance.
The use of floor or amplified response spectra has also pushed NPP owners to spend the time and effort todevelop site specific time histories or ground response spectra. Because they are site specific related,such time histories or spectra tend to be less conservative than generic spectra such as R.G. 1.60,NUREG/CR-0098 or GIP Reference spectra.
The generation of a site specific spectra generally involves the selection of a suite of typical recorded timehistory strong motion earthquake motions as a function of 1) type of faulting, normal, reverse or slip; 2)postulated earthquake magnitude; 3) stress drop; 4) attenuation relationships with distance between thefocus or epicenter and the site. The motions thus selected are deconvoluted at the recorded earthquakesite to underlying rock (i.e., shear wave velocity greater than 3000 feet per second) in order to obtaintypical base rock motion. An aggregate of this rock time history rock motion would then be applied to an
5
SSI model of the NPP site to get the resultant ground motion time history or response spectra to beapplied to or in the NPP structure.
EFFECTIVE HIGH FREQUENCY RESPONSE SPECTRA
The development of high frequency earthquake response spectra as shown in Figure 5(15) applicable tosites underlain by hard rock has required a new focus on the damage effects of high frequency (>10 – 15Hz) vibrations. Heretofore earthquake ground spectra had peak accelerations typically less than 1.0g inthe 2 – 8 Hz range and associated spectral displacements in the 9 (230 mm) to 0.5 inch (12.5 mm) range.Above 10 Hz spectral displacements drop rapidly as a function of spectral accelerations divided byfrequency squared. At 15 Hz a 1.0g acceleration divided by frequency squared would typically result inless than a 0.16 (4 mm) inch displacement.
It is a well established fact that high frequency vibrations as a function of acceleration levels cause lessdamage than the same acceleration at lower frequencies. This is illustrated by Figure 8 which shows athreshold of cracking for un-reinforced masonry response spectra.(15) At 5 Hz the cracking threshold is1.0g while at 10 Hz it is approximately 2.0g and at 20Hz it is 3.0g and drops to 0.1g at 2.5 Hz. While ithas been a usual procedure to use acceleration based response spectra for design purposes for frequenciesbelow 10 Hz, it would appear to be much more rational to use displacement spectra for design purposesabove 10 Hz. A simplified analytical procedure can be found in German RSK guidelines where a constant designacceleration of 0.5g is specified for frequencies below 16 Hz associated with the vibratory input to thebase of containment internal structure in response to high frequency aircraft impact on the containmentshell.
The German Regulatory Authorities(16) associated with the vibratory response of containment internalstructure as a result of an aircraft impact on the containment shell have also established a limit of 1.0mmdisplacement for frequencies above 16 Hz as a design consideration. That is to say if the spectraldisplacement at frequencies above 16 Hz is less than 1.0mm there is no requirement to consider thespectral values (accelerations) in design for structural evaluation of structures, equipment or distributionsystems. However, such high frequency vibrations should still require consideration for seismicqualification for operability of potentially high frequency sensitive devices such as relays.
SEISMIC MODELING PROCEDURES
Prior to 1967 and the ability to dynamically analyze multi-degree of freedom systems by computer, staticmodels were used where the acceleration of the peak of the applicable response spectrum was staticallyapplied to the mass distribution of the structural systems. It should be noted that such application ofinertia load did not consider the effect of the shape of individual modes nor that the mode shapes couldhave a plus or minus sensing. As a result these statistically determined moment and shear resultants arenot the same as would occur in a dynamic multi-mode analysis.
In addition, starting about 1972 the U.S. Regulatory Authorities required the application of a coefficientof 1.5 times the peak response spectra to compensate for the equivalent static and multi-frequency natureof the load application. At any given point in a structural system the seismic inertia induced stressesdetermined statically are different from those induced by dynamic loading. However, the equivalentstatic analysis procedure has generally been accepted as a reasonable approximation of dynamic analysisresults.
6
Starting in 1967 the first dynamic models of structural systems single or multiple lumped mass modelswhere the stiffness of the restraining elements was represented by springs. Generally only twotranslateral degrees of freedom one vertical and one horizontal were considered. This model type wasfollowed by replacing the spring supports by with a 6x6 stiffness matrix. Soon after this lumped massfixed base structural models came in to use followed by foundation or support masses restrained bysprings. These lumped mass models are shown in Figure 9. With the advent of three directional input itbecame necessary (starting around 1985) to distinguish between the center of shear and center of mass instructural modeling as shown in Figure 10.
Starting around 1971 2D finite element models particularly for slab and shell type structures appeared aswell as the development of 3 translational directions of seismic input. However, because of programlimitations the use of finite elements in dynamic analysis was quite limited and lumped mass modelscontinued to be the dominant modeling format.
By 1995 the capability of computer programs had grown to the point where it was possible to representindividual structural members in dynamic finite element programs and this is currently in vogue today.Unfortunately with the advent of such complex models the analyst has generally lost the ability tovisualize dominate mode shapes and associated frequencies. As a result independent simplified load pathevaluations are usually necessary to assure the adequacy of the complex finite element models.
IMPACT ON COST
In Figure 11 is shown the percentage cost of NPP seismic construction as a function of increasedacceleration levels as compared to total nuclear power plant costs in the U.S(17) using NRC approvedanalyses and shake table testing procedures. As can be seen by this figure seismic construction basedprimarily on analysis for structural integrity and testing operability adds significant cost to nuclear powerplants.
The effect of seismic design acceleration levels on nuclear plant costs when costs are based primary ondesign by analysis and operability test qualification has long been an area of cost benefit concern tonuclear power industry owners.
In Table 6 is a summary of direct seismic and total nuclear power plant engineering and constructioncosts modified to represent year 2000 U.S. dollars.(17) In Table 7 is a summary of seismic total nuclearpower plant costs using indirect experience data for seismic operability qualification of safety relatedsystems and components.
Tables 6 and 7 summarize the costs in the following categories:
(1) Site preparation and foundation media costs.(2) Cost of seismic site studies and response spectra generation.(3) Cost of building structures.
a. Safety relatedb. Non-safety related
(4) Cost of Safety Class (Seismic Category I), mechanical components--vessels, tank heatexchangers, pumps, valves, fans, dampers, etc.
(5) Cost of Safety Class (Seismic Category IE) electrical components--generators, motor controlcenters, cabinets, switchgear, motors, batteries bolting racks, etc.
(6) Cost of Safety Class (Seismic Category I) mechanical and electrical distribution and controlsystems--piping, tubing, ventilation duct, electrical conduit and raceways.
(7) Engineering and other regulatory construction management costs.
7
Cost increments tend to be highly nonlinear for categories (1) through (5) with little or no change in costuntil a particular design limit is reached, resulting in a discontinuous jump which then remains constantuntil a new limit is reached and another jump is encountered. For the distribution systems of category (6)costs tend to vary continuously as the square root of seismic acceleration level. In addition, the methodsof engineering analysis used in evaluating components to determine seismic design adequacy as definedin category (7), tend to become more rigorous as a function of increased acceleration level with acorresponding increase in the number of distribution systems supports and unit design costs. Also, itshould be understood that although engineering costs typically range between 5 and 10% of the cost of atypical component or structure, seismic analysis costs, particularly for relatively small mass produceditems, can in some instances equal or greatly exceed the total cost if the item supplied is no longerstandard.
Site Preparation and Foundations
In this category the following affect costs:
(1) Potential for liquefication.(2) Potential for sliding and overturning of structures.(3) Potential foundation-bearing-load failure under seismic loads.
On soil sites the first and third effects are generally controlled by the use of selected engineered backfill.
The effect of overturning and sliding, assuming that a foundation failure has been precluded, depends onthe energy input from the earthquake exceeding the energy required to lift and rotate or slide the structure.Common practice in analysis is to treat earthquake lateral interia forces in each mode of response innuclear plant design determined by accelerations. If this approach were taken on typical high-riseconventional structures, overturning would invariably result. Since overturning of such structures exceptas a result of liquification is not typically observed in actual earthquakes, the acceleration basedequivalent static load method can lead to erroneous and overly conservative results.
Design against overturning and sliding for SSE ZPGA in excess of about 0.3g pga is usually provided byuse of mat keys and increasing the lateral dimension of the building complex, that is, oversized base matsfor containment or a common foundation mat with other structures. In a few instances where good,competent rock has been available, rock anchors to base mats have also been used to increase lateralstability and provide a positive hold-down connection to the foundation media. Time-history analysis oranalyses which include the effect of ground motion displacement can significantly increase the apparentresistance to rigid body lateral seismic loads.
Site Seismic Response and Generation of Site Dependent Spectra
Historically design basis response spectra used in design were defined on a generic basis such as R.G.1.60 or IAEA Safety Guide S-1 shaped ground spectra. More recently it has become common practice todevelop site specific spectra which consider the unique characteristics of the plant foundation media.
Foundation
NPP founded on soil with shear wave velocities less than 1200 ft/sec (400 m/sec) typically require theaddition of selected engineering backfill to reduce potential foundation failure to acceptable margins ofsafety particularly with respect to liquification or slope stability. Cost of this effort in the year 2000dollars estimated at is 8 million.
8
Building Structure
In nuclear plant building structures, the effect of increased seismic acceleration loads is usually minimal.In deformed bar reinforced concrete structures which make up most structures designed for SSE ZPGA inexcess of 0.1g pga, the amount of seismic reinforcement is essentially proportional to the g-level of theearthquake.
Seismic Category 1 Structures
(a) Reactor containment(b) Reactor building internal structure.(c) Mechanical auxiliary building.(d) Electrical and control room building.(e) Spent fuel and high level waste storage building.(f) Diesel generator building.(g) Intake structure(h) Turbine building. (This structure is not normally classified as Seismic Category I, but
seismic design adequacy for SSE loading is usually required to assure no gross structuralcollapse which cold impair adjacent Seismic Category I components or structures.)
Total cost of seismic upgrading of Seismic Category I structures, which consist primarily of increasedconcrete wall reinforcement and ductile detailing in 2000 dollars is $4,200,000.
Mechanical Components
The following type components are seismically evaluated by analysis:
(b) vertical tank – low pressure.o Column supported.o Skirt supported.
(c) Vertical tank – high pressure.(d) Vertical heat exchangers.(e) Horizontal heat exchangers(f) Motor pump unit, vertical.(g) Motor pump unit, horizontal.(h) Fan cooler unit.(i) Power-operated valve.
o Electric.o Pneumatic.o Large diameter, > 10 inches, 250mmo Small diameter, < 4 inches, 10mm
The total increase in NPP cost for a 0.2 to 0.3g pga seismic qualification for mechanical components isabout $14.0 million for mechanical equipment. Of this total is approximately $0.4 million for seismicsupport and anchorage.
Electrical Components
The seismic design adequacy of safety class electrical components is generally done by proof testingperformed by the manufacturer on individual components. Since malfunction of component assemblies
9
under seismic loads is not usually amenable to analysis, the effect of increases in electrical componentcosts as a function of acceleration level is evaluated by change in support and cabinet and rack designrequirements. The particular components considered are as follows:
(1) Diesel generator and engineers.(2) Transformers.(3) Motor control centers.(4) Control panel.(5) Switchgear.(6) Instrument Panels and Racks.(7) Batteries and Battery Racks.
The upgrading of electrical component for a .0.2 to 0.3g pga earthquake amounts to approximately $10.2million with $0.5 million of this total due to seismic anchorage requirements.
Typically, mechanical and electrical component manufacturers have tended to select their designacceleration levels for generic operability qualification of off-the-shelf components as a percentage of thepotential nuclear plant market in the 85 to 95% range. These percentages in the upper limits typically fallin the 0.30g to 0.40 g SSE ZPGA range. They then qualify their components either by test or analysis forthis equivalent g acceleration level response in the building structure. They are then able to supplyapproximately 85 to 95% of all nuclear plant jobs without any additional cost in seismic qualifying theirequipment. It should be understood the cost of these seismic equipment qualification costs are passed onas increased hardware costs. The high seismic small percentages outside this range are evaluated on acase-by-case basis as a custom application potentially involving additional costs in seismically re-qualifying the equipment. The total seismic cost of design and operability qualification of mechanicaland electrical components for a 0.2 to 0.3g pga design basis earthquake is $24.2 million dollars.
Distribution Systems
Unlike mechanical and electrical equipment, the distribution systems tend to be custom designed for eachapplication. In addition, the number of seismic supports required tends to increase directly with thesquare root of the acceleration level. Approximately 75 percent of the total cost of seismic engineeringand construction is associated with distribution systems.
Total and Seismic Engineering Effort
Current total direct engineering man hour effort on the part of the A/E in the design and analysis of asingle 1100 MWe light water commercial nuclear power plant facility is estimated at approximately7,000,000 man hours over a ten year period. Of this total direct engineering effort, it is estimated thatapproximately 15% of the A/E effort (800,000 man hours) can be attributed to the seismic designrequirement at the 0.2 to 0.3g pga level. This seismic design effort is shared among the variousengineering disciplines associated with site evaluation; civil-structural, mechanical component;mechanical distribution systems; electrical component; mechanical distribution systems; as well asheating and ventilating duct and electrical safety related power, instrumentation and control distributionsystems. It should also be understood that typically one-third of this effort in the U.S. is devoted toresolving non-conformance reports and design change notices encountered during construction essentiallyafter design has been completed.
Approximately 75 percent of this cost results from seismic construction of distribution system (piping,conduit, cable trays, ductwork and tubing). Another 7 percent is associated with the definition of seismicinput and building design with a final 18 percent in mechanical and electrical equipment anchorage andequipment operability qualifications.
10
POTENTIAL USE OF INDIRECT EARTHQUAKE EXPERIENCE DATA IN DESIGN ANDCONSTRUCTION OF NPP
Historically, seismic design and qualification of nuclear power plants has been based on analysis ofstructures, mechanical and electrical distribution systems and mechanical equipment and shake tabletesting of electrical equipment.
Seismic re-evaluation of existing NPP was begun by the U.S. NRC in 1978 by its Systematic EvaluationProgram.(19) Results of this study suggested that NPP in the U.S. designed before 1972 should be re-evaluated for seismic design adequacy. In the U.S. approximately 69 plants fell into this category.
It was soon realized that use of conventional seismic analysis and shake table test design procedureswould result in a 10 to 20 million dollar engineering effort for each NPP. As a result a SeismicQualification Utility Group, SQUG, was organized by NPP owners which funded research into thebehavior of industrial equipment and distribution systems in actual strong motion damaging earthquakes.Twenty classes of equipment were evaluated. The evaluation developed caveats as to equipmentperformance, anchorage requirements and spatial interaction effects with other equipment and structuresall as a function of the level of seismic excitation. The SQUG evaluations and other evaluations(20) ofindustrial facilities response to strong motion earthquakes indicated that with careful control of theevaluation process, walkdowns of NPP could be performed and could be used to verify seismic designadequacy at a small fraction of the cost of conventional seismic analysis and tests. The applications of theearthquake experience to existing NPP typically took less than 10,000 engineering manhours per plant ata total cost including any necessary upgrade of less than $2,000,000 dollars. As shown in Table 7, the useof the indirect method of seismic evaluation of operability of nuclear power plant equipment andstandardization of the analysis of structural integrity could reduce engineering and construction costs of aNPP by $100 million dollars or by approximately 5 percent.
Given the success of this seismic verification effort by use of earthquake experience, the obvious questionis; can this procedure be applied to seismic qualification of new NPP construction?
SEISMIC CONTRIBUTION TO SAFETY
A question which has often been asked by the nuclear power plant owners is whether or not aseismicconstruction is a cost effective contribution to nuclear power plant safety. Until recently it has not beenpossible to evaluate numerically or comparatively the contribution of seismic design to NPP safety.However, there currently are a number of well defined and documented external as well as internalProbability Safety Assessments for existing NPP. It should be possible for example, to compare theinternal event core melt frequency for plants which have a 3 train safety system to a 2 train system andcompare these results with the external seismic event contribution to core melt frequency.
It remains to be seen if National Regulatory Authorities would permit or support the use of PSAevaluations to quantify and compare the contribution to core melt frequency or early radiological releaseif the resources used in seismic analysis and testing, versus use of experienced data and walkdowns, wereused to increase the number or of safety systems.
11
REFERENCES
(1) UBC-1967, “Uniform Building Code,” International Conference of Building Officials, 1967.
(2) Gumensky, D.B., “Earthquake and Earthquake Resistant Design,” in Abbetts American CivilEngineering Practice Vol. III, John Wiley and Sons, Inc., 1957.
(3) IAEA Safety Guide 50-SG-S1, “Earthquakes and Associated Topes in Relation to Nuclear PowerPlant Siting,” International Atomic Energy Agency, 1979.
(4) UBC-1988, “Uniform Building Code,” International Conference of Building Officials, 1988.
(5) CAN3-N289.1, “General Requirements for Seismic Qualification of CANDU Nuclear PowerPlants,” National Standard of Canada, 1980.
(6) CAN3-289.2, “Ground Motion Determination for Seismic Qualification of CANDU Nuclear
Power Plants,” National Standard of Canada, 1980.
(7) JEAG 4601-1987, “Technical Guidelines for Aseismic Design of Nuclear Power Plants,”Translated from Japanese, NUREG/CR 6241, June 1994.
(9) TID-7024, “Nuclear Reactors and Earthquakes,” U.S. Atomic Energy Commission, August 1963.
(10) R.G. 1.60, “Design Response Spectra for Seismic Design of Nuclear Power Plants,” Rev. 1, U.S.Atomic Energy Commission Regulatory Guide, December 1973.
(11) Newmark, Blume and Kapoor, K., “Design Response Spectra for Nuclear Power Plants,” ASCEStructural Engineering Meeting, San Francisco, April 1973.
(12) Newmark, N.M. and Hall, W.J., “Development of Criteria for Seismic Review of SelectedNuclear Power Plants,” NUREG/CR-0098 U.S. Nuclear Regulatory Commission, May 1978.
(13) NUREG/CR1047, “Procedural and Submittal Guidance for the Individual Plant Evaluation ofExternal Events (IPEEE) for Severe Accident”
(14) ASCE 4-98, “Seismic Analysis of Safety-Related Nuclear Structures and Commentary,”American Society of Civil Engineers, 2000.
(15) Dowding, C.H., Blast Vibration Monitoring and Control, Prentice Hall International Series, 1985.
(17) NUREG/CR-1508, “Evaluation of the Cost Effects on Nuclear Power Plant ConstructionResulting from the Increase in Seismic Design Level,” U.S. Nuclear Regulatory Commission,April 1981.
12
(18) WRC 426, Adams, T., and Stevenson, J.D., “Differential Design and Construction Cost ofNuclear Power Plant Piping Systems as a Function of Seismic Intensity and Time Period ofConstruction,” Welding Research Council Bulletin, November 1997.
(19) NUREG/CR-0891, “Seismic Review of Dresden Nuclear Power Station Unit 2 for the SystematicEvaluation Program,” U.S. Nuclear Regulatory Commission, April 1980.
(20) NUREG/CR-6239, “Survey of Strong Motion Earthquake Effects on Thermal Power Plants inCalifornia with Emphasis on Piping Systems,” Vols. 1 and 2 U.S. Nuclear RegulatoryCommission, November 1995.
13
APPENDIX A
SEISMIC INTENSITY SCALES
1. SEISMIC INTENSITY SCALE OF JAPAN METEOROLOGICAL AGENCY (JMA)
The intensity of the shock is estimated according to the scales 0 – VII, as follows:0. Not felt. Shocks not felt by human beings and registered only by a seismograph, but special
symbol (X) is used when shocks are felt by some neighbors, but not by observer.I. Slight. Extremely feeble shocks only felt by persons at rest or by those who are sensitive to an
earthquake.II. Weak. Shocks felt by most persons, slight shaking of doors and Japanese latticed sliding doors
(shoji).III. Rather strong. Slight shaking of houses and buildings; rattling of doors and Japanese latticed
sliding doors (Shoji); swinging of hanging objects like electric lamps; moving of liquids invessels.
IV. Strong. Strong shaking of houses and buildings, overturning of unstable objects, spilling ofliquids out of vessels.
V. Very strong. Cracks in the walls, overturning of gravestones, stone lanterns, etc., damage tochimneys and mud-and-plaster warehouses.
VI. Disastrous. Demolition of houses by less than 30%, intense landslides, etc.VII. Very disastrous. Demolition of houses by more than 30%, intense landslides, large fissures in the
Types of structures (buildings not anti-seismic) -
Structures:
A: Buildings in field-stone, rural structures, adobe houses, clay houses.B: Ordinary brick buildings, buildings of the large block and prefabricated type, half- timbered
Single, a few: about 5%Many: about 10%Most about 75%
Classification of Damage to Buildings
Grade 1: Slight damage. Fine cracks in plaster; fall of small pieces of plaster.
Grade 2: Moderate damage. Small cracks in walls; fall of fairly large pieces of plaster; pantiles slip off; cracks in chimneys; parts of chimneys falldown.
14
Grade 3: Heavy damage. Large and deep cracks in walls; fall of chimneys.
Grade 4: Destruction. Gaps in walls; parts of buildings may collapse; separate parts of the building lose their cohesion; inner walls and filled-inwalls of the frame collapse.
Grade 5: Total damage. Total collapse of buildings.
Arrangement of the Scale
(a) Persons and surroundings(b) Structures of all kinds(c) Nature
Intensity Grades
I. Not noticeable
The intensity of the vibration is below the limit of sensibility; the tremor is detected and recorded byseismographs only.
II. Scarcely noticeable (very slight)
Vibration is felt only by individual people at rest in house, especially on upper floors of buildings.
III. Weak, partially observed only
The earthquake is felt indoors by a few people, outdoors only in favorable circumstances. The vibrationis like that due to the passing of a light truck. Attentive observers notice a slight swinging of hangingobjects, somewhat more heavily on upper floors.
IV. Largely observed
The earthquake is felt indoors by many people, outdoors by a few. Here and there people awake, but noone is frightened. The vibration is like that due to the passing of a heavily loaded truck. Windows, doorsand dishes rattle. Floors and walls creak. Furniture begins to shake. Hanging objects swing slightly.Liquids in open vessels are slightly disturbed. In standing motor cars the shock is noticeable.
V. Awakening
(a) The earthquake is felt indoors by all, outdoors by many. Many sleeping people awake. A few runoutside. Animals become uneasy. Buildings tremble throughout. Hanging objects swing considerably.Pictures knock against walls or swing out of place. Occasionally pendulum clocks stop. Unstable objectsmay be overturned or shifted. Open doors and windows are thrust open and slam back again. Liquidsspin in small amounts from well-filled open containers. The sensation of vibration is like that due to aheavy object falling inside the buildings.
(b) Slight damage of Grade I in buildings of Type A is possible.
(c) Sometimes change in flow of springs.
15
VI. Frightening
(a) Felt by most, indoors and outdoors. Many people in buildings are frightened and run outdoors. Afew persons lose their balance. Domestic animals run out of their stalls. In a few instances dishes andglassware may break, books fall down. Heavy furniture may possibly move and small steeple bells mayring.
(b) Damage of Grade 1 is sustained in single buildings of Type B and in many of Type A. Damage in afew buildings of Type A is of Grade 2.
(c) In a few cases cracks up to widths of 1 cm possible in wet ground; in mountains occasionallandslides; changes in flow of springs and in level of well-water are observed.
VII. Damage to buildings
(a) Most people are frightened and run outdoors. Many find it difficult to stand. The vibration is noticedby persons driving motor cars.
(b) In many buildings of Type C damage of Grade 1 is caused; in many buildings of Type B damage is ofGrade 2. Many buildings of Type A suffer damage of Grade 3 and a few of Grade 4. In single instanceslandslips of roadway on steep slopes; cracks in roads; seams of pipelines damaged; cracks in stone walls.
(c) Waves are formed on water and water is made turbid by mud stirred up. Water levels in wells changeand flow of springs change. In a few cases dry springs have their flow restored and existing springs stopflowing. In isolated instances parts of sandy or gravelly banks slip off.
VIII. Destruction of buildings
(a) Fright and panic; also persons driving motor cars are disturbed. Here and there branches of treesbreak off. Even heavy furniture moves and partly overturns. Hanging lamps are in part damaged.
(b) Many buildings of Type C suffer damage of Grade 2, a few of Grade 3. Many buildings of Type Bsuffer damage of Grade 3 and a few of Grade 4 and many buildings of Type A suffer damage of Grade 4and a few of Grade 5. Occasional breakage of pipe seams. Memorials and monuments move and twist.Tombstones overturn. Stone walls collapse.
IX. General Damage to Buildings
(a) General panic; considerable damage to furniture. Animals run to and fro in confusion and cry.
(b) Many buildings of Type C suffer damage of Grade 3, a few of Grade 4. Many buildings of TypeB show damage of Grade 4, a few of Grade 5. Many buildings of Type A suffer damage of Grade 5.Monuments and columns fall. Considerable damage to reservoirs; underground pipes partly broken. Inindividual cases railway lines are bent and roadways damaged.
(c) On flat land, overflow of water, sand and mud is often observed. Ground cracks to widths of upto 10 cm, on slopes and river banks more than 10 cm; furthermore a large number of slight cracks inground; falls of rock, many landslides and earth flows; large waves on water. Dry wells renew their flowand existing wells dry up.
16
X. General Destruction of Buildings
(a) Many buildings of Type C suffer damage of Grade 4, a few of Grade 5. Many buildings of TypeB show damage of Grade 5; most of Type A have destruction Category 5; critical damage to dams anddykes and severe damage to bridges. Railway lines are bent slightly. Underground pipes are broken orbent. Road paving and asphalt show waves.
(b) In ground, cracks up to widths of more than 10 cm, sometimes up to 1 m. Broad fissures occurparallel to water courses. Loose ground slides from steep slopes. From riverbanks and steep coastsconsiderable landslides are possible. In coastal areas displacement of sand and mud; change of waterlevel in wells; water from canals, lakes, rivers, etc., thrown on land. New lakes occur.
XI. Catastrophe
(a) Severe damage even to well built buildings, bridges, water dams and railway lines; highwaysbecome useless; underground pipes destroyed.
(b) Ground considerably distorted by broad cracks and fissures, as well as by movement in horizontaland vertical directions, numerous landslips and falls of rock.
The intensity of earthquake requires to be investigated in a special way.XII. Landscape Changes
(a) Practically all structures above and below ground are greatly damaged or destroyed.
(b) The surface of the ground is radically changed. Considerable ground cracks with extensivevertical and horizontal movements are observed. Fall of rock and slumping of riverbanks over wideareas; lakes are dammed; and rivers are deflected.
The intensity of the earthquake requires to be investigated in a special way.
3. MODIFIED MERCALLI INTENSITY SCALE, 1956 VERSION
Classification of Masonry
Masonry A, B, C, D. To avoid ambiguity of language, the quality of masonry, brick or otherwise, isspecified by the following lettering (which has no connection with the conventional Class A, B, Cconstruction).
Masonry A. Good workmanship, mortar and design; reinforced, especially laterally, and bound togetherby using steel, concrete, etc.; designed to resist lateral forces.
Masonry B. Good workmanship and mortar; reinforced, but not designed in detail to resist lateral forces.
Masonry C. Ordinary workmanship and mortar; no extreme weaknesses like failing to tie in at corners,but neither reinforced nor designed against horizontal forces.
Masonry D. Weak materials, such as adobe, poor mortar, low standards of workmanship, weakhorizontally.
17
Intensity Grades
I. Not felt. Marginal and long period of large earthquakes.
II. Felt by persons at rest, on upper floors, or favorably placed.
III. Felt indoors. Hanging objects swing. Vibration like passing of light trucks. Duration estimated.May not be recognized as an earthquake.
IV. Hanging objects swing. Vibration like passing of heavy trucks; or sensation of a jolt like a heavyball striking the walls. Standing motorcars rock. Windows, dishes, doors rattle. Glasses clink.Crockery clashes. In the upper range of Grade IV, wooden walls and frames crack.
V. Felt outdoors; direction estimated. Sleepers wakened. Liquids disturbed, some spilled. Small
VI. Felt by all. Many frightened and run outdoors. Persons walk unsteadily. Windows, dishes,glassware broken. Knickknacks, books, and so on, off shelves. Pictures off walls. Furnituremoved or overturned. Weak plaster and Masonry D cracked. Small bells ring (church, school).Trees, bushes shaken visibly or heard to rustle.
VII. Difficult to stand. Noticed by drivers of motorcars. Hanging objects quiver. Furniture broken.Damage to Masonry D including cracks. Weak chimneys broken at roof line. Fall of plaster,loose bricks, stones, tiles, cornices, unbraced parapets, and architectural ornaments. Some cracksin Masonry C. Waves on ponds; water turbid with mud. Small slides and caving in and alongsand or gravel banks. Large bells ring. Concrete irrigation ditches damaged.
VIII. Steering of motorcars affected. Damage to Masonry C; partial collapse. Some damage toMasonry B; none to Masonry A. Fall of stucco and some masonry walls. Twisting, fall ofchimneys, factory stacks, monuments, towers, elevated tanks. Frame houses moved onfoundations if not bolted down; loose panel walls thrown out. Decayed piling broken off.Branches broken from trees. Changes in flow or temperature of springs and walls. Cracks in wetground and on steep slopes.
IX. General panic. Masonry D destroyed; Masonry C heavily damaged, sometimes with completecollapse; Masonry B seriously damaged. General damage to foundations. Frame structures, ifnot bolted, shifted off foundations. Frames racked. Conspicuous cracks in ground. In alleviatedareas sand and mud ejected, earthquake fountains, sand craters.
X. Most masonry and frame structures destroyed with their foundations. Some well built woodenstructures and bridges destroyed. Serious damage to dams, dikes, embankments. Largelandslides. Water thrown on banks of canals, rivers, lakes, etc., and mud shifted horizontally onbeaches and flat land. Rails bent slightly.
XI. Rails bent greatly. Underground pipelines completely out of service.
XII. Damage nearly total. Large masses displaced. Lines of sight and level distorted. Objects throwninto the air.
18
APPENDIX B
GRS SAFETY CODES AND GUIDES
The shocks induced by the aircraft impact shall be considered. This may be done[1] in the following way:
The stability of components or systems in the reactor building not supported by outside walls or arrangedat ceilings separated from outside walls and/or the base plate may be demonstrated by assuming anequivalent static load resulting from an acceleration of + 0.5 in horizontal or vertical direction in thefrequency range up to 16 Hz. In the frequency range exceeding 16 Hz it must be assumed that relativemotions up to 1mm, with respect to the component and the support, may be absorbed elastoplastically.
[1] Note:Condition for the admissibility of the described demonstration method is that the reactor buildings do not varyessentially in the following points from the reactor building of the NPP Grohnde, for which the admissibility of themethod had been demonstrated:
• ceilings and walls in the reactor building being separated from the outside walls• wall thickness and reinforcement of the outside walls• concrete quality• total weight• outside diameter• binding depth into the foundation soil• foundation sol conditions (the influence of soil attenuation is low). Only in case of extreme foundation
conditions is pile or rock foundation the admissibility of the application of the simplified demonstrationmethod shall be demonstrated.
For types of construction different from KWU-pressurized water reactors of the Nuclear Power Plant Grohnde typeand following as well as for other buildings to be protected than the reactor building, the value of the equivalentstatic load shall be determined by experts when using the simplified demonstration method.
19
TABLE 1 TYPICAL PEAK GROUND ACCELERATIONS CORRELATED WITH NTENSITYSCALES
PGA (g) MODIFIED MERCALLI MSK-64 INTENSITY>0.025 < IV < IV0.025 V V0.05 VI VI0.10 VII VII0.20 VIII VIII0.40 IX IX>0.40 X X
TABLE 2 FACILITY CLASSIFICATION IN JAPAN AS A FUNCTION OF A SEISMIC IMPORTANCE
Class As Facilities, damage of which may cause loss of coolant; facilities, which are required foremergency shutdown of the nuclear reactor and are needed to maintain the shutdown state ofthe reactor in a safe state; facility for storage of spent fuel; and nuclear reactor containment.
Class A Facilities, which are needed to protect the public from the radioactive hazard in the case of anuclear reactor accident, and facilities, malfunction of which may cause radioactive hazard tothe public, but are not classified as Class As.
Class B Facilities, which are related to the highly radioactive substance, but are not classified as ClassAs and Class A.
Class C Facilities, which are related to the radioactive substance, but are not classified in the aboveaseismic classes, and facilities not related to radioactive safety.
20
TABLE 3 CORRESPONDENCE BETWEEN ASEISMIC IMPORTANCE OF FACILITY AND BASIC EARTHQUAKE GROUND MOTION, STATIC SEISMICCOEFFICIENT, ETC. IN JAPAN(1,2)(11)
AseismicImportance
Basic earthquake groundmotion, story shear coefficient,static seismic coefficient
Horizontal(5,6,7) Vertical(8,9,10)
As Basic earthquake ground motion AS2 ½ AS2
Basic earthquake ground motion AS1 ½ AS1As, A Story shear coefficient,
Static seismic coefficient3.0 CI CV
Basic earthquake ground motion --- ---B Story shear coefficient 1.5 CI ---
(1) For Class AS and Class A facilities, the horizontal seismic force and the vertical seismic force dueto the basic earthquake ground motion are combined both in the unfavorable direction; and thehorizontal seismic force and vertical seismic force caused by the story shear coefficient or thestatic seismic coefficient are combined in the unfavorable direction.
(2) The static horizontal seismic force of the underground portion of the building/structure iscalculated by the horizontal seismic coefficient K specified for the underground portion. Thestatic horizontal seismic force of the underground portion of the equipment/piping system iscalculated from the value 20% larger than the horizontal seismic coefficient of thebuilding/structure at the location where said equipment is set.
(3) For building/structure, the horizontal seismic force is calculated from the story shear coefficient;the vertical seismic force is calculated from the vertical seismic coefficient.
(4) The static horizontal seismic force of the equipment/piping system is calculated by regarding thestory shear coefficient of the structure at the location of mounting as the seismic coefficient.
(5) AS2: Acceleration acting on the facility due to basic earthquake ground motion S2.(6) As1: Acceleration acting on the facility due to basic earthquake ground motion S1.(7) CI: Story shear coefficient.(8) CV: Vertical seismic coefficient for calculating static seismic force. (9) ½ AS2: ½ the value of the maximum acceleration amplitude of basic earthquake ground motion S2
is taken as the vertical seismic coefficient.(10) ½ AS1: ½ the value of the maximum acceleration amplitude of basic earthquake ground
motion S1 is taken as the vertical seismic coefficient.(11) Until recently Japanese NPP seismic design has applied vertical seismic motion as an
equivalent static coefficient not as a vertical response spectra.
21
TABLE 4 COMPARISON OF ONE-DEGREE-OF-FREEDOM MAXIMUM AMPLIFICATION FACTORS FOR HORIZONTAL(1) SOILBASED SEISMIC RESPONSE TO PEAK GROUND MOTION FOR VARIOUS DAMPING VALUES AND GENERICRESPONSE SPECTRA
Weighted AverageHousner
R.G. 1.60 Horizontal,Median(2,3) Plus OneStandard Deviation
20 -- -- -- -- -- -- 1.17 1.08 1.01Based on a standard deviation relative earthquake maximum values of ground motion,
Acceleration = 0.10g,Velocity = 4.8 in/sec,Displacement = 3.6 in.
(2) For vertical motion slightly different amplification values are defined.(3) Since a normal distribution was assumed, the median equals the mean for the density function assumed.(4) More recent earthquake data suggests a log-normal distribution of earthquake amplification is appropriate. The mean of the log-
normal distribution is approximately equal (85 percentile) to the mean or median of the normal distribution plus one standarddeviation.
(5) Peak spectral accelerations are at 40-50 Hz for CEUS recorded earthquakes while WUS recorded earthquakes maximum spectralaccelerations occur at 2 to 8 Hz. Peak CEUS earthquakes accelerations occur at spectral displacement values which typically do notcause damage to mechanical-civil structures.
22
TABLE 5 TYPICAL DAMPING FACTORS (PERCENT CRITICAL) USED IN DESIGN OF STRUCTURES, MECHANICAL ANDELECTRICAL EQUIPMENT AND DISTRIBUTION SYSTEMS
(1) Building damping, when determining floor or amplified response spectra, is dependent on stress levels. For building stress levels below0.8 yield use 4.0 percent; above 0.8 yield use 7 percent.
(2) For piping less than 12 inches in diameter dampings of1.0 and 2.0 percent critical for OBE and SSE respectively were specified.
23
TABLE 6: ESTIMATED DIRECT COST (IN 2000 U.S. DOLLARS) OF AN 1100-1300-MWe LIGHTWATER REACTOR PLANT CONSTRUCTED IN THE U.S. WITH NATURAL DRAFTEVAPORATIVE COOLING TOWERS FROM START OF PROJECT TO COMMERCIALOPERATION (120 MONTHS) INCLUDING A 0.2 TO 0.3G SSE PEAK GROUNDACCELERATION USING DIRECT SEISMIC DESIGN REQUIREMENT
ACCOUNTSEISMIC(2)
COSTTOTALCOST
DIRECT COST IN MILLIONSLand and land rights
Site specific seismic studies-spectra generationSoil site foundation media improvement
2.08.0
428
Sub-Total 10.0 14
Physical plant:Safety Class – Seismic Category I StructuresNon-Safety Class Structures
Spent fuel and nuclear waste storageMiscellaneous plant equipment (cooling tower)
4.2--11.0--10.23.0--
82502882501025554
Sub-Total 28.4 881
Spare parts allowanceContingency allowance
--5.0
5100
Sub-Total 5.0 105Distribution Systems
PipingCable Trays and ConduitDuct
105.04.01.0
250408
Sub-Total 110.0 298Direct Overhead Costs
Regulatory and licensingConstruction facilities, equipment and servicesA/E engineering conceptual and detailed designA/E engineering support during constructionConstruction management services
Start-up costs
1.0--40.04.0----
1584335655838
Sub-Total 45.0 595Cost at Commercial Operation
TOTAL 198.4 1893.0(1) Approximately two-thirds of the total is safety related.(2) For a 0.2 – 0.3g pga soft soil site.TABLE 7: ESTIMATED DIRECT COST (IN 2000 U.S. DOLLARS) OF AN 1100-1300-MWe LIGHT
WATER REACTOR PLANT CONSTRUCTED IN THE U.S. WITH NATURAL DRAFTEVAPORATIVE COOLING TOWERS FROM START OF PROJECT TO COMMERCIALOPERATION (120 MONTHS) INCLUDING A 0.2 TO 0.3G SSE PEAK GROUNDACCELERATION USING INDIRECT SEISMIC DESIGN REQUIREMENT
24
ACCOUNTSEISMIC(2)
COSTTOTALCOST
DIRECT COST IN MILLIONSLand and land rights
Site specific seismic studies-spectra generationSoil site foundation media improvement
2.08.0
428
Sub-Total 10.0 14
Physical plant:Safety Class – Seismic Category I StructuresNon-Safety Class Structures
Spent fuel and nuclear waste storageMiscellaneous plant equipment (cooling tower)
4.2--5.0--7.21.0--
8250282250995454
Sub-Total 13.2 871
Spare parts allowanceContingency allowance
--3.0
597
Sub-Total 3.0 102Distribution Systems
PipingCable Trays and ConduitDuct
40.03.01.0
145378
Sub-Total 44.0 190Direct Overhead Costs
Regulatory and licensingConstruction facilities, equipment and servicesA/E engineering conceptual and detailed designA/E engineering support during constructionConstruction management services
Start-up costs
1.0--8.04.0----
1584303655838
Sub-Total 13.0 563Cost at Commercial Operation
TOTAL 82.7 1740(1) Approximately two-thirds of the total is safety related.(2) For a 0.2 – 0.3g pga soft soil site.
Figure 5: Absolute response spectra (5% of critical damping) computed for M=6.5 atR=25 km using both single and double-corner frequency source spectra for WUS andCEUS conditions.
30
Figure 6: Second Approach Representative Floor Spectra Used in the Study – Rock Site (RockSpectra)
31
Figure 7: Second Approach Representative Floor Spectra Used in the Study – Soil Site (SoilSpectra)
32
Figure 8: No-Cracking Response Spectra (β=0.03) ( After Dowding, 1971)
33
Sing
le L
umpe
dM
ass M
odel
with
Sprin
g Su
ppor
ts
Sing
leLu
mpe
d M
ass
Mod
el w
ith6x
6 St
iffne
ssM
atrix
Supp
ort
Mul
ti-D
egre
e-of
-Fre
edom
Lum
ped
Mas
ses
Con
nect
ed b
y6x
6 St
iffne
ssM
atrix
es o
n a
Fixe
d B
ase
Mul
ti-D
egre
e-of
-Fre
edom
Lum
ped
Mas
ses
Con
nect
ed b
y6x
6 St
iffne
ssM
atrix
es o
n a
Sprin
g B
ase
Figu
re 9
: Ty
pica
l Lum
ped
Mas
s Mod
els
34
Figu
re 1
0: L
umpe
d M
ass 3
-D M
odel
with
Cen
ter o
f Mas
s Dis
plac
ed fr
om C
ente
r of S
hear
35
0.10 0.20 0.30 0.40 0.50 0.60 Safe Shutdown Earthquake (S2) Zero Period Ground Acceleration (g)
0
5
10
15
20
Perc
ent o
f Pla
nt C
ost
Figure 11: Best Estimate Seismic Cost Increase for Constructing Between 2000 and2010 Based on Direct Methods of Seismic Evaluation