Historical Monetary and Financial Statistics for Sweden, vol 2 - Published by the Riksbanken and Ekerlids 9 contributors: Sölvi Blöndal, Jan Bohlin, Rodney Edvinsson, Klas Fregert, Roger Gustafsson, Tor Jacobson, Johan Söderberg, Daniel Waldenström, Anders Ögren. Editors: Rodney Edvinsson, Stockholms University Tor Jacobson, Riksbanken Daniel Waldenström, Uppsala University
Transcript
Historical Monetary and Financial Statistics for Sweden, vol 2
- Published by the Riksbanken and Ekerlids 9 contributors: Sölvi Blöndal, Jan Bohlin, Rodney Edvinsson, Klas Fregert, Roger Gustafsson, Tor Jacobson, Johan Söderberg, Daniel Waldenström, Anders Ögren.
Editors: Rodney Edvinsson, Stockholms University
Tor Jacobson, Riksbanken Daniel Waldenström, Uppsala University
The project Historical Monetary and Financial Statistics for Sweden
The project started in 2006. Inspiration from Historical Monetary Statistics for
Norway Why the Riksbank? 1) Scientific task to
reconstruct historical data. 2) Continuity 3) Deeper knowledge of its own history 4) History offers better predictions
For different users and analytical purposes. A database was launched in 2008. first volume was published in 2010, focus on
exchange rates, prices and wages. The books are written in English, to reach
international audience.
Historical Monetary and Financial Statistics for Sweden. Vol 1 (2010) 1. Introduction
2. Swedish monetary standards in a historical perspective
3. Swedish Payment Systems 995–1534
4. The multiple currencies of Sweden-Finland 1534–1803
5. Foreign exchange rates 1658–1803
6. Foreign exchange rates 1804–1914
7. The Swedish krona, 1913–2008
8. Swedish consumer prices 1290–2008
9. Wages of unskilled labourers, 1365-1864
10. Wages of manufacturing workers, 1860–2007
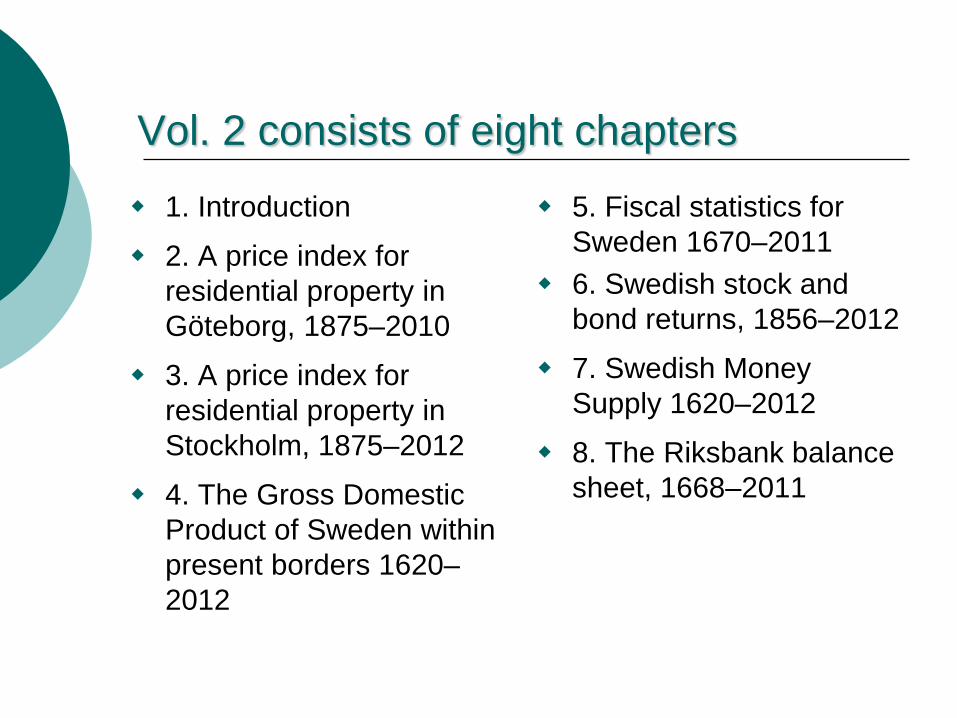
Vol. 2 consists of eight chapters
1. Introduction
2. A price index for residential property in Göteborg, 1875–2010
3. A price index for residential property in Stockholm, 1875–2012
4. The Gross Domestic Product of Sweden within present borders 1620–2012
5. Fiscal statistics for Sweden 1670–2011
6. Swedish stock and bond returns, 1856–2012
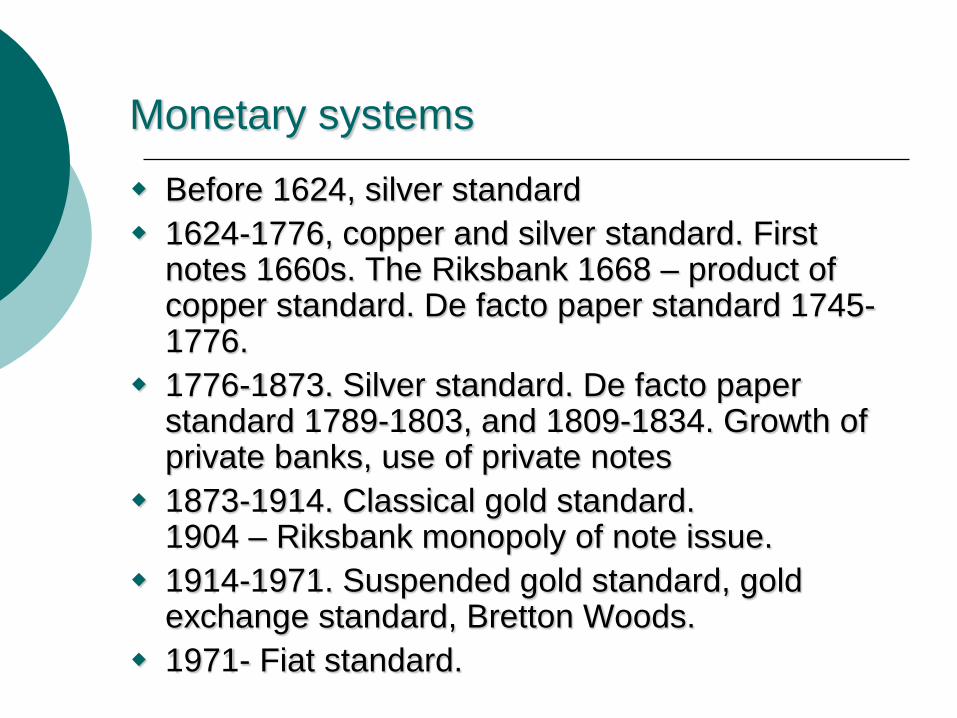
7. Swedish Money Supply 1620–2012
8. The Riksbank balance sheet, 1668–2011
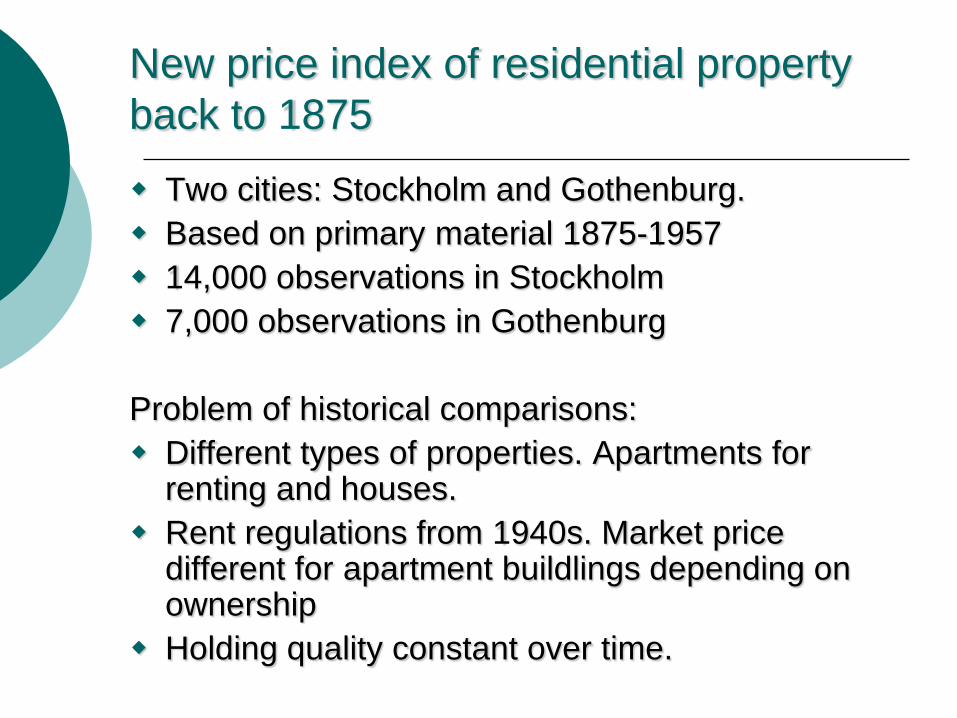
New price index of residential property back to 1875
Two cities: Stockholm and Gothenburg. Based on primary material 1875-1957 14,000 observations in Stockholm 7,000 observations in Gothenburg
Problem of historical comparisons: Different types of properties. Apartments for
renting and houses. Rent regulations from 1940s. Market price
different for apartment buildlings depending on ownership
Holding quality constant over time.
Hötorget 1880s. Large parts of today’s inner city countryside before
Upturn in real property prices 1995-2010 unprecedented historically
0
20
40
60
80
100
120
140
160
180
200
1875-1905 1918-1931 1955-1979 1985-1990 1995-2010
Growth, per cent
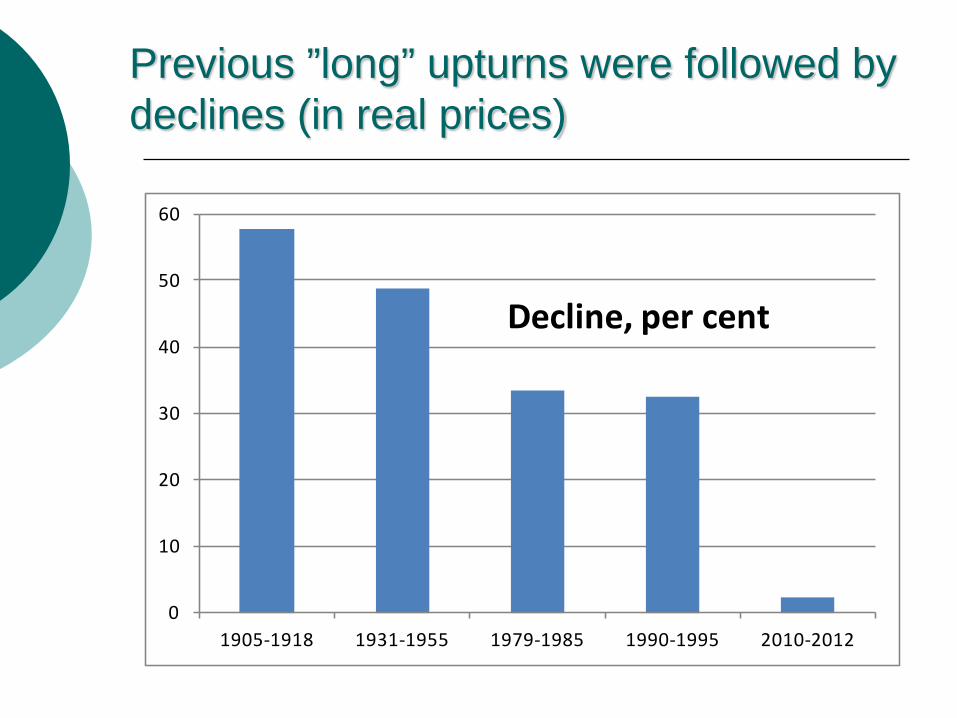
Previous ”long” upturns were followed by declines (in real prices)
0
10
20
30
40
50
60
1905-1918 1931-1955 1979-1985 1990-1995 2010-2012
Decline, per cent
Property prices Stockholm/Gothenburg (apartments up to 1957, houses after 1957) deflated by different nominal series
25
50
100
200
400
800
1875 1900 1925 1950 1975 2000
Deflated by GDP/capita Deflated by cost-of building index
Deflated by cost of building per square metre Deflated by CPI
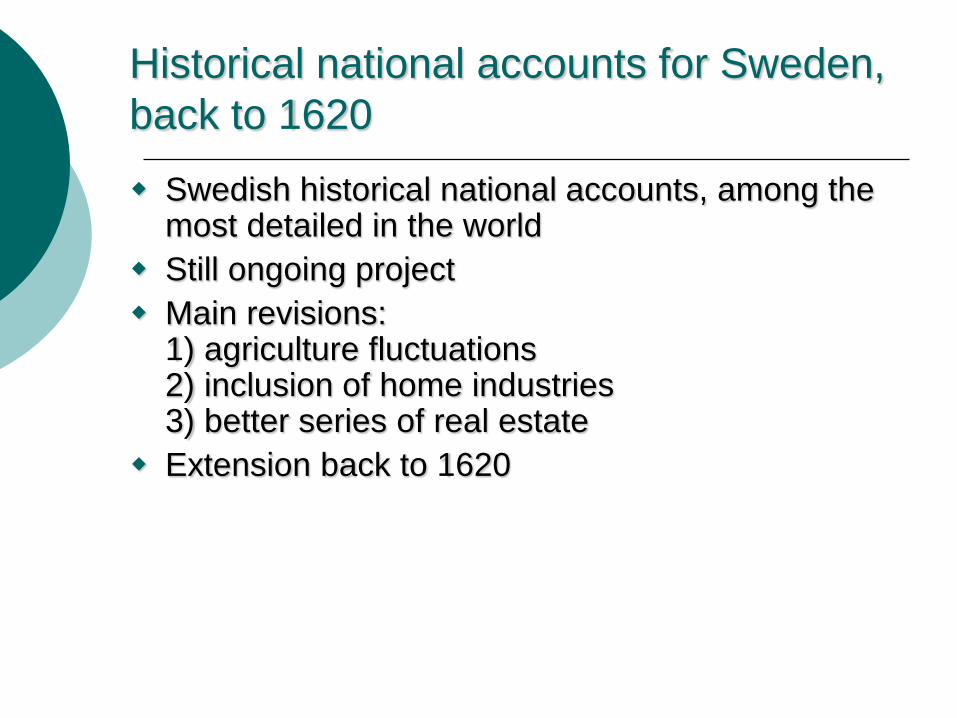
Historical national accounts for Sweden, back to 1620
Swedish historical national accounts, among the most detailed in the world
Still ongoing project Main revisions:
1) agriculture fluctuations 2) inclusion of home industries 3) better series of real estate
Extension back to 1620
Primary material unique internationally, not used previously
Trend per capita GDP growth (HP-filter with λ=1000)
-2
-1
0
1
2
3
4
1600 1650 1700 1750 1800 1850 1900 1950 2000
Swedish GDP per capita relative to its trend (HP-filter, λ=100)
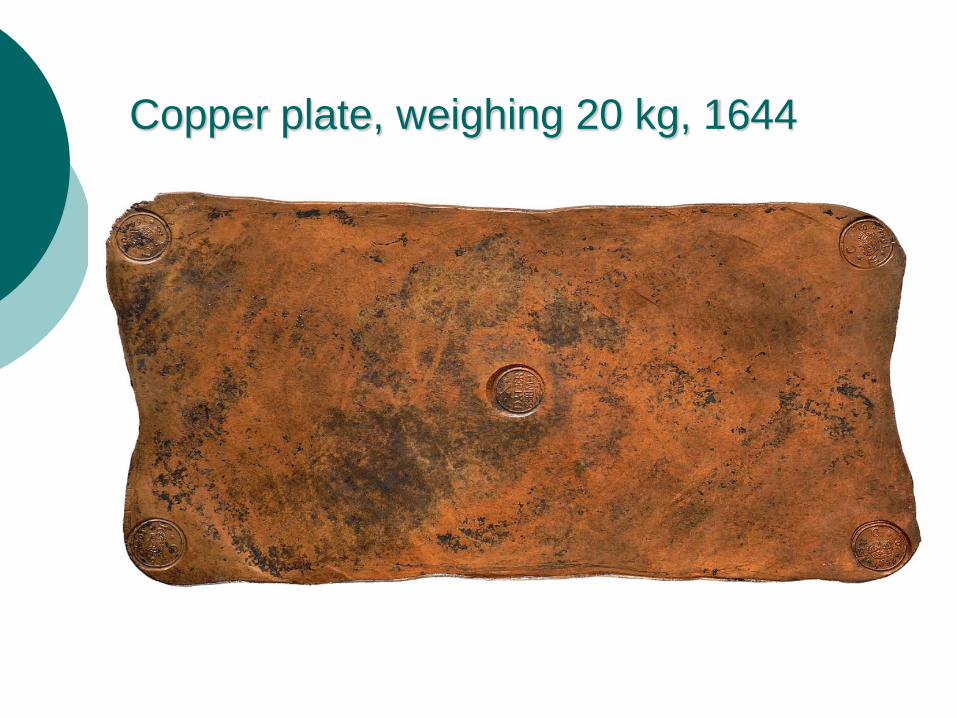
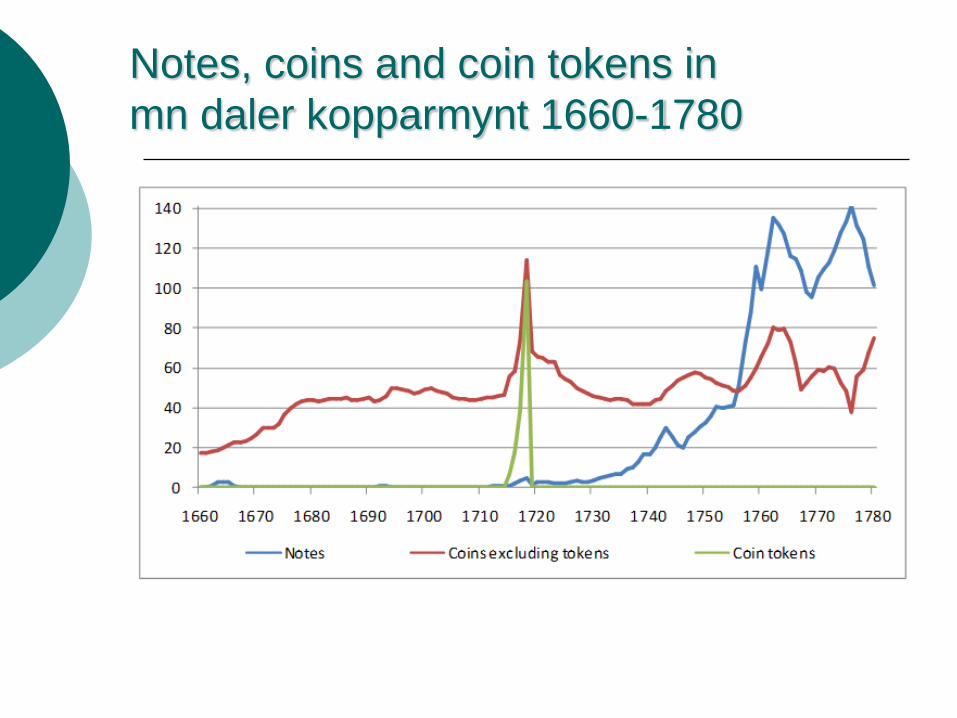
Notes, coins and coin tokens in mn daler kopparmynt 1660-1780
Stockholm banco account books damaged in fire.
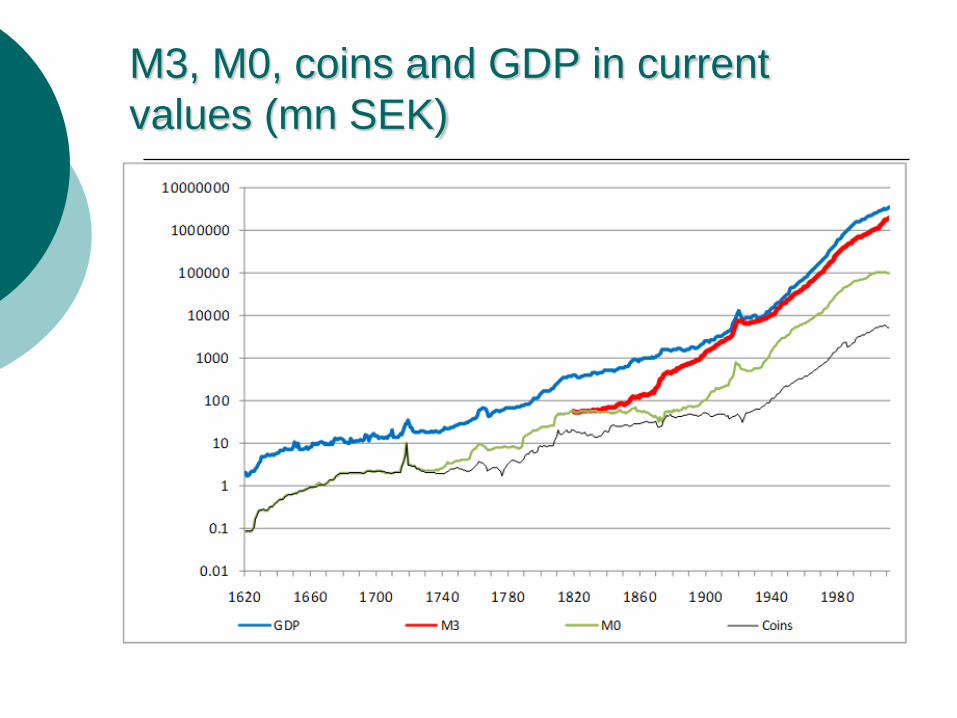
M3, M0, coins and GDP in current values (mn SEK)
Future continuation or off-shots of the project?
Update database on Riksbank’s homepage Property prices, back to the 1400s, more towns,
different types of properties Bank statistics National wealth National income, wage and capital shares Revise GDP, SNA2008, back to Middle Ages Interest rates, bonds, private banks Money supply, monthly CPI, monthly International cooperations