NREL is a national laboratory of the U.S. Department of Energy, Office of Energy Efficiency and Renewable Energy, operated by the Alliance for Sustainable Energy, LLC. DOE Algal Biofuels Workshop Philip T. Pienkos NREL December 9, 2008 National Algal Biofuels Technology Roadmap Workshop University of Maryland NREL/PR-510-45622 Historical Overview of Algal Biofuel Technoeconomic Analyses
Transcript
NREL is a national laboratory of the U.S. Department of Energy, Office of Energy Efficiency and Renewable Energy, operated by the Alliance for Sustainable Energy, LLC.
DOE Algal BiofuelsWorkshop
Philip T. PienkosNREL
December 9, 2008
National Algal BiofuelsTechnology Roadmap Workshop
University of MarylandNREL/PR-510-45622
Historical Overview of Algal Biofuel Technoeconomic Analyses
National Renewable Energy Laboratory Innovation for Our Energy Future
You Are Here
Patents approved; prepare to collect
royalties.
Sell stake to
oil company.
Low cost feedstock becomes
available; begin process
development. Algal biofuels make up
significant proportion of
renewable fuel portfolio..
National Renewable Energy Laboratory Innovation for Our Energy Future
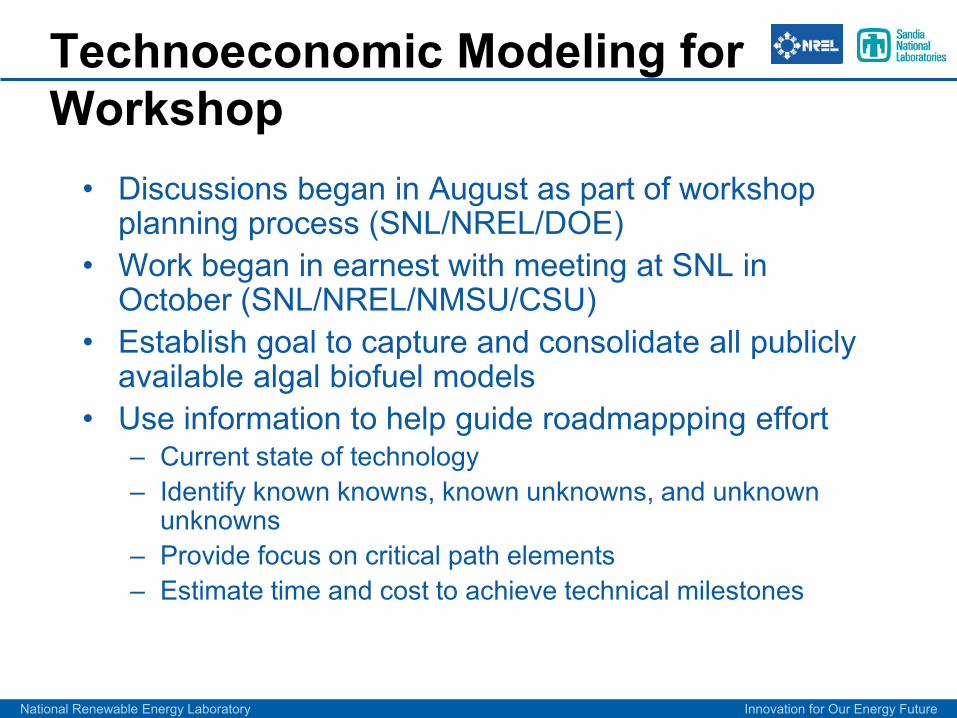
Technoeconomic Modeling for Workshop• Discussions began in August as part of workshop
planning process (SNL/NREL/DOE)• Work began in earnest with meeting at SNL in
October (SNL/NREL/NMSU/CSU)• Establish goal to capture and consolidate all publicly
available algal biofuel models• Use information to help guide roadmappping effort
– Current state of technology– Identify known knowns, known unknowns, and unknown
unknowns– Provide focus on critical path elements– Estimate time and cost to achieve technical milestones
National Renewable Energy Laboratory Innovation for Our Energy Future
Cast of Characters
• NREL– Al Darzins– David Humbird– Phil Pienkos
• NMSU– Pete Lammers– Meghan Starbuck
• CSU– Bryan Willson
• SNL– Katherine Dunphy-Guzman– Ray Finley– Geoff Klise– Len Malczynski– Ron Pate– Amy Sun– Cecelia Williams
National Renewable Energy Laboratory Innovation for Our Energy Future
Acknowledgements
These people did most of the heavy lifting, consolidating information from a variety of models and providing key slides for this presentation:
National Renewable Energy Laboratory Innovation for Our Energy Future
Longer Term Purpose, Goals and Desired Outcomes for Algae R&D Program• Assess algal biofuel production scale-up potential, constraints, consequences, preferred paths
- technical, economic, environmental, policy- comparative tradeoffs of alternative technologies/systems/processes pathways
• Understand and quantify impact(s) of proposed R&D strategies using key selected criteria or “objective function” metrics that can be represented as model parameters… use to inform and guide R&D investments and monitor performance of technology, process and applications development
• Project cost (& other performance metrics) of biofuel feedstock and/or biofuels production
• Project cost (& other performance metrics) of co-product feedstock or co-products production
• Inform policy decisions
Algal Biofuels TE Modeling & AnalysisNear Term Purpose, Goals & Plans for Algae Roadmap Workshop
• Updated Presentation on Current Status of Algae Biofuels Techno-Economics
• Formulate key questions for workshop breakouts to inform TE modeling & assessment
• Conduct evening session at workshop on Algae TE Modeling & Analysis- present and elicit expert comment on strawman TE modeling / analysis purpose, goals, & approach - present and elicit expert feedback comments / suggestions on baseline systems/processes diagram- present and elicit expert comment on strawman list of system & process evaluation criteria/metrics- elicit initial expert evaluation of systems, processes, and pathways based on evaluation criteria/metrics
National Renewable Energy Laboratory Innovation for Our Energy Future
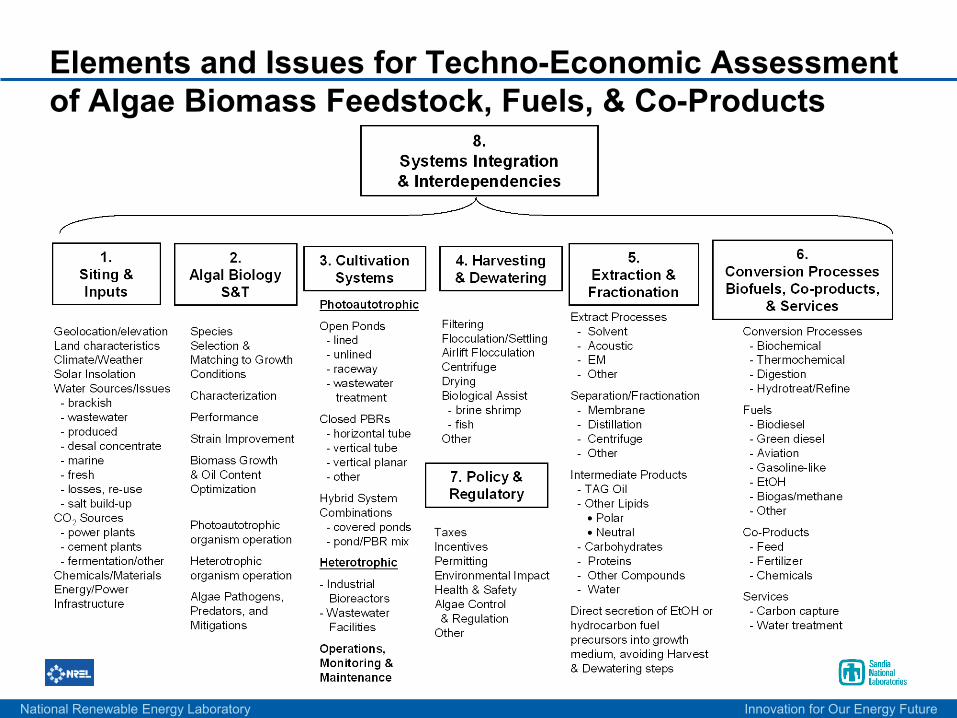
Elements and Issues for Techno-Economic Assessmentof Algae Biomass Feedstock, Fuels, & Co-Products
National Renewable Energy Laboratory Innovation for Our Energy Future
Process Flow Diagram
1.0
Siting
2.1 Algal speci es
3.0 C ultivation
1.5.3 Water Treatment
4.0 H arvesting / D e-watering
5.0 Extraction & Separation
6.1 C onversion to
Biofuels
6.2 C onversion to
Co-products
10.0 Water Captur e
3.4 Wast ewater Photoautotrophic & Heterotrophic;Co-generati on
3.2 Open syst ems
3.1 Closed systems
3.3 H ybrid systems
1.2 CO2
1.5 Water
2.2 N utrients (NPK)
1.1 Land
1.3 F acilities
2.3 Pathogens, predators
1.4 Primar y Energ y
4.6 Wet algal or biological assi st derivati ve biomass
4.5 Biological Assi st Harves ting (shrimp, fish excrement, etc.)
1.5.1 Primar y water source (saline/br ackish/was tewater)
1.5.2 Fresh water source
OUTPUT
INPUT
PROCESS CATEGORY
PROCESS
National Renewable Energy Laboratory Innovation for Our Energy Future
Comparative TE analysis results depend on metrics used• Minimize Capital Costs per unit of biofuel• Minimize Operating Costs per unit of biofuel• Maximize Biofuel Production Yield• Minimize net GHG Footprint per unit of biofuel produced • Maximize net Energy Balance• Minimize net Water Usage• Minimize Land Footprint per unit of biofuel produced• Minimize Time Required to reach desired production
volume• Minimize Investment Needed to reach desired prod.
volume
Evaluation Criteria & Objective Functions
Total Production Cost $/gal
National Renewable Energy Laboratory Innovation for Our Energy Future
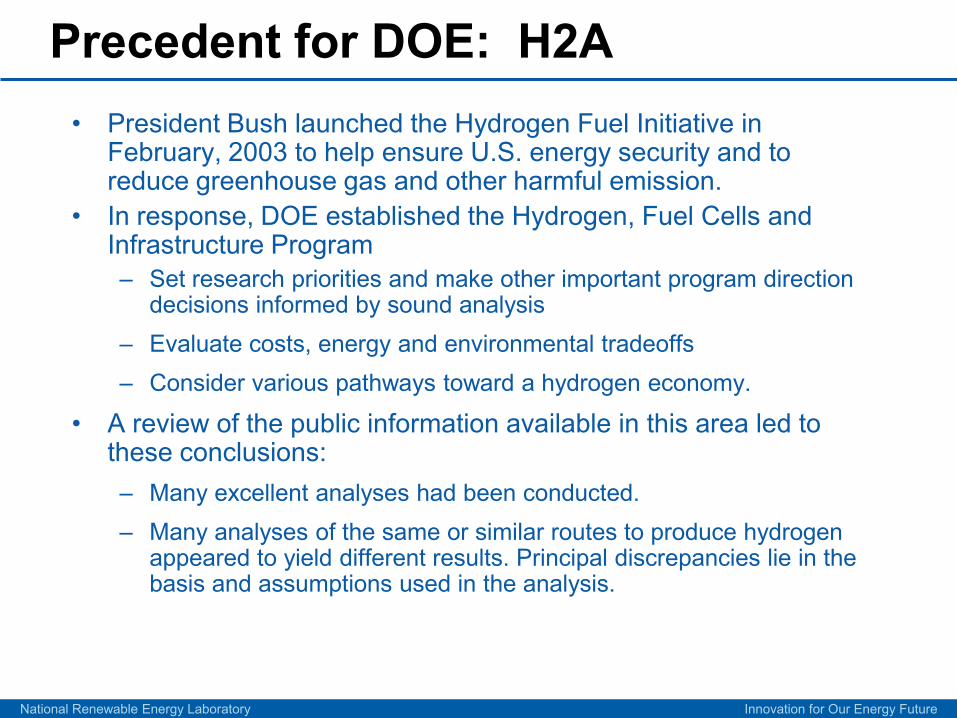
Precedent for DOE: H2A• President Bush launched the Hydrogen Fuel Initiative in
February, 2003 to help ensure U.S. energy security and to reduce greenhouse gas and other harmful emission.
• In response, DOE established the Hydrogen, Fuel Cells and Infrastructure Program– Set research priorities and make other important program direction
decisions informed by sound analysis – Evaluate costs, energy and environmental tradeoffs – Consider various pathways toward a hydrogen economy.
• A review of the public information available in this area led to these conclusions:– Many excellent analyses had been conducted. – Many analyses of the same or similar routes to produce hydrogen
appeared to yield different results. Principal discrepancies lie in the basis and assumptions used in the analysis.
National Renewable Energy Laboratory Innovation for Our Energy Future
H2A Objectives
• Establish a standard format and list of parameters for reporting analysis results for central production, distributed (forecourt) production, and delivery.
• Seek better validation of public analyses through dialog with industry.
• Enhance understanding of the differences among publicly available analyses and make these differences more transparent.
• Establish a mechanism for facile dissemination of public analysis results.
• Work to reach consensus on specific analysis parameters for production and delivery.
National Renewable Energy Laboratory Innovation for Our Energy Future
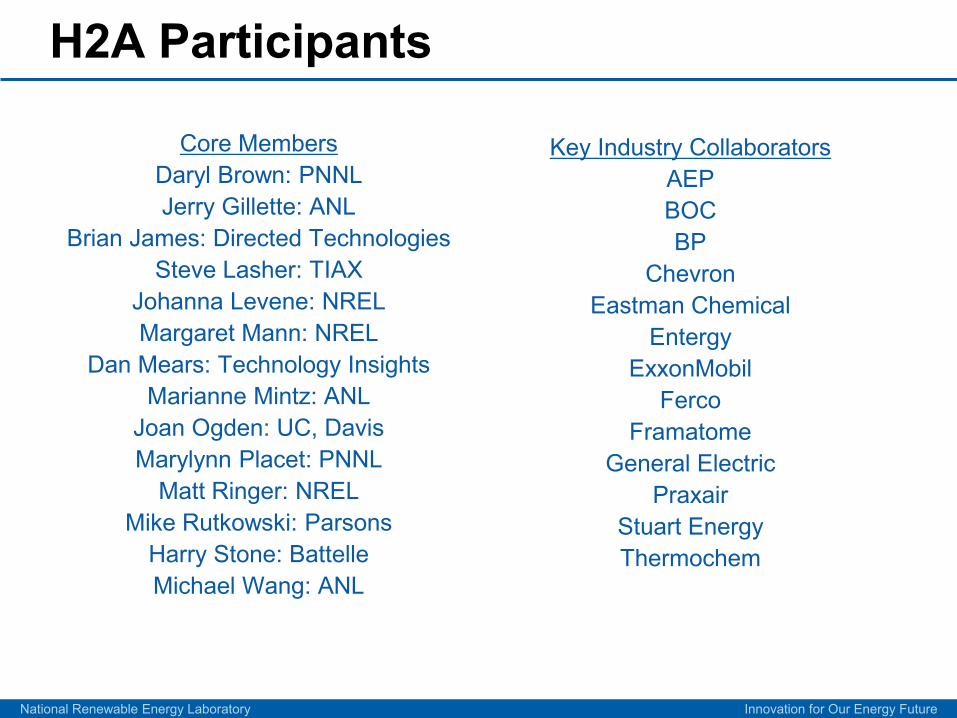
H2A Participants
Core MembersDaryl Brown: PNNL Jerry Gillette: ANL
Brian James: Directed Technologies Steve Lasher: TIAX
Johanna Levene: NREL Margaret Mann: NREL
Dan Mears: Technology Insights Marianne Mintz: ANL
Joan Ogden: UC, Davis Marylynn Placet: PNNL
Matt Ringer: NREL Mike Rutkowski: Parsons
Harry Stone: Battelle Michael Wang: ANL
Key Industry CollaboratorsAEPBOCBP
ChevronEastman Chemical
EntergyExxonMobil
FercoFramatome
General ElectricPraxair
Stuart EnergyThermochem
National Renewable Energy Laboratory Innovation for Our Energy Future
H2A Analyses• Original source(s) of all the data (i.e., report title, authors, etc.) • Basic process information (feedstock and energy inputs, size of plant,
co-products produced, etc.) • Process flowsheet and stream summary (flowrate, temperature,
pressure, composition of each stream) • Technology performance assumptions (e.g., process efficiency and
schedule, plant lifetime, income tax rate, capacity factor, etc.) • Calculation of the discounted cash flow (the calculation procedure is
built into the standardized spreadsheet so that all technologies use the same methodology)
• Results (plant-gate hydrogen selling price and cost contributions in $/kg H2, operating efficiency, total fuel and feedstock consumption, and emissions)
• Sensitivity of the results to assumptions (e.g., feedstock cost, co-product selling price, capital cost, operating costs, internal rate of return, conversion efficiencies, etc.)
• Quantification of the level of uncertainty in the analysis
National Renewable Energy Laboratory Innovation for Our Energy Future
H2A Production Technologies
• Central Production of Hydrogen – Coal Gasification: Hydrogen Production – Coal Gasification: Hydrogen and Electricity Production – Natural Gas Hydrogen Production – Biomass Gasification Hydrogen Production – Nuclear Energy Hydrogen Production – Wind Electrolysis Hydrogen Production
• Forecourt Production of Hydrogen – Natural Gas Reforming – Electrolysis – Reforming of Ethanol sourced from biomass – Reforming of Methanol sourced from biomass
National Renewable Energy Laboratory Innovation for Our Energy Future
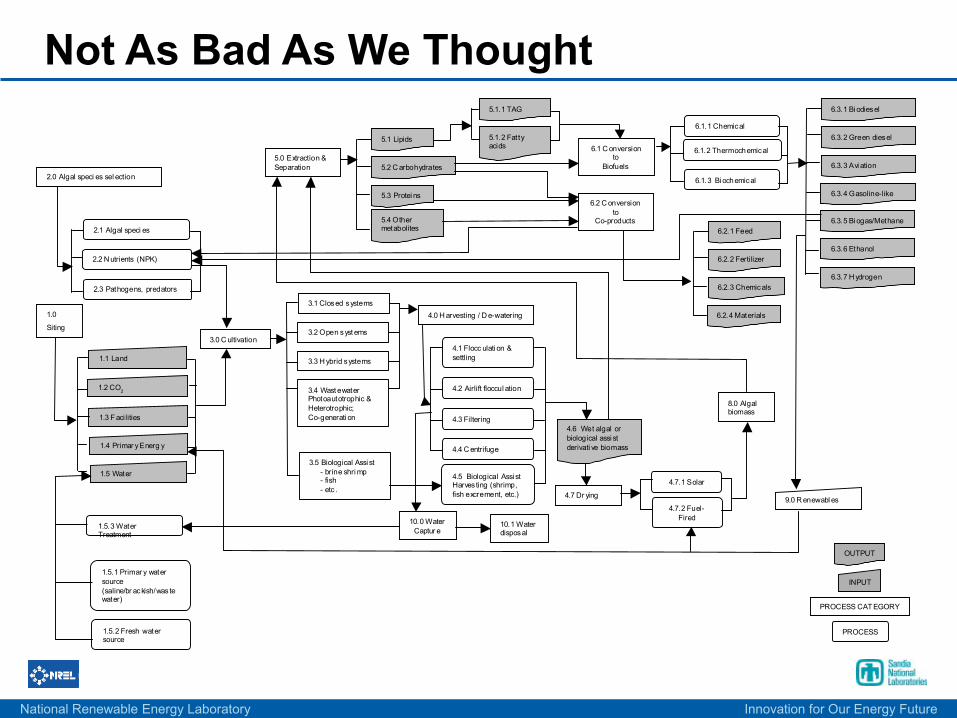
Not As Bad As We Thought
1.0
Siting
2.1 Algal speci es
3.0 C ultivation
1.5.3 Water Treatment
4.0 H arvesting / D e-watering
5.0 Extraction & Separation
6.1 C onversion to
Biofuels
6.2 C onversion to
Co-products
10.0 Water Captur e
3.4 Wast ewater Photoautotrophic & Heterotrophic;Co-generati on
3.2 Open syst ems
3.1 Closed systems
3.3 H ybrid systems
1.2 CO2
1.5 Water
2.2 N utrients (NPK)
1.1 Land
1.3 F acilities
2.3 Pathogens, predators
1.4 Primar y Energ y
4.6 Wet algal or biological assi st derivati ve biomass
National Renewable Energy Laboratory Innovation for Our Energy Future
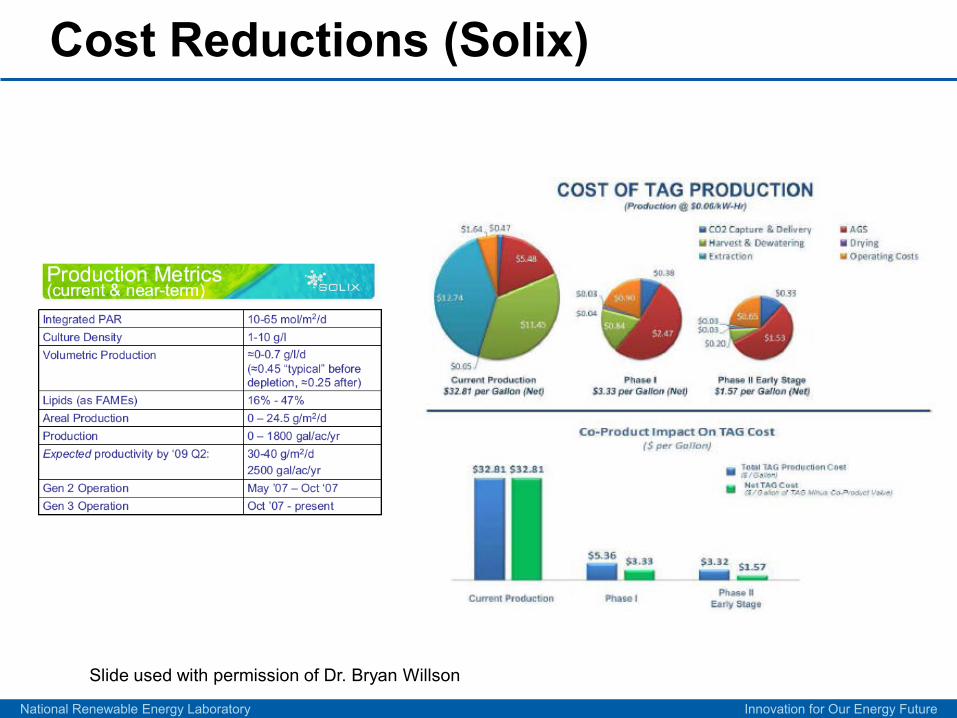
Cost Reductions (Solix)
Slide used with permission of Dr. Bryan Willson
National Renewable Energy Laboratory Innovation for Our Energy Future
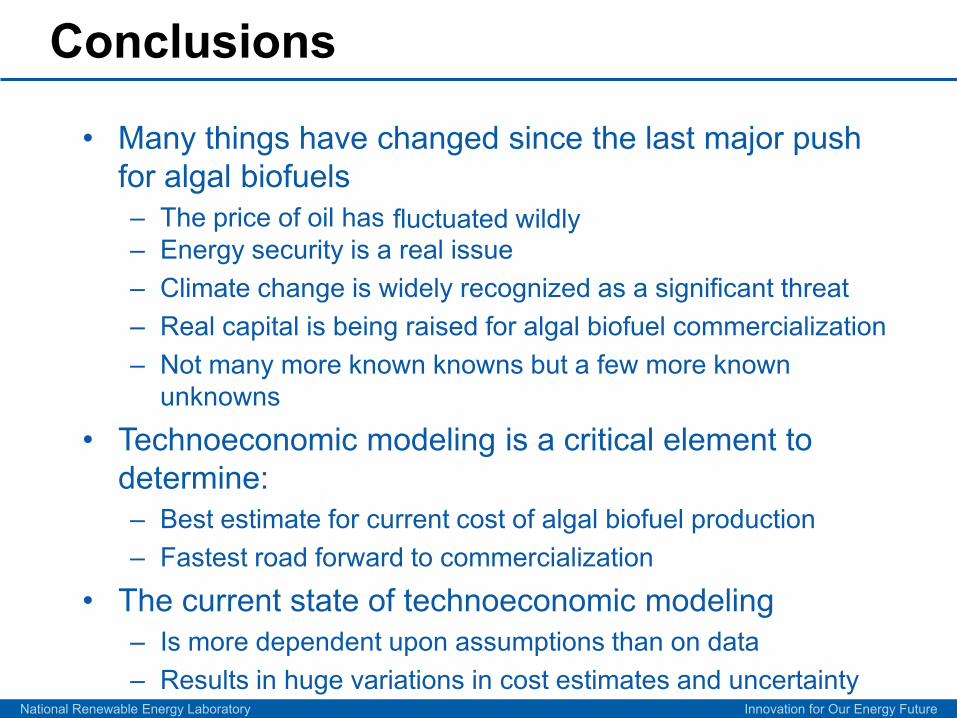
Conclusions
• Many things have changed since the last major push for algal biofuels– The price of oil has gone upgone downfluctuated wildly– Energy security is a real issue– Climate change is widely recognized as a significant threat– Real capital is being raised for algal biofuel commercialization– Not many more known knowns but a few more known
unknowns
• Technoeconomic modeling is a critical element to determine:– Best estimate for current cost of algal biofuel production– Fastest road forward to commercialization
• The current state of technoeconomic modeling– Is more dependent upon assumptions than on data – Results in huge variations in cost estimates and uncertainty
National Renewable Energy Laboratory Innovation for Our Energy Future
Conclusions, continued
• Modeling for algal biofuel production is extremely complicated– Alternative approaches to cultivation, harvest, extraction– Different assumptions about input costs and byproduct values– Availability of essential resources (sunlight, land, CO2, and water)
vary significantly across the US and models must take these variations into account
• The H2A program for hydrogen production and storage can provide valuable insight and precedent for improved modeling
• The work initiated for this workshop is a step towards the development of a unified model that can be shared with all stakeholders to provide a common metric to measure progress towards the goal of commercialization of algal biofuels.