Fisheries catch reconstructions: Islands, Part I, Zeller and Harper 77 HISTORICAL PERSPECTIVE OF SABAH‘S MARINE FISHERIES 1 Louise S. Teh a , Lydia C. Teh a , Dirk Zeller a and Annadel Cabanban b a Sea Around Us Project, Fisheries Centre, University of British Columbia, 2202 Main Mall, Vancouver, British Columbia V6T 1Z4 b ASC Ecological and Engineering Solutions, Valencia Drive, Daro Dumaguete City 6200, Philippines [email protected]; [email protected]; [email protected]; [email protected]ABSTRACT This study reconstructs the marine fisheries catches for the Malaysian state of Sabah from 1950-2006. Sabah‘s fisheries are exploited by a commercial and small -scale sector. Although landings statistics of both sectors are recorded annually, it is recognized that small-scale fisheries landings are underestimated due to a large number of unlicensed local and migrant fishers. The presence of unlicensed trawl vessels indicates that reported commercial landings are also likely underestimated. Our reconstruction indicates that from 1950-2006, Sabah‘s marine catches were 2.5 times higher than landings reported in the official statistics. We find that trawler discards totaled over 970,000 million tonnes from 1965-1990, which was around 95% of the quantity of marine landings recorded for this period. Further, in the past decade, the number of small-scale fishers may have been on average 3 times higher than the number recorded in the annual fisheries statistics, resulting in a level of fishing pressure which far exceeds that which is currently perceived. Finding ways to address this unreported fishing effort is therefore a priority for the government, especially since Sabah‘s small-scale fisheries focus on coral reefs, which have already been extensively damaged throughout Sabah. Overall, our findings suggest the need for a better understanding about the level of fisheries exploitation in Sabah, and by extension, likely in all of Malaysia. INTRODUCTION Marine fisheries play an important role in Malaysia for their contribution to food security, foreign exchange through exports, and job creation (Gopinath and Puvanesuri, 2006). Sabah is the second highest producer of marine fish landings in Malaysia, contributing an average of 15% of the country‘s annual marine landings from 2000- 2006. The Sabah Fisheries Department reports annual statistics of marine landings, number of licensed fishing boats, gears, and fishers. However, it is recognized that marine landings and the number of fishers are underestimated (Mohammad Ariff, 1999; Biusing, 2001). The effect of this is felt particularly in the small-scale traditional sector, due to the widespread and scattered nature of these fisheries. In other countries, failure to account for small-scale fisheries have led to a substantial underestimation of fisheries catches (Zeller et al., 2006). Further, unlicensed commercial fishing effort may be exerting additional pressure on already stressed fisheries resources. Our objective is thus to reconstruct Sabah‘s total marine catches 1 Cite as: Teh, L. S., Teh, L. C., Zeller, D. and Cabanban, A. (2009) Historical perspective of Sabah‘s marine fisheries. pp. 77-98. In: Zeller, D. and Harper, S. (eds.) Fisheries catch reconstructions: Islands, Part I. Fisheries Centre Research Reports 17 (5). Fisheries Centre, University of British Columbia [ISSN 1198-6727]. Figure 1. Map of Borneo, showing Sabah and Sarawak. Parts of Peninsular Malaysia are shown on the left. 120° E 115° E 110° E 105° E 10° N 5° N 0° 5° S Sabah 0 300 Km Peninsular Malaysia Sarawak Indonesia ± South China Sea Sulu Sea Sulawesi Sea
Transcript
Fisheries catch reconstructions: Islands, Part I, Zeller and Harper 77
HISTORICAL PERSPECTIVE OF SABAH‘S MARINE FISHERIES1
Louise S. Teha, Lydia C. Teha, Dirk Zellera and Annadel Cabanbanb
a Sea Around Us Project, Fisheries Centre, University of British Columbia, 2202 Main Mall, Vancouver, British Columbia V6T 1Z4
bASC Ecological and Engineering Solutions, Valencia Drive, Daro Dumaguete City 6200, Philippines
ABSTRACT This study reconstructs the marine fisheries catches for the Malaysian state of Sabah from 1950-2006. Sabah‘s fisheries are exploited by a commercial and small-scale sector. Although landings statistics of both sectors are recorded annually, it is recognized that small-scale fisheries landings are underestimated due to a large number of unlicensed local and migrant fishers. The presence of unlicensed trawl vessels indicates that reported commercial landings are also likely underestimated. Our reconstruction indicates that from 1950-2006, Sabah‘s marine catches were 2.5 times higher than landings reported in the official statistics. We find that trawler discards totaled over 970,000 million tonnes from 1965-1990, which was around 95% of the quantity of marine landings recorded for this period. Further, in the past decade, the number of small-scale fishers may have been on average 3 times higher than the number recorded in the annual fisheries statistics, resulting in a level of fishing pressure which far exceeds that which is currently perceived. Finding ways to address this unreported fishing effort is therefore a priority for the government, especially since Sabah‘s small-scale fisheries focus on coral reefs, which have already been extensively damaged throughout Sabah. Overall, our findings suggest the need for a better understanding about the level of fisheries exploitation in Sabah, and by extension, likely in all of Malaysia.
INTRODUCTION Marine fisheries play an important role in Malaysia for their contribution to food security, foreign exchange through exports, and job creation (Gopinath and Puvanesuri, 2006). Sabah is the second highest producer of marine fish landings in Malaysia, contributing an average of 15% of the country‘s annual marine landings from 2000-2006. The Sabah Fisheries Department reports annual statistics of marine landings, number of licensed fishing boats, gears, and fishers. However, it is recognized that marine landings and the number of fishers are underestimated (Mohammad Ariff, 1999; Biusing, 2001). The effect of this is felt particularly in the small-scale traditional sector, due to the widespread and scattered nature of these fisheries. In other countries, failure to account for small-scale fisheries have led to a substantial underestimation of fisheries catches (Zeller et al., 2006). Further, unlicensed commercial fishing effort may be exerting additional pressure on already stressed fisheries resources. Our objective is thus to reconstruct Sabah‘s total marine catches
1 Cite as: Teh, L. S., Teh, L. C., Zeller, D. and Cabanban, A. (2009) Historical perspective of Sabah‘s marine fisheries. pp. 77-98. In: Zeller, D. and Harper, S. (eds.) Fisheries catch reconstructions: Islands, Part I. Fisheries Centre Research Reports 17 (5). Fisheries Centre, University of British Columbia [ISSN 1198-6727].
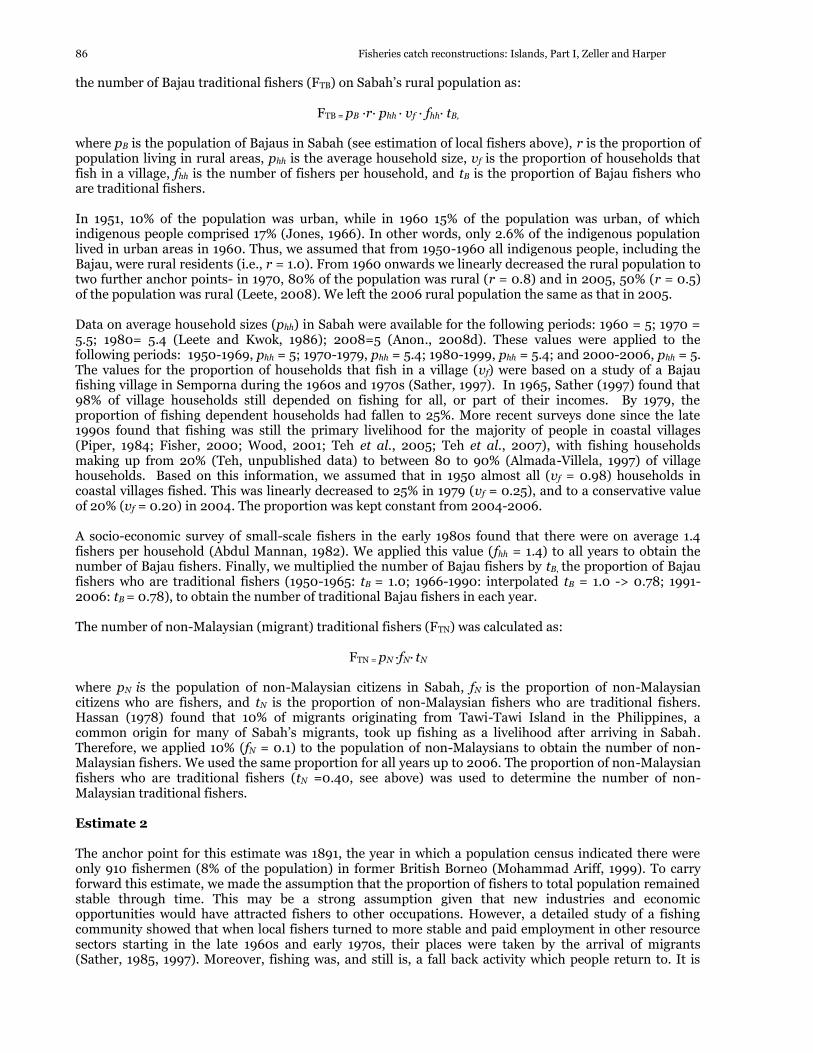
Figure 1. Map of Borneo, showing Sabah and Sarawak. Parts of Peninsular Malaysia are shown on the left.
120° E115° E110° E105° E
10
° N
5°
N0°
5°
S
Sabah
0 300
Km
PeninsularMalaysia
Sarawak
Indonesia
±
South China Sea Sulu Sea
Sulawesi Sea
78 Fisheries catch reconstructions: Islands, Part I, Zeller and Harper
for the years 1950-2006 to present a more complete estimate of the quantity of fisheries resources taken from Sabah waters.
Sabah‟s marine fisheries Sabah is a state of Malaysia, situated on the northeast corner of Borneo (Figure 1). The state polices the territorial waters extending up to twelve nautical miles, while the federal government has jurisdiction over an Exclusive Economic Zone (EEZ), measured as either 200 nautical miles (nm) from shore or the mid-line between neighboring countries‘ landmasses. Sabah is bordered by the South China Sea in the west, the Sulu Sea to the north-east, and the Sulawesi Sea to the south-east (Figure 1). Mangroves and mudflats fringe the coastal zone, and many outlying islands are scattered offshore. Coral reefs are present in shallow waters throughout the state‘s coast, and are heavily exploited by Sabah‘s substantial population of subsistence and artisanal fishers. Sabah‘s marine capture fisheries are exploited by the commercial and small-scale sectors, which accounted for approximately 65% and 35% of annual total fisheries landings in 2004, respectively. The term ‗traditional‘ is used by the Sabah Fisheries Department to refer to small-scale fisheries, and we use both terms synonymously in this study. Marine landings consist of pelagic and demersal species. In 2006, recorded landings were approximately split evenly between pelagic and demersal fishes. Demersal landings were made up of finfish (75%), invertebrates (15%), and shrimp (10%). The Sabah Fisheries Department classifies trawlers and purse seines as commercial gears, of which trawlers are the dominant gear. Traditional gears include hook and line, which accounts for the highest traditional fish landings, gillnets, lift nets, bag nets, push scoop nets, traps, and shellfish collection. The majority of Sabah‘s capture fisheries occurs within approximately 30 km (16.2 nautical miles) from the coast, as there are few vessels in Sabah larger than 70 GRT that are capable of deep sea fishing (Biusing, 2001). A spatial zoning system defines the boundaries where different types of fishing vessels are allowed to fish. Zone A, the traditional fishing zone, extends from shore out to 5 nautical miles, and is open only to traditional fishing vessels. Commercial vessels less than 40 GRT are allowed in zone B (5-12 nautical miles from shore), while zone C (12-30 nautical miles) is open to all vessels less than 70 GRT. According to official statistics, there were 20,845 licensed fishers in Sabah in 2006 (Anon., 2006); however, this is considered to be an underestimate due to a large number of unlicensed and migrant fishers (Biusing, 2001). Local small-scale fishers are mainly of Bajau ethnicity, while the large population of migrant fishers, many of whom reside illegally in Sabah, originate from the southern Philippines and Indonesia. Some of this group are of Bajau background and are employed as crew on large commercial fishing vessels or are engaged in traditional fishing. The number of fishers in Sabah increased rapidly in the mid 1970s to 1980s as refugees fleeing political instability in southern Philippines settled along coastal areas or outer islands of Sabah, and turned to fishing for a livelihood. To the present day, illegal entrants continue to filter into Sabah and live in relative poverty in overcrowded water villages, a situation which has given rise to societal discontent as they have been accused of carrying out crime, dynamite fishing, and stressing coastal resources (Pilcher and Cabanban, 2000; Anon., 2008a). Overall, due to its social and political context, Sabah‘s traditional fisheries sector faces the marginalization commonly experienced by small-scale fisheries in the region (Pauly, 1997). Nonetheless, these fisheries provide the main source of income and meat protein for a large proportion of Sabah‘s rural coastal communities (Fisher, 2000; IPMB, 2003; Teh et al., 2005; Foo et al., 2006), and reinforce the critical role small-scale fisheries play in supporting the food and livelihood needs of coastal communities throughout Southeast Asia (McManus, 1997; Burke et al., 2002; Loper et al., 2008). The importance of inshore fisheries to Sabah‘s coastal populations is even greater considering that Sabah is one of the poorest states in Malaysia (Leete, 2008). Marine fisheries in Malaysia are regulated by the Fisheries Act of 1985, which makes provision for the management, development, and conservation of fisheries resources. Federal development strategies, including those for fisheries, are announced every five years. Under the 9th Malaysia Plan for 2006-2011, poverty eradication among fishers in Sabah was earmarked as a priority program. Some government program aimed at alleviating poverty include diesel fuel subsidies for fishers, grants for setting up seaweed and aquaculture operations, and agriculture development schemes (Anon., 2008b; 2009; Anon., 2008c).
Fisheries catch reconstructions: Islands, Part I, Zeller and Harper 79
The Sabah Fisheries Department is the main agency in charge of managing the state‘s fisheries resources. Its objectives include uplifting the socio-economic status of the fisheries community, managing fishery resources to ensure a reliable supply of fish, increasing capture production, and carrying out fisheries monitoring, research, and development (www.fishdept.sabah.gov.my/deptfunctions.asp). Commercial fisheries Following its beginnings in the early 1960s, the prawn trawl fishery quickly became the major commercial fishery in Sabah. Trawling was first encouraged by the British, then the Sabah government, as a means of generating export revenue amid growing international demand (Mohammad Ariff, 1999). From 12 trawlers in 1962, the fleet grew rapidly to reach over 1000 vessels in 1985 and up to 1400 registered vessels in 2006. At the same time, prawn landings in Sabah increased from 209 t in 1962 to 10,209 t in 1990, but thereafter declined significantly from 6,702 t in 1991 to 2,880 t in 1999, indicating that prawn resources had been exploited beyond their sustainable limit (Biusing, 2001). Uses for bycatch from prawn trawlers were investigated in the late 1970s (Snell, 1978a). However, it was not until the beginning of the 1990s when so-called ‗trash‘ fish and bycatch of juvenile or low-value fish that were previously discarded at sea by trawlers were increasingly landed for use in fishmeal processing plants (Biusing, 2001). With this ready market, some trawlers now even make special fishing trips to target ‗trash‘ fish for fishmeal production. In 2000, there were 8 fishmeal plants in Sabah, each with an average production of about 2,500 t year-1 (Biusing, 2001). Several fishmeal plants have reportedly faced raw material shortages and have been turning to other countries such as Indonesia for supply (Biusing, 2001) Seine nets (e.g., beach seines) have traditionally been used on a small-scale basis by rural fishers. The commercial purse seine fishery developed in the mid 1980s to catch tuna, anchovies, and other pelagic fish (Biusing 2001). The main purse seine fishing grounds are in deeper parts of the EEZ on the west coast of Sabah, and adjacent to Semporna waters in the east coast (Biusing 2001). Some fish processing plants reportedly operated their own purse seiners to obtain raw materials (i.e., ‗trash‘ fish). Small-Scale fisheries Sabah‘s small-scale fisheries are concentrated in the inshore area, targeting mainly reef associated and estuarine species (Wood, 2001; Teh et al., 2005). These multi-species fisheries contribute the main supply of fresh fish for local consumption in coastal villages, with a portion being transported to larger markets in the main urban centers. Certain specialized fisheries, such as those for the live reef food fish trade, bêche-de-mer, and abalone, are carried out by small-scale fishers using hook and line, traps, and diving (both free diving and hookah). The high global demand generated for these specific species has led to the rapid decline in the populations of these reef species (Daw et al., 2002; Choo, 2004; Scales et al., 2007). The use of destructive fishing techniques such as dynamite and cyanide is still common (Oakley et al., 1999; Pilcher and Cabanban, 2000; Teh et al., 2007). This has damaged and destroyed unprotected reefs throughout Sabah (Oakley et al., 1999; Pilcher and Cabanban, 2000; Koh et al., 2002), leading to a low abundance of commercially important fish compared to protected areas (Teh et al., 2008). The magnitude of small-scale fishing is underestimated in the official statistics, as small-scale landings are not recorded in many fishing villages (Teh et al., 2007) Fisheries Statistics The first Fisheries Department in present-day Sabah was established in 1948, with the main function of compiling fisheries statistics and performing research. During this time, surveys were carried out at the Sandakan fish market, but these data were not available to us. The Fisheries Department was closed in 1953 and re-organized as a sub-department under the Agricultural Department. Its activities were confined to freshwater fish culture, as providing additional protein to the rural population‘s diet was seen as a more immediate need than collecting statistical data (Anon., 1953). Following the closure of the Fisheries Department, there was no government authority responsible for marine fishing in North Borneo.
80 Fisheries catch reconstructions: Islands, Part I, Zeller and Harper
Prior to independence in 1963, British colonial reports provided data only on the quantity of exported fisheries commodities. After independence, statistics on marine fisheries landings, the registered number of vessels, fishers, and fishing gears has been compiled by the Sabah Fisheries Department. Before 1991, marine fish landings statistics were estimated from fish market surveys, trawler logbooks, fish processing plant reports, and export data. An improved system was introduced in 1991, which used a stratified random sampling approach to estimate landings of selected fishing gears in Sabah‘s 16 coastal districts (Biusing, 2001). Sampling occurs at the largest landing sites in each fishing district (between1 to 3 sites are selected). Landings from these sites are then extrapolated to account for all other landing sites in the district (E. Jinuat pers. comm.)2. However, this has resulted in the underestimation of small-scale landings (Teh et al., 2007). The presence of unlicensed trawlers (Snell, 1978b; Manan, 2003) also indicates that commercial landings are likely underestimated. Furthermore, the official figures for the number of licensed fishers and vessels have not been updated since 1998, due to the lack of funding to carry out the necessary surveys (E. Jinuat, pers comm.)2.
History of marine resource use in Sabah Maritime culture and trade are an important part of the region‘s history. Archaeological findings suggest that coastal dwellers were already present and living off the resources of nearshore and ocean environments in the south-eastern district of Semporna some 3,000 years ago (Sather, 1997). By the thirteenth century, there was a thriving maritime trade network that linked China and insular South-East Asia (Tregonning, 1965). North Borneo was part of the powerful Sulu Sultanate, and marine resources from here were collected and delivered back to Jolo, the seat of the Sulu Empire (Tregonning, 1965; Warren, 1971). The Bajau people were the main collectors of marine resources (Tregonning, 1965; Warren, 1971). These included fresh and dried fish which were traded in markets (Evans, 1915), as well as high value commodities such as bêche-de-mer, shark fins, mother-of-pearl, tortoise shells, and turtle eggs (Tregonning, 1965; Warren, 1971). Being semi-nomadic sea people, the Bajau moved freely and frequently between the waters of Sabah and the southern Philippines in multi-day fishing trips to harvest marine resources, returning to their home moorages to sell or barter their catch (Warren, 1971; Sather, 1984, 1985, 1997). Today, the sea Bajau remain the most marine oriented ethnic group in Sabah. Present-day Sabah was ceded to the British North Borneo Chartered Company in 1881. The era under Company rule was marked by agricultural land development and expansion, whereas fisheries were viewed only as a source of protein supply for the population, and little was invested in its development (Mohammad Ariff, 1999). Early British administrators introduced a boat licensing system to monitor the semi-nomadic fishing population (Sather, 1997). They also encouraged fishers to adopt a settled lifestyle as plantation workers. Thus, the British influenced a transition towards an increasingly monetized economy, and drew many traditionally nomadic, sea-oriented people towards a settled lifestyle on land. The emphasis on land development led to the arrival of migrant workers, and the demand for fish as a protein source started to increase. Gradually, a corresponding shift in the composition of Sabah‘s marine resource trade occurred. Bêche-de-mer, mother of pearl and turtle shells, although still important, did not have the importance they had under Sulu rule. Instead, attention was now centered on domestic demand for fish to feed a growing local population which was being driven by an influx of plantation laborers. From 1942 to 1945, North Borneo was occupied by Japanese military forces. Economic activity was disrupted as coastal residents retreated inland or, in the case of the Bajau, returned to fishing from the security of small islands in order to avoid Japanese rule along the coast (Mohammad Ariff, 1999). With the defeat of Japan in 1945, North Borneo was placed under British Military Administration, then became a British crown colony in July 1946.
2 E. Jinuat, Fisheries Officer, Sabah Fisheries Department, Kota Kinabalu, Sabah [date received: December 2008].
Fisheries catch reconstructions: Islands, Part I, Zeller and Harper 81
Colonial rule North Borneo‘s fishing industry was severely disrupted by World War II, during which many vessels and most of the fishing gear were destroyed (Anon., 1947). However, fish still remained the population‘s staple food after the war (Anon., 1953). The period under colonial rule was marked by technological change, such as the replacement of paddle and sails with engines. Local materials from the jungle and mangroves that were traditionally used to make fishing gear were replaced with imported, factory produced synthetic materials. By the late 1950s, mechanized fishing boats were popular throughout the coastal districts (Anon., 1958). As a result, there was also a change in fishers‘ spatial movement, as they were able to go further from shore and exploit new fishing grounds. However, fishing was still done primarily in inshore waters (Anon., 1958). The fishing industry during this period was still not well organized, and the majority of fishing was subsistence based and done by independent fishers using traditional gears. Nevertheless, they were able to catch enough fish to meet local demand, as well as to export surplus to neighboring countries (Anon., 1957; Mohammad Ariff, 1999). While dried or salted fish and bêche-de-mer had been the main exports under Company rule, dried shrimp and fish formed the major export commodities under the British administration (Anon., 1956). During this period, prawn fisheries were carried out by local fishers using tidal prawn nets. Under colonial rule, a small portion of fish was exported fresh for the first time. Domestically, the old system of sea transport was replaced by roads, which along with the emergence of ice production, facilitated the movement of fresh fish to major markets in coastal towns. In urban areas, the fishing industry was primarily run by ethnic Chinese middlemen, who financed fishing gears and boats, as well as controlled fish marketing (Anon., 1955; Mohammad Ariff, 1999). In 1958, the British administration introduced experimental trawling, using a twin beam otter trawl. Widespread trawling started in 1962, marking the beginning of the modern commercial fisheries sector in Sabah (Mohammad Ariff, 1999). Post colonial rule In 1963 North Borneo gained independence from Britain and joined the Malaysian federation, in the process changing its name to Sabah. At this time, fishing was still carried out primarily by small-scale fishers. The new Sabah state government became involved in all aspects of the fishing industry, including production, marketing, and addressing the poverty of fishing communities (Mohammad Ariff, 1999). A series of fisheries infrastructure projects, low interest loans, and fishing boat and gear subsidy schemes were implemented (Mohammad Ariff, 1999). Furthermore, a fishers co-operative (Ko-Nelayan) was set up to help with the development of the fishing industry and looking after the interests of fishers (Abdul Mannan, 1982). From 1963 to 2006 the population of Sabah increased nearly sixfold, increasing from 504,000 to 3 million. A key driver of Sabah‘s population growth has been the arrival of a large number of migrants, many of whom entered Sabah illegally, starting around the late 1960s. Coastal towns and outer islands were settled by refugees fleeing political instability in the southern Philippines during the late 1970s (Piper, 1984). In fishing villages on some islands off the town of Semporna on Sabah‘s east coast, up to 90% of households were non-Malaysian citizens (Piper, 1984). Migrants also formed a large portion of the commercial fishery work force (Manan, 2003).
METHODS In this study, all fisheries statistics unless stated otherwise were extracted from the Malaysian Department of Fisheries Annual Reports (available at www.dof.gov.my/v2/perangkaan.htm). Data were available from 1965 to 2006; however, the reporting of data was not consistent throughout the years, with coarser data available in the earlier years. Note that from 1986 onwards, fisheries statistics for Labuan, an island within Sabah state waters, was reported separately from Sabah. However, in this study, reported statistics are inclusive of Labuan to make it comparable with statistics prior to 1986.
82 Fisheries catch reconstructions: Islands, Part I, Zeller and Harper
In Sabah, the presence of large numbers of unlicensed vessels and fishers has been a persistent problem for many years (Wong, 1982; Anon., 1991; Mohammad Ariff, 1999; Biusing, 2001). The catch reconstruction takes this issue into account by explicitly incorporating unlicensed vessels and fishers to estimate the catch for Sabah‘s commercial and traditional fishery, respectively. Due to the more organized nature of the commercial fishery, we assumed that the number of licensed vessels was a good indicator to estimate number of unlicensed vessels for reconstructing total commercial catches. On the other hand, the traditional small-scale sector lacks any formal organization. Therefore, we based the reconstruction of traditional catches on the estimated number of traditional fishers in Sabah, in order to reflect the widespread, scattered nature of the fishery.
Commercial fisheries
Prawn trawlers Number of trawlers
Trawling was introduced to Sabah in 1958 (Anon., 1958), but only became widespread in the 1960s. The time series of reported trawl landings started in 1962, while the number of unlicensed trawlers was reported for 3 time periods (Table 1). We assumed the ratio of registered to unlicensed trawl vessels changed linearly between the three time periods, starting with zero unlicensed vessels in 1958. Table 1. Available data sources for estimating the ratio of licensed to unlicensed trawlers in Sabah.
a These numbers are based on observation at Sandakan, the major port for trawlers in Sabah. We applied this ratio to the number of licensed trawlers for the whole of Sabah.
The ratio of licensed to unlicensed trawlers from these three time periods was applied to the number of licensed trawlers reported each year to obtain estimated numbers of unlicensed vessels (Table 2). However, in 1991, a change in the statistical recording system used by the Sabah Fisheries Department led to data on licensed vessels pre- and post-1991 being incompatible (Biusing, 2001). Specifically, data recorded after 1991 showed a substantial increase due to better coverage of landing areas. As a result, the number of trawlers spiked by over 80% in 1991, increasing from 1046 vessels in 1990 to 1834 in 1991. Furthermore, it appears that the number of licensed vessels was not updated between 1998 and 2005, remaining constant at 1422 vessels for this period. To minimize these data effects, we did two sets of interpolations. First, we smoothed the number of vessels between 1985 (1054 vessels) and 1998 (1422 vessels). Then, to account for the lack of updated records, we interpolated between 1999 (1422 vessels) and 2006 (1200 vessels; Table 2). Both these modifications to the number of reported licensed vessels is presented as v(smoothed) in Table 2. Catch rate for trawlers Total catch rates (i.e., inclusive of prawns and fish) for trawlers in Sabah were available for 1962, 1976, and 1994. In 1962, an average catch rate of 35 katis hr-1 (21kg hr-1) was reported by Mohammad Ariff (1999). In 1976, a study on bycatch in the shrimp trawl fishery was undertaken by the Sabah Fisheries Department, in which the catch from commercial trawlers was analyzed. The average catch rates recorded during the survey trips were 121.1 kg hr-1 during the peak fishing months, 36 kg hr-1 for the low fishing months, and 63 kg hr-1 during the medium fishing months (Snell 1978b). We used the medium catch rate for our estimate. A survey on technical efficiency of the trawl fishery in Peninsular Malaysia found that the average catch rate for a commercial trawler was 48 kg hr-1 in 1994 (Viswanathan et al., 2000). As we could not find commercial catch rate data for Sabah in this period, we used that rate from Peninsular Malaysia to represent Sabah‘s catch rate in 1994. From 1962 to 1994, catch rates were assumed to increase or decrease linearly between the anchor years of 1962, 1976, and 1994. We applied a constant catch rate of 48 kg hr-1
from 1994 to 2006.
Fisheries catch reconstructions: Islands, Part I, Zeller and Harper 83
Table 2. Reported licensed [vlicensed], adjusted licensed [vinterpolate], and estimated unlicensed number of trawlers, as well as trawl catch rates used to estimate total catch for the trawl fishery for Sabah.
Sources: a Mohammad Ariff (1999); b Snell (1978b); c Viswanathan et al. (2000)
84 Fisheries catch reconstructions: Islands, Part I, Zeller and Harper
Trawl fishing effort An average trawl fishing effort of 1608 hrs vessel-1∙yr-1 was estimated based on information from Mohammad Ariff (1999) for 1962, while Snell (1978b) reported an annual effort of 1214 hrs∙vessel-1∙year-1 for 1976. The former effort value was applied to 1962, and linearly increased to 1214 hrs∙vessel-1∙year-1 in 1976. A constant effort of 1214 hrs∙vessel-1∙year-1 was applied to all years after, from 1976 to 2006. Catch for trawl fishery 1962-2006 The total annual catch for trawlers (Ctr) was calculated as
Ctr = v∙r∙f where v is the total number of trawl vessels (i.e., vinterpolate + vunlicensed, Table 2), r the annual catch rate, and f the average annual fishing effort per vessel. Trawler discards and bycatch Beginning in the 1990s, co-called ‗trash‘ fish and other trawler bycatch was increasingly landed for use in fishmeal processing plants (Biusing, 2001). This was not the case prior to 1990, which implies that from 1962 to 1990, a substantial amount of catch was discarded at sea. A breakdown of a typical trawl catch was provided in Snell‘s (1978b) study on bycatch in the prawn-trawl fishery (Table 3). To estimate the quantity of discarded fish from 1962-1990, we multiplied the ‗unmarketable fish‘ percentage (64%) by the estimated annual trawl catches. Biusing (2001) reported that there is currently a shortage of ‗trash‘ fish for fishmeal production; thus, it is reasonable to assume that for recent years, no discarding is done by trawlers.
Purse seiners Number of purse seine vessels The purse seine fisheries in Sabah started in the late 1980s. We did not find any reports documenting unlicensed purse seine vessels; however, we assumed that unlicensed vessels did exist, since the incentives driving unlicensed vessels in the trawl sector are likely to operate in the purse seine fisheries as well. To estimate the number of unlicensed purse seine vessels, we first calculated the average (across all years) ratio of licensed: unlicensed vessels in the trawl fishery. We then applied this ratio to the yearly number of licensed purse seine vessels to estimate the number of unlicensed purse seine vessels per year. Catch rate for purse seine vessels The only catch rate information specific to purse seiners in Sabah was from an experimental fishing survey carried out in 1988, during which a catch rate of 14 t per haul was recorded (Chee, 1995). We chose not to use this catch rate as it might not be representative of normal commercial fishing operations. Instead, we used a catch rate of 180.67 t∙boat-1 year-1 that was recorded for purse seine vessels in Peninsular Malaysia in 1983 (Hotta and Low, 1985). This rate was applied to the assumed start year of 1987 for purse seine vessels in Sabah. To account for changes in catch rate over time, we assumed that the catch rate changed in proportion to the annual change in recorded landings per vessel. Since 1998, the number of recorded purse seine vessels has remained the same in the national statistics. Total Commercial catch Total commercial catch was calculated by summing total catches (licensed + unlicensed vessels) from the trawl and purse seine fisheries from 1962 to 2006. Note that this is inclusive of discards from 1962 to 1990.
Table 3. Percentage breakdown of a commercial trawl catch in Sabah (Snell 1978b)
Item % of catcha
Prawn 6.0 Marketable fish 24.9 Unmarketable fish 63.9 aAveraged from 3 different commercial
vessels which operated during different months of the year.
Fisheries catch reconstructions: Islands, Part I, Zeller and Harper 85
Traditional fisheries Estimation of traditional catches is based on the number of traditional small-scale fishers. As mentioned earlier, the number of fishers recorded in the official statistics is considered an underestimate. The Fisheries Department does not know how many migrant fishers reside in Sabah, but they could number in the thousands (Biusing, 2001). We therefore estimate the number of traditional fishers who fish for both subsistence and artisanal purposes in two steps. First, we estimate the number of potential fishers (i.e., both commercial and traditional fishers) from the general population. This comprises local fishers and non-Malaysian (migrant) fishers, many of whom entered Sabah illegally from Indonesia and the Philippines. Secondly, we estimate the number of traditional fishers from this larger fisher population as detailed below.
Estimating the population of potential fishers Locals To account for local fishers, we assumed that they were all Bajaus. As mentioned earlier, Bajaus traditionally made a living from fishing, and are the primary marine resource users and fishers in present-day Sabah (Tregonning, 1965; Piper, 1984; Sather, 1997). Besides Bajaus, other ethnic groups such as Suluks and Brunei Malays may also engage in fishing (Biusing, 2001). However, their participation is lower than the Bajaus, and by including only Bajaus we make our estimate conservative. The number of Bajaus as a proportion of Sabah‘s total population has remained relatively constant from 1950 to the present, varying between 11 to 15% (Lee, 1968; Anon., 2001; Leete, 2008). We used an average of 13% for all years to derive the number of Bajaus from Sabah‘s population from 1950-2006 (pB, see Estimate 1 below). Migrants There is a large migrant population in Sabah (Anon., 1990a; Sam, 2008). Constant arrivals and deportation make it difficult to estimate this population. Our estimate was based on available data in 1990 and 2005, when illegal immigrants were estimated to make up 30% and 25% of Sabah‘s total population, respectively (Anon., 1990b; Leete, 2008; Sam, 2008). Migration between Sabah and neighboring countries has occurred for centuries. However, for the period of interest to us (1950-2006), the wave of immigrants started to arrive in Sabah in the late 1960s, intensifying during the South Philippine Moro insurgency during the 1970s. Thus, we assumed that arrivals started in 1968, and that the percentage of immigrants as a proportion of Sabah‘s population increased linearly from 0 in 1967 to 30% in 1990. Thereafter, we also assumed that the proportion decreased linearly to 25% in 2005 and remained constant in 2006. Estimating number of traditional fishers Fishers in Sabah were predominantly ‗traditional‘ until commercial fisheries started in the 1960s. Therefore, the estimated number of fishers was assumed to be all traditional fishers for the period 1950-1965. Biusing (2001) reported that from 1991-1999, an average of 78.5% of local fishers were traditional fishers, while 40.7% of non-Malaysian fishers (immigrants) were traditional fishers. This breakdown was applied to the estimated number of local and immigrant fishers for the period 1991-2006. For the period 1966-1990, we linearly decreased the proportion of traditional fishers from 100% in 1965 to 78.5% in 1991. We did likewise for non-Malaysian fishers for the period 1968 to 2006. We estimated the number of traditional fishers using three different methods detailed below, and used an average of the three estimates as the basis to calculate traditional catch. Estimate 1 The majority of Bajau and non-Malaysian residents reside in Sabah‘s coastal districts (Anon., 2001). We assumed that fishing villages were all located in rural coastal areas, so that it was reasonable to base
86 Fisheries catch reconstructions: Islands, Part I, Zeller and Harper
the number of Bajau traditional fishers (FTB) on Sabah‘s rural population as:
FTB = pB ∙r∙ phh ∙ vf ∙ fhh∙ tB, where pB is the population of Bajaus in Sabah (see estimation of local fishers above), r is the proportion of population living in rural areas, phh is the average household size, vf is the proportion of households that fish in a village, fhh is the number of fishers per household, and tB is the proportion of Bajau fishers who are traditional fishers. In 1951, 10% of the population was urban, while in 1960 15% of the population was urban, of which indigenous people comprised 17% (Jones, 1966). In other words, only 2.6% of the indigenous population lived in urban areas in 1960. Thus, we assumed that from 1950-1960 all indigenous people, including the Bajau, were rural residents (i.e., r = 1.0). From 1960 onwards we linearly decreased the rural population to two further anchor points- in 1970, 80% of the population was rural (r = 0.8) and in 2005, 50% (r = 0.5) of the population was rural (Leete, 2008). We left the 2006 rural population the same as that in 2005. Data on average household sizes (phh) in Sabah were available for the following periods: 1960 = 5; 1970 = 5.5; 1980= 5.4 (Leete and Kwok, 1986); 2008=5 (Anon., 2008d). These values were applied to the following periods: 1950-1969, phh = 5; 1970-1979, phh = 5.4; 1980-1999, phh = 5.4; and 2000-2006, phh = 5. The values for the proportion of households that fish in a village (vf) were based on a study of a Bajau fishing village in Semporna during the 1960s and 1970s (Sather, 1997). In 1965, Sather (1997) found that 98% of village households still depended on fishing for all, or part of their incomes. By 1979, the proportion of fishing dependent households had fallen to 25%. More recent surveys done since the late 1990s found that fishing was still the primary livelihood for the majority of people in coastal villages (Piper, 1984; Fisher, 2000; Wood, 2001; Teh et al., 2005; Teh et al., 2007), with fishing households making up from 20% (Teh, unpublished data) to between 80 to 90% (Almada-Villela, 1997) of village households. Based on this information, we assumed that in 1950 almost all (vf = 0.98) households in coastal villages fished. This was linearly decreased to 25% in 1979 (vf = 0.25), and to a conservative value of 20% (vf = 0.20) in 2004. The proportion was kept constant from 2004-2006. A socio-economic survey of small-scale fishers in the early 1980s found that there were on average 1.4 fishers per household (Abdul Mannan, 1982). We applied this value (fhh = 1.4) to all years to obtain the number of Bajau fishers. Finally, we multiplied the number of Bajau fishers by tB, the proportion of Bajau fishers who are traditional fishers (1950-1965: tB = 1.0; 1966-1990: interpolated tB = 1.0 -> 0.78; 1991-2006: tB = 0.78), to obtain the number of traditional Bajau fishers in each year. The number of non-Malaysian (migrant) traditional fishers (FTN) was calculated as:
FTN = pN ∙fN∙ tN where pN is the population of non-Malaysian citizens in Sabah, fN is the proportion of non-Malaysian citizens who are fishers, and tN is the proportion of non-Malaysian fishers who are traditional fishers. Hassan (1978) found that 10% of migrants originating from Tawi-Tawi Island in the Philippines, a common origin for many of Sabah‘s migrants, took up fishing as a livelihood after arriving in Sabah. Therefore, we applied 10% (fN = 0.1) to the population of non-Malaysians to obtain the number of non-Malaysian fishers. We used the same proportion for all years up to 2006. The proportion of non-Malaysian fishers who are traditional fishers (tN =0.40, see above) was used to determine the number of non-Malaysian traditional fishers. Estimate 2 The anchor point for this estimate was 1891, the year in which a population census indicated there were only 910 fishermen (8% of the population) in former British Borneo (Mohammad Ariff, 1999). To carry forward this estimate, we made the assumption that the proportion of fishers to total population remained stable through time. This may be a strong assumption given that new industries and economic opportunities would have attracted fishers to other occupations. However, a detailed study of a fishing community showed that when local fishers turned to more stable and paid employment in other resource sectors starting in the late 1960s and early 1970s, their places were taken by the arrival of migrants (Sather, 1985, 1997). Moreover, fishing was, and still is, a fall back activity which people return to. It is
Fisheries catch reconstructions: Islands, Part I, Zeller and Harper 87
therefore likely that on the whole, the proportion of Sabah‘s population that is involved in fishing has remained approximately the same. To carry our estimate through time, we simply applied the percentage of fishers (8%) to our defined fisher population: from 1950 to 1968 this percentage was applied to the population of Bajaus. From 1968 onwards, the percentage was applied to the population of Bajaus plus non-Malaysian citizens. This was then multiplied by tB and tN to obtain the number of traditional Bajau and non-Malaysian fishers. Estimate 3 Due to the dispersed and relatively isolated nature of Sabah‘s small-scale fisheries, many fishers do not register for licenses. According to a fisheries official, the number of unlicensed fishers made up an additional 30% from the number of licensed fishers recorded in the fisheries statistics (E. Jinuat, pers. comm.)2. Further, the extra 30% consisted of small-scale fishers, both locals and non-Malaysians. We assume that this under-reporting has been occurring since Malaysian independence, so that from 1963 to 1998, we increased the annual number of licensed traditional fishers by 30% to account for unlicensed fishers. From 1998 to 2006, this approach could not be used because statistics on the number of fishers had not been updated and recorded the same number of fishers (20,845, or 8,091 traditional fishers) each year. However, the number of traditional fishers had in fact been increasing by around 4,000 annually (E. Jinuat, pers. comm.)2. Therefore, for 1998-2006, we added 4,000 fishers to each subsequent year to obtain the total number of traditional fishers (inclusive of unlicensed fishers). Traditional catch rates We estimated catch rates for 3 periods: 1950-1969, 1970-1999, and 2000-2006. Each period was chosen to roughly coincide with the prevailing economic conditions which affected small-scale fishers. 1950-1969: An annual catch rate of 3.09 t fisher-1year-1 was used. This catch rate was based on an anthropological study done in a Semporna Bajau fishing community in 1965 by Sather (1984, 1997). We derived a catch rate based on Sather‘s qualitative description of the proportion of a catch that was sold after each multi-day fishing trip, the price of fish in the Semporna market, and the frequency and duration of long fishing trips. In addition, we added a subsistence catch of 2 kg∙fisher-1∙d-1 based on Teh et al. (2007) for the periods that Bajau fishers did not go on extended fishing trips. It is likely that 2 kg is a conservative estimate of the subsistence catch rate for this period, as sharing fish with family and friends was still a common practice, but not as important during the time of the Teh et al. (2007) study. Historically, all Bajau Laut in Semporna lived permanently afloat in small sailing vessels, and fished principally around the Semporna area (Sather, 1984; 1985). However, families frequently went beyond Sabah to the southern Philippine Sibutu island cluster to fish and visit friends or family (Sather, 1984). Thus, a portion of their catch was likely not from within Sabah waters. To account for this, we assumed that 15% of catches in this period originated from outside Sabah. This is reasonable since the coral reefs around Semporna, notably the Ligitan reefs, were described as the major fishing grounds for Semporna Bajau Laut (Sather, 1984; 1985). The majority of boat dwelling Bajau Laut families settled permanently on land by the 1960s (Sather, 1985; 1997), thus were not likely to make extended trips to the Philippines after giving up their boat dwelling lifestyle.
0.0
0.1
0.2
0.3
0.4
0.5
0.6
0.7
0.8
0.9
1.0
Commercial Traditional
Per
cen
tag
e o
f ca
tch
(%
)
100
80
60
40
20
0
Demersal
Misc. invertebrates
Misc. fishes
Small pelagics
Med. & lg. pelagics
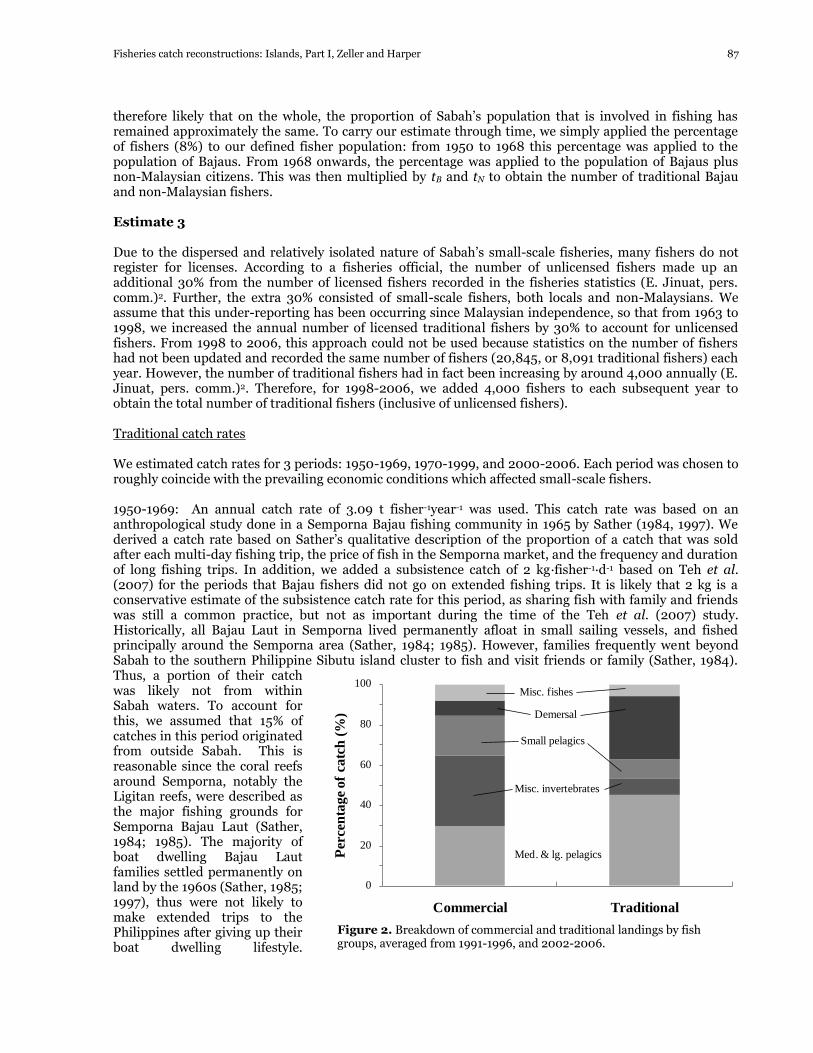
Figure 2. Breakdown of commercial and traditional landings by fish groups, averaged from 1991-1996, and 2002-2006.
88 Fisheries catch reconstructions: Islands, Part I, Zeller and Harper
Consequently, we used a catch rate of 2.6 t fisher-1∙year-1 (i.e., 85% of 3.09 calculated above) starting in 1950. This was linearly increased to a catch rate of 5 t∙fisher-1∙year-1 in 1970 (see below). 1970-1999: There were no readily available catch rate data for this period. Demand for fish intensified starting in the 1970s due to the construction of trunk roads, which improved the transportation of fish from rural areas to urban markets. At the same time, an influx of immigrants arrived in Sabah during this period. As Sabah‘s population, and therefore the fisher population, was still low in the early 1970s, we assumed that fishers‘ catch rates increased to meet the extra demand. As such, we assumed that the 1970-1989 catch rate was 1.3 t higher (i.e., 5 t∙fisher-1∙year-1) than the subsequent rate from 1990-2006 (3.68 t∙fisher-1∙year-1). A catch rate of 5 t∙fisher-1∙year-1 was applied from 1970-1980, then starting in 1981, the catch rate was linearly decreased to 3.68 t∙fisher-1∙year-1 in 2000. Interviews with small-scale fishers in Pulau Banggi, northern Sabah in 2004/2005 indicated that the 1980s were good fishing years, with individual catch rates 3 to 4 times higher compared to the 2000s. Thus, we remained conservative by not doubling the 2000-2006 catch rate of 3.68 t∙fisher-1∙year-1. Moreover, most of the interviewed fishers indicated that catches started to decline in 2000 (Teh et al., 2007). Again, we made our estimate conservative by starting the decline of the ‗good‘ fishing period in 1981. 2000-2006: A catch rate of 3.68 t∙fisher-1∙year-1 was applied to this period. This catch rate was based on the average catch rate recorded for small-scale reef fisheries in Pulau Banggi, an island group off northern Sabah (Teh et al. 2007). Total traditional catch Total annual traditional catch (Ctrad) was calculated as:
Ctrad = x ∙ rtrad where x is the number of fishers, and rtrad is the individual catch rate.
Catch composition of Sabah‟s marine fisheries landings The taxonomic breakdown of annual marine landings was obtained for 1965 to 2006 from annual fisheries reports. A breakdown according to gear was available for 1991 to 1996, and 2002 to 2006. The average composition for commercial (trawl and purse seine) and traditional gears (gillnets, seine nets, hook and line, traps, hand collection, and spears) is presented in Figure 2. The crustaceans group is made up of prawns, lobsters, and crabs, with prawns accounting for the bulk of the reported data. As the reconstructed catches involved the same gear types as those in recorded landings, it was assumed reasonable to apply the same taxonomic breakdown observed from landings (1965-2006) to the yearly reconstructed catches. Sabah‘s fisheries were mostly small-scale traditional before 1965; thus, the composition of reconstructed catches from 1950 to 1964 were assumed to resemble the traditional breakdown only (Figure 2). It should be noted that in the north and east coasts of Sabah, subsistence fishing targets mainly reef associated species (Piper, 1984; Wood, 2001; Teh et al., 2005; 2007), while more small pelagics are caught in the west coast. Piper (1984) reported that a spear gun catch consisted of 1 large trigger fish (Balistidae), 1 butterflyfish (Chaetodontidae), 1 sweetlip (Haemulidae), damselfish (Pomacentridae), groupers (Serranidae), angelfish (Pomacanthidae), 1 octopus, tusk fish (Labridae), and rabbit fish (Siganidae). Compared to more recent reports on subsistence fishing (Wood, 2001; Teh et al., 2005; 2007), there appears to have been little change in the type of demersal reef fish caught in the past 20 years.
Table 4. Breakdown of trawl discards from Snell (1978b)
90 Fisheries catch reconstructions: Islands, Part I, Zeller and Harper
Prior to 1991, bycatch from trawlers was not landed and thus the taxonomic breakdown of these discards was not recorded. Here, the breakdown of discards is based on a study of trawler bycatch conducted by Snell (1978b) (Table 4). Ninety five percent of bycatch was demersal fish (Snell, 1978b), with the remainder being small pelagics. Discarded fish were either too small for human consumption, poisonous, or had no consumer demand (Snell, 1978b). Trawler bycatch estimated for 1962-1990 was thus allocated to the ‗trash fish‘ and miscellaneous mixed fish category. The discarded species from Snell‘s study are consistent with another report, which stated that low value demersal fish which were not landed prior to 1991 included lizard fish (Saurida spp.), goat fish (Mullidae), juvenile threadfin bream (Nemipterus spp.), slipmouths (Leiognathidae), and flat fish (Plotosidae) (Biusing, 2001). From 1991 to 2006, so-called ‗trash‘ fish comprised the largest proportion (19%) of trawl landings. On the other hand, ‗trash‘ fish only made up a minor (2%) part of purse seine landings.
RESULTS
Commercial sector Catches The reconstructed catch for the commercial sector (trawl and purse seine) totaled 5.6 million t for the period 1962 to 2006, with trawl and purse seine catches accounting for 3.8 million and 1.8 million t, respectively. Trawl landings data were available from 1970 to 2006; prior to that, only landings of prawns was reported (1962 to 1970). Purse seine landings data were available from 1987 to 2006. For the period 1970-2006, total reported commercial landings was 2.25 million t, whereas reconstructed catches for the same period totaled 5.52 million t, or 250% higher than reported landings (Table 5). Incorporating unlicensed vessels and discards resulted in the reconstructed trawl catch trend differing from recorded trawl landings for the 1980-1990
0
2
4
6
8
10
12
14
16
1950 1960 1971 1981 1991 2001
Ca
tch
( t
x 1
04)
Year
Reconstructed catch
Recorded landings
Prawns only
Figure 3. Reconstructed trawl catches and recorded trawl landings 1962-2006. Note that recorded landings from 1962 to 1969 show prawn landings only.
0
2
4
6
8
10
12
14
1950 1960 1970 1980 1990 2000
Catc
h (t
x 1
04)
Year
Reconstructed catch
Recorded landings
Figure 4. Reconstructed purse seine catches 1981-2006 and recorded landings 1987-2006
0
2
4
6
8
10
12
14
1950 1960 1970 1980 1990 2001
Ca
tch
(t
x 1
04)
Year
Non-discards
Discards
Figure 5. Reconstructed trawl catches showing the amount of discards 1962-2006.
Fisheries catch reconstructions: Islands, Part I, Zeller and Harper 91
period. While both sets of data increased from the 1960s to 1980, the reconstructed catches dipped in the early 1980s, thereafter increasing again until reaching a peak in the late 1990s/early 2000. In contrast, the recorded landings showed the similar dip in the late 1980s, then followed the same path of increase until peaking in the late 1990s (Figure 3). The reconstructed purse seine catch trend was more consistent with recorded landings. Both showed an increasing trend since data for the fishery started to be reported in 1987. Overall, reconstructed purse seine catches were almost double the recorded landings (Figure 4). Discards We estimated that from 1962 to 1990, an average of 33,741 t of fish were discarded by licensed and unlicensed trawlers annually (Figure 5). The sum of estimated discards from 1965 to 1990 was almost equal to the total reported landings for the same period (972,755 t discards vs. 1.03 million t reported landings).
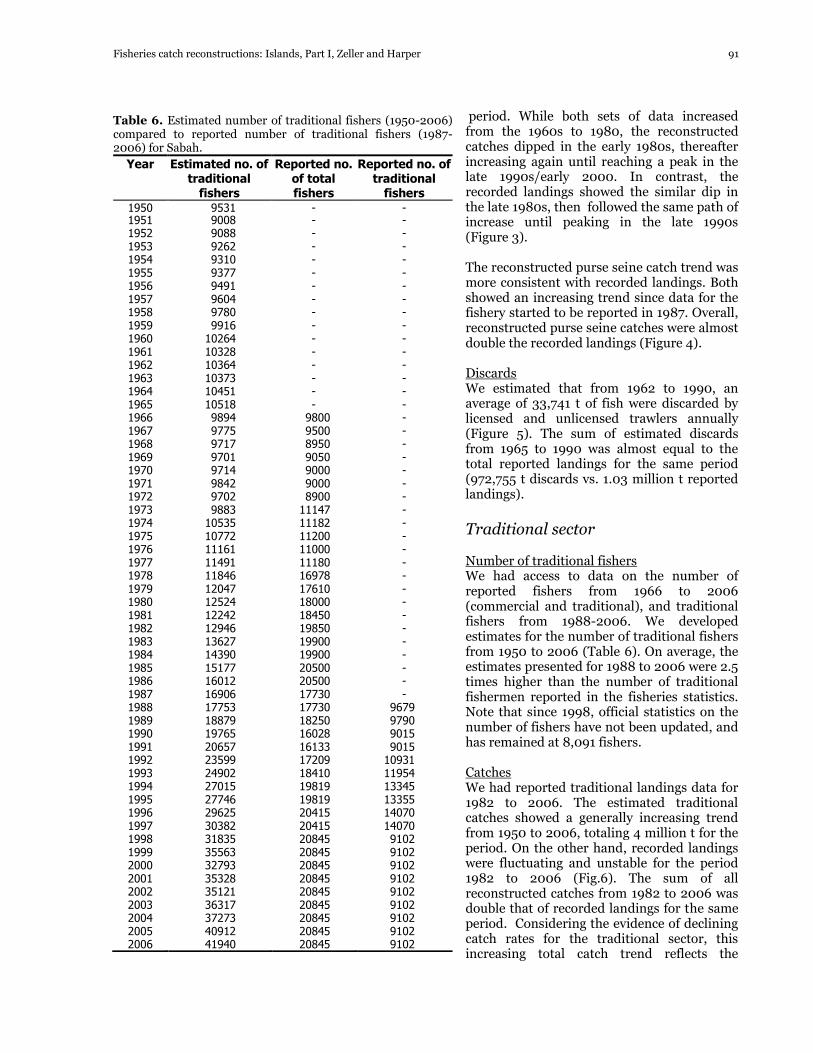
Traditional sector Number of traditional fishers We had access to data on the number of reported fishers from 1966 to 2006 (commercial and traditional), and traditional fishers from 1988-2006. We developed estimates for the number of traditional fishers from 1950 to 2006 (Table 6). On average, the estimates presented for 1988 to 2006 were 2.5 times higher than the number of traditional fishermen reported in the fisheries statistics. Note that since 1998, official statistics on the number of fishers have not been updated, and has remained at 8,091 fishers. Catches We had reported traditional landings data for 1982 to 2006. The estimated traditional catches showed a generally increasing trend from 1950 to 2006, totaling 4 million t for the period. On the other hand, recorded landings were fluctuating and unstable for the period 1982 to 2006 (Fig.6). The sum of all reconstructed catches from 1982 to 2006 was double that of recorded landings for the same period. Considering the evidence of declining catch rates for the traditional sector, this increasing total catch trend reflects the
Table 6. Estimated number of traditional fishers (1950-2006) compared to reported number of traditional fishers (1987-2006) for Sabah.
92 Fisheries catch reconstructions: Islands, Part I, Zeller and Harper
substantial rise in entrants into Sabah‘s fisheries.
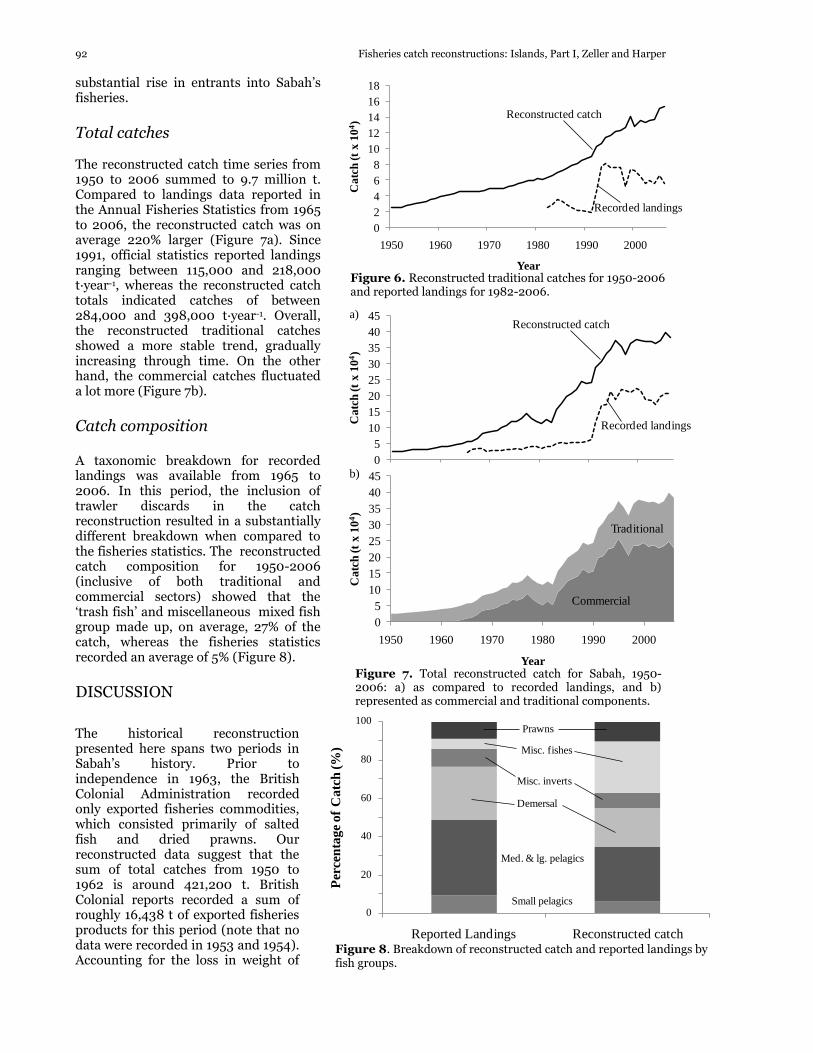
Total catches The reconstructed catch time series from 1950 to 2006 summed to 9.7 million t. Compared to landings data reported in the Annual Fisheries Statistics from 1965 to 2006, the reconstructed catch was on average 220% larger (Figure 7a). Since 1991, official statistics reported landings ranging between 115,000 and 218,000 t∙year-1, whereas the reconstructed catch totals indicated catches of between 284,000 and 398,000 t∙year-1. Overall, the reconstructed traditional catches showed a more stable trend, gradually increasing through time. On the other hand, the commercial catches fluctuated a lot more (Figure 7b).
Catch composition A taxonomic breakdown for recorded landings was available from 1965 to 2006. In this period, the inclusion of trawler discards in the catch reconstruction resulted in a substantially different breakdown when compared to the fisheries statistics. The reconstructed catch composition for 1950-2006 (inclusive of both traditional and commercial sectors) showed that the ‗trash fish‘ and miscellaneous mixed fish group made up, on average, 27% of the catch, whereas the fisheries statistics recorded an average of 5% (Figure 8).
DISCUSSION
The historical reconstruction presented here spans two periods in Sabah‘s history. Prior to independence in 1963, the British Colonial Administration recorded only exported fisheries commodities, which consisted primarily of salted fish and dried prawns. Our reconstructed data suggest that the sum of total catches from 1950 to 1962 is around 421,200 t. British Colonial reports recorded a sum of roughly 16,438 t of exported fisheries products for this period (note that no data were recorded in 1953 and 1954). Accounting for the loss in weight of
0
5
10
15
20
25
30
35
40
45
1950 1960 1970 1980 1990 2000
Catc
h (t
x 1
04)
Year
Reconstructed catch
Recorded landings
a)
0
5
10
15
20
25
30
35
40
45
1950 1960 1970 1980 1990 2000
Catc
h (t
x 1
04)
Year
Commercial
Traditional
b)
Figure 7. Total reconstructed catch for Sabah, 1950-2006: a) as compared to recorded landings, and b) represented as commercial and traditional components.
0
2
4
6
8
10
12
14
16
18
1950 1960 1970 1980 1990 2000
Catc
h (t
x 1
04)
Year
Reconstructed catch
Recorded landings
Figure 6. Reconstructed traditional catches for 1950-2006 and reported landings for 1982-2006.
0.00
0.10
0.20
0.30
0.40
0.50
0.60
0.70
0.80
0.90
1.00
Reported Landings Reconstructed catch
Per
cen
tage
of
Catc
h (
%)
100
80
60
40
20
0
Prawns
Demersal
Misc. inverts
Misc. fishes
Small pelagics
Med. & lg. pelagics
Figure 8. Breakdown of reconstructed catch and reported landings by fish groups.
Fisheries catch reconstructions: Islands, Part I, Zeller and Harper 93
the dried products, this would be approximately equivalent to 288,000 t of fresh fish. In the post-colonial period, the reconstruction suggests that catches from Sabah‘s waters are on average 2.2 times higher than those reported in the official Malaysian statistics from 1965 to 2006. This falls in the lower end of findings from other catch reconstruction efforts, where differences of 1.7 fold and up to 17 fold have been found (Zeller et al., 2006; Jacquet and Zeller, 2007; Zeller et al., 2007). The reconstructed estimates presented here suggest that Sabah‘s total marine fisheries catches have been on an increasing trend for the 56 year period from 1950 to 2006. This matches the trend from official statistics, although magnitudes differ substantially throughout time. Clearly missing also in the reconstructed data was the steep increases in reported landings in 1990-1991 that were due to the combined effects of: a) a change to an improved methodology used for sampling fisheries landings, and b) the landing of so-called ‗trash‘ fish which were previously discarded prior to finding a market in fishmeal production in the early 1990s (Biusing, 2001). These changes and artifacts are more properly accounted for in the reconstructed estimates. Reconstructed catches from 1965 to 1990 are on average 3.4 times higher than reported landings, compared to an almost two fold difference from 1991 to 2006. This may indicate that Sabah‘s fisheries monitoring system has improved; nevertheless, the current system still does not account for a substantial amount of small-scale fisheries which take place along Sabah‘s inshore waters. The proliferation of small-scale fishing in Sabah‘s coastal communities, combined with the inadequate coverage of fishing villages by the Fisheries Department, necessitated that we build our estimation of traditional fishers on general demographic statistics, rather than on the reported number of traditional fishers or vessels. Our approach estimated that the number of traditional small-scale fishers was 2.5 times higher than that reported in the fisheries statistics. To our knowledge, our study is the first to explicitly incorporate both local and immigrant fishing effort into an estimate of Sabah‘s small-scale fisheries catch. Nevertheless, even our estimates may be underestimates, as our local fisher population is based primarily on the population of Bajaus, who have the traditional role of being fishers. We have not included other ethnic groups such as Suluks, who also engage in some fishing, but to a lesser extent than Bajaus. Thus, our estimate presents a lower limit on the number of traditional fishers and fish catch volume. Nonetheless, it reflects the substantial increase in Sabah‘s population over the past 2 decades. In particular, the difference between registered and estimated fishers starts to widen from the mid-1970s onwards. This period reflects the influx of immigrants fleeing political uprising in Mindanao (southern Philippines) in the late 1970s, many of whom settled in coastal villages or on outer islands where they engaged in fishing. Sabah‘s total catches are increasingly becoming more commercialized, with the contribution of traditional to total catches growing at a slower rate than commercial catches in the past two decades. Despite the large number of traditional participants, traditional catch only made up on average 35% of total catch since 1991. Nevertheless, small-scale fisheries are disproportionately important to those who rely on these resources for livelihood and food security (Whittingham et al., 2003; Sadovy, 2005). Indeed, fishing remains the primary, and in many cases, the sole source of income and employment in Sabah‘s fishing villagers (Wood, 2001; Teh et al., 2005; 2007), which are also among the poorest communities in the country. On the other hand, a substantial portion of fish landed by the commercial sector is low value or inedible fish destined for fishmeal production or for processing into frozen seafood products for export. From 1992 to 1999, 142,166 t of fishmeal using approximately 531,000 t of raw materials (or on average, approximately 40% of annual marine landings) was produced in Sabah. Of this, slightly over 60% was exported. In fact, several purse seine vessels are operated specifically for capturing the raw materials for fishmeal production (Biusing, 2001). As such, the commercial fishery sector has minimal contribution to sustaining the nutritional needs of Sabah‘s human population. The increasing trend in commercial landings actually masks the fact that prawns, the most valuable commercial resource, have been overexploited. Catch per unit of effort has been on a downward trajectory since the early 1970s, and prawns are considered to be exploited beyond the upper limits of sustainable production (Biusing, 2001). The high amount of low value fish in Sabah‘s trawl catches is similar to
94 Fisheries catch reconstructions: Islands, Part I, Zeller and Harper
neighboring Thailand and the Philippines, where the trawl fleets have led to degradation of coastal marine ecosystems (Christensen and Pauly, 2001). It is highly likely that this is also the case in Sabah. Importantly, the trawl sector has likely had a larger impact on the marine environment than that suggested by the decline in prawn catches recorded in the official statistics. Our catch reconstruction suggests that discards from the start of the prawn trawl fishery in the early 1960s to 1990 totaled about 973,000 tonnes, an amount almost equal to the reported landings, and 5.6 times higher than the reported prawn catches for that period. Forage fish play an important ecological role in transferring energy from plankton to higher trophic level groups, such as larger fishes and marine mammals (Alder et al. 2008). The removal of forage fish species can therefore have negative consequences for species in the entire ecosystem. While some traditional gears take incidental catches of cetaceans (Jaaman et al., in press) and possibly turtles, there was minimal discarded bycatch observed in small-scale artisanal catches, as fishers tend to keep damaged or low value fish for their own consumption (L. Teh, pers. obs.). The use of trawler bycatch to make fish balls, fish cakes, and other products developed in the late 1970s (Snell, 1978a), thereby reducing the economic and biological waste to a certain extent. Further, trawler bycatch has reportedly landed since the early 1990s for fishmeal (Biusing, 2001). Nevertheless, the creation of a fishmeal market creates little incentive for trawl operators to decrease the environmental impact of trawling. The efficiency of fishmeal production is such that there have been shortages of raw materials, necessitating the import of trash fish from Indonesia (Biusing 2001). The demand for fishmeal is driven by global growth in aquaculture production, and increasing demand from developed countries for omega 3 rich supplements such as fish oils (Naylor et al., 2009, Jenkins et al., 2009). On the positive side, the Sabah Fisheries Department recognizes the need to decrease trawling effort within inshore coastal waters, and has plans to phase out small trawlers less than 40 GRT in size (Biusing, 2001). However, it remains to be seen whether this effort will be replaced with bigger trawlers diverted to fishing in deeper offshore areas. The reconstructed traditional catch trend shows that catches at the fishery level have been increasing steadily since the 1990s, even though we based the estimate on an assumed decreasing catch rate for the period. This is being driven by the large number of participants in traditional, small-scale fisheries, and may suggest that fisheries resources may not be able to support the current level of fishing pressure for much longer. This is of concern given that fish is the cheapest animal protein in Sabah, and is still a staple food source, especially for the rural population. For instance, according to a national food and nutrition survey, marine fish is consumed daily, with the frequency of daily intake being significantly higher among rural adults (Norimah et al., 2008). Sabah‘s population has increased 6.5 fold since 1960, with an annual population growth rate between 1991 and 2000 of 4.5% (Saw, 2007). Population pressure, combined with the prevailing poverty of fishing villages, suggests that Malthusian overfishing (Pauly et al., 1989) is occurring in Sabah‘s small-scale fisheries (Teh and Sumaila, 2007). Indeed, unsustainable fishing methods using dynamite and cyanide continue to be persistent problems in Sabah, resulting in extensive damage to coral reef habitat. The continued arrival of migrants from the Philippines and Indonesia will only add to the increasing pressure on fisheries resources, as they increase local fish demand and enter an already crowded traditional fishery. Indeed, in interviews with small-scale artisanal fishers, Teh et al. (2007) found that an increase in the number of fishers was the most frequently mentioned reason when fishers were asked about the reason for a decrease in catches. Over 80% of Sabah‘s coral reefs are at risk from anthropogenic activities (Burke et al., 2002), thus threatening Sabah‘s vital reef-based fisheries as well. Overall, coral reef fish catches have been declining (Cabanban and Biusing, 1999). Demand from global seafood markets is a primary driver for the overfishing of several reef resources in Sabah. Catches of fish species targeted for the lucrative live reef food fish trade, such as coral groupers (Plectropomus spp. and Epinephelus spp.) and humphead wrasse (Cheilinus undulatus), have drastically declined since the 1990s (Daw et al., 2002; Scales et al., 2007; Teh and Sumaila, 2007; Teh et al., 2007). Underwater surveys have also shown that the abundance of commercially important fish are very low, and are even locally extinct at some locations (Oakley et al., 1999; Pilcher and Cabanban, 2000; Koh et al., 2002). Landings of sea cucumbers, which are collected by small-scale fishers for the bêche-de-mer trade, have also declined since the 1980s and 1990s (Choo, 2004). Importantly, current bêche-de-mer landings are made of less valuable species compared to before (Choo, 2004).
Fisheries catch reconstructions: Islands, Part I, Zeller and Harper 95
Other indications that Sabah‘s reef fisheries are overfished include a decrease in the mean size of fish caught, and the need for fishers to travel further offshore and more distant fishing grounds to catch fish (Teh et al., 2007). At the same time, anecdotal evidence from small-scale fishers indicates that their catches are being adversely affected by purse seine and trawl vessels which intrude into their traditional fishing zones (Biusing, 2001; Teh et al., 2007), leading to harmful effects on the coral reef environment and jeopardizing near shore fish stocks that are targeted by the traditional sector. The interaction between trawl and traditional fisheries already led to conflicts in Peninsular Malaysia (Wong, 1982; Chee, 1995), and steps should be taken to ensure the same does not happen in Sabah. Government policies aimed at traditional fishers are focused on poverty alleviation and ensuring livelihoods and employment. To date, this has involved programs aimed at providing alternative livelihoods such as seaweed farming or agricultural projects. Simultaneously however, there has been widespread provision of subsidies for fishing gear, boats, fuel, as well as monetary incentives (e.g., RM 0.10 kg-1 of fish landed, beginning in the latter half of 2008). These strategies can have adverse effects on fisheries sustainability (Munro and Sumaila, 2002), and should be urgently reconsidered in light of our findings. Better avenues for use of such funds would be in the realm of local, community-based co-management arrangements in relation to the establishment and enforcement of no-take marine reserves that can contribute to more stable yields to traditional fishers as well as ecosystem preservation and hence sustainable production potential (e.g., Russ et al., 2004) Our results do not include catches by several foreign companies that fished in Sabah for short periods of time during the 1950s and 1960s. For instance, a Japanese company catching offshore tuna operated for 2 years in the 1950s. Similarly, in 1951 the British government allowed a Hong Kong company with a fleet of 3 trawlers to fish, while in 1958 a Filipino company started to catch fish around northern Sabah (Anon., 1958). We do not explicitly account for non-prawn invertebrate catches; instead, these catches, often derived by reef- and shore- gleaning, are encompassed within the overall catch rates used. Subsequently, the invertebrate catches presented here are coarse estimates, and are likely underestimates relative to finfish. As reef gleaning is a common activity (Sather, 1997; Wood, 2001; Teh et al., 2005), this is an area that requires further research. CONCLUSION This study shows that the traditional sector is considerably larger than officially recorded in terms of participants, and thus its importance to society is likely to have been underestimated. Importantly, this historical perspective of Sabah‘s fisheries indicates that even as Sabah‘s population and the number of fishers grew rapidly, small-scale fishery resources were able to support the growing local fish demand. However, this is now at risk, and maintaining sustainable small-scale inshore fisheries is of utmost importance if these resources are to continue supporting local subsistence and artisanal fishing economies. In contrast, while commercial fisheries catches are comparatively larger, their contribution to Sabah‘s food security is minimal, as a substantial proportion of commercial landings are processed into fishmeal, while higher quality fish are frozen and exported. Further, our study indicates that discards from the commercial prawn fishery totaled almost a million tonnes prior to the 1990s, thus likely had a more serious impact on the marine environment than perceived from the official statistics. Overall, our study points to the need for increased attention on understanding and managing the level of fishing pressure on Sabah‘s marine resources, especially for small-scale fisheries resources. Government aid to traditional fishers has historically been aimed at poverty alleviation. Unfortunately, many of these programs, in the form of subsidies and grants, may have created perverse incentives to intensify the exploitation fisheries resources. Instead, policies aimed at addressing the unrecorded effort we have estimated here are needed in order to ensure the sustainability of inshore fisheries resources.
96 Fisheries catch reconstructions: Islands, Part I, Zeller and Harper
ACKNOWLEDGEMENTS We thank E. Jinuat of the Sabah Fisheries Department for his input. We acknowledge the support of the Sea Around Us Project, a scientific collaboration between the University of British Columbia and the Pew Environment Group.
REFERENCES
Abdul Mannan, Q. (1982) Sabah fishermen and their economy. Ko-Nelayan, Kota Kinabalu.
Alder, J., Campbell, B., Karpouzi, V., Kaschner, K., and Pauly, D. (2008) Forage fish: from ecosystems to markets. Annual Reviews in Environment and Resources 33: 153-166.
Almada-Villela, P. C. (1997) Pilot fisheries socio-economic survey of two coastal areas in eastern Sabah. Pages 33-44 in S. L. Fowler, T. M. Reed, and F. A. Dipper, editors. Elasmobranch biodiversity, conservation and management: proceedings of the international seminar and workshop, Sabah, Malaysia, July 1997. IUCN.
Anon. (1957) Colony of North Borneo Annual Report 1957. Her Majesty's Stationery Office, London.
Anon. (1947) Colony of North BorneoAnnual Report 1947. His Majesty's Stationery Office, London.
Anon (1953) Colony of North Borneo Annual Report 1953. Her Majesty's Stationery Office, London.
Anon. (1955) Colony of North Borneo Annual Report 1955. Her Majesty's Stationery Office, London.
Anon (1956) Colony of North Borneo Annual Report 1956. Her Majesty's Stationery Office, London.
Anon. (1958) Colony of North Borneo Annual Report 1958. Her Majesty's Stationery Office, London.
Anon. (1990a) More illegal aliens than Sabahans by 2008. In: The Straits Times, Kota Kinabalu.
Anon. (1990b) Sabah feels strain of hosting 500,000 illegal immigrants. In The Straits Times.
Anon. (1991) Annual Fisheries Statistics 1991. Malaysia Department of Fisheries, Putrajaya.
Anon. (1998) The Coastal Zone Profile of Sabah. In: Sabah Ministry of Town Planning, Kota Kinabalu.
Anon. (2001) Population and Housing Census of Malaysia 2000 Population Distribution by Local Authority Areas and Mukims. Malaysia Department of Statistics, Putrajaya, Malaysia.
Anon. (2006) Annual Fisheries Statistics 2006. Malaysia Department of Fisheries, Putrajaya.
Anon. (2008a) Squatter village a likely target. In: The Straits Times, Kota Kinabalu.
Anon. (2008b) RM500,000 incentive for fishermen, breeders and aquaculturists in Sabah. In: Bernama Daily Malaysian News.
Anon. (2008c) Project to improve livelihood of hardcore poor. In: New Straits Times, Kuala Lipis.
Anon. (2008d) Population, Household and Living Quarters Malaysia 2008. Department of Statistics, Malaysia. Available at: www.statistics.gov.my. [Accessed October 2009].
Anon. (2009) Ko-Nelayan retained as sole subsidised diesel supplier. In: Bernama Daily Malaysian news.
Biusing, R. E. (2001) Assessment of coastal fisheries in the Malaysian Sabah portion of the Sulu-Sulawesi Marine Ecoregion (SSME). WWF Malaysia, Sabah.
Burke, L., Selig, L. and Spalding, M. (2002) Reefs at Risk in Southeast Asia. World Resources Institute, Washington.
Cabanban, A. S., and Biusing, R.E. (1999) Coral reef fisheries and their contribution to marine fish production in Sabah, Malaysia. In: A. S. Cabanban and Philips, M. ( eds.) Proceedings of the workshop on aquaculture of coral reef fishes and sustainable reef fisheries. Institute of Development Studies, Kota Kinabalu.
Chee, P. E. (1995) Tuna fisheries interactions in Malaysia. In: R. S. Shomura, Majkowski, J. and Harman, R. F., (eds.) Status of Interactions of Pacific Tuna Fisheries in 1995. Proceedings of the Second FAO Expert Consultation on Interactions of Pacific Tuna Fisheries. FAO, Shimizu, Japan.
Choo, P. S. (2004) Fisheries, trade and utilization of sea cucumbers in Malaysia. p. 57-68 In: C. Conand, Purcell, S. Uthicke, S., Hamel, J. F. and Mercier, (eds.) Advances in sea cucumber aquaculture and management. FAO, Rome.
Christensen, V., and Pauly, D. (2001) Coral reef and other tropical fisheries. p. 534-538. In: J. H. Steele, Thorpe, S. A. and Turekian, K. K., (eds.) Encyclopedia of Ocean Sciences. Academic Press, San Diego.
Daw, T., Jeffrey, L. and Bin Ali, M. A. (2002) Preliminary Assessment of the live reef fish trade in the Kudat region. WWF Malaysia, Kota Kinabalu.
Evans, I. H. N. (1915) North Borneo Markets. Man 15:23-25.
Fisher, H. (2000) A socio-economic assessment of coastal communities of Pulau Banggi Sabah, East Malaysia. Master of Science. University of Minnesota.
Foo, L. H., Khor, G. L., Tee, E. S. and Prabakaran, D. (2006) Dietary intake of adolescents in a rural fishing community in Tuaran district, Sabah. Malaysian Journal of Nutrition 12:11-21.
Gopinath, N. and Puvanesuri, S. S. (2006) Marine capture fisheries. Aquatic Ecosystem Health & Management 9:215-226.
Hassan, A. J. (1978) Characteristics of backdoor migrants to Sabah, Malaysia from the Philippines: the case of two island communities of Tawi-Tawi. Institute of Southeast Asian Studies, Singapore.
Hotta, M. and Low, T. W. (1985) Fishermen Relocation Programme in Peninsular Malaysia. FAO, Rome.
Institut Penyelidikan Marin Borneo (IPMB). (2003) Laporan Kajian Mengenai Pengetahuan dan Pandangan Masyarakt Pulau Banggi Terhadap Penubuhan Taman Tun Mustapha (Report on the knowledge and expectations of Pulau Banggi residents about
Fisheries catch reconstructions: Islands, Part I, Zeller and Harper 97
the establishment of the Tun Mustapha Park). Institut Penyelidikan Marin Borneo, Universiti Malaysia Sabah, Kota Kinabalu.
Jaaman, S. A., Lah-Anyi, Y. U. and Pierce, G. J. (in press) The magnitude and sustainability of marine mammal bycatch in fisheries in East Malaysia. Journal of the Marine Biological Association of the United Kingdom.
Jacquet, J. and Zeller. D. (2007). Putting the ‗United‘ in the United Republic of Tanzania: Reconstructing marine fisheries catches. In: D. Zeller and Pauly, D. (eds.) Reconstruction of marine fisheries catches for key countries and regions (1950-2005). Fisheries Centre Research Reports 15(2). Fisheries Centre, University of British Columbia, Vancouver.
Jenkins, D.J.A., Sievenpiper, J.L., Pauly, D., Sumaila, U.R., Kendall, C.W.C. and Mowat, M. (2009) Are dietary recommendations for the use of fish oils sustainable? Canadian Medical Association Journal 180(6): 633-637.
Jones, L. W. (1966) The population of Borneo A study of the peoples of Sarawak, Sabah and Brunei. University of London the Athlone Press, London.
Koh, L. L., Chou, L. M. and Tun. K. P. P. (2002) The status of coral reefs of Pulau Banggi and its vicinity, Sabah, based on surveys in June 2002. Department of Biological Sciences, National University of Singapore, Singapore.
Lee, Y. L. (1968). Population changes in Sabah, 1951-60. The Journal of Tropical Geography 26:55-68.
Leete, R. (2008). Sabah's human development progress and challenges. United Nations Development Programme, Kuala Lumpur.
Leete, R., and Kwok, K.K. (1986) Demographic changes in east Malaysia and their relationship with those in the Peninsula 1960-80. Population Studies 40(1):83-100.
Loper, C., Pomeroy, R. Hoon, V. McConney, P. Pena, M. Sanders, A. Sriskanthan, G. Vergara, S. Pido, M. Vave, R. Vieux, C. and Wanyonyi, I. (2008) Conditions along the world's tropical coasts: 2008. National Oceanic and Atmospheric Administration, Global Coral Reef Monitoring Network, Conservation International.
Manan, M. A. (2003) Problems and prospects of industrial relations: the social and economic dimensions of foreign workers in fishing enterprises in Sabah, East Malaysia. Pages 241-255 in Economic Prospects, Cultural Encounters and Political Decisions: Scenes in a Moving Asia (East and Southeast) The Work of the 2002/2003 API Fellows. Sasyaz Holdings Sdn. Bhd., Kuala Lumpur.
McManus, J. W. (1997) Tropical marine fisheries and the future of coral reefs: a brief review with emphasis on Southeast Asia. Coral Reefs 16:S121-S127.
Mohammad Ariff, M. R. (1999) Dari pemungutan tripang ke penundaan udang: Sejarah perkembangan perusahaan perikanan di Borneo Utara, 1750-1990 (From sea cucumbers to prawn trawling: History of fisheries development in North Borneo, 1750-1990). Penerbit Universiti Malaya.
Munro, G., and Sumaila, U.R. (2002) The impact of subsidies upon fisheries management and sustainability: the case of the North Atlantic. Fish and Fisheries 3 (4): 233-250.
Naylor, R.L., Hardy, R.W., Bureau, D.P., Chiu, A., Elliott, M., Farr, A.P., Forster, I., Gatlin, D.M., Goldburg, R.J., Hua, K., and Nichols, P.D. Feeding aquaculture in an era of finite resources. Proceedings of the National Academy of Sciences 106 (36): 15103- 15110.
Norimah, A. K., Safiah, M., Jamal, K., Haslinda, S., Zuhaida, H., Rohida, S., Fatimah, S., Norazlin, S. K., Poh, B., Kandiah, M., Zalilah, M. S., Wan Manan, W. M., Fatimah, S. and Azmi, M. Y. (2008) Food Consumption Patterns: Findings from the Malaysian Adult Nutrition Survey (MANS). Malaysian Journal of Nutrition 14:25-39.
Oakley, S., Pilcher, N., Atack, K., Digges, C., Enderby, S., Mackey, G., Clubb, R., Stapelton, K., Toh, S. M., Huet, C. and Morton, T. (1999) Reefs under attack: the status of coral reefs of Sabah, East Malaysia. in 4th international conference on the marine biology of the South China Sea 20-22 October 1999, Quezon City.
Pauly, D., Silvestre, G. and Smith, I. R. (1989) On development, fisheries, and dynamite: a brief review of tropical fisheries management. Natural Resource Modelling 3:307-329.
Pilcher, N., and Cabanban, A. S. (2000) The status of coral reefs in eastern Malaysia. Australian Institute of Marine Science, Townsville.
Piper, M. (1984) Settlements on eight Semporna Islands. Sabah Society Journal 7:303-329.
Russ, G., Alcala, A. Maypa, A. Calumpong, H. and White, A. (2004) Marine reserve benefits local fisheries. Ecological Applications 14: 597-606
Sadovy, Y. (2005). Trouble on the reef: the imperative for managing vulnerable and valuable fisheries. Fish and Fisheries 6: 167-185
Sam, I. (2008). Illegal and unwelcome, migrants overwhelm Malaysia's Borneo. in Agence France Presse.
Sather, C. (1984). Sea and shore people: ethnicity and ethnic interaction in southeastern Sabah. Contributions to Southeast Asian Ethnography 3:3-27.
Sather, C. (1985). boat crews and fishing fleets; the social organisation of maritime labour among the Bajau Laut of southeastern Sabah. Contributions to Southeast Asian Ethnography 4:165-214.
Sather, C. (1997). The Bajau Laut Adaptation, history, and fate in a maritime fishing society of south-eastern Sabah. Oxford University Press, Kuala Lumpur.
Saw, S. H. (2007). The population of Malaysia. Institute of Southeast Asian Studies, Singapore.
Scales, H., A. Balmford, and A. Manica. (2007). Impacts fo the live reef fish trade on populations of coral reef fish off northern Borneo. Proceedings of the Royal Society B 274:989-994.
Snell, P. J. I. (1978a). The production of fish balls and fish cakes in Sabah and the possible use of trawler bycatch for such products. Pages 581-600 in Symposium on fish utilization technology and marketing in the IPFC Region 8-17 March 1978. FAO, Manila, Philippines.
98 Fisheries catch reconstructions: Islands, Part I, Zeller and Harper
Snell, P. J. L. (1978b). A preliminary survey of the prawn trawling industry in Sabah and its non-commercial fish catch. Pages 86-100 in Symposium on fish utilization technology and marketing in the IPFC Region 8-17 March 1978. FAO, Manila, Philippines.
Teh, L., and U. R. Sumaila. (2007). Malthusian overfishing in Pulau Banggi? Marine Policy 31:451-457.
Teh, L., U. R. Sumaila, and A. S. Cabanban. (2005). The reef fisheries of Pulau Banggi, Sabah: A preliminary profile and assessment of ecological and socio-economic sustainability. Fisheries Research 76:359-367.
Teh, L.C.L., L.S.L. Teh, and F. C. Chung. (2008). A private management approach. Biodiversity and Conservation 17:3061-3077.
Teh, L. S. L., D. Zeller, A. Canbanban, L. C. L. Teh, and U. R. Sumaila. (2007). Seasonality and historic trends in the reef fisheries of Pulau Banggi, Sabah, Malaysia. Coral Reefs 26:251-263.
Tregonning, K. G. (1965). History of modern Sabah (North Borneo, 1881-1963), 2nd edition edition. University of Malaya Press, Singapore.
Viswanathan, K. K., Y. Jeon, I. Haji Omar, J. Kirkley, D. Squires, and I. Susilowati. (2000). Technical efficiency and fishing skill in developing country fisheries: the Kedah, Malaysia trawl fishery. in Y. Matsuda, T. Yamamoto, and A. L. Shriver, editors. Twelfth Biennial Conference of the International Institute of Fisheries Economics and Trade. International Institute of Fisheries Economics and Trade, Tokyo, Japan.
Warren, J. F. (1971). The North Borneo Chartered Company's Administration of the Bajau, 1878-1909 The Pacification of a Maritime, Nomadic People. Center for International Studies Ohio University, Ohio.
Whittingham, E., J. Campbell and P. Townsley (2003). Poverty and Reefs. Paris, DFID–IMM–IOC/UNESCO: 260.
Wong, L. M. (1982). Country Situation Paper - Malaysia (Sabah) The status of rural coastal fisheries in Sabah. FAO, Manila.
Wood, E. (2001). Use of natural resources in the proposed Semporna Islands park. Marine Conservation Society, Sabah Parks, WWF Malaysia, Nature Link.
Zeller, D., S. Booth, P. Craig, and D. Pauly. (2006). Reconstruction of coral reef fisheries catches in American Samoa, 1950-2002. Coral Reefs 25:144-152.
Zeller, D., S. Booth, G. Davis, and D. Pauly. (2007). Re-estimation of small-scale fisheries catches for U.S. flag island areas in the Western Pacific: The last 50 years. Fishery Bulletin 105:266-277.