Notornis, 2001, Vol. 48: 145-156 0029-4470 O The Ornithological Society of New Zealand, Inc. 2001 Historical records of yellow-eyed penguin (Megadyptes antipodes) in southern New Zealand PETER J. MOORE Science & Rescarch Unit, Department of Conservation, PO. Box 10-420, Wellington, New Zealand [email protected]. nz Abstract The yellow-eyed penguin (Megndyptesantipodes) on the South Island of New Zealand was believed to have suffered a population decline that continued into the 1980s. Unpublished census results from L. Richdale (1930s-1950s) and S. Sharpe (1950s-1960s) for Otago Peninsula show that there were only 44 nests in 1940, but the number increascd in the 1940s-1960s. Numbers peaked at 276 nests in the mid-1980s. Subsequent decreases and a crash to 79 nests in 1990 led to concerns for the viability of the population,but years of good survival and breeding allowed a recovery. The fluctuations were probably drivcn by interplays of human impacts and environmental variation. Reservation of breeding areas, revegetation, and predator control have reduced the deleterious human impacts and given the species a chance to increase numbers and withstand adverse fluctuations in the cnvironment. Moore, l? J. 2001. Historical records of yellow-eyed penguin (Mqadyptesantipodes) in southern New Zealand. Notornis 48(3): 145-156. Keywords yellow-eyed penguin; population; historical counts; human impacts; environmental variation; New Zealand INTRODUCTION The yellow-eyed penguin (Megadyptec antipodes), or hoiho, breeds only in the New Zealand region, from Banks Peninsula and the south-east coast of the South Island, Stewart Island and its outliers, to the Auckland and Campbell islands in the subantarctic (Marchant & Higgins 1990; Turbott 1990). The species is found in areas with productive feeding grounds over the continental shelf (Smith 1987) and nests solitarily or in loose aggregations under coastal vegetation (Darby & Seddon 1990; Moore 1992a). During the 1980s and early 1990s a serious population decline of yellow-eyed penguins was identified on the mainland (Department of Conservation 1991) and the species was listed as regionally threatened under I U C N criteria (Bell 1986). The main problems that were identified were human- related impacts. Large tracts of coastal forest had been destroyed and replaced with farmland, introduced grazing mammals had degraded the remaining breeding habitat, and introduced predators preyed on penguins (Darby & Seddon 1990). In the 1980s, breeding pairs of yellow-eyed penguin remained in small coastal rernnants of native and introduced shrub vegetation, few ofwhich were protected as reserves. At that time, government Received 14 May 2000; accepted 25 November 2000 and public conservation efforts began protecting breeding habitat from the grazing of farm animals, encouraging shrubland revegetation, and reducing numbers of introduced predators (Department of Conservation 1991). Apart from the human-related problems causing changes to the population, a major component of natural variation also became apparent in the 1980s. Yellow-eyed penguins suffered a series of bad seasons (years of-high mortality and low recruitment) and there was concern that these setbacks were increasing in frequency (van Heezik 1990) and the species would be driven to extinction on the mainland (Anon. 1990). Richdale's (1951, 1957) work on yellow-eyed penguin population biology and behaviour from the 1930s to 1950s was widely lauded, particularly outside New Zealand (Warham 1984). However, because Richdale did not publish population figures, it was believed that he never attempted a census (Darby 1989), and thus provided only incomplete glimpses of what the population size had been (Department of Conservation 1991). Nor did Richdale apparently contribute to the conservation ofthe species, other than by his dedication and enthusiasm to its study (Darby 1985a). The yellow-eyed penguin and its plight were largely ignored again until the early 1980s, when surveys of the breeding population began (Darby 1985a). Various estimates of numbers in the mid to late 1980s put the total population throughout the species' range at 1400-
Transcript
Notornis, 2001, Vol. 48: 145-156 0029-4470 O The Ornithological Society of New Zealand, Inc. 2001
Historical records of yellow-eyed penguin (Megadyptes antipodes) in southern New Zealand
PETER J. MOORE Science & Rescarch Unit, Department of Conservation, PO. Box 10-420, Wellington, New Zealand [email protected]. nz
Abstract The yellow-eyed penguin (Megndyptes antipodes) on the South Island of New Zealand was believed to have suffered a population decline that continued into the 1980s. Unpublished census results from L. Richdale (1930s-1950s) and S. Sharpe (1950s-1960s) for Otago Peninsula show that there were only 44 nests in 1940, but the number increascd in the 1940s-1960s. Numbers peaked at 276 nests in the mid-1980s. Subsequent decreases and a crash to 79 nests in 1990 led to concerns for the viability of the population, but years of good survival and breeding allowed a recovery. The fluctuations were probably drivcn by interplays of human impacts and environmental variation. Reservation of breeding areas, revegetation, and predator control have reduced the deleterious human impacts and given the species a chance to increase numbers and withstand adverse fluctuations in the cnvironment.
Moore, l? J. 2001. Historical records of yellow-eyed penguin (Mqadyptes antipodes) in southern New Zealand. Notornis 48(3): 145-156.
Keywords yellow-eyed penguin; population; historical counts; human impacts; environmental variation; New Zealand
INTRODUCTION The yellow-eyed penguin (Megadyptec antipodes), or hoiho, breeds only in the New Zealand region, from Banks Peninsula and the south-east coast of the South Island, Stewart Island and its outliers, to the Auckland and Campbell islands in the subantarctic (Marchant & Higgins 1990; Turbott 1990). The species is found in areas with productive feeding grounds over the continental shelf (Smith 1987) and nests solitarily or in loose aggregations under coastal vegetation (Darby & Seddon 1990; Moore 1992a).
Dur ing the 1980s and early 1990s a serious population decline of yellow-eyed penguins was identified o n the mainland (Department of Conservation 1991) and the species was listed as regionally threatened under I U C N criteria (Bell 1986). The main problems that were identified were human- related impacts. Large tracts of coastal forest had been destroyed and replaced with farmland, introduced grazing mammals had degraded the remaining breeding habitat, and introduced predators preyed on penguins (Darby & Seddon 1990). In the 1980s, breeding pairs of yellow-eyed penguin remained in small coastal rernnants of native and introduced shrub vegetation, few ofwhich were protected as reserves. At that time, government
Received 14 May 2000; accepted 25 November 2000
and public conservation efforts began protecting breeding habitat from the grazing of farm animals, encouraging shrubland revegetation, and reducing numbers of introduced predators (Department of Conservation 1991). Apart from the human-related problems causing changes to the population, a major component of natural variation also became apparent in the 1980s. Yellow-eyed penguins suffered a series of bad seasons (years o f -h igh mortality and low recruitment) and there was concern that these setbacks were increasing in frequency (van Heezik 1990) and the species would be driven to extinction on the mainland (Anon. 1990).
Richdale's (1951, 1957) work on yellow-eyed penguin population biology and behaviour from the 1930s to 1950s was widely lauded, particularly outside N e w Zealand (Warham 1984). However, because Richdale did not publish population figures, it was believed that he never attempted a census (Darby 1989), and thus provided only incomplete glimpses of what the population size had been (Department of Conservation 1991). N o r did Richdale apparently contribute to the conservation ofthe species, other than by his dedication and enthusiasm to its study (Darby 1985a).
The yellow-eyed penguin and its plight were largely ignored again until the early 1980s, when surveys of the breeding population began (Darby 1985a). Various estimates of numbers in the mid to late 1980s put the total population throughout the species' range at 1400-
146 Moore
2100 pairs or 4000-7100 birds (New Zealand Wildlife Service 1986; Darby & Seddon 1990; Marchant & Higgins 1990; Moore 1992b).
Yellow-eyed penguins are difficult to census because oftheir secretive nesting habits (Darby 1989). Searching for nests is the most definitive method for assessing breeding populations, but it is very laborious (Darby & Seddon 1990) which has contributed to a ~aucitv of historical population estimates. Furthermore, most of the earlier population data were unpublished or anecdotal and had not been adequately collated or interpreted. It was thought that as recently as the 1940s, the species was abundant on the south-east coast of the South Island, but by the 1980s the population had declined by at least 75% (Darby & Seddon 1990). This resulted in a popular perception that the population size found in the 1980s-1990s was the continuation of a long- term decline in numbers.
Using unpublished census data, I propose an alternative history that yellow-eyed penguin numbers were low on Otago Peninsula in the 1940s and rose to a peak by the 1980s. Although the interpretation of historical surveys or anecdotes is hampered by the lack of information on methods, amount of effort used or timing of surveys, the more intensive periods of work shed some light on population trends, as shown below
RESULTS
Prehistorv Although penguins currently breed in southern New Zealand in areas with a productive continental shelffood supply and a cool summer temperature (Smith 1987) the former distribution was much wider (Heather & Robertson 1996). Subfossil remains have been found in the South Island, southern North Island and Chatham Islands (Millener 1990: Turbott 1990. Worthv 1997. A. ~ e n n ~ s o i pers. comm.). Bones from'northein bays of the South Island were abundant enough to suggest that breeding occurred there (A. Tennyson, pers. comm.) and some birds were apparently fledglings that died taking their first swim (Worthy 1997).
Maori and early European period Little is known about yellow-eyed penguins before European settlement. The Maori knew them by several names, including tawaki (Falla 1935), korara (Gray 1862) and takaraka (Richdale 1985), but hoiho became the more commonly used name in European times (e.g., Hutton 1871; Oliver 1930, 1955; Turbott 1990). Penguins were hunted by Maori for food and their remains have been found in middens in several parts of the South Island (Millener 1990; Turbott 1990; Worthy 1997). It is possible that humans extirpated the penguins from the northern parts of their range (Worthy 1997).
During the early period of New Zealand's written natural history, records of the distribution and numbers of this species were sketchy. It was discovered at the
Auckland Islands in 1840 during Admiral D'Urville's French expedition (Hombron & Jacquinot 1841). A year later it was found on mainland New Zealand by naturalists on Sir James Clark Ross's expedition (Gray 1844).
Otago Peninsula In 1859, most of Otago Peninsula was covered with forest. with more clear areas (~resumablv areas of ferns. grassland and cultivation) in'ihe north &here the main Maori settlement was (O'Kech 1977). Given that Maori ate penguins, numbers may have been limited by hunting pressure (O'Kech 1977) but what level of hunting occurred is unknown. The cool, coastal podocarp/hardwood forest was probably the traditional breeding habitat of yellow-eyed penguins on mainland New Zealand (Darby & Seddon 1990) but presumably other vegetation communities (e.g., Hebe scrub) which fringed the coastline were also used. By 1901 only fragments of forest remained on the peninsula as land was cleared by Europeans for farming (O'Kech 1977). Aerial photographs taken in 1942 (New Zealand Department of Survey and Land Information collection) that very little coastal shubland or forest remained by that time on the Otago Peninsula coast.
Penguins were first recorded as breeding on Otago Peninsula in 1885 (Oliver 1955). There are hints that numbers had dwindled on the peninsula in the phrasing of accounts from the 1920s and 1930s: "there still exists a small breeding colony in the forest not far from the sea" (Oliver 1930); "The northern limit of the breeding range of the yellow-eyed penguin is the south side of Otago Peninsula, where there are still small colonies" (Falla 1935).
In 1936, Lance Richdale, a school teacher and agricultural trainer, recognised the plight ofyellow-eyed penguins and began 18 years of part-time, but detailed, field work on the species on Otago Peninsula. At the outset he suggested that they appeared to be in trouble. 'Within quite recent years Megadyptes antipodes occupied probably in their thousands the one time bush clad slopes of the Otago Peninsula. The destruction of the vegetation which formed his natural habitat has been no doubt the chief agent in the decimation of his numbers from thousands to hundreds" (Richdale 1942), and "When I began to study penguins on the Otago Peninsula in 1936-37, practically all the breeding areas had been converted from densely forested hills into grass-land for farms. Roads were built, the motor-car came, and man's various destructive agencies took their toll of wild life" (Richdale 1957). The breeding areas were mere remnants and "barren of birds" (Richdale 1957). 'Xfurther toll was taken by commercial collectors, who were active before the passing of the Animals Protection and Games Act, 1921-22," . . . "Then followed a series of devastating massacres by youths with pea- rifles, and it was reported that as many as forty were slaughtered in one afternoon." ... "During my
Historical records of yellow-eyed penguin 147
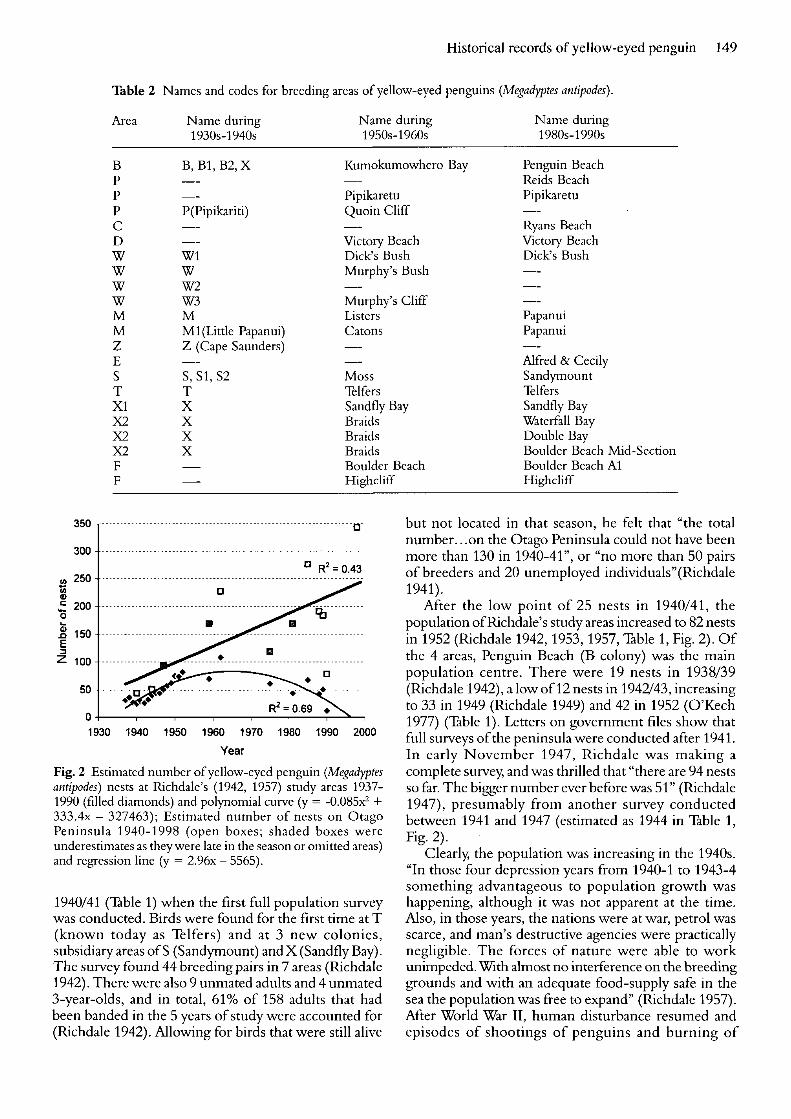
Fig. I Yellow-eyed penguin (Megadyptes anrkoda) breeding areas on Otago Peninsula in the 1930s-1940s (letters and names in light script, aftcr Map 2, Richdalc 1942, reproduced with permission of Hockcn Library. Duncdin) and the present (letters and names in bold italic scrip).
experience, nests have been continually robbed by the thoughtless; in the 1939-40 season, a whole colony was deprived of its eggs," . .. "If depredations continue I estimate that by 1950, extremely few penguins will be left on the Peninsula. Yet in normal seasons their mortality rate is so low that the natural increase would compensate for past losses, if we could only preserve what we still have remaining" (Richdale 1942).
It is clear from these passages that Richdalewas deeply concerned for the penguin's welfare. From a modern perspective, it is curious that Richdale made little reference to penguin numbers or locations of study areas in his published works. Paradoxically because there was little public interest in conservation at the time of his work, possibly one of the best ways to conserve the birds was to keep their location a secret. Furthermore, he was somewhat of a hard-working loner. discouraging visitors to his study sites and clashingwith the local authorities over conservation issues (Warham 1984). Professional jealousy may also have been involved: "I cannot help feeling that this came about in the first place in order prevent a certain other local ornithologist from benefiting" (Sharpe 1956).
Richdale's (1957) "main study area" comprised areas B, M and Z (Richdale 1942) (Fig. I), which are
known today as Penguin Beach (B), Murphy's Bush/ Cliff and Dick's Bush 0, Papanui Beach (M), and the bay adjacent to Cape Saunders ( Z ) (Fig. 1, Table 1; Table 2). Richdale visited these areas dozens of times each season, sometimes camping there for weeks at a time, so he knew the resident penguins intimately and practically all breeding and non-breeding birds were found each season (Richdale 1957). The remaining 5 breeding areas (principally S, X, T; also P - Pipikariti and NH - North Head) were not visited annually, but when visited, every effort was made to find the breeding birds, and particularly to search for recruits from fledglings banded in the study area (Richdale 1957). In 1940141 they were each visited 3-4 times (Richdale 1942). "At the beginning of my survey, there occurred at least eight colonies on the Otago Peninsula, . .. but the birds at two of these have since disappeared" (Richdale 1942). One of these areas apparently used to have 200 individuals (Richdale 1941). Probably this was area P (Pipikariti Colony, Fig. 1) where 6 breeders were banded in 1936137, but none subsequently, and regular visits ceased 2 years later.
The late 1930s were bad seasons for yellow-eyed penguins and numbers in Richdale's 4 study areas decreased from 36 breeding pairs in 1938139 to 25 in
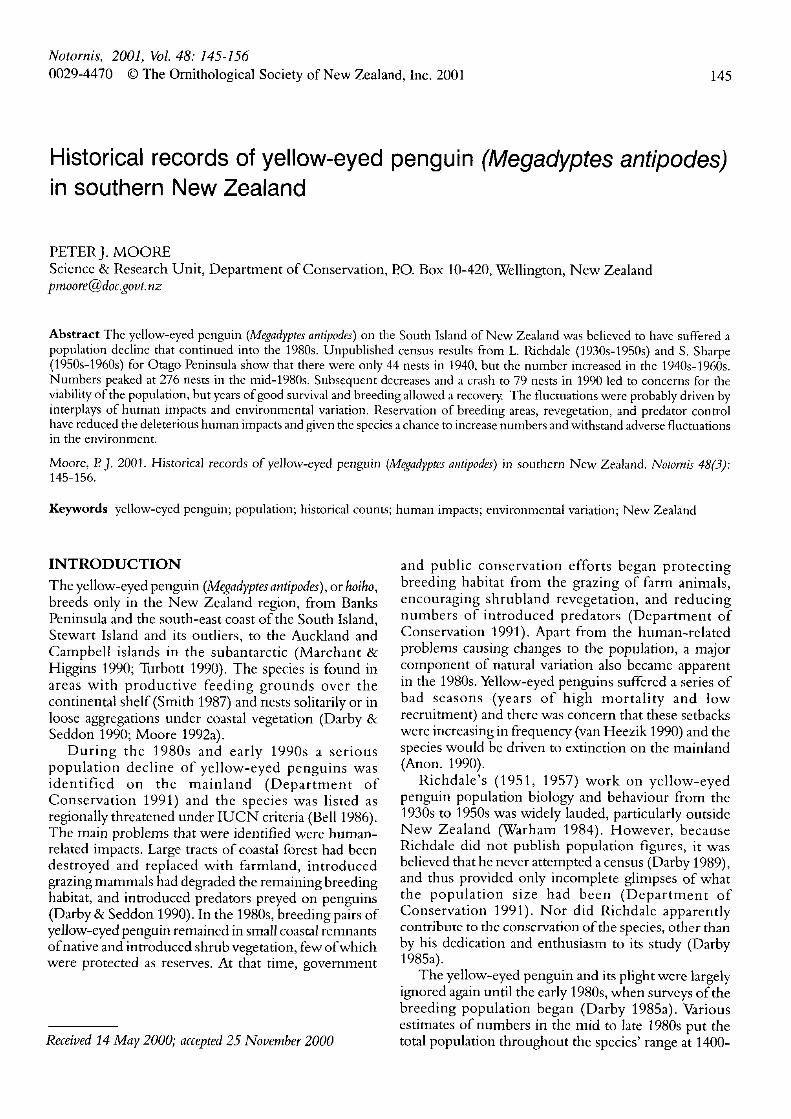
Table 1 Counts and estimates of yellow-eyed penguin (Megadyptes antkodes) nests on Otago Peninsula, 1936-1998. Names and codes for areas are given in Table 2. I
P CO
Area of Otago Peninsula (Fig. 1, Table 2) BWMZ
Year B P C D W M Z E S T X1 X2 F Sub-total Census total Reference 5 0
-- Papanui Papanui -- Alfred & Cecily Sandymount Telfers Sandfly Bay Waterfall Bay Double Bay Boulder Beach Mid-Section Boulder Beach A1 Highcliff
1930 1940 1950 1960 1970 1980 1990 2000
Year
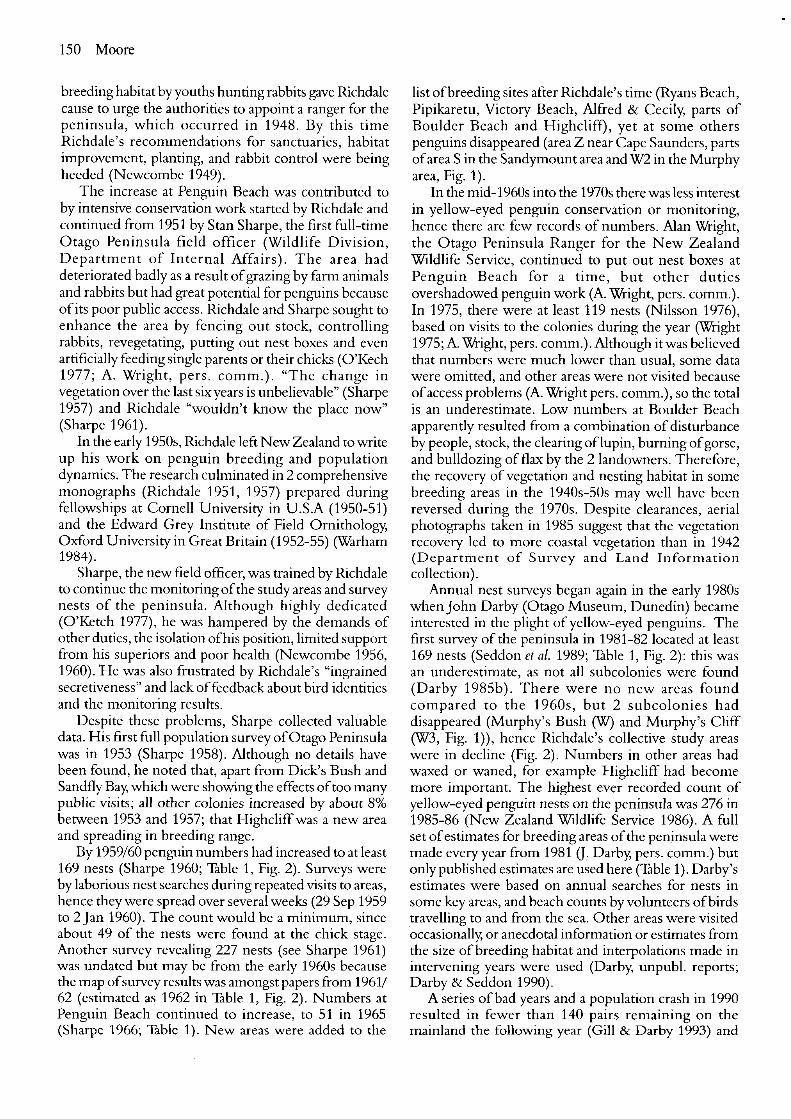
Fig. 2 Estimated number of yellow-eyed penguin (Megadyptes antipodes) nests at Richdale's (1942, 1957) study areas 1937- 1990 (filled diamonds) and polynomial curve (y = -0.0852 + 333.4~ - 327463); Estimated number of nests on Otago Peninsula 1940-1998 (open boxes; shaded boxes were underestimates as they were late in the season or omitted areas) and regression line (y = 2.96~ - 5565).
1940141 (Table 1) when the first full population survey was conducted. Birds were found for the first time at T (known today as Telfers) and at 3 new colonies, subsidiary areas of S (Sandymount) andX (Sandfly Bay). The survey found 44 breeding pairs in 7 areas (Richdale 1942). There were also 9 unmated adults and 4 unmated 3-year-olds, and in total, 61% of 158 adults that had been banded in the 5 years of study were accounted for (Richdale 1942). Allowing for birds that were still alive
but not located in that season. he felt that "the total number.. .on the Otago Peninsula could not have been more than 130 in 1940-41", or "no more than 50 pairs of breeders and 20 unemployed individualsn(Richdale 1941).
After the low point of 25 nests in 1940141, the population of Richdale's study areas increased to 82 nests in 1952 (Richdale 1942, 1953, 1957, Table 1, Fig. 2). O f the 4 areas, Penguin Beach (B colony) was the main population centre. There were 19 nests in 1938139 (Richdale 1942), a low of 12 nests in 1942/43, increasing to 33 in 1949 (Richdale 1949) and 42 in 1952 (O'Kech 1977) (Table 1). Letters on government files show that full surveys of the peninsula were conducted after 1941. In early November 1947, Richdale was making a complete survey, and was thrilled that "there are 94 nests so far. The bigger number ever before was 51" (Richdale 1947), presumably from another survey conducted between 1941 and 1947 (estimated as 1944 in Table 1, Fig. 2).
Clearly, the population was increasing in the 1940s. "In those four depression years from 1940-1 to 1943-4 something advantageous to population growth was happening, although it was not apparent at the time. Also, in those years, the nations were at war, petrol was scarce, and man's destructive agencies were practically negligible. The forces of nature were able to work unimpeded. W ~ t h almost no interference on the breeding grounds and with an adequate food-supply safe in the sea the population was free to expand" (Richdale 1957). After World War 11, human disturbance resumed and episodes of shootings of penguins and burning of
150 Moore
breeding habitat by youths hunting rabbits gave Richdale cause to urge the authorities to appoint a ranger for the peninsula, which occurred in 1948. By this time Richdale's recommendations for sanctuaries, habitat improvement, planting, and rabbit control were being heeded (Newcombe 1949).
The increase at Penguin Beach was contributed to by intensive conservation work started by Richdale and continued from 1951 by Stan Sharpe, the first full-time Otago Peninsula field officer (Wildlife Division, Department of Internal Affairs). The area had deteriorated badly as a result of grazing by farm animals and rabbits but had great potential for penguins because of its poor public access. Richdale and Sharpe sought to enhance the area by fencing out stock, controlling rabbits, revegetating, putting out nest boxes and even artificially feeding single parents or their chicks (O'Kech 1977; A. Wright, pers. comm.). "The change in vegetation over the last six years is unbelievable" (Sharpe 1957) and Richdale "wouldn't know the place now" (Sharpe 1961).
In the early 1950s, Richdale left New Zealand to write up his work on penguin breeding and population dynamics. The research culminated in 2 comprehensive monographs (Richdale 1951, 1957) prepared during fellowships at Cornell University in U.S.A (1950-51) and the Edward Grey Institute of Field Ornithology, Oxford University in Great Britain (1952-55) (Warham 1984).
Sharpe, the new field officer, was trained by Richdale to continue the monitoring ofthe study areas and survey nests of the peninsula. Although highly dedicated (O'Ketch 1977), he was hampered by the demands of other duties, the isolation of his position, limited support from his superiors and poor health (Newcombe 1956, 1960). 'He was also frustrated by Richdale's "ingrained secretiveness" and lack of feedback about bird identities and the monitoring results.
Despite these problems, Sharpe collected valuable data. His first full population survey of Otago Peninsula was in 1953 (Sharpe 1958). Although no details have been found, he noted that, apart from Dick's Bush and Sandfly Bay, which were showing the effects oftoo many public visits; all other colonies increased by about 8% between 1953 and 1957; that Highcliff was a new area and spreading in breeding range.
By 1959/60 penguin numbers had increased to at least 169 nests (Sharpe 1960; Table 1, Fig. 2). Surveys were by laborious nest searches during repeated visits to areas, hence they were spread over several weeks (29 Sep 1959 to 2 Jan 1960). The count would be a minimum, since about 49 of the nests were found at the chick stage. Another survey revealing 227 nests (see Sharpe 1961) was undated but may be from the early 1960s because the map ofsurvey results was amongst papers from 1961/ 62 (estimated as 1962 in Table 1, Fig. 2). Numbers at Penguin Beach continued to increase, to 51 in 1965 (Sharpe 1966; Table 1). New areas were added to the
list ofbreeding sites after Richdale's time (Ryans Beach, Pipikaretu, Victory Beach, Alfred & Cecily, parts of Boulder Beach and Highcliff), yet at some others penguins disappeared (area Z near Cape Saunders, parts of area S in the Sandymount area and W2 in the Murphy area, Fig. 1).
In the mid-1960s into the 1970s there was less interest in yellow-eyed penguin conservation or monitoring, hence there are few records of numbers. Alan Wright, the Otago Peninsula Ranger for the New Zealand Wildlife Service, continued to put out nest boxes at Penguin Beach for a time, but other duties overshadowed penguin work (A. Wright, pers. comm.). In 1975, there were at least 119 nests (Nilsson 1976), based on visits to the colonies during the year (Wright 1975; A. Wright, pers. comm.). Although it was believed that numbers were much lower than usual, some data were omitted, and other areas were not visited because ofaccess problems (A. Wright pers. comm.), so the total is an underestimate. Low numbers at Boulder Beach apparently resulted from a combination of disturbance by people, stock, the clearing of lupin, burning of gorse, and bulldozing of flax by the 2 landowners. Therefore, the recovery of vegetation and nesting habitat in some breeding areas in the 1940s-50s may well have been reversed during the 1970s. Despite clearances, aerial photographs taken in 1985 suggest that the vegetation recovery led to more coastal vegetation than in 1942 (Department of Survey and Land Information collection).
Annual nest surveys began again in the early 1980s when John Darby (Otago Museum, Dunedin) became interested in the plight of yellow-eyed penguins. The first survey of the peninsula in 1981-82 located at least 169 nests (Seddon et al. 1989; Table 1, Fig. 2): this was an underestimate, as not all subcolonies were found (Darby 1985b). There were no new areas found compared to the 1960s, but 2 subcolonies had disappeared (Murphy's Bush (W) and Murphy's Cliff (W3, Fig. I)), hence Richdale's collective study areas were in decline (Fig. 2). Numbers in other areas had waxed or waned, for example Highcliff had become more important. The highest ever recorded count of yellow-eyed penguin nests on the peninsula was 276 in 1985-86 (New Zealand Wildlife Service 1986). A full set of estimates for breeding areas of the peninsula were made every year from 1981 a. Darby, pers. comm.) but only published estimates are used here (Table 1). Darby's estimates were based on annual searches for nests in some key areas, and beach counts by volunteers ofbirds travelling to and from the sea. Other areas were visited occasionally, or anecdotal information or estimates from the size of breeding habitat and interpolations made in intervening years were used (Darby, unpubl. reports; Darby & Seddon 1990).
A series of bad years and a population crash in 1990 resulted in fewer than 140 pairs remaining on the mainland the following year (Gill 81 Darby 1993) and
Historical records of yellow-eyed penguin 151
79 nests on the Otago Peninsula (Darby & Paterson 1991). This was the lowest population recorded on Otago Peninsula since the count of 44 nests in 1940141, 50 years earlier (Table 1, Fig. 2). Adult mortality of more than 40% was recorded at Double Bay and Mid-Section; and Dick's Bush ceased to be a breeding area (Efford et al. 1994; Efford & Spencer 1996). There was a quick initial recovery in nesting numbers on the peninsula (Moore & Wakelin 1997; Moore et al. 1995) as surviving breeders returned after taking a year off from breeding (Efford et al . 1994; Efford & Spencer 1996). In subsequent years, numbers gradually recovered, as shown by 3 areas (Highcliff, A1 and Sandfly Bay) monitored annually by the Department of Conservation (Table 1; author's unpubl. data; D. Nelson pers. comm.). The recovery resulted from high adult survival and good recruitment (Efford & Spencer 1996). Some revegetated areas gained their first influx of new breeders after a decade of planting (D. Nelson, pers. comm.).
Catlins Compared with Otago Peninsula, few historical population data are available for the Catlins, although, paradoxically, more has been made of them to illustrate population change. Darby & Seddon (1990) used figures from Penguin Bay (200+ birds) and Hina Hina Cove (loo+ birds) in the 1940s (quoted from Richdale 1942) to suggest a greater than 75% decline to 1988. However, Richdale's general estimates of "about two hundred birds" and "about one hundred birds" were based on extrapolations he made from nest searches. At Penguin Bay in January 1939, he found 39 nests (Richdale 1942). H e suggested that earlier in the season there may have been 65 nests because of unusually high egg infertility and chick loss (41.5% instead of the usual 14.5%) during the same breeding season at the Otago Peninsula study areas. At Hina Hina Cove he found 23 nests, and similarly extrapolated this to 40 nests at the start of the season (Richdale 1942). There were an estimated 12- 22 nests estimated in the mid-late 1980s at Penguin Bay (Seddon et at. 1989; New Zealand Wildlife Service 1986), which suggests a decrease of 44-82% over the 50-year interval, depending on which of the range of estimates are used. ~t the sake time, 16-25 pairs were estimated at Hina Hina Cove (Seddon et al. 1989; New Zealand Wildlife Service 1986), which could be interpreted as little change (+9%), or a decline of 6O%, depending on whether Richdales's extrapolation is accurate or not. Numbers crashed to possibly as few as 4 nests at both areas in 1990 (Darby & Paterson 1991) but the population at Penguin Bay had recovered to 16 nests in 1993 (Ratz 1997).
The variability in nesting numbers illustrates the difficulty in using single estimates for the Catlins from the 1940s as a population benchmark. To complicate matters further "Falla (1935,321) states that the species nests at Nugget Point, but I have searched the area, and failed to find nests" (Richdale 1942). At its peak in the
mid-1980s Nugget Point had 40-50 nests, so perhaps they were more numerous than 50 years earlier. The number of nests then crashed to 4 in 1990 (Darby & Paterson 1991) and, after a slow recovery, increased to 10 by 1995 (B. Murphy, pers. comm.). Richdale (1942) mentions only a few other sites (Chaslands, Wallace Beach, near Curio Bay, Jack's Bay) along the Catlins- Southland coast, "but there must be several (breeding areas) in this vicinity". In the 1980s and 1990s there were about 15 breeding areas between Nugget Point and Slope Point (New Zealand Wildlife Service 1986). Jack's Bay had a "small colony" (Richdale 1942), as it did in the mid-1980s, with 4-9 nests estimated (Seddon et al. 1989; New Zealand Wildlife Service 1986).
Stewart Island Population records from Stewart Island rely even more on anecdotal data than do those from the Catlins. Richdale (1942) noted that penguins favoured the sheltered northern and eastern coasts. H e listed breeding areas as Evening Cove (near Halfmoon Bay), Port William, the north-east coast of the main island, Codfish Island, Earnest Island, Big South Cape Islands, Port Pegasus, Lord's River, Ocean Beach, the Neck, Paterson Inlet, and Bench Island. Richdale (1942) searched Bench Island for 6 days and found 27 nests, which he considered may have represented 50 nests at the start of the season (assuming the same rate of loss as on Otago Peninsula that year). A partial search of Bench Island over 2 days in 1999100 found 17 nests, although the total population was certainly much greater (Blair 2000).
Recent population estimates for Stewart Island (470- 705 pairs, New Zealand Wildlife Service 1986; 350-450 pairs, Darby & Seddon 1990) were based o n extrapolations from coarse surveys along the north- eastern coast and beach counts at Codfish Island. The size of the coastline and dispersed population make surveys daunting. The Department of Conservation surveyed parts of the coastline in the late 1980s-early 1990s and considered there might be a minimum population of 395 pairs (Roberts 1992). The Yellow- eyed Penguin Trust searched near penguin landing sites on the north-east coast of Stewart Island in 1999100 and found 33 nests at 7 sites and a further 33 nests on offshore islands (Blair 2000).
DISCUSSION There was real concern in the late 1980s that the mainland yellow-eyed penguin population was heading towards extinction because of major decreases and only partial recoveries (Triggs & Darby 1989). Darby & Seddon (1990) maintained that only since 1981 had any real attempt been made to assess the population. The authors used limited data and verbal anecdotes from the Catlins to suggest a more than 75% decline between the 1940s and 1980s, which left the impression that the decline was long-term and general. However, the data
152 Moore
presented in this paper cast a different light on history of the yellow-eyed penguin population. I suggest that we have witnessed only a small part of long-term fluctuations, and that these are likely to be the result of a complex interplay between human impacts and environmental variation, none of which are well understood. Efford & Spencer (1996) note that "It is increasingly obvious that no one area or short sequence of years can be considered 'representative' of yellow- eyed penguin population dynamics. To better manage the suite of mainland sub-populations we need to compare long-term trends at different sites and to understand the causes underlying these trends." Unfortunately the historical population record is fragmented and we are still a long way from understanding the causes of population change. Some of these issues are discussed below
Human impacts, hunting and predators There is no doubt that human impacts on the coastal environment o f N e w Zealand have been major influences on the yellow-eyed penguin population. Chief agents of change have been identified as the loss of breeding habitat and introduced predators (Darby & Seddon 1990). These are two of the commonest agents ofdecline and recent extinctions of avian species around the world (Caughley 1994). Hunting by Maori was also probably a major pressure, since the combination of hunting, the first mammalian predators and habitat destruction caused a rapid reduction in abundance and number of species in the N e w Zealand avifauna (Holdaway 1989). Fossil evidence shows that the current distribution of yellow-eyed penguins is a relict of the former range, and their presence and frequency in middens around the country suggests that human disturbance was an important agent of change (Worthy 1997). However, we have no idea what the pre-human population level might have been.
W ~ t h the arrival of Europeans and the breakdown of Maori culture, hunting of penguins for food probably decreased, but egg collectors and vandals took their toll through to the 1940s (Richdale 1942). Subsequently these impacts on the penguin population also decreased. Conversely, the influence of the new array of introduced mammals must have increased after the arrival of Europeans, but the impact was not necessarily straight- forward or immediate. For example, predation by mustelids and cats Felis catus was apparently minor in the 1930s-1950s (Richdale 1957) but had a major effect on penguin productivity in the 1980s (Darby & Seddon 1990). Even then, predation of chicks varied greatly between areas and years (Darby & Seddon 1990; Ratz 1997).
Habitat changes It has been assumed that yellow-eyed penguins were more numerous on the South Island before forest clearance, because by the 1930s they lived in tiny
remnants of vegetation on Otago Peninsula (Richdale 1942) and anecdotes suggested that some individual areas previously had hundreds of birds (Darby & Seddon 1990). A decline at Catlins may have happened later than Otago Peninsula as habitat destruction was less complete bv the 1940s but has continued to the vresent. However. there are too few penguin counts at the Catlins during the 1940s to allow meaningful comparisons with present data.
Although it has been assumed that the historically vast tract; o f forest might have been home to vast numbers of penguins, the size of the breeding area may not relate directlv to the size of the ~ o ~ u l a t i o n . Other n L
factors, such as presence of a good food supply, will also be involved. Furthermore, nesting densities in open forest habitat are lower than in coastal scrub or flax/ pasture/tussock associations (Marchant & Higgins 1990; Moore 1992a), possibly because breeding yellow-eyed penguins require visual isolation from their neighbours (Darby 1985a). Although forest and shrub canopy was thought to be ideal for preventing thermal stress on land (Darby & Seddon 1990) penguins were adaptable enough to breed productively in mere scraps of vegetation in small gullies or collections of nest boxes on barren farmland (Ratz 1997).
As well as the influence of large-scale habitat change, some fine-scale changes in population are caused by changes in land use. Nests are highly vulnerable to trampling by domestic stock (Marchant & Higgins 1990), so some cleared areas, such as Penguin Beach, may have become more favourable for penguin breeding dur ing the 1940s through lack of grazing and regeneration of coastal scrub. Regeneration probably reversed overnight in some areas if the scrub was burnt or cleared again.
Aspects of penguin biology heal population growth is also likely to be compounded by the social attraction of recruits to busy areas and, conversely, a formerly important area with very few penguins living there may not attract new birds, even after it is protected from grazing and habitat degradation (e.g., Sandymount). This phenomenon was observed on Campbell Island, where a population of about 100 birds was decimated over a short period by predation and disturbance by Hooker's sea lion, Phocarctos hookeri (Moore 1992b; Moore & Moffat 1992). Few birds used the area for the next decade (pers. obs.). Similarly, newly vegetated areas take many years to attract birds, for example, 10 years at a replanted area of Highcliff on Otago Peninsula (D. Nelson, pers. comm.).
Marine environment and natural events Notwithstanding the problems breeding penguins encounter on land, they also face problems at sea that ultimately influence population size. Some adult mortality is a direct result of human activity at sea, for example by the accidental capture ofpenguins in fishing
Historical records of yellow-eyed penguin 153
nets (Marchant & Higgins 1990). Richdale (1942,1957) concluded that a lack of commercial fishing during World War I1 assisted the food supply for penguins and allowed the population to increase. However, in the 1990s, penguin diet and the commercial fish catch did not overlap significantly (Moore & Wakelin 1997). It was more likely that natural variation and anomalies in the marine environment influenced the food supply and affected penguin breeding success and survival (Moore & Wakelin 1997). For example, during years of high breeding success incidences of some prey species were higher in the penguin diet, which implied that the availability of more nutritious prey influenced success (van Heezik 1990; Moore & Wakelin 1997). Also, foraging trips were shorter and birds fed closer to shore during those years, further suggesting that conditions were favourable (Moore 1999).
In the 1930s-1940s survival and breeding success fluctuated but 1 particularly poor season in 1938/39 was "markedly different from all the others" (Richdale 1957). Chick production was low (0.6 chicks nest-'; cfmean of 1.2, calculated from data in Richdale (1957) in Moore (1992a)), a low proportion of juveniles was resighted (22% cf mean 41%), moulting was later than usual, and adult survival was low (74% cf mean of 86%). Richdale (1957) suggested that an unusual event at sea was affecting the food supply in 1938/39, and that the effects of this flowed on to the following season, which also had unusual breeding statistics. Other comparatively poor seasons (below average adult survival,-breeding success, or both) were 1944/45, 1946/47, and 1951/52, although they did not result in population decreases. During the intervening periods penguins fared much better (e.g., adult survival was 94% in 1940, juvenile survival 44% and 1.4 chicks nest-' were produced).
It appeared that poor seasons increased in frequency in the mid 1980s to early 1990s (van Heezik 1990; van Heezik& Davis 1990). A bad season in 1985/86 at Otago Peninsula and the Catlins was accompanied by low adult weights (200-400g lower than 1984/85), delayed moult, and high mortality of adults and juveniles (< 1% were subsequently seen) (van Heezik & Davis 1990). At Nugget Point in the Catlins, starvation of chicks was apparently caused by a poor food supply about 40-55 days after they hatched (van Heezik 1991), causing a shift from favoured fish species to squid and less nutritious prey (van Heezik 1990). The effects were less pronounced at Otago Peninsula where 8 areas had moderate success of 1.1 chicks nest-' (Darby & Seddon 1990).
In 1989/90 the population crashed and about 150 adults died over a short period. No definite cause was found, although it was suggested that an unidentified phytotoxin (Gill & Darby 1993) or avian malaria (Graczyk et al. 1995) may have been involved. These factors mav have acted in concert with other environmental factors or perturbations in the food supply.
All the above breeding seasons were followed by substantial (20-42%) decreases in the size of the penguin population (Richdale 1957; Darby & Seddon 1990; Darby 1989; Efford & Spencer 1996). Usually, the year following a bad season was also anomalous in other ways ( e g , deferred breeding, later than usual laying date, lower than average breeding success and survival), but with less dramatic effects on population level. Subsequent periods with favourable conditions allowed the population to grow and nesting numbers to recover. It took 6 years at 2 areas of Otago Peninsula after the 1990 crash for nesting numbers to return the levels of the mid 1980s (Efford & Spencer 1996). In other studies of penguin populations, such as those for gentoo penguins Pygoscelispapua, unusual years of high mortality and deferred breeding have also been noted, a result of reduced krill availability or climatic extremes. In that species (at a rate of about 2 bad seasons in 15 years), the population was almost in balance, which suggested that any increase in the proportion of bad years would cause a decline (Croxall & Rothery 1995).
The deleterious effects of the worst breeding seasons for yellow-eyed penguins have not become obvious until part-way through the season (Richdale 1957; van Hcczik 1990; Gill & Darby 1993). Unfortunately for conservation managers, it is not possible to predict bad seasons in advance because of our poor knowledge of the svstems involved ( E d ~ e et al. 1999). There is some
\ " promise in the use of climatic variables such as rainfall as indicators (Peacock 1995). There may also be a relationship with E N S 0 (El Nifio/Southern Oscillation) as the cool water oeriods during- El Nifio vears tend to u
be good for penguins and the warm water La Nifia years tend to be deleterious (Moore & Wakelin 1997). However, the use of penguin breeding parameters such as laying date to forecast breeding success may be misleading if they are flow-on effects from a previous poor year-rather- than the harbinger of another bad season.
Catastrophic breeding failures or mass deaths resulting from oceanographic and climatic factors, either directly or via the food supply, are a fact of life for seabirds, and may happen at least once per decade (Wooller et al. 1992). However, the frequency of these events should be monitored as thev mav be influenced , , or exacerbated by human activities.
Numbers of nests versus numbers of birds Population size of yellow-eyed penguins is generally described in terms of the annual estimated number of nests and it is assumed that the trend in these estimates will reflect the overall population trend. Short-term changes may however be caused by variation in the proportion of birds that breed each year. In most years about 60-80% of adult yellow-eyed penguins breed but in occasional anomalous years the proportion is lower (Efford et al. 1994). For example, in 1990/91, a year after the population crash when 42% of adults disappeared
154 Moore
(Efford & Spencer 1996), there was a 55% decrease in nesting numbers because the proportion of birds breeding was low (<30%, Efford et al. 1994). corresp&dingly, the increase in nest numbers in 19911 92 was greater than would be expected from recruitment alone, as birds returned to breed. Even in normal years, although the adult population varied by -9% to + 17%, the number of nests showed greater annual changes (Efford & Spencer 1996). Similarly, the decrease in breeding pairs from 36 to 25 in Richdale's study areas between 1938139 and 1940141 was caused by high annual mortality (26%) and associated high levels of partner separation (Richdale 1957). To avoid misinterpretation of anomalous years in population trend data then, it is necessary to collect annual nest counts and adult survival data.
Population change There is a good series of yellow-eyed penguin nest numbers at Otago Peninsula from the 1930s-1960s and 1980s-1990s and shorter periods of more detailed population dynamics work which allow interpretation of the trends. Even allowinz for the ~ossible effects of u
different survey techniques and unknown levels of accuracy of the estimates, the scale of change is high. Richdale (1942) observed that numbers were decreasing to critically low levels in the 1930s-1940s (44 nests). They increased steadily from that time through to the 1960s (>200 nests). Numbers were at a similarly high level in the 1980s and peaked in the middle ofthe decade (276) before crashing in 1990 (79 nests) and recovering again during the 1990s (Table 1, Fig. 2). So, rather than a long-term decline in the twentieth century, there were fluctuations in abundance that resulted in an overall increasing trend (Fig. 2: top regression line). By 1996, the number of penguins breeding on the South Island (c.640 pairs) was probably the highest in living memory (Anon. 1997).
Over a period of more than 60 years, penguins disappeared from some areas (e.g., Pipikariti by 1937, area Z near Cape Saunders by 1959, Dick's Bush by 1990) and appeared at others (e.g., Highclift; Alfred & Cecily by 1960s). Abundance and distribution changed in different areas. For example, the Penguin Beach population increased from 15 nests in 1940 (Area B, Richdale 1942) to a peak of 51 nests in 1965. Subsequently, numbers decreased to fewer than 30 nests annually in the 1980s. This contributed to Richdale's combined study areas (BWMZ) waxing and waning between 1937 and 1990 (as shown by the polynomial curve in Fig. 2). Sandymount was the 2nd most populous area in the 1960s, but few birds bred there by the 1990s. In contrast, Pipikaretu, Ryans and Highcliff had few penguins in the 1960s but are important areas today. The impression is, therefore, of local areas pulsing in abundance at different rates and contributing to overall fluctuations in the total population on the Otago Peninsula.
Conclusions Since humans arrived in New Zealand the yellow-eyed penguin population reduced in range and probably abundance through the combined actions of hunting, destruction of breeding habitat and introduced predators. Despite these impacts continuing into the 20th century the penguin population on mainland New Zealand has been surprisingly resilient. The diversion of human activity during world wars, periods of regeneration of coastal scrub, and conservation efforts improved the situation and the penguin population on Otago Peninsula increased through to the 1980s. Occasional natural catastro~hes drove numbers down. leading to concern about survival of the species on the mainland of New Zealand, but years of good breeding and survival allowed the population to recover. Areas were always at risk from land-use changes, because by the 1980s, very few penguin breeding areas were adequately protected, either through legal reservation or private covenant (Darby 1985a; New Zealand Service 1986; Seddon et al. 1989).
Whereas in the 1930s-1940s conservation activity had to be kept more-or-less secret, by the 1980s people were more interested in conservation issues. Penguins were high profile animals and a tourist drawcard, especially at Otago Peninsula, and their plight was well publicised (Darby 1985a). There were many efforts by government, public interest groups and private landowners to fence and protect habitat from grazing animals, revegetate areas or provide nest boxes to improve nesting opportunites and control introduced predators (e.g., Seddon & van Heezik 1989; Department of Conservation 1991; Gray 1991; Anon. 1996).
Long-term population studies (Richdale 1957; Efford et at. 1994; Efford & Spencer 1996) have greatly improved knowledge on the dynamics of the yellow-eyed penguin but more work is required to determine the parameters that regulate the population. Possible agents of decline have not been tested against each other. which should u
be a prerequisite of management action (Caughley 1994; Green 1994). Little can be done about natural catastrophes, but management actions need not relate directly to a particular cause of a population decline (Green 1994). At present then, the best way to ensure the continued survival of yellow-eyed penguins is to protect and enhance their breeding habitat, and to protect adults and chicks from introduced predators. Fortunately, they are very productive breeders during good seasons when most pairs produce 2 chicks. As noted by Richdale (1942), their normal survival rate and productivity are high enough to compensate for past losses. This should give the species a good chance to build up sufficient numbers to withstand future fluctuations in food supply or the environment.
ACKNOWLEDGEMENTS
I thank the Hocken Library (University of Otago) for access
Historical records of yellow-eyed penguin 155
to Richdale's unpublished papers and to Chris Robertson for access to Stan Sharpe's papers. Chris Robertson, Murray Efford, and 2 anonymous referecs commented on earlier drafts of this paper.
LITERATURE AND UNPUBLISHED RECORDS CITED
Anon. 1990. Mystery deaths hit world's rarest penguins. New scientist 17 March 1990: 6.
Anon. 1996. Tree planters wanted - no experiencc necded. Yellow-eyedpenguin news 15 (May 1996): 4.
Anon. 1997. Births and deaths - the 1996-97 breeding season. Wow-eyedpenguin news 14 (Nov 1997): 3.
Bell, B.D. 1986. The conservation status of New Zealand wildlife. New Zealand Wild/$ Service occasional publication 12.
Blair, D. 2000. How many yellow-eyed penguins on Stewart Island? Yellotv-eyed penguin news 22 (May 2000): 1-2.
Caughley, G. 1994. Directions in conservation biologyJotrrna1 ofanimal ecology 63: 215-244.
Croxall, J.P; Rothery, P 1995. Population change in Gcntoo Penguins Pygoscelis papua at Bird Island, South Georgia: potential roles of adult survival, recruitment and deferred breeding. pp. 26-38 In: Dann, P; Norman, I.; Reilly, P (ed.). The penguins: ecology and management. Chipping Norton, Surrey Bcatty & Sons.
Darby, J. 1985a. The great yellow-eyed penguin count. Forest and bird 16(2): 16-18.
Darby, J. 1985b. Letter, 11 Oct. 1985, Department of Internal Affairs file 33/5/24, New Zealand National Archives.
Darby, J.T. 1989. Seabird monitoring in New Zealand. pp. 235- 239 In : Craig, B. (ed.), Proceedings of a symposium on environmental monitoritzg in N e w Zealand. Wellington, Department of Conservation.
Darby, J.T.; Paterson, A. 1991. Notes on yellow-eyed penguin field season, South Island, 1990-91. pp. 42-47 In: Moore, PJ. (ed.) Yellow-eyed penguin research and monitoring studies 1990-1991. New Zealand Department ofConsewation, Science G Research internal rcport 110.
Darby, J.T.; Seddon, PJ. 1990. Breeding biology ofyellow-eycd penguins (Megadyptes antipodes). pp. 45-62 In: Davis, L.S.; Darby, J.T. (ed.) Penguin biology. New York, Academic Press.
Departmcnt of Conservation 1991. Yellow-eyed penguin Megadyptes antipodes species conservation strategy, revised November 1991. Dunedin, Dcpartment of Conservation.
Edge, K-A; Jamieson, I.G.; Darby, J.T. 1999. Parental investment and the management of an endangered penguin. Biological conservation 88: 367-378.
Efford, M.; Spencer, N.; Darby, J. 1994. Population studics of yellow-eyed penguins, 1993-94 progress rcport. Landcare Research contract report LC9495/39, prepared for Department of Conservation.
Efford, M.; Spencer, N. 1996. Population studies of yellow- eyed penguins. Landcare Research contract report LC9697/014, prepared for Dcpartment of Conservation.
Falla, R.A. 1935. Notes on penguins of the genera Megadyptes and Eudyptes in southern New Zealand. Records of the Auckland Institute and Museum l (6): 3 19-326.
Gill, J.M.; Darby, J.T. 1993. Deaths in yellow-eyed penguins (Megadyptes antipodes) on the Otago Peninsula during the summer of 1990. N e w Zealand veterinaryjournal41: 39-42.
Graczyk, T.K.; Cockrem, J.F.; Cranfield, M.R.; Darby, J.T.; Moore, P 1995. Avian malaria seroprevalencc in wild New Zealand penguins. Parasite 2: 401-405.
Gray, B. 1991. Victory for penguin preservation. Otago Daily Times, 3 0 October 1991: 21.
Gray, G.R. 1844. Birds of New Zealand. pp.1-20 I n : Richardson, J.; Gray, J.E. (ed.) 1875. The zoology ofthe voyage 4 H . M . S Erebus and Terror, under the command of Captain Sir James Clark Ross, R.N., ER.S., during the years 1839 to 1843. Ml. 1. Mammalia, birds. London, E.W Janson.
Gray, G.R. 1862. A list of the birds of New Zealand and the adjaccnt islands. Ibis 4 : 214-252.
Grccn, R.E. 1994. Diagnosing causes of bird population declines. Ibis 137: S47-S55.
Heather, B.; Robertson, H. 1996. Fieldguide to the birds $New Zealand. Auckland, Viking, Penguin Books.
Holdaway, R.N. 1989. New Zealand's pre-human avifauna and its vulnerability New Zealandjournal ofecology 12: 11-25.
Hombron, J.B.; Jacquinot, C.H. 1841. Description de plusieurs oiseaux nouveaux ou peu connus, provcnant de l'expedition autour du monde faite sur les corvettes l'ilstrolabe et IaZelie. Annales des sciences natnrelles 2. Serie. Zoologie 16: 312-320.
Hutton, F.W 1871. Catalogne ofthe birds of New Zealand with diagnoses ofthespecies. Wellington, Geological Survey of New Zcaland.
Marchant, S., Higgins, PJ. (co-ordinators) 1990. The handbook ofAustralian, New Zealand and Antarctic birds, Ml. I, ratites to ducks. Melbourne, Oxford University Press.
Millener, PR. 1990. Evolution, extinction and the subfossil record of New Zealand's avifauna. pp. 93-100 In: Gill, B.J.; Heathcr, B.D. (ed.). Aflying start: cotnmemoratingfifry years ofthe Ornithological Society o f N e w Zealand 194071990. Random Century and the Ornithological Society of New Zealand.
Moore, PJ. 1992a. Breeding biology of the yellow-eyed penguin Megadyptes antipodes on Campbcll Island. Emu 92: 157-162.
Moore, PJ. 1992b. Population estimates of ycllow-eyed penguin (Megadyptes antipodes) on Campbell and Auckland Islands 1987-90. Notornis 39: 1-15.
Moore, PJ. 1999. Foraging range of the yellow-eyed penguin Megadyptes antipodes. Marine ornithology 27: 49-58.
Moore, PJ.; Moffat, R.D. 1992. Prcdation of yellow-eyed pcnguin by Hooker's sealion. Notornis 39: 68-69.
Moore, PJ.; Wakelin, M.D. 1997. Diet of the yellow-eyed penguin Megadyptes antipodes, South Island, New Zealand, 1991 -1 993. Marine ornithology 25: 17-29.
Moore, PJ.; Wakelin, M.; Douglas, M.E.; McKinlay, B.; Nelson, D.; Murphy, B. 1995. Yellow-eyed penguin foraging study, south-eastern New Zcaland, 1991-1993. N e w Zealand Department ofComewation, Science G. Research series 83.
New Zealand Wildlife Service 1986. Yellow-eyed penguin Megadyptes antipodes. Draft species recovery plan. Dunedin, Department of Internal Affairs.
Newcombe, F. 1949. Unpubl. report, Dec. 1949, Departmcnt of Internal Affairs filc 47/49/6, New Zealand National Archives.
Newcombe, F. 1956. Unpubl. file note, Department of Internal Affairs file 47/49/6, New Zealand National Archives.
Newcombe, F. 1960. Unpubl. file note, Department ofhtcrnal Affairs file 47/49/6, New Zealand National Archives.
Nilsson, R. 1976. Unpubl. meetingminutes 5 Feb. 1976, Dept. of Internal Affairs file 33/5/24, Dunedin.
156 Moore
O'Kech, S.D. 1977. A survey of the history of distribution of the yellow-eyed penguin on Otago Peninsula. Unpubl. Diploma of Wildlife Management thesis, University of Otago, Dunedin.
Oliver, WR.B. 1930. New Zealand birds. Wellington, Fine Arts. Oliver, WR.B. 1955. N e w Zealand birds, 2nd ed. Wellington,
A.H. & A.W Reed. Peacock, L. 1995. ~nvesti~ations into climatic effects on yellow-
eyed penguins (Megadyptes antipodes). Unpubl. MSc. thesis, University of Otago, Dunedin.
Ratz, H. 1997. Ecology, identification and control of introduced mammalian predators of yellow-eyed penguin. Unpubl. PhD thesis, University of Otago, Dunedin.
Richdale, L.E. 1941. The yellow-eyed penguin (Megadyptes antipodes). The Otago Daily Times and Witness Christmas Annual, October 6, 1941.
Richdale, L.E. 1942. A comprehensive history of the behaviour of the yellow-eyed penguin (Megadyptes antipodes) Homb. and Jacqu. Unpubl. papers MS 1260/70/1,2, Hocken Library, Dunedin.
Richdale, L.E. 1947. Unpubl. letter, early Nov. 1947, Department of Internal Affairs file 47/49/6, New Zealand National Archives.
Richdale, L.E. 1949. Unpubl. letter, 24 Oct. 1949, Department of Internal Affairs file 47/49/6, New Zealand National Archives.
Richdale, L.E. 1951. Sexual behavionr in penguins. Lawrence, University of Kansas Press.
Richdale, L.E. 1953. Composition of Megadyptes colonies. Unpublished papers MS 1260/65/11, Hocken Library, Dunedin.
Richdale, L.E. 1957. A population study of penguins. Oxford, Clarendon Press.
Richdale, L.E. 1985. Yellow-eyed penguin. p.42 In: Robertson, C.J.R. (ed.) Complete book of N e w Zealand birds. Sydney, Reader's Digest.
Roberts, A. 1992. File report, 23 January 1992, Department of Conservation file BIR 0020, Stewart Island.
Seddon, PJ.; Van Heezik, YM.; Darby, J.T. 1989. Inventory of yellow-eyed penguin (Megadyptes antipodes) mainland breeding areas, South Island, New Zealand. Unpubl. report for the yellow-eyed penguin Trust and Otago Branch of the Royal Forest & Bird Society of New Zealand.
Seddon, F?; Van Heezik, Y 1989. The world's rarest penguin. Australian natural history 22(12): 597-602.
Sharpe, S. 1956. Unpubl. letter, 27 April 1956, Department of Internal Affairs file 33/5/24, held by Department of Conservation, Dunedin.
Sharpe, S. 1957. Unpubl. file note, 31 May 1957, Wildlife Service file 10/1/15, Queenstown, held by Department of Conservation, Dunedin.
Sharpe, S. 1958. Unpubl. letter, 20 Jan. 1958, Department of Internal Affairs file 47/49/2, New Zealand National Archives.
Sharpe, S. 1960. Unpubl. survey notes, Department of Internal Affairs file 33/5/24, held by Department of Conservation, Dunedin.
Sharpe, S. 1961. Unpubl. letter, 3 Nov. 1961, included in papers and survey notes held by C.J.R. Robertson, pending lodgement at Hocken Library, Dunedin.
Sharpe, S. 1966. Unpubl. letter, 20 Jan. 1966, included in papers and survey notes held by C.J.R. Robertson, pending lodgement at Hocken Library, Dunedin.
Smith, R.A. 1987. Biogeography of a rare species - the yellow- eyed penguin (Megadyptes antipodes). Unpubl. BSc.(Hons.) dissertation, University of Otago, Dunedin.
Triggs, S.; Darby, J. 1989. Genetics and conservation ofyellow- eyed penguin: an interim report. N e w Zealand Department of Conservation, Science G. Research internal report 43.
Turbott, E.G. (Convenor) 1990. Checklist ofthe birds o f N e w Zealand and the Ross Dependency, Antarctica. Random Century and Ornithological Society of New Zealand.
Van Heezik, Y 1990. Seasonal, geographical, and age-related variations in the diet ofthe yellow-eyed penguin (Megadyptes antipodes). N e w Zealand journal ofzoology 17: 201-212.
Van Heezik, Y. 1991. A comparison of yellow-eyed penguin growth rates across fifty years: Richdale revisited. Notornis 38: 117-123.
Van Heezik, Y; Davis, L. 1990. Effects of food variability on growth rates, fledging sizes and reproductive success in the yellow-eyed penguin Megadyptes antipodes. Ibis 132: 354- 365.
Warham, J. 1984. Obituary, Lancelot Eric Richdale OBE. Ibis 126: 591-594.
Wooller, R.D.; Bradley, J.S.; Croxall, J.P 1992. Long-term population studies of seabirds. Trends in ecology and evolution 7: 111-114.
Worthy, T.H. 1997. The identification of fossil Eudypter and Megadyptes bones at Marfells Beach, Marlborough, South Island. New Zealand natural sciences 23: 71-85.
Wright, A. 1970. Unpubl. report, 29 Sep. 1970, Dept. of Internal Affairs file 33/5/24, New Zealand National Archives.